Article

Effects of Land Use on the Community Structure of Aquatic Invertebrate in Subtropical Streams

by
Isabel Cristina Bohn
1,
Joaquim Olinto Branco
1,
Vivian de Mello Cionek
1,
Vinícius Soares Correa da Costa
1,
Aurea Luiza Lemes da Silva
2 and
Eduardo Augusto Werneck Ribeiro
3,*
1
Department of Environmental Science, University of Vale do Itajaí, Campus Itajaí, Rua Uruguai 458, Itajaí 88302-901, SC, Brazil
2
Department of Limnology, Federal University of Santa Catarina, Campus Florianópolis, Rua Engenheiro Agronômico Andrei Cristian Ferreira, Florianópolis 88040-900, SC, Brazil
3
Federal Institute Catarinense, Campus São Fransisco do Sul, Duque de Caxias Highway 6628, São Francisco do Sul 89240-000, SC, Brazil
*
Author to whom correspondence should be addressed.
Diversity 2024, 16(8), 497; https://doi.org/10.3390/d16080497
Submission received: 28 June 2024 / Revised: 2 August 2024 / Accepted: 9 August 2024 / Published: 14 August 2024
(This article belongs to the Section Freshwater Biodiversity)

Abstract

:
Streams constitute the water supply of the watersheds and provide the transfer of energy along the course of water, ensuring water biodiversity. Due to the different uses of the earth, the benthic community is being suppressed. The objective of this study is to investigate the effects of changes in land use on the abundance, richness, and diversity of benthic macroinvertebrates in subtropical streams, considering the physical and chemical variables of streams seasonally. In total, 144 samples were collected between February 2022 and November 2023 at 12 sites distributed in a watershed in southern Brazil, four sites for each land use. Herein, 83.520 individuals were identified, comprising 67 taxa. There was a decrease in richness along the forested–rural–urban gradient and a greater abundance in the urban environment, without the significant influence of seasonality. We conclude that the diversity of benthic macroinvertebrate in the streams is influenced not only by environmental variables but also by the spatial distribution between streams. The proximity of the streams generates a similarity in dominance. This study contributed to understanding the relationships of the environment with the benthic community and considering the spatial distribution among the streams sampled in future investigations.

1. Introduction

It is estimated that the global fluvial area comprises 485.000 to 662.000 km2, with rivers and streams covering approximately between 0.3 and 0.56% of the land surface [1,2]. The overall estimate of the area of rivers and streams implies lotic processes, especially the low-order ones, because the streams are essential to the constitution of the river network in a watershed [3,4]. Due to its longitudinal connectivity, it provides downstream transfers of energy, water, sediments, nutrients, organic matter, and organisms that guarantee the maintenance of water biodiversity [5,6,7].
Changes in land use resulting from population growth are a threat to river ecosystems around the world [7,8]. The urbanization process needs the construction of houses, an increase in agricultural areas, and water demand to meet the basic needs of the population [4,9]. Areas of forest land use, which once protected the headwaters of rivers and streams, have become deforested, resulting in a decrease in water shading, associated with increased irradiance and water temperature, as well as a lower intake of allochthone organic matter [10,11]. Due to the increase in effluent dumping and the loading of pesticides into watercourses [12,13], these changes lead to a decrease in habitat quality and, consequently, affect the diversity and richness of plants and animals, compromising the functioning of aquatic ecosystems [14,15].
Despite the advances in research in recent years, there is still a lack of information on the habitat specificity of many aquatic insects in relation to the gradient of land use change, forested–rural–urban [3,16]. Benthic macroinvertebrate communities play a key role in nitrogen (N) and phosphorus (P) cycling in streams [17], avoiding the eutrophication process [18]. Also, the diagnosis of the presence or absence of these communities can act as an indicator of the quality of the environment since the heterogeneity of the substrates provides shelter and food availability [6,19,20], in the continuous stream [21]. However, this process can be interrupted by the decrease in the diversity and/or abundance of these assemblies [17,22], considering that the multiple uses of the land alter the trophic structure of these communities [23,24].
Mitigation measures are necessary to preserve the structure of the benthic macroinvertebrates community and ensure the maintenance of functioning in the trophic chain of these ecosystems [22,25]. Quantitative data on abundance and richness can help better detect relationships between communities and the environment [26]. Efficient analyses of the taxonomic composition of aquatic insects can provide punctual information for measures and strategies of management and deliberation by the public power, with a view to the restoration of rivers and streams [27,28] and monitoring on spatial and temporal scales, which can be a support tool [14].
Considering that the streams are hydrographic in 70% of the basins and are highly vulnerable to anthropogenic disturbances [2,7,29], it is crucial to understand how changes in land use influence the functioning of these ecosystems [23,30]. In this context, the investigation of the influence of different land uses on the benthic community in the streams of the Itajaí-mirim river basin (Brazil) allowed to evaluate two main areas: (i) the composition of benthic macroinvertebrate communities present in first- and second-order streams in different seasons and (ii) local environmental variables that influence the abundance, richness, and diversity of macroinvertebrates in streams. Global patterns indicate the general structure of benthic macroinvertebrate communities in aquatic environments, while local variables are responsible for shaping their specificities [31].
Given the importance of streams in maintaining watercourses and designing the research territory responsible for the capture, treatment, and public water supply of 63% of the population of this watershed [32], we predicted the following hypotheses: (i) benthic invertebrate communities have greater abundance, richness, and taxonomic diversity on the gradient of land use of forested–rural–urban, with seasonal influence; and (ii) a cascade effect with physical and chemical changes of water, with increased temperature and nutrient concentrations along the forested–rural–urban gradient.
Based on the above hypotheses, the objective of this study is to investigate the effects of changes in land use on abundance, richness, and diversity in the structure of benthic macroinvertebrate communities throughout the seasons in the Itajaí-mirim river basin (Brazil). This line of research will serve as a reference for studies of benthic communities in streams, considering that there is no reference in the territory in question, and it will provide scientific input on future monitoring to evaluate the stressful impacts of these communities on different land uses over time.

2. Materials and Methods

2.1. Study Area

The Itajaí-mirim river basin (26°53 17.1′26″—56°05.1′48″ S, 40°57.8′48″–44° 12.4′″ W) is located in the Itajaí Valley region, Santa Catarina State—Brazil, and is part of one of the seven sub-basins that make up the Itajaí river basin, belonging to the Hydrographic Region of the South Atlantic strand. It has a drainage territory of 1677 km2, the Itajaí-mirim river being its main course, with an approximate extension of 170 km and average flows to the mouth of 71,368 L/s, the second largest flow of the territorial area [33,34]. Its headwaters originate in the Serra dos Faxinais at 1.000 m altitude, and the region is in the domains of the Atlantic Forest [35], with a temperate climate humid with a hot summer and no dry season (Cfa) in the Köppen-Geiger classification. Annual rainfall ranges from 1.600 mm to 1.800 mm, with more intense rainfall in the summer [29]. Currently, 636.525 thousand people live in this watershed, allocated to nine municipalities, which corresponds to 8.36% of the population of the State of Santa Catarina [36].
The streams that make up the Itajaí-mirim river basin drain through regions and sub-basins with different land uses [4]. In the lower and closest regions to the river, which are occupied by housing and industry, rural areas are occupied by rice cultivation and pastures. However, in steeper areas, where there is a predominance of hills, the preserved forest prevails [37]. In order to integrate the different land uses and expand the possibility of spatial distribution of benthic macroinvertebrates, 12 sub-basins were selected for this study, four streams—first and second order [38]—for each land use as follows: forested (F1–F4), rural (R1–R4), and urban (U1–U4), distributed in four municipalities in the Itajaí-mirim river basin, as described in Figure 1 and Table 1. The study criteria of the sample plan can be consulted in full in Bohn Vieira et al. [29].

2.2. Measurements of Environmental Variables

Environmental variables were measured synchronously at each site and/or transported to the laboratory. The width of the stream (Wid) was measured as the average of three transects using a tape measure, considering the wet area. The water velocity (Vel) was measured in three cross-sections in a range of three times the value of the width of the wet area through the float method [39], being considered the mean of the values. Depth (Dep) was measured as the average of three equally spaced points along the transect of 50 m using a graduated rod. Rainfall (Pluv) was established by accumulated precipitation seven days prior to collection, with data from rainfall stations a maximum of 20 km away from the sampling site.
Water pH, dissolved oxygen (DO), electrical conductivity (Cond), and water temperature (Temp) were measured using a handheld probe model Akrom—86021 on site. However, the variables total phosphorus (TP), nitrate (NO3), nitrite (NO2), and ammonium nitrogen (NH4) water samples were collected, packaged under refrigeration, forwarded for laboratory analysis for no more than 24 h, and measured according to Standard Methods [40].

2.3. Macrobenthic Invertebrate Sampling

Benthic macroinvertebrates were sampled seasonally in February and May 2022 (summer and fall) and July and November 2022 (winter and spring) in 12 sites distributed in the Itajaí-mirim river basin. A Surber sampler (opening 30 × 30 cm, mesh 250 μm) was used to collect benthic macroinvertebrates, that were stored in plastic bags, and then fixed in 70% ethanol [41].
In each site, three samples were collected along a 50 m stretch in a including ponds, backwaters, and rapids, totaling 144 samples in the studied period [27,42]. In the laboratory, the aquatic fauna was carefully washed, identified at family level in the stereomicroscope, and accounted for using identification keys [43,44]. Taxonomic sufficiency for identifying biota at the family level is justified when the aim of this study is to distinguish sites affected by human activities from those in their natural or near-natural state (different land uses) [45,46].
The following metrics/indices were calculated to evaluate the structure of benthic communities: richness (S), total abundance (N), diversity of Shannon–Weaver (H’) [47] and Simpson dominance index (D) [48].

2.4. Statistical Analysis

In order to evaluate the spatial–temporal variation patterns of the benthic community descriptors, models were applied to the data, assuming as variable responses the abundance, richness, and diversity of Shannon and Simpson (separately) and as predictor variables the seasons and categories of land use (forest, rural, and urban). All models underwent validation by inspection of residuals and assumptions, and the most appropriate analytical strategy for each data set was adopted. The spatial–temporal variation of richness was evaluated with a Variance Analysis, and Shannon and Simpson diversity indices were evaluated with generalized linear models (GLMs) with a Poisson distribution. Abundance was evaluated with generalized linear models with a negative binomial distribution.
In order to evaluate the effect of environmental variables on the benthic community descriptors, multiple regression models were applied, assuming as response variables the abundance, richness, and diversity of Shannon and Simpson (separately) and as predictive variables the limnological, physical, and spatial parameters. The environmental variables were previously submitted to a correlation test in order to identify and remove colinear variables (r > 70%). The analyses were performed with total phosphorus, water conductivity, nitrate, nitrite, depth, temperature, width, pH, water speed, dissolved oxygen, and rainfall. Considering that diversity and environmental variables are spatially structured in the landscape, Moran’s eigenvector maps (MEMs) were calculated to incorporate the spatial component in the analysis. The first MEM axis was used as a special predictor in regression analysis. The exploratory variables were all z-score standardized (mean 0, std unit) prior to the analysis. All models underwent a backward selection process, and the best model was selected according to Akaike’s criteria. For the GLM models, we calculated the deviance-based R2 as R 2 = 1 D e v i a n c e N u l l   D e v i a n c e . Then the Adjusted R2 was computed as 1 n 1 n p 1 R 2 , where p is the number of parameters in the linear predictor and n is the sample size. All analyses were performed in the software R, version 4.2.2 [49].

3. Results

3.1. Local Environmental Variations

The physical and chemical parameters of water were measured by mean values and standard deviations between the four sampling points for the same treatment (land use), as described in Table 2. The water temperature values did not show significant differences between land uses, with higher elevation in the summer season. pH and DO show decreasing values from forested to rural and urban land use gradient. The conductivity and nutrient concentrations, TP and NH4, showed increasing values from forested–rural–urban gradient. Nitrite had no variation between forested and rural streams, with an increase in the indicator for urban streams, and nitrate also showed higher concentrations in urban streams. These results express the increase in nutrient concentration and low oxygenation in the waters and may compromise the survival of aquatic biota.
The habitat physical parameters are described in Table 3. Streams in a forested environment presented the widest and shallow watercourse, while in rural and urban environments, it is narrower and deeper. The rainfall difference did not change the water velocity in both treatments. Forested streams showed water speed higher than streams in rural and urban environments, ratifying the lotic environments when compared to the others.

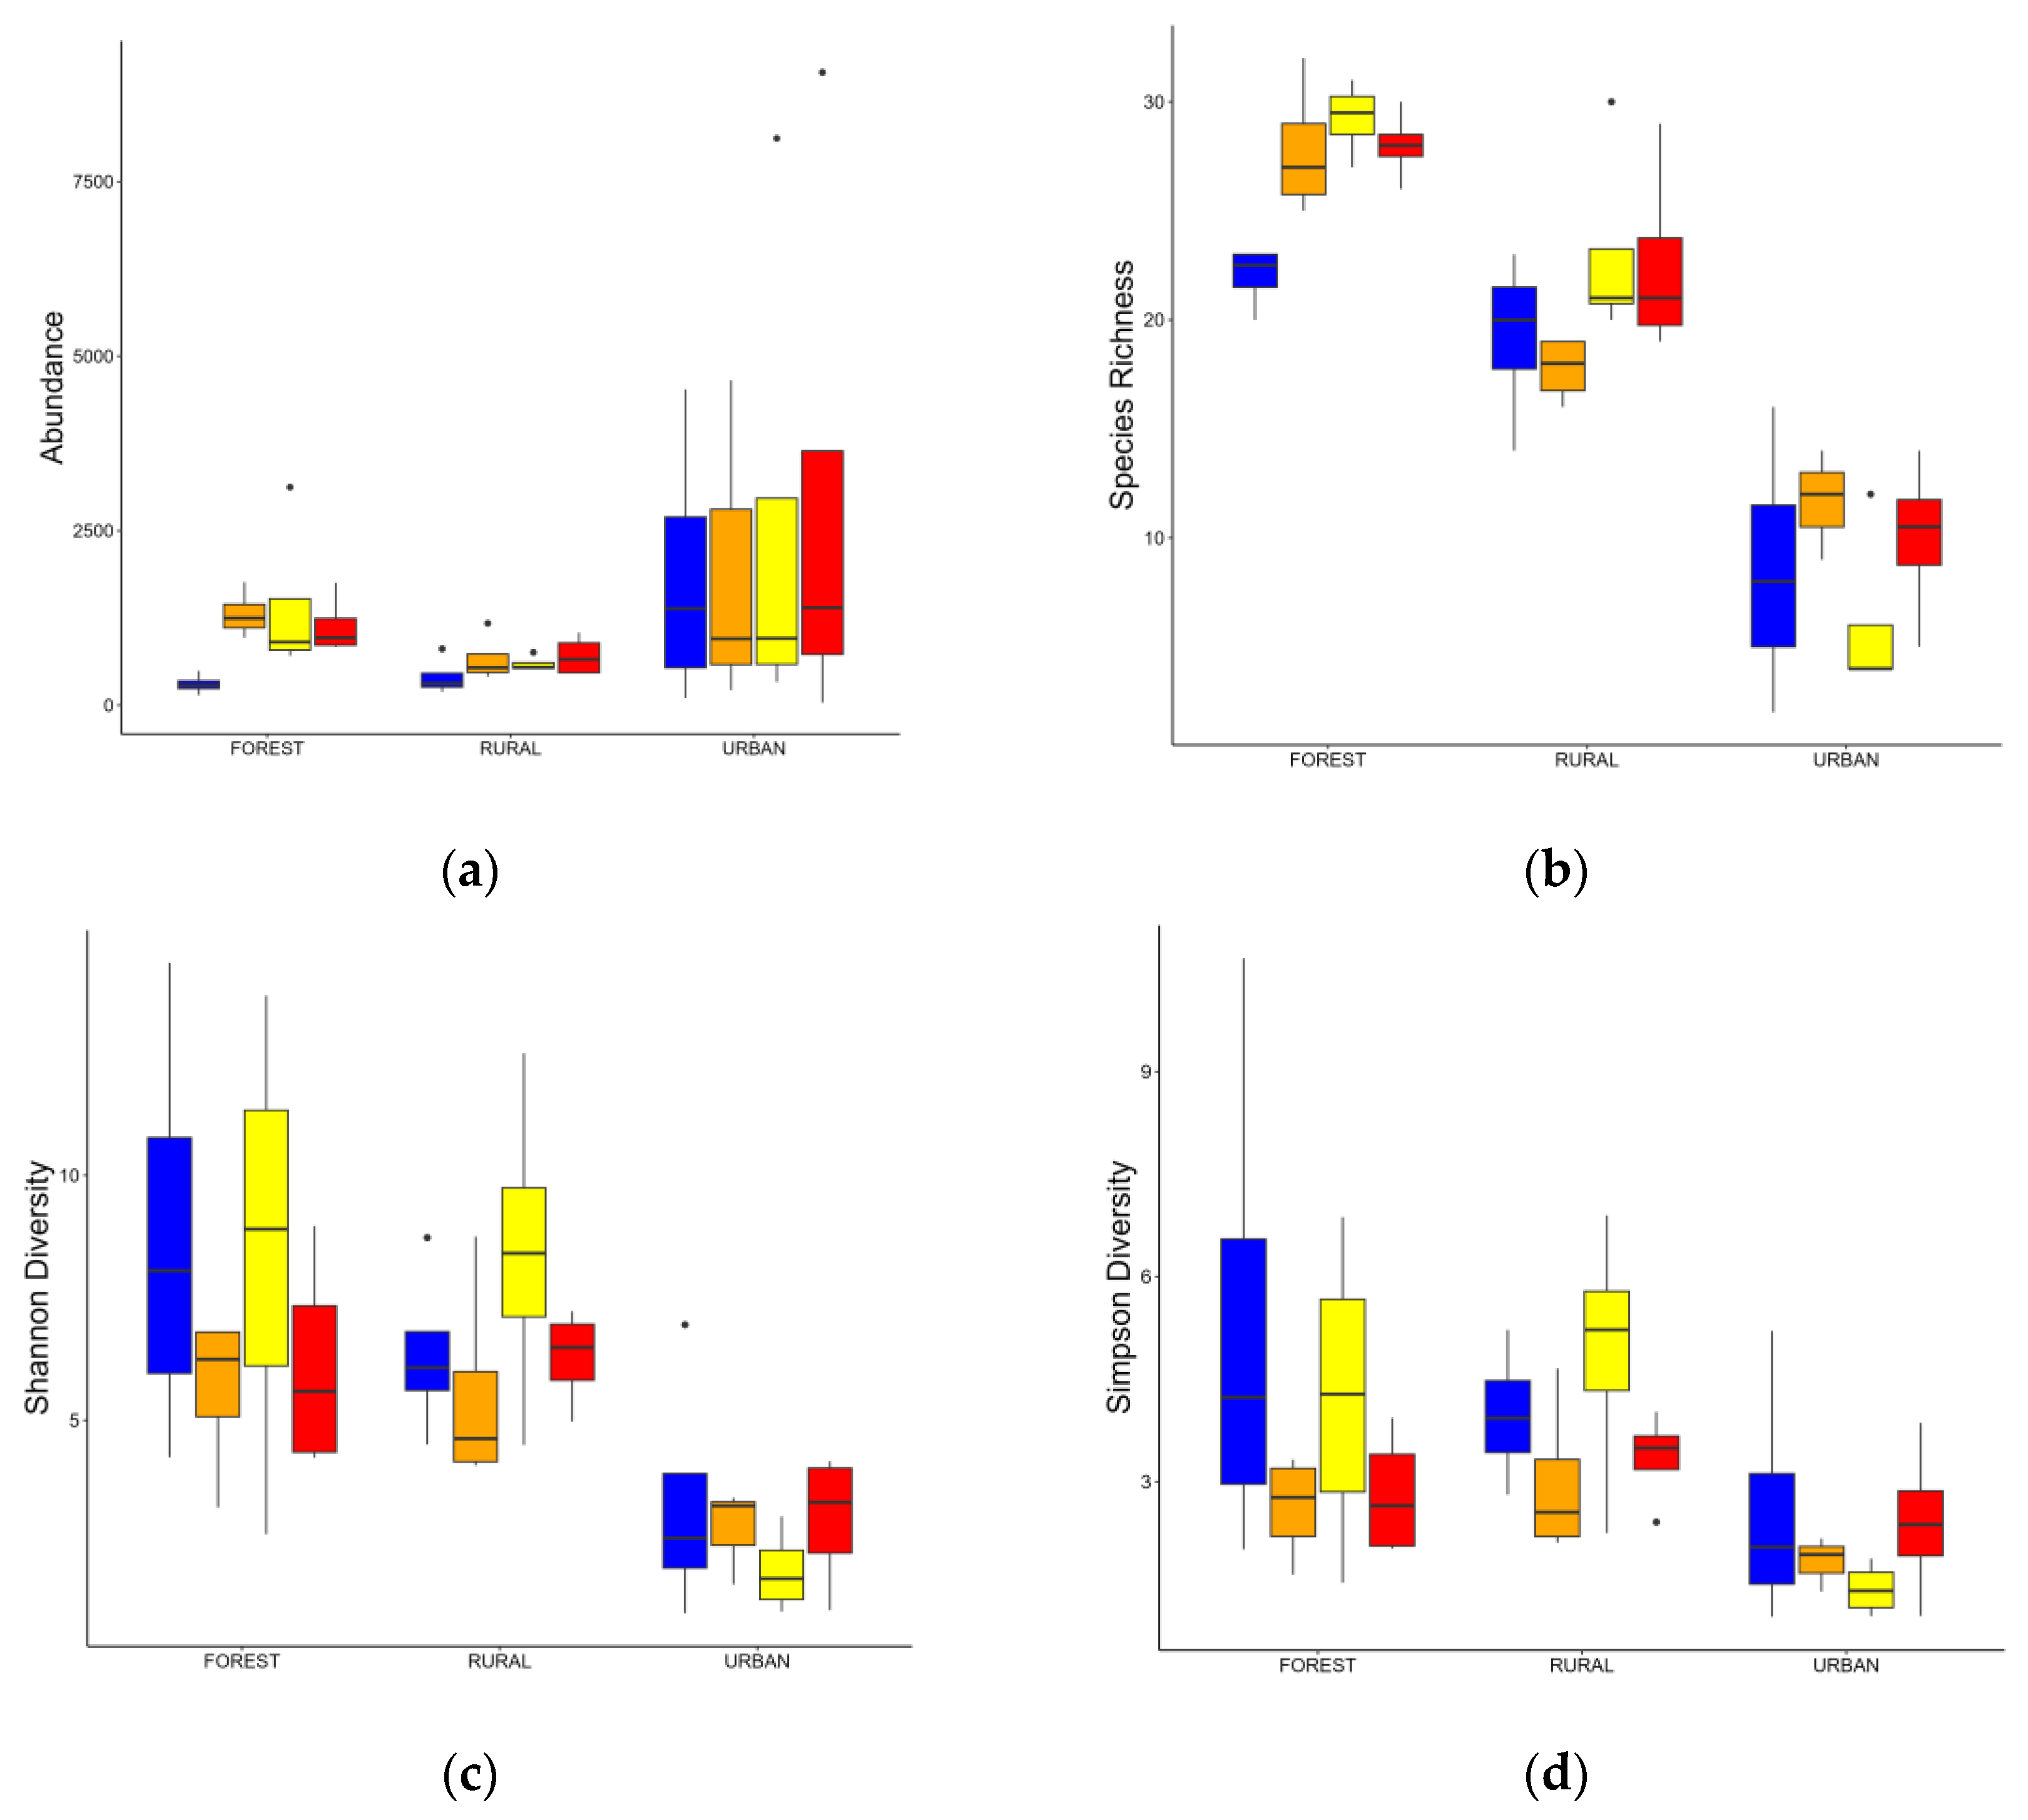
3.2. Changes in the Macroinvertebrates Community

During the entire sample period, 83.520 individuals were identified, comprising 67 taxa (Appendix A). Considering the interaction of abundance and richness with the gradient of land use and the seasons of the year, it was found that the greatest abundance occurred in the urban streams, with less difference between forested and rural streams, as described in Table 4, being the season not representative (Figure 2a). The highest richness, however, is visible in a decrease in the gradient of land use forested–rural–urban, with a significant influence of seasonality Figure 2b).
The variation of richness as a function of soil use is significant (F = 101.236; p = 8.81 × 10¹⁵), being more evident for the forested streams, in which there is a decrease in richness in the fall (22 ± 1.41), which is why the interaction between land use and season of the year is marginally significant (F = 2.375; p = 0.0497).
Regarding the Shannon diversity index, there is no significant difference among the seasons, as represented in Figure 2c. However, there is a significant difference in taxonomic diversity in relation to land use between forested and urban streams, not evidenced between forested and rural treatments, as described in Table 5. This model can be explained by the presence of 28 families, distributed in 11 orders, present in a forested environment and that are not found in the urban environment, and by the presence of only 10 families (distributed in six orders) present in the forested environment and not identified in the rural environment as follows: Blephariceridae, Crambidae, Haliplidae, Naucoriae, Calamoceratidae, Helicopsychidae, Polycentropodidae, Psychodidae, Psephenidae, and Hyalellidae.
For the Simpson diversity index, which weighs the highest value for dominant, there is also no significant difference among the seasons (Figure 2d) since the dominant taxa between the environments are the same: Chironomidae and Hirudinidae, regardless of seasonality. In relation to land uses, the difference is significant between forest and urban treatments that share 31 taxa in common in the environment, while in forested and rural streams, there is no significant difference, as evidenced in Table 6, because they share 49 taxa in common, presenting an equitable distribution of families between environments.
It should be noted that the exclusive presence of taxa was identified for each treatment of land use. There were seven families for forested streams: Calamoceratidae, Polycentropodidae, Psychodidae, Psephenidae, Blephariceridae, Crambidae, and Naucoridae; four families for rural streams: Chaoboridae, Culicidae, Osmylidae, and Pisidiidae; and three families for urban streams: Camaenidae, Hydrobiidae, and Physidae.
We recorded evidence of a greater abundance of taxa in urban environments, while there is no variation in abundance between forested and rural streams. On the other hand, richness is significantly higher in forested streams and decreases in rural streams, presenting lower values in urban streams. The same pattern was observed for diversity indices, with a less evident trend, probably reflecting the substitution of taxa.

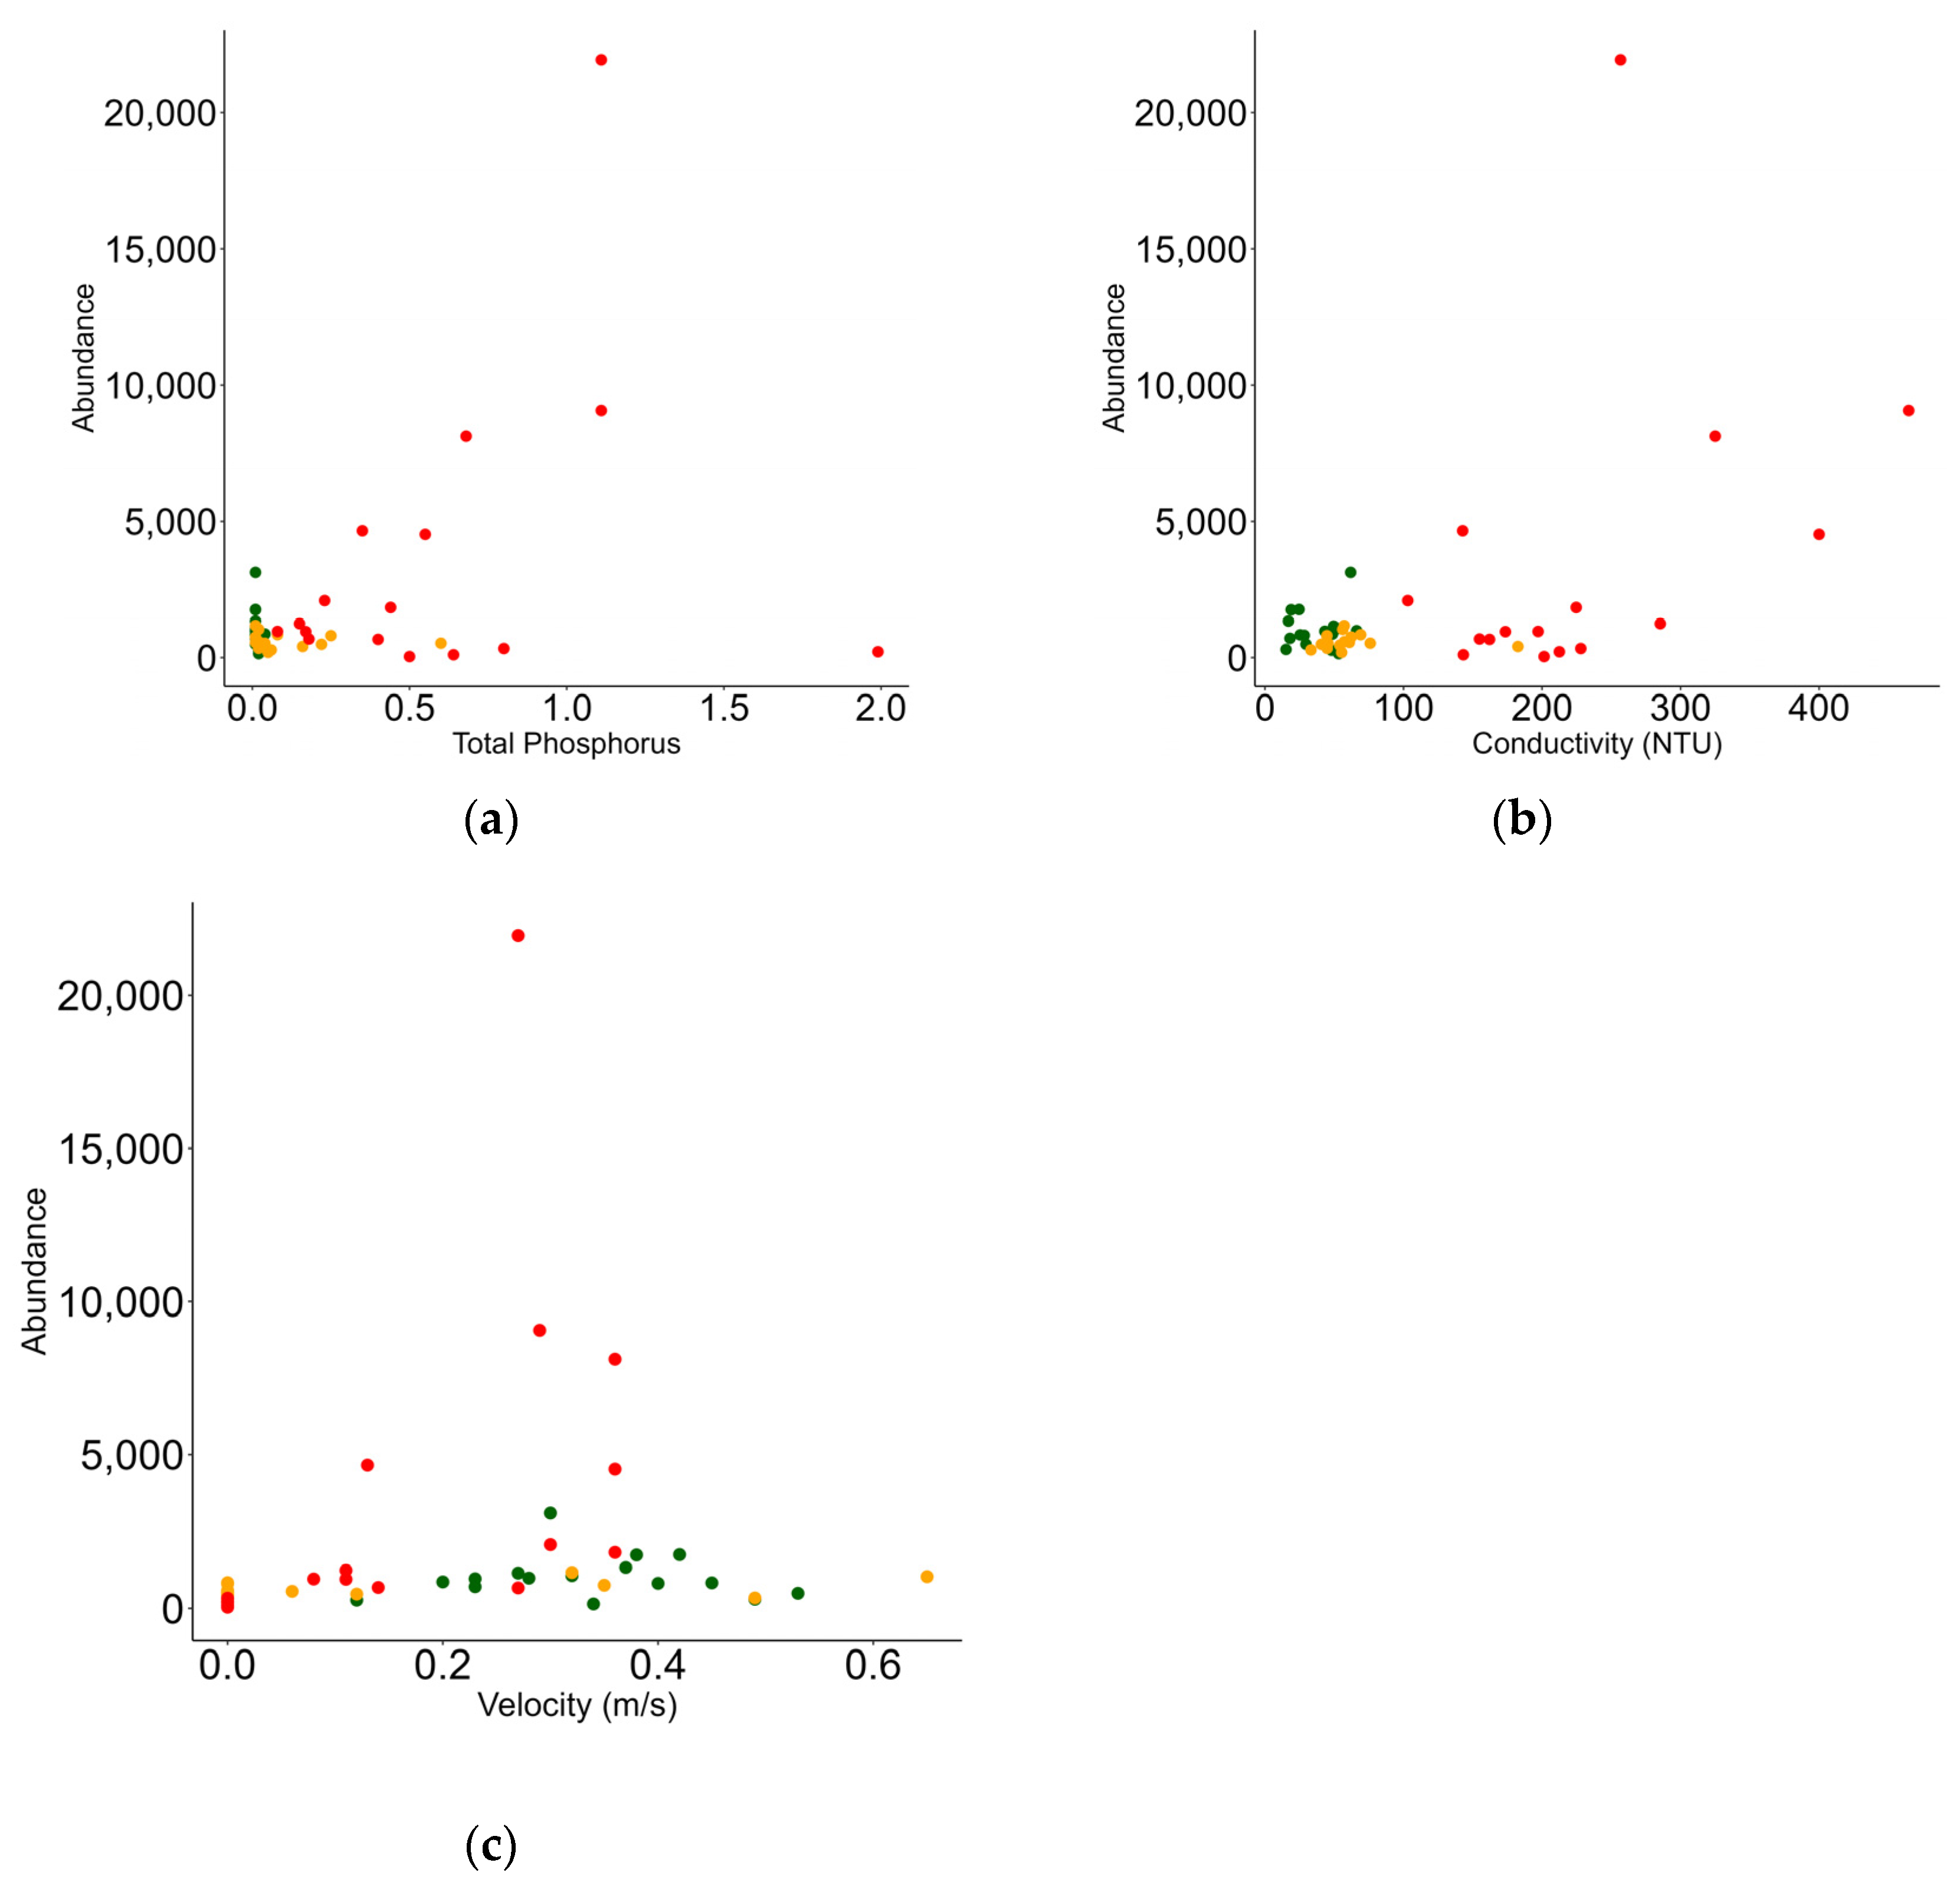
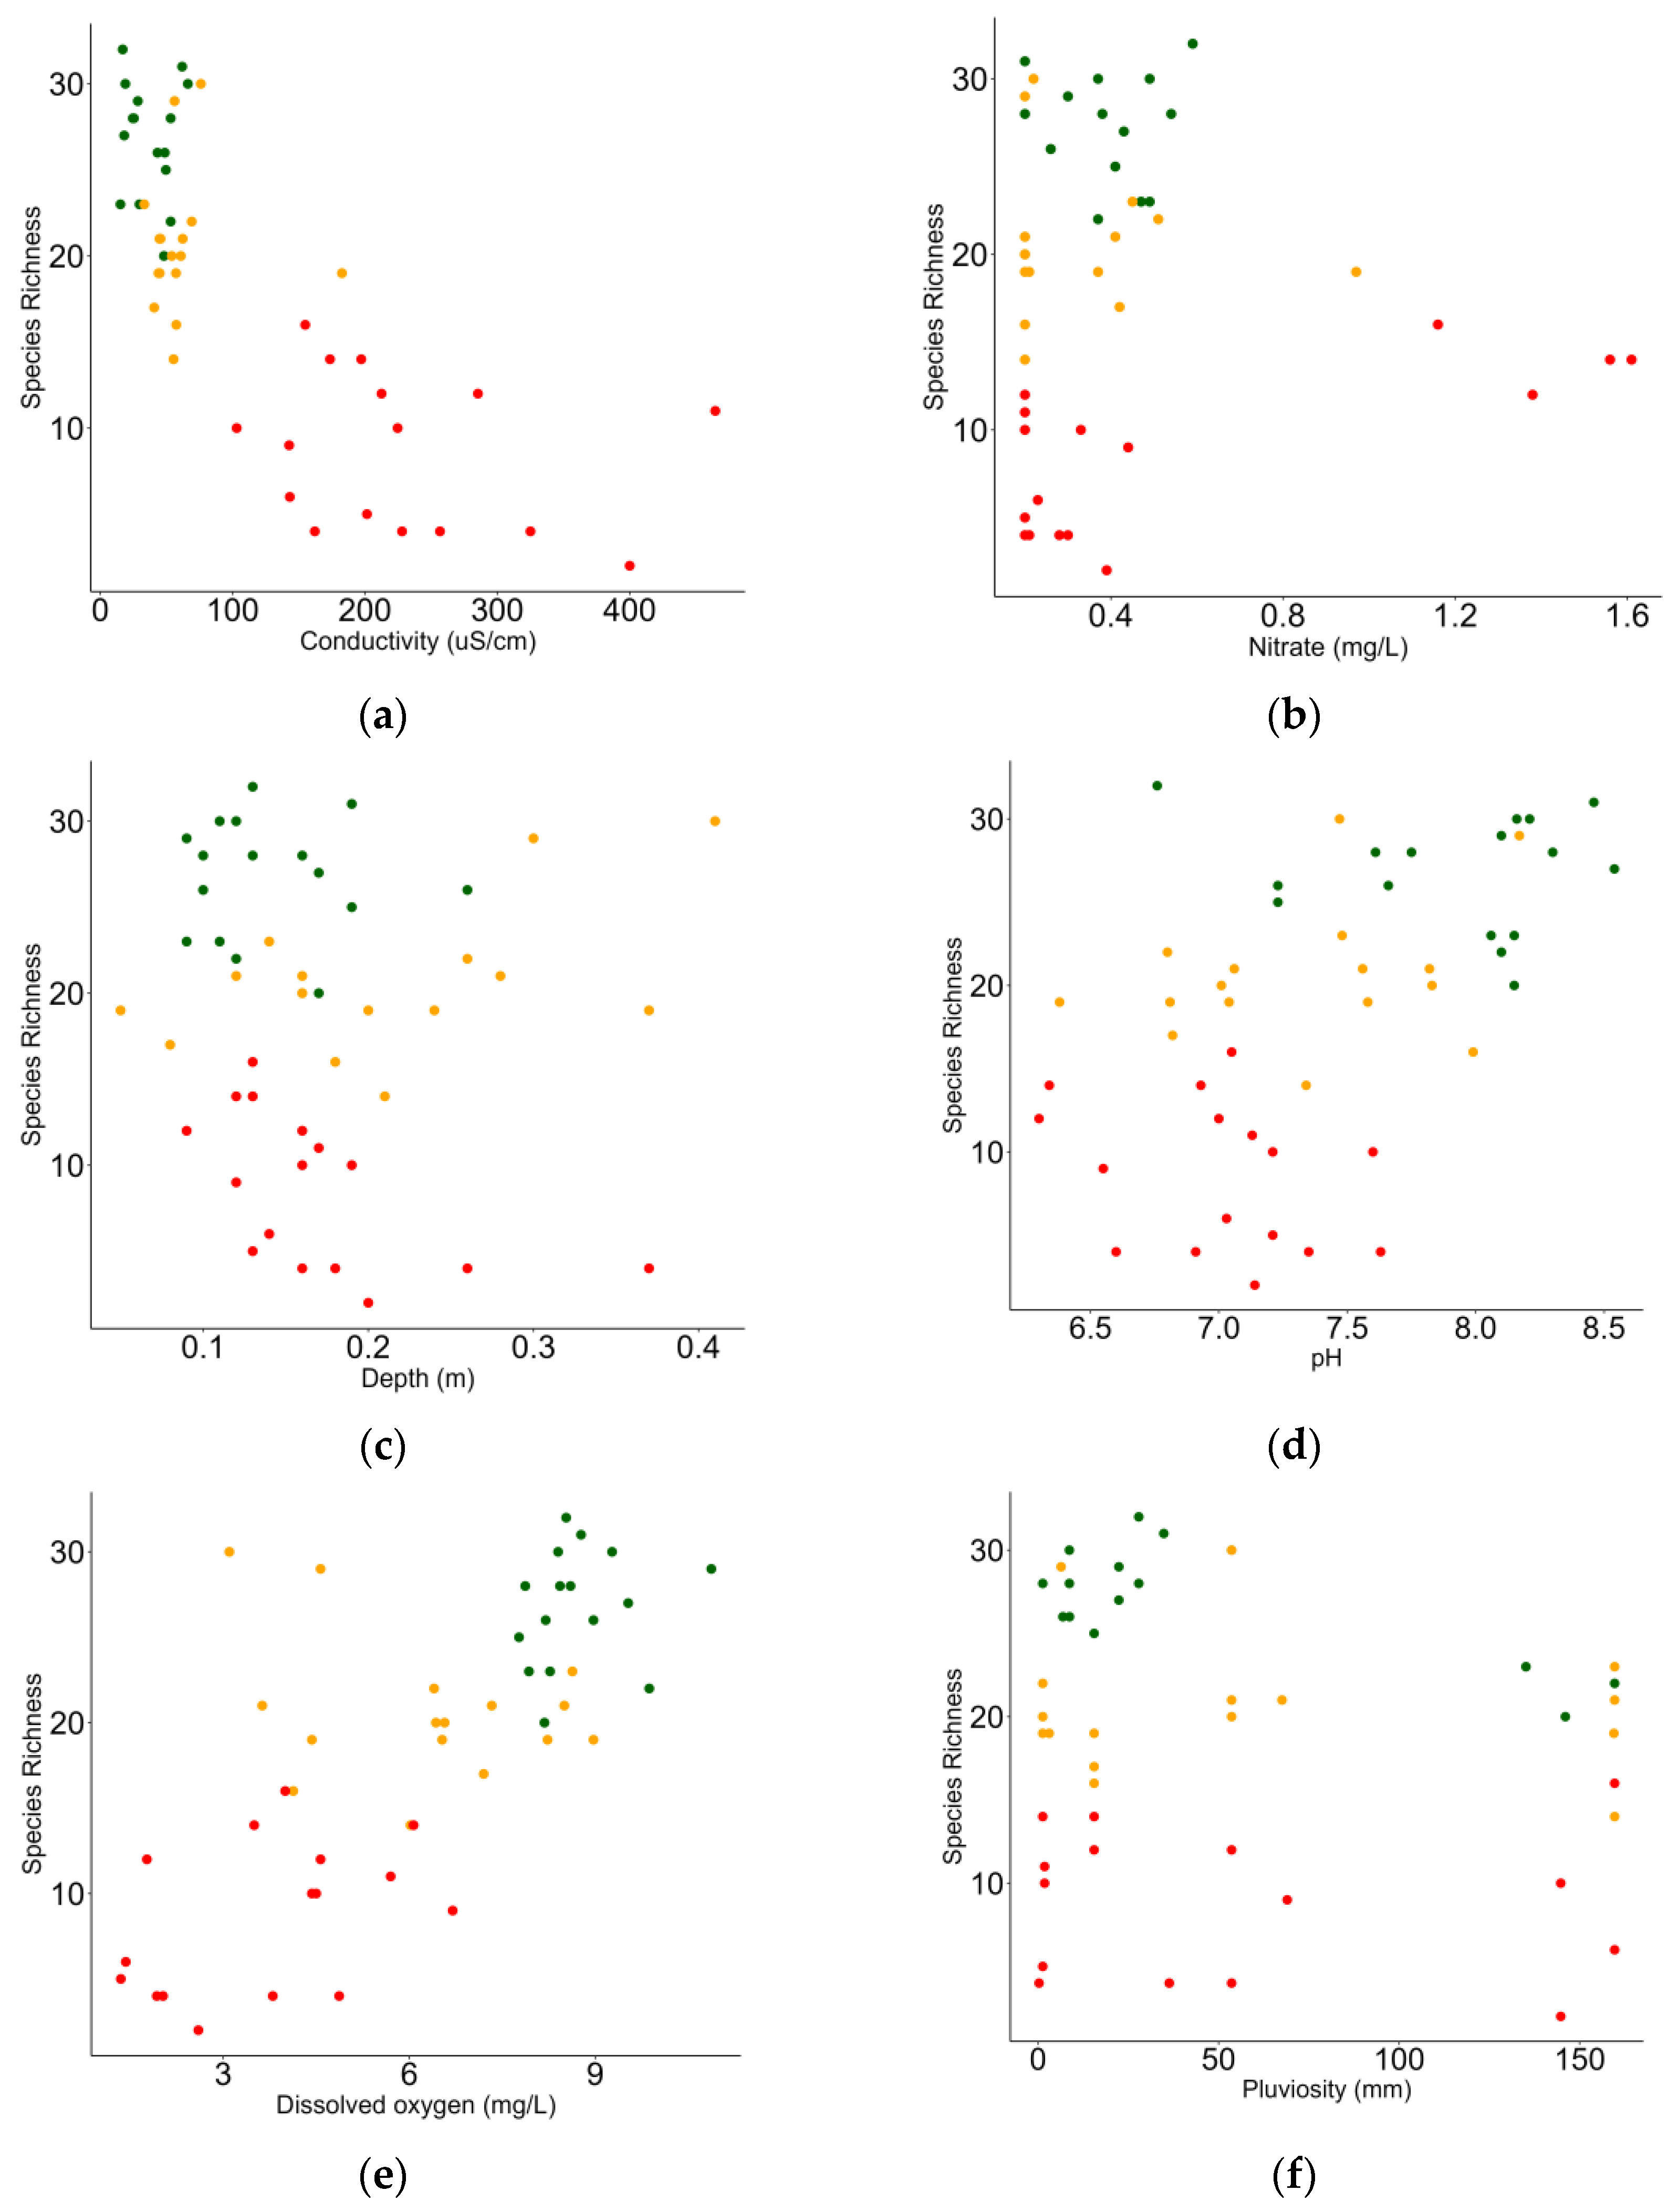
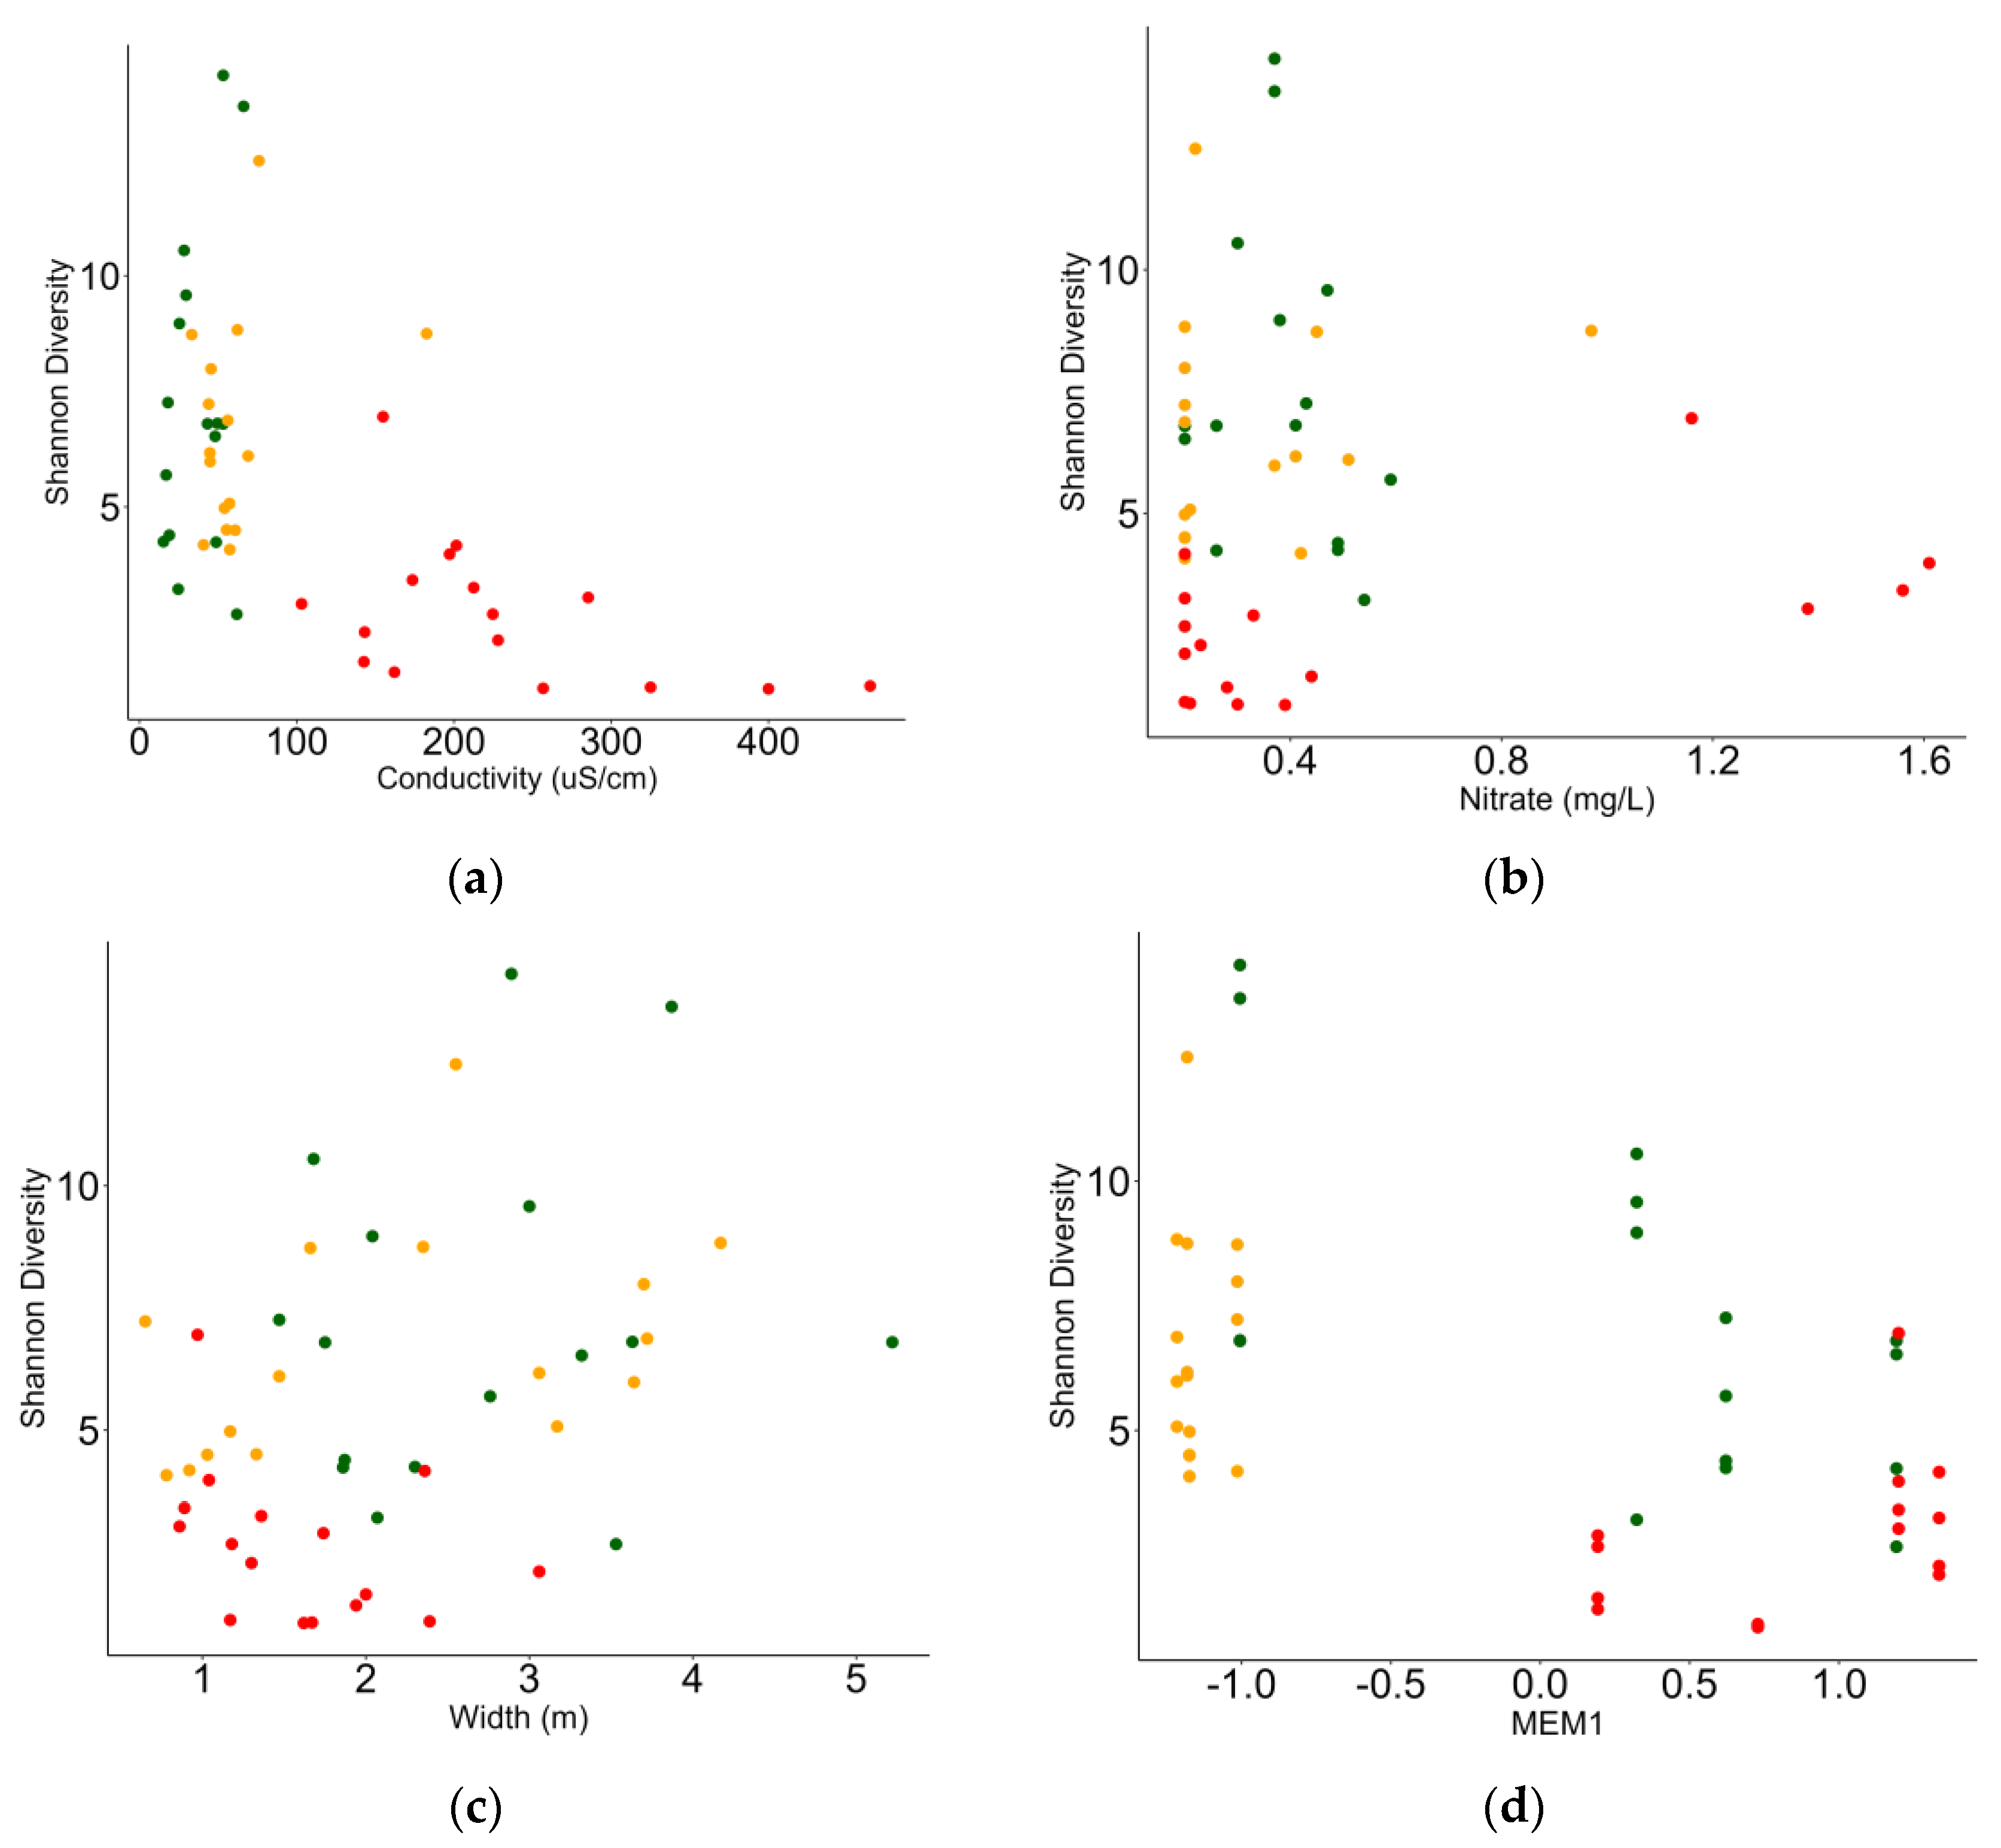
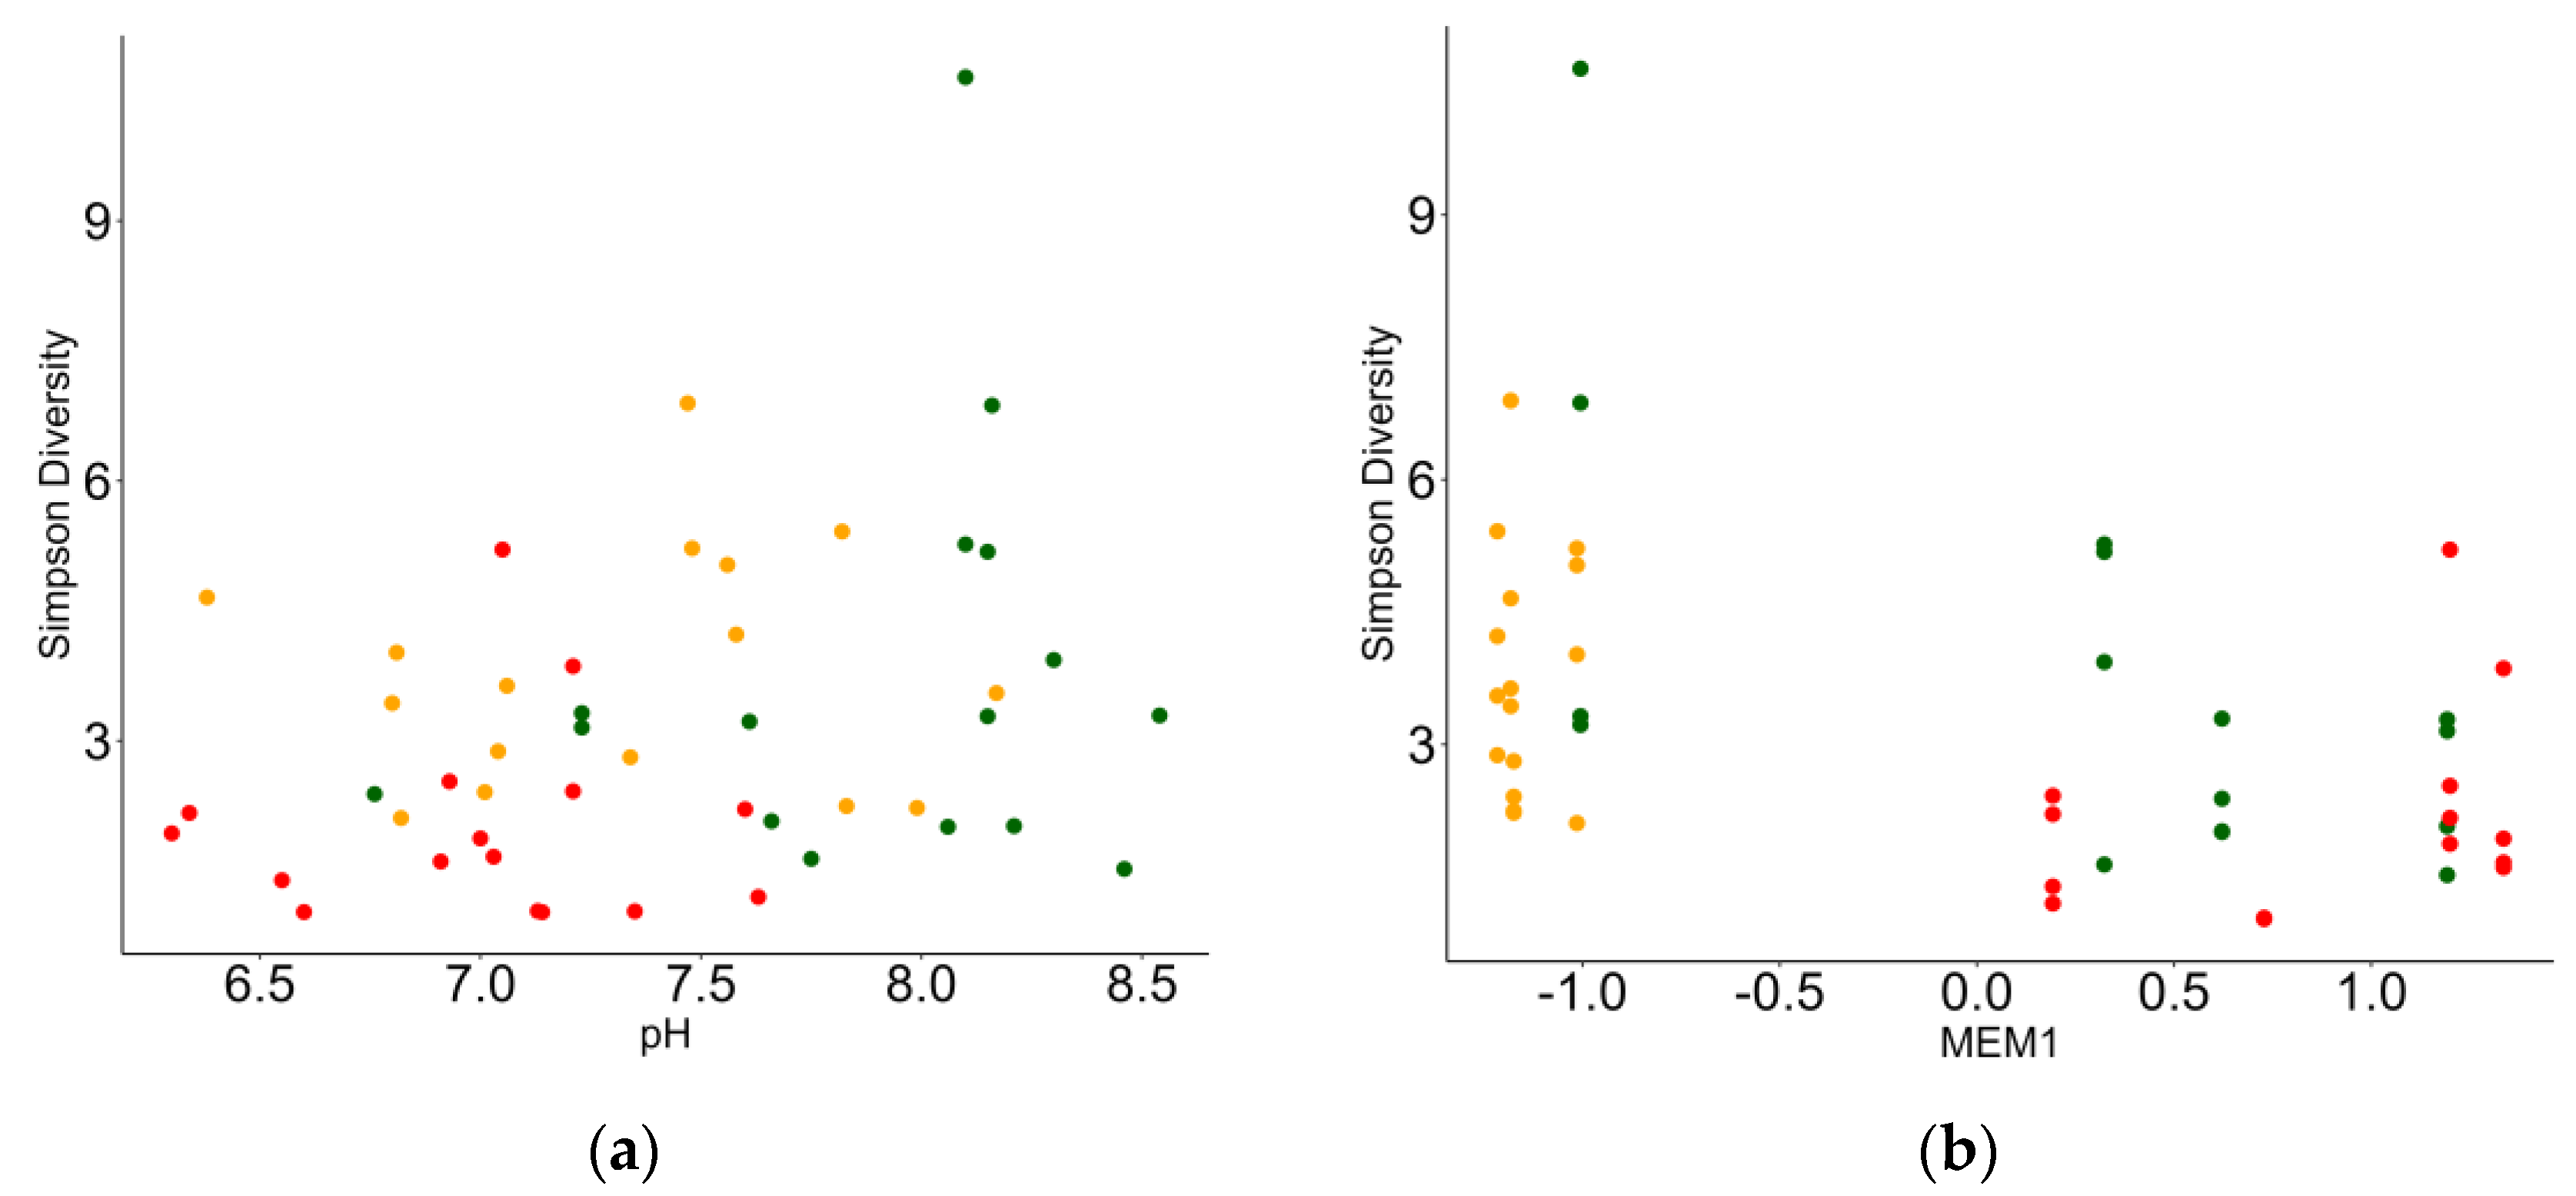
3.3. Relationship between Macrobenthic Invertebrates and Environment

The abundance of benthic macroinvertebrate species increases with the increase in phosphorus concentration and electrical conductivity in water, which is more evident in urban streams. Water velocity influence over abundance was significant, due to higher invertebrate abundance in some of the urban streams. It does not represent a direct influence because higher invertebrate abundance occurred in streams with similar water velocity; however, the removal of velocity from the model produced a worse model fit, and the best model is presented. The model with the three parameters explained 53% of the variation in invertebrates’ abundance. The data are arranged in Table 7 and Figure 3.
Family richness increases with an increase in pH and dissolved oxygen and decreases with an increase in conductivity. Depth, nitrate, and pluviosity were all significantly related to family richness; however, there is no clear association with the response variable, and these predictors should be evaluated with caution. Exploratory models without these predictors produced a worse model fitting, so they were kept. The variables used explained 74% of the variability of family richness in the streams. The data are arranged in Table 8 and Figure 4.
In total, 55% of Shannon’s diversity index variation was explained by four variables. The index increases with the increase in nitrate and the width of the stream and decreases with the increase in conductivity in the water. Streams closer to each other present similar diversity, and diversity decreases in more urbanized places and in the forested streams closest to these urbanized streams (MEM1). The model explained 55% of Shannon’s diversity response. The data are arranged in Table 9 and Figure 5.
Simpson’s index increases with the increase in pH in water. Also, streams closer to each other present similar diversity, and diversity decreases in urbanized sites and in the forested streams closest to these urbanized streams (MEM1). The model with both parameters explained 32% of the index variation. The data are arranged in Table 10 and Figure 6.

4. Discussion

The different land uses have a significant impact on the abundance, richness, and diversity of benthic macroinvertebrate communities in the streams of the Itajaí-mirim river basin. While the abundance seemed more affected by the urban nature of the streams, with a less pronounced difference between forested and rural streams, the family richness decreases as the gradient from the forested environment to the urban one. In addition, seasonality variation was only significant for richness. Comparing with data from the literature in studies of benthic communities in streams, it showed similarity to richness [3,6], but differed to the abundance [25,50]. This dissonance is due to local sampling conditions, since streams are heterogeneous environments [15] and because they have small size [10] are susceptible to changes in habitat patterns.
The change in landscape generates changes in local environmental conditions, which directly reflect on the biotic community [3,24]. The benthic macroinvertebrate community diversity responses were first used as bioindicators in the United States. It uses three components of community structure, namely, richness, evenness, and abundance, to describe the community’s response to environmental quality [51]. The removal of natural vegetation promotes increased runoff of water, promoting erosion and brooding of streams [11,20]. A fact that corroborates with the reduction in width (wet area) and depth of streams in urban and rural areas is diagnosed in this study. The need to increase agricultural and/or urban areas to meet the demands of the population [17] reduces the physical heterogeneity of the streams and the diversity of the substrate [31]. The benthic community is very sensitive to the type and composition of the substrate, and the siltation processes tend to simplify the composition of the community, favoring the dominance of a few adapted species. The increase in nutrient concentration, electrical conductivity, and decreased oxygenation in water also selects more resistant species to the stressful conditions of the environment [3,6].
It was found that taxa from the orders Ephemeroptera (E), Plecoptera (P), and Tricoptera (T), which are sensitive to environmental degradation [3,25], suffered a decrease in diversity according to land use: forested (14 families) to rural (11 families) and urban (3 families). Also, the replacement of the families Blephariceridae (Diptera), Calamoceratidae (Trichoptera), Crambidae (Lepidoptera), Polycentropodidae (Trichoptera), Naucoridae (Hemitera), and Psephenidae (Coleoptera), present in the forested environment, which settle in a lotic flow environment with high water oxygenation because they are sensitive to environmental changes [52,53], and the Hydrobiidae and Physidae families, snails found in urban environments, adapted to the stressful conditions of a lentic, hypoxic environment with a high concentration of nutrients [3,54].
Data obtained in the Shannon and Simpson diversity index followed the gradient of rural–forested–urban land use. This can be explained by the Intermediate Disturbance Theory (IDH) proposed by Connell (1978) [55]. According to the IDH theory, at intermediate levels of disturbance, as diagnosed in the streams in rural areas of this study, diversity is maximized because species that thrive in the early and late successional stages can coexist. The exclusive presence in rural land use of the families Chaoboridae, Culicidae (Diptera), predators and from environments with lentic flow [44,56]; Osmilydae (Neuroptera), also predators, but from environments with lotic flow [57]; and Pisidiidae, a filter-feeding bivalve that tolerates environments with low oxygen availability [58], confirms the coexistence of taxa with different adaptations in environments with intermediate disturbance (rural), in which they find conditions to establish themselves.
The IDH is a nonequilibrium model used to describe the relationship between disturbance and species diversity [59]. An example of this applicability to benthic macroinvertebrate communities, analogous to the one found in this research, was carried out in the Czech Republic, which shows that the restoration of previously canalized streams in a quasi-natural environment can be colonized by macroinvertebrates, successfully promoting biodiversity over time [27]. Communities that suffer disturbance in the habitat, from gradient to the forest to rural environment, have the process of delayed succession. Local changes increase the space and the possibility of the installation of biotic communities, leading to an increase in local biodiversity for a period until the climax or dynamic balance of these communities occurs in this new environment.
The dominant in the sampled streams remained consistent over time, regardless of seasonality. Rural and forested streams presented a more homogeneous distribution, sharing the presence of 33 families in common, while the comparison of forested and urban streams showed 20 families in common. This is exemplified by the constant presence of the dominant taxa Chironomidae and Hirudinidae in all land uses, followed by the Simuliidae family, as severed in other studies [3,30,31]. Although the forested and rural streams share a substantial number of taxa in common and present an equitable distribution of family between environments [23], the urban streams have a taxonomic composition with less diversity of dominant [6]. Changes in land use lead to the dominance of tolerant generalist taxa (Chironomidae and Oligochaeta) and reduce taxonomic and functional diversity in these sites [11].
Greater abundance is quite common in urban streams [30], due to the dominance of Chironomidae [22]. In the most preserved environments, we have competition between species, which tends to increase diversity and regulate the abundance that makes up the community. Studies also signaled the Chironomidae taxon overlapping the quantitative for other benthic macroinvertebrate assemblages in impacted environments [11,13].
The exclusive presence of taxa for each land use treatment presented in this study suggests that different environments in the streams house unique families [16]. Calamoceratidae (Trichoptera) depend on the presence of plant fragments, as they feed on them and build cocoons to shelter and protect themselves from predators [44,60]. The absence of this material makes it impossible for this family to remain in the environment. This pattern was observed in the gradient of richness, forested–rural–urban, which can be a reflection of the substitution of exposed families to different environmental conditions [3,24,53]. Streams in forested environments presented water velocity higher than other land uses, characteristic of lotic environments [53], with less anthropic interference, maintaining natural characteristics [25], compared to streams in impacted environments, usually with lentic and/or intermediate flow [3,30]. Even with the difference in rainfall in sampling sites, the water velocity was not affected by the different land uses in the seasons. Dissonant factor to other studies in streams [15,61]. This confirms the importance of considering habitat heterogeneity when studying biodiversity in streams [15].
We had predicted that the abundance, richness, and diversity indices would follow the gradient of forested–rural–urban land use, with seasonal influence; however, this pattern is followed only for richness. We verified that the abundance and diversity in the benthic macroinvertebrates community depend not only on environmental variables but also on the spatial component of the distribution of streams in a watershed. The shared influence of environmental components (climatic, hydromorphological, physical, and chemical) modulates macroinvertebrate communities [15]. Streams closer to each other have similarity in family composition, which may be the result of migratory processes and/or colonization by the continuous flow of water [61,62].
We also anticipate the cascade effect with an increase in nutrients in the gradient of soil use, which differed from expected in relation to the increase in water temperature, which did not observe significant differences between treatments, even presenting five sampling sites without shading (R1; R2; R4; U1 and U4) and two partially shaded (R3 and U3). This is probably due to the sampling period that occurred in the early morning, a period of lower sun irradiance in water [53], but a result contrary to other studies carried out in streams [24,30].
Finally, human occupation of the urban areas of the Itajaí-mirim river watershed had a greater impact on the richness and diversity of the benthic macroinvertebrate community. Results are diagnosed in other studies [6,25,30]. It is considered that of the nine municipalities that make up the Itajaí-mirim river basin, 1677.2 km 2 of drainage territory, only three municipalities have a sewage collection network, a tiny 174 km (Itajaí, 112 km; Ilhota, 16 km; Camboriú, 46 km) [36]. The discharge of pollutants directly into watercourses in urbanized regions is affecting the basic conditions of the integrity of ecological processes in these landscape units. It is suggested the implementation of networks for sewage treatment in the area, as well as the need to consider land use to develop conservation and management strategies to ensure biodiversity in streams.

5. Conclusions

This study generated new knowledge about ecology in subtropical streams, asserting the influence of different land uses in benthic macroinvertebrate communities, regardless of seasonality. It was possible to conclude that the spatial distribution of the streams in a watershed promotes the similarity in the composition of the benthic biota among nearby sampling units, not only the environmental variables being the factors that interfere in the process of establishing the assemblies in the environments.
Considering that the sampling occurred in first and second stream order, these should be reference sites in ecological integrity since they are the initial drainage contribution in a watershed. The water contamination was evidenced by the results of physical and chemical variables and by the dominant presence of taxa resistant to these stressful environments in all land uses. Also, surprisingly, the significant variation of rainfall did not alter the richness and diversity of benthic macroinvertebrates in the Itajaí-mirim river basin. The region is constantly affected by floods, which signals the establishment of communities before this kind of weather.
Finally, it is raised that new studies are carried out, considering that this was a pioneering study of the benthic community in the watershed of the Itajaí-mirim river and human occupation of this territory is affecting the maintenance of biota. Knowing the ecology of the streams allows us to infer, with a view to the conservation and health of the aquatic ecosystem, maintaining the biodiversity in these ecosystems.

Author Contributions

Conceptualization, I.C.B. and V.S.C.d.C.; methodology, I.C.B., V.d.M.C. and A.L.L.d.S.; software, V.d.M.C.; validation, V.d.M.C., J.O.B. and E.A.W.R.; formal analysis, I.C.B. and V.S.C.d.C.; investigation, I.C.B. and V.S.C.d.C.; resources, J.O.B. and E.A.W.R.; data curation, I.C.B., A.L.L.d.S. and V.d.M.C.; writing—original draft preparation, I.C.B. and V.S.C.d.C.; writing—review and editing, I.C.B., A.L.L.d.S. and E.A.W.R.; visualization, J.O.B.; supervision, J.O.B. and E.A.W.R.; project administration, E.A.W.R.; funding acquisition, J.O.B. All authors have read and agreed to the published version of the manuscript.

Funding

The authors I.C.B. and V.S.C.C. would like to thank the Coordination for the Improvement of Higher Education Personnel (CAPES) for granting a scholarship; process no. 88887.647803/2021-00 and no. 88887.820894/2023-00.

Institutional Review Board Statement

Not applicable.

Data Availability Statement

Data are contained within the article.

Conflicts of Interest

The authors declare no conflicts of interest.

Appendix A

Table A1. Abundance of benthic macroinvertebrate community collected in the streams of the Itajaí-mirim watershed.
TaxaForestRuralUrban
MegalopteraCorydalidae4340
OdonataAeshnidae2181
Dicteriadidae23173
Calopterigydae735817
Libellulidae153475
Gomphidae16220
Megapodagrionidae53120
Coenagrionidae630
Caenidae97140
EphemeropteraBaetidae4025720
Leptohyphidae163740
Leptophlebiidae439940
PlecopteraPerlidae236130
Gripopterygidae355250
TrichopteraHydroptilidae1241850
Hydropsychidae38715790
Philopotamidae3520
Leptoceridae1531520
Calamoceratidae19600
Lmnephilidae12200
Helicopsychidae806
Polycentropodidae1200
DipteraTipulidae1244121
Tabanidae17125
Psychodidae400
Empididae2275660
Chironomidae10.2984.53751.803
Ceratopogonidae403201356
Syrphidae310
Simuliidae366819466
Blephariceridae300
Chaoboridae0130
Culicidae090
ColeopteraHaliplidae9024
Elmidae78214747
Girinidae16261
Staphylinidae1320
Hydrophilidae520
Dytiscidae14191
Psephenidae10000
HemipteraGerridae15250
Corixidae63170
Pleidae720
Mesoveliidae63734
Belostomatidae251493
Veliidae76127
LepidopteraPyralidae35220
Crambidae600
NeuropteraOsmylidae080
HeteropteraNaucoridae1800
ArthropodaCollembola12344922
AcariHydracarina26730538
CrustaceaOstracoda193720
Macrobrachium2076
AnnelidaOligochaeta354352567
Hirudinidae29763.366
NematodaNematoda232733
BasommatophoraPlanorbidae2110268
Ancylidae10279
Physidae002
CaenogastropodaThiaridae2432249
ArchitaenioglossaAmpullariidae0539
StylommatophoraCamaenidae001
VeneroidaPisidiidae02230
Sphaeriidae135688
AmphipodaHyalellidae703
LittorinimorphaHydrobiidae0011

References

  1. Downing, J.A.; Cole, J.J.; Duarte, C.M.; Middelburg, J.J.; Melack, J.M.; Prairie, Y.T.; Kortelainen, P.; Strigegl, W.H.; Tranvik, L.J. Global abundance and size distribution of streams and rivers. Inland Waters 2012, 2, 229–236. [Google Scholar] [CrossRef]
  2. Wohl, E. The significance of small streams. Front. Earth Sci. 2017, 11, 447–456. [Google Scholar] [CrossRef]
  3. Baumgartner, S.D.; Robinson, C.T. Changes in macroinvertebrate trophic structure along a land-use gradient within a lowland stream network. Aquat. Sci. 2017, 79, 407–418. [Google Scholar] [CrossRef]
  4. Bohn Vieira, I.C.; Soares Correa da Costa, V.; de Mello Cionek, V.; Olinto Branco, J.; Werneck Ribeiro, E.A. Predileção de riachos para o monitoramento da qualidade da água: Um serviço ecossistêmico de provisão na bacia hidrográfica do rio Itajaí-Mirim (Brasil) [Predilection of streams for water quality monito ring: An ecosystem provision service in the Itajaí-mirim river basin (Brazil). Finisterra 2022, 57, 95–108. [Google Scholar] [CrossRef]
  5. Meyer, J.M.; Kaplan, L.A.; Newbold, D.; Strayer, D.L.; Woltemade, C.J.; Zedler, J.B.; Beilfuss, R.; Carpenter, Q.; Semlitsch, R.; Watzin, M.C.; et al. Where Rivers Are Born: The Scientific Imperative for Defending Small Streams and Wetlands; Sierra Club and American Rivers: Oakland, CA, USA, 2007; Available online: https://www.researchgate.net/publication/313728461_Where_Rivers_are_Born_the_Scientific_Imperative_for_Defending_Small_Streams_and_Wetlands (accessed on 15 March 2024).
  6. Bohus, A.; Gál, B.; Barta, B.; Szivák, I.; Karádi-Kovács, K.; Boda, P.; Padisák, J.; Schmera, D. Effects of urbanization-induced local alterations on the diversity and assemblage structure of macroinvertebrates in low-order streams. Hydrobiologia 2023, 850, 881–899. [Google Scholar] [CrossRef]
  7. Ferreira, V.; Albariño, R.; Larrañaga, A.; LeRoy, C.J.; Masese, F.O.; Moretti, M.S. Ecosystem services provided by small streams: An overview. Hydrobiologia 2023, 850, 2501–2535. [Google Scholar] [CrossRef]
  8. Finlay, J.C. Stream size and human influences on ecosystem production in river networks. Ecosphere 2011, 2, 1–21. [Google Scholar] [CrossRef]
  9. Palmer, M.A.; Reidy Liermann, C.A.; Nilsson, C.; Flörke, M.; Alcamo, J.; Lake, P.S.; Bond, N. Climate change and the world’s river basins: Anticipating management options. Front. Ecol. Environ. 2008, 6, 81–89. [Google Scholar] [CrossRef]
  10. Lafage, D.; Bergman, E.; Eckstein, R.L.; Österling, E.M.; Sadler, J.P.; Piccolo, J.J. Local and landscape drivers of aquatic-to terrestrial subsidies in riparian ecosystems: A worldwide meta-analysis. Ecosphere 2019, 10, e02697. [Google Scholar] [CrossRef]
  11. Lemes da Silva, A.L.; Lemes, W.P.; Andriotti, J.; Petrucio, M.M.; Feio, M.J. Recent land-use changes affect stream ecosystem processes in a subtropical island in Brazil. Austral Ecol. 2020, 45, 644–658. [Google Scholar] [CrossRef]
  12. Allan, J.D. Landscapes and riverscapes: The influence of land use on stream ecosystems. Annu. Rev. Ecol. Evol. Syst. 2004, 35, 257–284. [Google Scholar] [CrossRef]
  13. Burdon, F.J.; Munz, N.A.; Reyes, M.; Focks, A.; Joss, A.; Räsänen, K.; Altermatt, F.; Eggen, R.I.L.; Stamm, C. Agriculture versus wastewater pollution as drivers of macroinvertebrate community structure in streams. Sci. Total Environ. 2019, 659, 1256–1265. [Google Scholar] [CrossRef]
  14. Verdonschot, P.F.M.; Verdonschot, R.C.M. The role of stream restoration in enhancing ecosystem services. Hydrobiologia 2023, 850, 2537–2562. [Google Scholar] [CrossRef]
  15. Santos, J.I.; Silva, C.; Gonçalves, F.J.M.; Pereira, J.L.; Castro, B.B. Macroinvertebrate community structure and ecological status in Portuguese streams across climatic and water scarcity gradients. Hydrobiologia 2023, 850, 967–984. [Google Scholar] [CrossRef]
  16. Luiza-Andrade, A.; Silva, R.R.; Shimano, Y.; Faria, A.P.J.; Cardoso, M.N.; Brasil, L.S.; Ligeiro, R.; Martins, R.T.; Hamada, N.; Juen, L. Niche breadth and habitat preference of Ephemeroptera, Plecoptera, and Trichoptera (Insecta) in streams in the Brazilian Amazon. Hydrobiologia 2022, 849, 4287–4306. [Google Scholar] [CrossRef]
  17. Loomer, H.A.; Kidd, K.A.; Erdozain, M.; Benoy, G.A.; Chambers, P.A.; Culp, J.M. Stream macroinvertebrate community responses to an agricultural gradient alter consumer-driven nutrient dynamics. Hydrobiologia 2023, 850, 315–334. [Google Scholar] [CrossRef]
  18. Dodds, W.K.; Smith, V.H. Nitrogen, phosphorus, and eutrophication in streams. Inland Waters 2016, 6, 155–164. [Google Scholar] [CrossRef]
  19. Cummins, K.W.; Klug, M.J. Feeding ecology of stream invertebrates. Annu. Rev. Ecol. Syst. 1979, 10, 147–172. [Google Scholar] [CrossRef]
  20. Birk, S.; Bonne, W.; Borja, A.; Brucet, S.; Courrat, A.; Poikane, S.; Solimini, A.; Bund, W.; Zampoukas, N.; Hering, D. Three hundred ways to assess Europe’s surface waters: An almost complete overview of biological methods to implement the Water Framework Directive. Ecol. Indic. 2012, 18, 31–41. [Google Scholar] [CrossRef]
  21. Vannote, R.L.; Minshall, G.W.; Cummins, K.W.; Sedell, J.R.; Cushing, C.E. The river continuum concept. Can. J. Fish. Aquat. Sci. 1980, 37, 130–137. [Google Scholar] [CrossRef]
  22. Arias, M.; Bonetto, C.; Fanelli, S.L.; Scenna, L.; Miglioranza, K.S.B.; Mugni, H. Macroinvertebrate assemblages in lowland streams under horticultural impact (Buenos Aires, Argentina). Hydrobiologia 2023, 850, 399–416. [Google Scholar] [CrossRef]
  23. Iñiguez-Armijos, C.; Hampel, H.; Breuer, L. Land-use effects on structural and functional composition of benthic and leaf-associated macroinvertebrates in four Andean streams. Aquat. Ecol. 2018, 52, 77–92. [Google Scholar] [CrossRef]
  24. Scotti, A.; Füreder, L.; Marsoner, T.; Tappeiner, U.; Stawinoga, A.E.; Bottarin, R. Effects of land cover type on community structure and functional traits of alpine stream benthic macroinvertebrates. Freshw. Biol. 2020, 65, 524–539. [Google Scholar] [CrossRef]
  25. Oester, R.; dos Reis Oliveira, P.C.; Moretti, M.S.; Altermatt, F.; Bruder, A. Leaf-associated macroinvertebrate assemblage and leaf litter breakdown in headwater streams depend on local riparian vegetation. Hydrobiologia 2023, 850, 3359–3374. [Google Scholar] [CrossRef] [PubMed]
  26. Wang, L.; Li, Y.; Li, J.; Tan, L.; Rizo, E.Z.; Han, B.P. The seasonal patterns of aquatic insect composition and diversity in a disturbed (sub)tropical river revealed by linear and nonlinear approaches with occurrence and abundance data. Hydrobiologia 2023, 850, 3949–3963. [Google Scholar] [CrossRef]
  27. de Donnová, S.; Petruželová, J.; Kintrová, K.; Sorfová, V.; Polásková, V.; Straka, M.; Vrba, J.; Bojková, J. Rapid macroinvertebrate colonisation in restored channelised streams contiguous with natural stream reaches. Hydrobiologia 2022, 849, 4135–4152. [Google Scholar] [CrossRef]
  28. Martins, R.T.; Brito, J.; Dias-Silva, K.; Leal, C.G.; Leitão, R.P.; Oliveira, V.C.; Oliveira-Júnior, J.M.B.; de Paula, F.R.; Roque, F.O.; Hamada, N.; et al. Congruence and responsiveness in the taxonomic compositions of Amazonian aquatic macroinvertebrate and fish assemblages. Hydrobiologia 2022, 849, 2281–2298. [Google Scholar] [CrossRef]
  29. Bohn Vieira, I.C.; Correa da Costa, V.S.; Cionek, V.d.M.; Werneck Ribeiro, E.A.; Branco, J.O. Ecologia de riachos: Delineando planos amostrais para compreensão dos efeitos de uso da terra sobre comunidades aquáticas. Gaia Sci. 2022, 16, 33–52. [Google Scholar]
  30. Wiederkehr, F.; Wilkinson, C.L.; Zeng, Y.; Yeo, D.C.J.; Ewers, R.M.; O’Gorman, E.J. Urbanisation affects ecosystem functioning more than structure in tropical streams. Biol. Conserv. 2020, 249, 108634. [Google Scholar] [CrossRef]
  31. Gabetti, A.; Maganza, A.; Mossotto, C.; Rizzioli, B.; Esposito, G.; Bertoli, M.; Pizzul, E.; Bozzetta, E.; Prearo, M.; Pastorino, P. Macrobenthic Assemblages and the Influence of Microhabitat in a High-Mountain Lake (Northwest Italy). Diversity 2024, 16, 329. [Google Scholar] [CrossRef]
  32. Sistema de Informação de Recursos Hídricos do Estado de Santa Catarina (SIRHESC). Comitê Bacia Hidrográfica do Itajaí [Itajaí Hydrographic Basin Committee]. Available online: http://www.sirhesc.sds.sc.gov.br/sirhsc/index.jsp?idEmpresa=14 (accessed on 14 November 2023).
  33. Homechin, M., Jr.; Beaumord, A.C. Caracterização da Qualidade das Águas do Trecho Médio do Rio Itajaí-Mirim, Santa Catarina [Characterization of the Water Quality of the Middle Stretch of the Itajaí-Mirim River, Santa Catarina]. In Proceedings of the Anais do VIII Congresso de Ecologia do Brasil [VIII Brazil Ecology Congress Annals], Caxambú, Minas Gerais, Brazil, 23–28 September 2007; Available online: https://www.seb-ecologia.org.br/revistas/indexar/anais/viiiceb/pdf/1740.pdf (accessed on 20 January 2024).
  34. Comitê do Itajaí. Caderno Síntese: Para Que a Água Continue a Trazer Benefícios Para Todos Plano de Recursos Hídricos da Bacia do Itajaí [Synthesis Notebook: So that Water Continues to Bring Benefits to Everyone]. Brazil, Blumenau. 2010. Available online: https://www.aguas.sc.gov.br/index.php?option=com_k2&view=item&layout=item&id=1904&Ite%02mid=248&jsmallfib=1&dir=JSROOT/DHRI/Planos+de+Bacias/Plano+da+Bacia+Hidrografica+do+Rio+Ita%02ja%C3%AD&sort_by=name&sort_as=desc (accessed on 15 January 2024).
  35. Ab’Sáber, A.N. Os Domínios de Natureza no Brasil: Potencialidades Paisagísticas [The Domains of Nature in Brazil: Landscape Potential], 1st ed.; Ateliê Editorial: São Paulo, Brazil, 2003; p. 144. Available online: https://edisciplinas.usp.br/pluginfile.php/7993715/mod_resource/content/1/AB%20SABER-Os%20dom%C3%ADnios%20de%20natureza.pdf (accessed on 12 December 2023).
  36. Instituto Brasileiro de Geografia e Estatística. Cidades [Cities]. Available online: https://cidades.ibge.gov.br (accessed on 15 March 2024).
  37. Burliga, A.L.; Torgan, L.C.; de Nobrega, E.A.; Beaumord, A.C.; da Costa, C.O.; Yamauti, D.V. Diatomáceas Epilíticas do Rio Itajaí-Mirim, Santa Catarina, Brasil [Epilithic Diatoms from the Itajaí-Mirim River, Santa Catarina, Brazil]. Acta Sci. Biol. Sci. 2008, 27, 415–421. [Google Scholar] [CrossRef]
  38. Strahler, A.N. Quantitative Analysis of Water shed Geomorphology. Trans. Am. Geophys. Union 1957, 38, 913–920. [Google Scholar] [CrossRef]
  39. de Sousa Sobrinho, J.; Lima, M.L.; Ucker, F.E.; dos Santos, F.C.V.; Freire, C.L. Comparação entre o método do flutuador e o molinete hidrométrico para estimativa de vazões em condutos livres [Comparison between the float method and the hydrometric windlass for estimating flow rates in free conduits]. Rev. Uniaraguaia 2019, 14, 103–110. Available online: https://sipe.uniaraguaia.edu.br/index.php/REVISTAUNIARAGUAIA/article/view/591/Vol14-2-art-9 (accessed on 15 March 2024).
  40. APHA; AWWA; WEF. Standard Methods for the Examination of Water and Wastewater, 20th ed.; American Public Health Association: Washington, DC, USA, 1998. [Google Scholar]
  41. Empresa Brasileira de Pesquisa Agropecuária. Protocolo de Coleta e Preparação de Amostras de Macroinvertebrados Bentônicos em Riachos [Protocol for Collecting and Preparing Samples of Benthic Macroinvertebrates in Streams]. Comunicado Técnico. São Paulo: Jaguariúna, Brazil. 2004. Available online: https://ainfo.cnptia.embrapa.br/digital/bitstream/CNPMA/5841/1/comunicado_19.pdf (accessed on 10 February 2021).
  42. Dudgeon, D. The impacts of human disturbance on stream benthic invertebrates and their drift in North Sulawesi, Indonesia. Freshw. Biol. 2006, 51, 1710–1729. [Google Scholar] [CrossRef]
  43. Fernández, H.R.; Dominguéz, E. Guia Para Determinación de los Artropodos Bentônicos Sudamericanos [Guide for Determining South American Benthic Arthropods]; UNT: Tucumán, Argentina, 2001; 282p. [Google Scholar]
  44. Mugnai, R.; Nessimian, J.L.; Baptista, D.F. Manual de Identificação de Macroinvertebrados Aquáticos do Estado do Rio de Janeiro [Identification Manual for Aquatic Macroinvertebrates in the State of Rio de Janeiro]; Technical Books: Rio de Janeiro, Brazil, 2010; 176p. [Google Scholar]
  45. Jones, F.C. Taxonomic sufficiency: The influence of taxonomic resolution on freshwater bioassessments using benthic macroinvertebrates. Environ. Rev. 2008, 16, 45–69. [Google Scholar] [CrossRef]
  46. Kokesh, B.S.; Kidwell, S.M.; Walther, S.M. Detecting strong spatial and temporal variation in macrobenthic composition on an urban shelf using taxonomic surrogates. Mar. Ecol. Prog. Ser. 2022, 682, 13–30. [Google Scholar] [CrossRef]
  47. Shannon, C.E.; Weaver, W. The Mathematical Theory of Communication; The University of Illinois Press: Champaign, IL, USA, 1949. [Google Scholar]
  48. Simpson, E.H. Measurement of diversity. Nature 1949, 163, 688. [Google Scholar] [CrossRef]
  49. R Core Team. R: A Language and Environment for Statistical Computing; R Foundation for Statistical Computing: Vienna, Austria, 2022. [Google Scholar]
  50. Mykrä, H.; Heino, J. Decreased habitat specialization in macroinvertebrate assemblages in anthropogenically disturbed streams. Ecol. Complex. 2017, 31, 181–188. [Google Scholar] [CrossRef]
  51. Metcalfe, J. Biological water quality assessment of running waters based on macroinvertebrate communities: History and present status in Europe. Environ. Pollut. 1989, 60, 101–139. [Google Scholar] [CrossRef]
  52. Rimcheska, B.; Vidinova, Y. Diversity and structure of macroinvertebrate communities in permanent small streams and rivers in Eastern Balkans. Hydrobiologia 2023, 850, 3341–3357. [Google Scholar] [CrossRef]
  53. Masese, F.O.; Achieng, A.O.; O’Brien, G.C.; McClain, M.E. Macroinvertebrate taxa display increased fidelity to preferred biotopes among disturbed sites in a hydrologically variable tropical river. Hydrobiologia 2020, 848, 321–343. [Google Scholar] [CrossRef]
  54. Cope, N.J.; Winterbourn, M.J. Competitive interactions between two successful molluscan invaders of freshwaters: An experimental study. Aquat. Ecol. 2004, 38, 83–91. [Google Scholar] [CrossRef]
  55. Connell, J.H. Diversity in Tropical Rain Forests and Coral Reefs. Science 1978, 199, 1302–1310. [Google Scholar] [CrossRef] [PubMed]
  56. Durán-Rodríguez, O.Y.; Valencia-Espinosa, J.A.; Torres-Olvera, M.J.; Pineda-López, R.F.; Jones, R.W.; Ramírez-Herrejón, J.P. Spatial and temporal organization of aquatic insect assemblages in two subtropical river drainages. Hidrobiológica 2022, 32, 127–140. [Google Scholar] [CrossRef]
  57. Winterton, S.L.; Zhao, J.; Garzón-Orduña, I.J.; Wang, Y.; Liu, Z. The phylogeny of lance lacewings (N europtera: O smylidae). Syst. Entomol. 2017, 42, 555–574. [Google Scholar] [CrossRef]
  58. Skalskaya, I.A.; Bakanov, A.I.; Flerov, B.A. Study on zooperiphyton and zoobenthos of a small river. Inland Water Biol. 2008, 1, 84–92. [Google Scholar] [CrossRef]
  59. Wilkinson, D.M. The Disturbing History of Intermediate Disturbance. Oikos 1999, 84, 145–147. [Google Scholar] [CrossRef]
  60. Tamaris-Turizo, C.E.; Gómez Arrieta, K. Feeding preferences of Phylloicus sp. (Trichoptera: Calamoceratidae) in a Neotropical river of the Sierra Nevada de Santa Marta, Colombia. Rev. Biol. Trop. 2020, 68, 79–91. [Google Scholar] [CrossRef]
  61. Mwaijengo, G.N.; Vanschoenwinkel, B.; Dube, T.; Njau, K.N.; Brendonck, L. Seasonal variation in benthic macroinvertebrate assemblages and water quality in an Afrotropical river catchment, northeastern Tanzania. Limnologica 2020, 82, 125780. [Google Scholar] [CrossRef]
  62. Rasmussen, J.J.; McKnight, U.S.; Loinaz, M.C.; Thomsen, N.I.; Olsson, M.E.; Bjerg, P.L.; Binning, P.J.; Kronvang, B. A catchment scale evaluation of multiple stressor effects in headwater streams. Sci. Total Environ. 2013, 442, 420–431. [Google Scholar] [CrossRef]
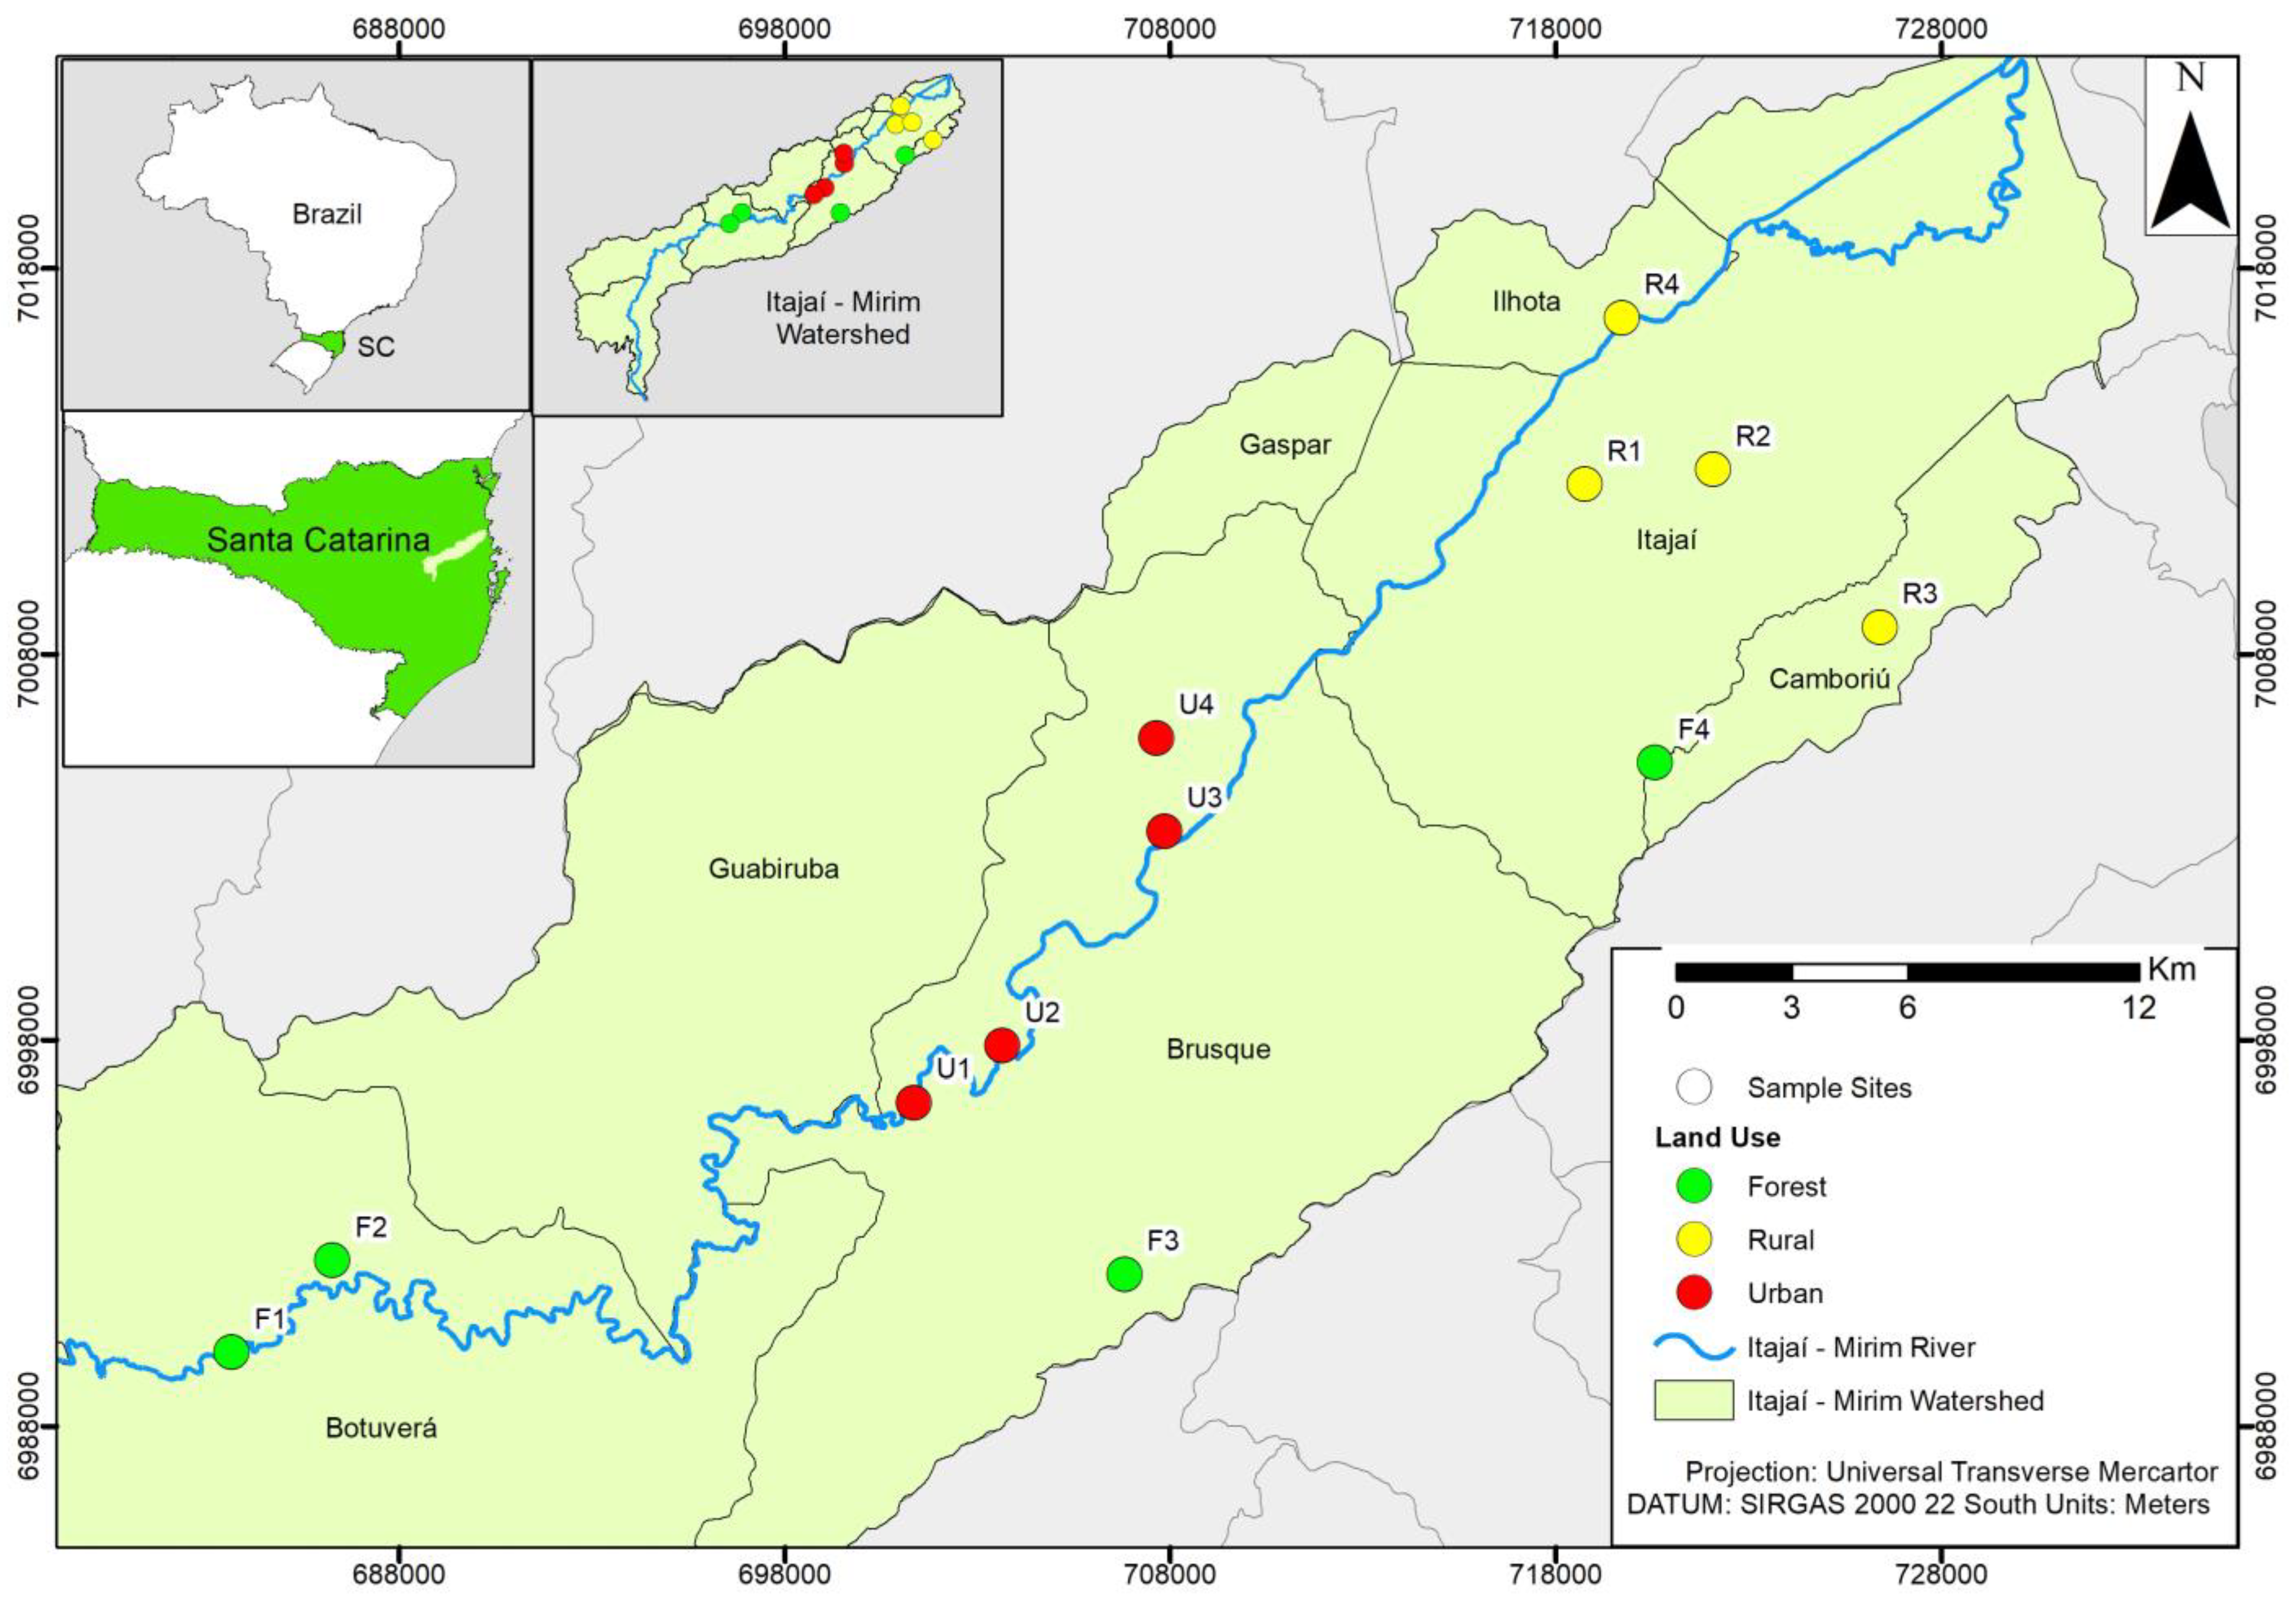
Figure 1. The Itajaí-mirim river basin and the 12 sampling sites in the study area. F1–F4 are forest land use sites; R1–R4 are rural; U1–U4 are urban.
Diversity 16 00497 g001
Figure 2. Benthic invertebrate community structure in the streams of the Itajaí-mirim river basin along the gradient from forest to rural and to urban land use: (a) abundance, (b) richness, (c) Shannon diversity, and (d) Simpson diversity. The colors represent the seasons (blue = winter; orange = autumn; yellow = spring, and red = summer).
Diversity 16 00497 g002
Figure 3. Environmental variables that significantly influence the abundance of benthic macroinvertebrates in the streams of the Itajaí-mirim river basin: (a) total phosphorous, (b) conductivity, and (c) water velocity. The colors represent land uses (green = forested, orange = rural, and red = urban).
Diversity 16 00497 g003
Figure 4. Environmental variables that influence the richness of benthic macroinvertebrate in the streams of the Itajaí-mirim river basin: (a) conductivity, (b) nitrate, (c) depth, (d) pH, (e) dissolved oxygen, and (f) pluviosity. The colors represent land uses (green = forested, orange = rural, and red = urban).
Diversity 16 00497 g004
Figure 5. Environmental variables that influence the Shannon diversity index in the benthic macroinvertebrate community in the streams of the Itajaí-mirim river basin: (a) conductivity, (b) nitrate, (c) stream width, and (d) space distance between streams (MEM1). The colors represent land uses (green = forested, orange = rural, and red = urban).
Diversity 16 00497 g005
Figure 6. Environmental variables that influence the Simpson diversity index in the benthic macroinvertebrate community in the streams of the Itajaí-mirim river basin: (a) pH and (b) spatial distance between streams. The colors represent land uses (green = forested, orange = rural, and red = urban).
Diversity 16 00497 g006
Table 1. Geographic coordinates and descriptions of the sampling sites of the streams in the Itajaí-mirim river watershed. See Figure 1 for sampling sites.
SiteLongitudeLatitudeSite Description
F 149°8′48″ O27°11′59″ SStream upstream of the basin, a shaded, lotic environment with rapids and few backwaters, near the main tributary.
F 249°07′12″ O27°10′45″ SStream upstream of the watershed, partially shaded, lotic environment with rapids and backwaters, heterogeneous substrate. Located after the waterfall, on private property.
F 348°54′45″ O27°10′47″ SStream in the intermediate region, between upstream and downstream of the main course of the river in the watershed, shaded and lotic environment, heterogeneous substrate, presence of downstream dwellings.
F 448°46′34″ O27°03′29″ SStream downstream of the basin, partially shaded, lotic environment with rapids and backwaters, heterogeneous substrate, far from the main tributary, with animal breeding in the surrounding area. Located on private property.
R 148°47′44″ O26°59′36″ SStream downstream of the basin, without shading, lentic environment, homogeneous substrate, distant from the main tributary.
R 248°46′03″ O26°58′58″ SStream downstream of the basin, without shading, lentic environment, homogeneous substrate with the presence of periphyton, near the main tributary, surrounded by rice plantations.
R 348°43′05″ O27°01′32″ SStream downstream of the basin, partially shaded, intermediate flow environment, heterogeneous substrate, located on private property, with animal breeding in the surrounding area.
R 448°47′13″ O26°57′15″ SStream downstream of the basin, without shading, intermediate flow environment, homogeneous substrate, fine. Stream partially piped (rural road), with a steep slope.
U 148°58′06″ O27°08′25″ SStream in the intermediate region, between upstream and downstream of the main course of the river, without shading, a lentic environment, and a homogeneous substrate. Water with a foul odor, the formation of supernatant oil, and pigmentation. Stream in the allotment region, with a steep slope.
U 248°56′38″ O27°07′45″ SStream in the intermediate region, between upstream and downstream of the main course of the river, shaded, with intermediate flow and heterogeneous substrate. Presence of supernatant oil in the water, surrounded by banana plantations and partially piped.
U 348°90′40″ O27°04′34″ SStream in the intermediate region, between upstream and downstream of the main course of the river, partially shaded, with intermediate flow and homogeneous substrate. Water with a foul odor, Chinonomidae larvae with red pigmentation in the flow, and the presence of direct sewage in the site.
U 448°54′23″ O27°03′15″ SStream in the intermediate region, between upstream and downstream of the main course of the river, without shading, environment and intermediate flow, homogeneous substrate, with steep slope. Water with a foul odor, pigmentation, and the presence of larvae of the Hirudinea group in the flow, with direct sewage in the site
Table 2. Mean values and standard deviation of physical and chemical water parameters by land use in the four seasons of the year in the streams of the Itajaí-mirim river.
Land UseSeasonTemp
(°C)
pH
(Unit)
DO
(mg/L−1)
Cond
(µS cm−1)
TP
(mg/L−1)
NO3
(mg/L−1)
NO2
(mg/L−1)
NH4
(mg/L−1)
ForestSummer23.11 ± 0.568.32 ± 0.219.61 ± 0.8943.62 ± 23.990.01 ± 00.33 ± 0.090.05 ± 00.11 ± 0.01
Fall17.21 ± 0.648.12 ± 0.048.56 ± 0.8836.53 ± 17.440.02 ± 00.38 ± 0.130.05 ± 00.10 ± 0
Winter16.95 ± 0.877.95 ± 0.368.60 ± 0.2636.57 ± 16.930.02 ± 00.33 ± 0.120.10 ± 00.10 ± 0
Spring16.67 ± 0.567.24 ± 0.408.09 ± 0.3433.58 ± 15.340.01 ± 00.45 ± 0.140.10 ± 00.10 ± 0
RuralSummer23.45 ± 0.507.67 ± 0.186.38 ± 2.3261.17 ± 12.470.17 ± 0.290.21 ± 0.010.05 ± 00.18 ± 0.13
Fall18.03 ± 0.267.37 ± 0.226.63 ± 2.3044.56 ± 9.040.10 ± 0.100.36 ± 0.100.05 ± 00.10 ± 0
Winter17.93 ± 0.597.20 ± 0.655.50 ± 1.3155.82 ± 10.310.04 ± 0.020.28 ± 0.150.10 ± 01.01 ± 1.38
Spring17.41 ± 0.197.06 ± 0.676.18 ± 2.3184.49 ± 65.870.10 ± 0.100.45 ± 0.360.10 ± 01.37 ± 1.82
UrbanSummer23.87 ± 0.197.22 ± 0.333.82 ± 1.27250.11 ± 70.900.51 ± 0.290.52 ± 0.570.09 ± 0.047.79 ± 2.83
Fall18.44 ± 0.327.11 ± 0.083.13 ± 1.39200.29 ± 134.970.40 ± 0.220.53 ± 0.420.23 ± 0.263.90 ± 3.09
Winter18.32 ± 0.107.22 ± 0.284.39 ± 2.14272.00 ± 129.010.53 ± 0.420.55 ± 0.700.11 ± 0.014.80 ± 4.12
Spring17.87 ± 0.426.45 ± 0.143.48 ± 2.28196.36 ± 49.310.91 ± 0.830.63 ± 0.620.12 ± 0.025.31 ± 3.37
Table 3. Mean values and standard deviation of environmental parameters of the streams of the Itajaí-mirim river by land use in the four seasons of the year.
Land UseSeasonWid
(m)
Vel
(m/s)
Dep
(m)
Pluv
(mm)
Summer2.64 ± 1.230.30 ± 0.070.14 ± 0.0433.27 ± 14.76
ForestFall2.88 ± 0.420.37 ± 0.180.12 ± 0.03144.00 ± 11.66
Winter1.88 ± 0.120.34 ± 0.100.12 ± 0.036.35 ± 3.50
Spring3.42 ± 1.360.32 ± 0.080.18 ± 0.0619.99 ± 9.52
Summer2.86 ± 1.390.10 ± 0.160.21 ± 0.1357.08 ± 6.98
RuralFall2.42 ± 1.100.12 ± 0.240.22 ± 0.05159.65 ± 0.10
Winter1.75 ± 1.350.19 ± 0.310.19 ± 0.112.54 ± 2.52
Spring1.81 ± 1.150.08 ± 0.160.21 ± 0.1212.39 ± 6.22
Summer2.06 ± 0.920.19 ± 0.160.23 ± 0.1144.96 ± 9.97
UrbanFall1.41 ± 0.340.20 ± 0.160.17 ± 0.03152.24 ± 8.61
Winter1.44 ± 0.610.18 ± 0.170.15 ± 0.021.53 ± 0.29
Spring1.48 ± 0.470.13 ± 0.110.14 ± 0.0225.06 ± 30.16
Table 4. Abundance, richness, and diversity indices (mean values ± SD) for each land use, throughout the sampling period.
AbundanceRichnessShannon (H)Simpson (D)
TreatmentMean ± SDMean ± SDMean ± SDMean ± SD
Forest1038.06 ± 514.7026.75 ± 1.964.68 ± 2.822.24 ± 1.91
Rural591.81 ± 254.9320.62 ± 3.645.45 ± 2.303.47 ± 1.80
Urban2340.16 ± 3044.18 8.56 ± 4.512.21 ± 1.772.01 ± 113
Table 5. Regression analysis of the Shannon diversity difference between streams of different land uses. Considered significant difference: p-value < 0.05.
EstimateStd. ErrorZ valuePr(>|z|)
Intercept1.9780.09221.289<0.001
Rural Use−0.0830.134−0.6240.532
Urban Use−0.9690.181−5.341<0.001
Table 6. Regression analysis of the Simpson diversity difference between streams of different land uses. Considered significant difference: p-value < 0.05.
Fixed EffectsEstimateStd. ErrorZ valuePr(>|z|)
Intercept1.3180.12910.201<0.001
Rural Use0.0150.1820.0850.931
Urban Use−0.5870.220−2.661<0.001
Table 7. Relationship between local environmental variables and family abundance of benthic macroinvertebrate. Considered significant difference: p-value < 0.05. Adjusted R2: 0.528.
Fixed EffectsEstimateStd. Errort ValuePr(>|t|)
Intercept5.8590.22825.672<0.001
TP0.9220.4252.1680.030
Cond0.0030.0012.4650.013
Vel2.6910.6773.975<0.001
Table 8. Relationship between local environmental variables and family richness of benthic macroinvertebrate. Considered significant difference: p-value < 0.05. Adjusted R2: 0.74.
Fixed EffectsEstimateStd. Errort ValuePr(>|t|)
Intercept−11.33810.450−1.0850.284
Cond−0.0400.008−5.030<0.001
NO34.6092.0192.2820.027
Dep25.4979.0492.8180.007
pH2.8781.4102.0410.047
DO1.3530.3823.5360.001
Pluv−0.0300.010−2.7660.008
Table 9. Relationship between local environmental variables and the Shannon diversity index of benthic macroinvertebrate. Considered significant difference: p-value < 0.05. Adjusted R2: 0.55.
Fixed EffectsEstimateStd. Errort ValuePr(>|t|)
Intercept1.4680.2166.778<0.001
Cond−0.003<0.001−3.726<0.001
NO30.5360.2282.3550.018
Wid0.1390.0582.3670.017
MEM1−0.1960.069−2.8420.004
Table 10. Relationship between local environmental variables and Simpson diversity index of benthic macroinvertebrate. Considered significant difference: p-value < 0.05. Adjusted R2 = 0.32.
Fixed EffectsEstimateStd. Errort ValuePr(>|t|)
Intercept−1.0201.080−0.9440.345
pH0.2870.1432.0020.045
MEM1−0.2590.083−3.097<0.001
Disclaimer/Publisher’s Note: The statements, opinions and data contained in all publications are solely those of the individual author(s) and contributor(s) and not of MDPI and/or the editor(s). MDPI and/or the editor(s) disclaim responsibility for any injury to people or property resulting from any ideas, methods, instructions or products referred to in the content.

