Abstract
This study focused on understanding biodiversity variability in response to climate change as an environmental stressor from a carbon cycle perspective. As the frequency and magnitude of environmental stresses are expected to increase due to rising carbon concentrations, these changes may affect the variability in biodiversity. However, several studies have argued that conventional methods for biodiversity assessment, primarily based on arithmetic indices utilized in national policies, are inadequate for accurately assessing these interactions among species, abiotic changes, and material cycling. Here, we indicate that environmental stressors that occur at various scales and domains, from macroscopic to microscopic, and their effects on ecosystems are multi-dimensional. Furthermore, environmental stresses not only affect organisms inhabiting these ecosystems but these organisms, in return, influence the carbon cycle through life history changes resulting from these stresses. The results of our review suggest that these processes are sequentially interconnected, forming self-reinforcing feedback loops. Ultimately, an integrated approach is necessary to understand biodiversity variability in complex and open ecosystems. This approach should be capable of comprehending changes in the overall flow by considering ecosystem characteristics.
1. Introduction
1.1. The Interconnection between Climate Change and Biodiversity
Climate change is an environmental stress that affects terrestrial, freshwater, and marine ecosystems [1,2,3]. Environmental stress refers to the factors that have unpredictable or uncontrollable effects on the structure and function of organisms and/or ecosystems at various temporal scales [4,5,6]. For instance, climate change as one of the environmental stresses can exacerbate biotic stress mechanisms (e.g., metabolic stress, etc., see [7] for more details) by increasing abiotic stresses, such as floods or extreme droughts [8,9]. Changes in environmental conditions can also lead to rapid increases in specific species, which may affect other species or ecosystem structures, including humans. Changes in plant photosynthesis rates can sequentially affect other organisms sharing the ecosystem, such as by altering plant community sizes, and instances of uncontrollable changes across entire ecosystems are increasing [10,11,12].
One of the primary causes of climate change is the increase in greenhouse gas concentrations due to anthropogenic activities [13,14]. The Intergovernmental Panel on Climate Change (IPCC) [3] estimated that global net greenhouse gas emissions in 2019 increased by 54% compared to those in 1990. Notably, CO2 from fossil fuels and industrial processes (CO2-FFI) shows the largest proportion and rate of increase in total greenhouse gas emissions.
The atmospheric CO2 concentration is closely related to changes in the temperature of the Earth. The global surface temperature for 2011–2020 increased by 1.1 °C compared to 1850–1900 [3]. The atmospheric CO2 concentration remained relatively stable, with only slight fluctuations, from approximately 280 ppm at the end of the last ice age 17,000 years ago until the start of the Industrial Revolution. However, over the past 200 years, the global atmospheric CO2 concentration has increased by more than 43%, influencing climate change through global warming [15]. In other words, an increase in the atmospheric carbon concentration may be considered the main cause of climate change [16]. This underscores the importance of properly controlling carbon flow for climate change adaptation and mitigation.
Changes in carbon flow can alter habitats and environmental conditions, thus affecting the distribution and movement of organisms and, consequently, impacting biodiversity [17,18,19,20,21]. Biodiversity refers to the volatility between organisms, which is a complex and multifaceted concept manifesting in various combinations within species and between species, ecosystems, spatial and temporal scales, and evolutionary units [22].
Furthermore, climate change can negatively affect ecosystems, leading to biodiversity loss, such as decreased species distribution or interspecies conflicts due to the introduction of specific species [23,24,25,26]. For example, the flexible response of insects to rising ambient temperatures by accelerating their development rates or increasing their reproductive potential can lead to increased generations per season or population growth rates. This can intensify herbivore pressure and potentially increase plant damage [27,28]. As such, climate-induced changes in biodiversity occur not in isolation but in a chain reaction across the entire ecosystem, emphasizing the need to comprehend the overall variability.
1.2. The Complexity of Biodiversity Variability Due to Climate Change
The variability in biodiversity resulting from climate change may be accelerated by additional effects. Alternatively, it may occur unexpectedly. Various mechanisms have contributed to this phenomenon (Table 1).

Table 1.
Summary of elements influencing biodiversity’s self-effect.
Climate change induces organism migration, resulting in diverse patterns of biodiversity variability due to habitat changes [46]. Buse et al. [33] demonstrated that as global temperatures rise, the habitat of the critically endangered Coraebus florentinus (Coleoptera: Buprestidae) may expand northward from Central Europe, potentially causing cascading damage to other species. Moreover, although organisms may migrate because of climate change, their migration speed may not correlate with the degree of warming [34], and migration may be difficult to prevent population decline [32,38].
The impacts of biodiversity loss on ecosystem functions may intensify over time. Reich et al. [29] showed this trend by analyzing the long-term cultivation results (over 13 years) of C3 and C4 grasses and nitrogen-fixing and non-fixing dicot herbs (16 species) with varying species numbers. Their findings demonstrated that the effect of plant species richness on biomass production initially appeared saturated but became stronger and more linear over time. Additionally, current species loss may have a minimal immediate effect on ecosystems, whereas the overall effects may manifest after years or decades [30].
Conversely, although rising temperatures may immediately reduce numbers of individuals in lizards (i.e., ectotherms), population size might possibly increase in the long term due to extended breeding periods [31]. This demonstrates that temperature increases may negatively impact biodiversity but could benefit some species in the long run, making biodiversity variability predictions challenging.
Furthermore, species-level biodiversity variability may have cascading effects on entire ecosystems through population changes [45], thus exacerbating these difficulties. For instance, pollinator loss affects global crop and plant production [43,44], and it may affect organic carbon quantities in ecosystems with low nutrient levels, causing overall changes [42]. Climate change can also induce short-term genetic changes [39]. These complexities highlight the uncertainties and limitations of the existing biodiversity assessment methods that focus primarily on quantitative changes (Table 2).
Table 2.
Various biodiversity assessment indicators.
To address these issues, biodiversity should be evaluated by considering the variations in biological responses to environmental changes, such as climate, in the following ways:
- A comprehensive and multidimensional approach is crucial to examine the complexity of biodiversity. Biodiversity is defined at the genetic, species, and ecosystem levels according to the Convention on Biological Diversity (CBD). While each aspect of biodiversity requires unique assessment indicators, the need to treat biodiversity as a multidimensional structure has been consistently emphasized [59,60,61].
- Relying solely on species diversity, the most widely used indicator, has limitations in directly analyzing environmental stress impacts [62,63,64]. Species diversity does not consistently respond to environmental stress and may increase or decrease when exposed to it. Species-focused assessments may equate communities with few species and high uniformity to those with many species and low uniformity. Additionally, species-rich areas may not be aligned with the habitats of rare or endangered species [65,66,67,68]. Species richness (the number of species in an area) is commonly used when considering multiple species. However, this approach still struggles to resolve issues, such as discrepancies between specific taxonomic groups and functional types [69]. Moreover, species diversity often uses both species richness and evenness. However, the potential inverse relationship between these metrics has led to criticism of composite indices that include both, deeming them potentially inaccurate [70,71]. For instance, communities A and B may have identical Shannon indices for species diversity despite differing richness and evenness. Because of these characteristics, although species diversity can be used to gauge taxonomic richness, ecosystem status, or trends, it may be inadequate for comprehensive biodiversity analysis. This limitation also applies to genetic diversity measurements.
- In open ecosystems, it is crucial to understand changes in biodiversity across time and space [72,73,74,75,76,77]. Continuous carbon emissions from anthropogenic activities have led to increased levels of climate change and greater biodiversity loss [78,79]. Consequently, this has led to a further increase in carbon emissions. This phenomenon represents a self-reinforcing feedback loop that intensifies climate change [12,20]. To understand the flow of materials entering and leaving such an open system, it is necessary not only to predict the exact proportions of each species’ abundance at specific locations and points but also to assess how the relative ratios of rare to common species change [72,80]. This approach may be more conducive to detecting biodiversity changes induced by environmental stress rather than typical methods that measure absolute species quantities.
- Understanding biodiversity from an ecosystem function perspective has become increasingly important as global ecosystems change rapidly due to climate change [81,82]. Although a unified definition of ecosystem function has not yet been established, it may be broadly categorized into two aspects based on its characteristics—patterns and processes. From a pattern perspective, functional traits are considered differences between populations or species independent of time. This approach is commonly used in big data analyses. In contrast, the process aspect considers time as a factor. This includes the phenomena through which communities modify carbon cycling through interactions with the environment. From this perspective, ecosystem function is defined as the transfer or storage of energy or matter from the cellular to the global level [83]. This definition was adopted in the present study. Reconstructing the functional changes in ecosystems over time can aid in predicting the implications of future changes.
1.3. A New Approach to Biodiversity
A new perspective based on the interaction between material cycling and environmental stress is necessary when assessing biodiversity variability. The loss of biodiversity due to climate change may lead to a decrease in ecosystems’ climate resilience, potentially accelerating the effects of climate change [3,84]. However, the existing biodiversity assessment indicators are limited in their ability to provide meaningful information for decisions aimed at strengthening ecological completeness and mitigating climate change. Despite the urgency of addressing climate change and preventing biodiversity loss, one of the causes of insufficient measures is either the absence of or insufficient application of a material cycling perspective in dealing with these issues.
Although there is a positive correlation between carbon storage and biodiversity [85,86], the association between carbon storage and species richness theoretically varies with scale. However, existing studies have focused on several species-based measurements of biodiversity and above-ground carbon, and considering only species richness at a local level may overlook individual species with high conservation needs [12,85,87,88]. The possibility of biodiversity assessment related to carbon cycling is due to ongoing re-search quantifying the role of individual species in carbon cycling. Furthermore, the range of individual species playing a role in carbon cycling is gradually expanding. However, there are still aspects that need to be improved.
The existing biodiversity assessment indicators are limited in their ability to provide meaningful information for decisions aimed at achieving the dual goals of strengthening ecological completeness and mitigating climate change. This review, therefore, explored the possibility of biodiversity assessments by considering material cycling as a solution to these issues. Of course, previous studies [89,90] have made conceptual attempts. However, our paper elaborates on and finalizes these attempts. In particular, it focuses on understanding the interdependent relationship between global biodiversity variability and greenhouse gas changes and provides a framework that can recognize changes in the overall ecosystem flow that is not limited to fragmented assessments of species or habitats. Note that according to existing studies [91,92] not all assessments are fragmented.
2. Material Cycling and Environmental Stress
2.1. Carbon Flow and Climate Change as Environmental Stress
Carbon flow allows us to understand the circulatory structure of organisms. Materials circulate within ecosystems, forming an interconnected “loop”. Among the substances circulating in and forming this loop, carbon (C) is essential for all organisms. It is crucial for the formation of a wide range of biological compounds, such as proteins, lipids, and carbohydrates, that are necessary for survival, growth, and reproduction. Terrestrial ecosystem organisms play a role in regulating the distribution of carbon (i.e., producer substructure) and emissions (i.e., decomposer substructure) in ecosystems [86,93,94]. Based on these characteristics, it is possible to identify the circulatory structure of organisms on Earth through carbon flow, assuming that carbon absorption or allocation in ecosystems is controlled by (i) microbial mineralization of organic matter, (ii) weathering of geological parent material, and (iii) nutrients and water determined by the climate and hydrology [95,96].
Carbon moves between the soil and the atmosphere according to the biomass distribution in the food chain of organisms. Microorganisms, plants, and animals tend to seek and consume resources that are most similar to their homeostatic carbon–nitrogen (i.e., C:N) and carbon–phosphorus (i.e., C:P) ratios [97,98]. Through this process, carbon is either stored or released into the atmosphere. This demonstrates that the classical ecological nutrient structure of the “plant-herbivore-carnivore-decomposer” linear food chain is connected to the carbon cycle [99,100,101,102]. Food chains are maps representing the nutritional interactions between species and generally include both species networks and energy connections between species. These characteristics are suitable for understanding the ecological role of organisms in the environment and the structure in which biodiversity affects ecosystem function [103,104,105].
Traditionally, in carbon modeling or accounting (quantifying carbon storage and flow in a transparent and verifiable manner), only plants, microorganisms, invertebrates, and decomposers are considered relevant to the carbon cycle. However, recent experimental results that directly measured ecosystem carbon storage and exchange with the atmosphere indicate that wildlife cannot be ignored [99,106,107,108].
As research on the role of wildlife in the carbon cycle advances, more species are identified as important contributors. According to Schmitz et al. [106], wildlife alters the solar radiation flux and temperature reaching the soil surface via locomotion while also influencing organic carbon input to the soil. They also play a role in the carbon cycle through direct and indirect interactions with primary consumers in the food chain. Herbivores alter the spatial distribution of plant biomass through various activities, such as terrestrial locomotion and arboreal exploration. Changes in herbivore movement due to predator predation also alter the carbon cycle. Some act for long-term storage after death and store carbon in their bodies during decomposition [102,109].
Wildlife plays a role in the carbon cycle not only in terrestrial ecosystems but also in marine ecosystems. According to Martin et al. [110], marine vertebrates function as carbon reservoirs or contribute to carbon flow through their movement. They also play a role in fixing, storing, and sequestering carbon through trophic interactions by physically altering habitats and controlling prey populations. Furthermore, Rodil et al. [111] analyzed 25 seagrass meadow areas (11 sites) on the southern coast of the Hanko Peninsula in Finland and found that macrofauna had an average impact of 38.7% on seagrass organic carbon metabolism (respiration or primary production). The results demonstrated that macrofauna affected not only the production of blue carbon but also its turnover rate.
Climate change, as environmental stress, causes changes in weather conditions, precipitation patterns, plant fruit/flower blooming, and soil conditions that affect plant growth, which occurs through the material cycling process of carbon. These changes can cause metabolic stress in both animals and plants. For example, when atmospheric carbon concentration increases, plant photosynthesis increases through CO2-unsaturated RuBisCO activity. RuBisCO photorespiration and NADPH oxidase (NOX) activity can increase the production of reactive oxygen species (ROS) in plants [112,113,114]. The most significant impact of climate change as an environmental stress factor is an increase in oxidative stress due to an increase in intracellular ROS concentration [112,115]. Increased ROS in plants can trigger chain reactions in neighboring cells [116,117] and may affect carbon flow in vertebrates, such as herbivores and predators at the top of the food chain [118].
ROS increase in the body due to climate change can be beneficial, but excessive levels may be harmful to the organism. Therefore, proper regulation is necessary (see Appendix A for more details). Excessive ROS concentrations can cause pathological problems, including direct lipid, protein, and DNA damage as well as animal and plant cell death [119,120,121,122,123,124,125,126]. The antioxidant capacity of the organism is overwhelmed if the regulation of intracellular ROS concentrations fails, thereby generating oxidative stress. As oxidative stress accumulates over time, it can weaken bodily functions and negatively affect growth and survival [124,125,127,128,129]. Oxidative stress is, therefore, one of the physiological costs that organisms must pay due to global warming caused by increased carbon concentrations [130]. In the wild, animals must perform various thermoregulations, such as heat absorption, in response to temperature changes, which can reduce their ability to invest in cell reproduction to survive [131].
2.2. Changes in Organism Migration and Range Shifts Due to Environmental Stress
When environmental stresses, such as climate change, occur, organisms attempt to adapt through evolutionary adaptations or by altering their morphology or life history to match the changing environment (i.e., phenotypic plasticity) [132,133,134]. However, if these efforts fail to overcome environmental stress, organisms may decline demographically or eventually become extinct. To mitigate this negative impact, organisms with the ability to move or disperse offspring beyond habitat boundaries may adopt movement strategies to find their preferred habitats [135]. One of the goals of migration is to acquire resources that are essential for survival. When organisms need to regulate their internal ROS concentrations due to climate change, they adopt a strategy of relocating to consume antioxidants as trophic resources that can mitigate these effects [136,137,138].
Organisms strive to consume antioxidant compounds, such as polyphenols, to regulate oxidative stress caused by increased ROS [139,140,141,142] and select foods rich in antioxidants based on criteria, such as the color of fruits or flowers, which indicate high polyphenol content [143,144]. The consumption of exogenous antioxidants by wild birds during migration or the utilization of local resources, which are rich in polyphenols or carotenoids, in preparation for flight, represent two such examples [145,146,147]. This represents a natural survival strategy, as antioxidant (e.g., TAS and tGSH) concentrations positively correlate with wild bird lifespan, whereas ROS (MDA) concentrations demonstrate a negative correlation [148].
Organisms actively utilize exogenous antioxidant diets instead of endogenous antioxidant enzymes, such as catalase, superoxide dismutase, and glutathione peroxidase, because this strategy is more efficient in terms of time and cost [149,150,151,152]. Exogenous antioxidant diets allow organisms to reduce the expression of antioxidant enzymes without causing significant oxidative damage. In addition, exogenous antioxidants can enhance endogenous antioxidant defenses by upregulating antioxidant enzyme activity [153,154,155,156,157].
Moreover, carnivores with no plant-based diet consumption can also directly or in-directly benefit from the oxidative-stress-regulatory effects of dietary antioxidants. Several herbivorous prey species, including rodents, primates, and birds, naturally accumulate carotenoids, which are natural antioxidants, through plant-based diets, and these accumulated substances are supplied to carnivores through feeding activities [138,158,159,160,161]. Antioxidants are not exclusively found in fruits and seeds. According to Cohen et al. [162], an analysis of the diets of 13 bird species revealed that the insectivorous Yellow Warblers (Setophaga petechia) had the highest carotenoid levels.
The process of dietary supplementation, including antioxidants, ultimately relates to the life history of organisms beyond their movement or distribution [163]. Organisms actively seek dietary antioxidants that help alleviate oxidative stress when external thermal environmental changes, such as rapid temperature increases, occur [164]. This process also affects reproductive behaviors that are directly linked to survival. Males that consumed antioxidant-rich foods maintained consistent reproductive behaviors over time, whereas those on low-antioxidant diets exhibited decreased reproductive behaviors [165,166]. Reproductive cells are particularly vulnerable to oxidative stress that affects cell viability across generations [167,168]. Furthermore, oxidative stress can influence the evolution of mate selection processes by altering visually apparent sexual superiority [167,168,169].
2.3. Need to Understand Environmental Stress and Diversity Considering Carbon Flow
While extensive research has been conducted separately on biodiversity and climate change as environmental stressors, there is a need to integrate these findings into a conceptual framework that spans not only a single organism group but also entire ecosystems. This is because it is suitable for consistently interpreting existing and future research results regarding the temporal and spatial variability of biodiversity caused by environmental stress.
Carbon influences biodiversity throughout the ecosystem through the food chain and oxidative-stress-regulation mechanisms. Carbon causes variability due to oxidative stress in plants while also creating an oxidation-promoting environment in mammals. Mammals serve as carbon reservoirs that further affect the carbon flow during this process.
To survive environmental stress, mammals break down heme molecules, which play a crucial role in maintaining cellular homeostasis. Heme molecules promote biological oxidation in mammals and are important for maintaining cellular homeostasis. Microsomal heme oxygenase in macrophages of the mononuclear phagocytic system (MPS) begins to degrade heme. This process produces exogenous and endogenous carbon monoxide (CO), creating an oxidation-promoting environment that initiates signaling related to ROS generation in aerobic mammalian cells [170,171] (Figure 1). Faced with the need to modulate oxidative stress, fluctuations in biodiversity have been observed.
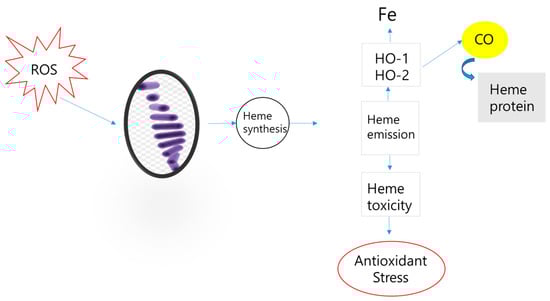
Figure 1.
ROS influencing carbon cycling in organisms.
Ultimately, it is possible to understand the carbon flow and oxidative stress suppression mechanisms through ROS networks in the food chain, which can help assess biodiversity variability. Furthermore, this approach allows for the evaluation of biodiversity variability caused by climate change and human influence. Climate change and anthropogenic activities can promote top-heaviness in food chains, such as inversions of the upper and lower parts of the nutrient pyramid in specific environments [172,173], which can also cause these changes (Figure 2).
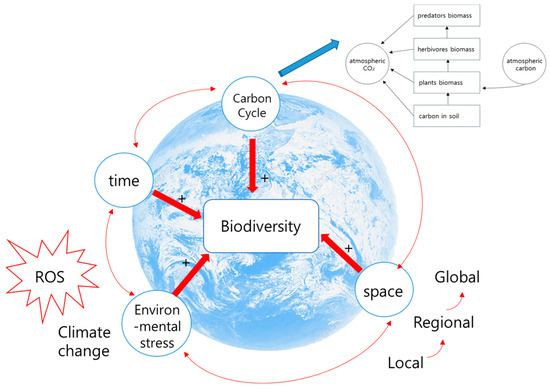
Figure 2.
This conceptual figure illustrates how climate change as an environmental stress and the carbon cycle can influence biodiversity. Spatiotemporally changing carbon concentrations directly affect climate change, leading to life history changes in organisms, such as migration or feeding habits. This further brings about changes in biodiversity, in turn leading to variability in the carbon flow. In other words, it demonstrates the importance of grasping the entire flow rather than a fragmented structure when assessing biodiversity. “+” indicates an increase in effect (e.g., increased ROS concentration leads to increased environmental stress), while “+/−“ indicates that the effect may either increase or decrease.
3. Environmental Stress and Biodiversity
3.1. Macroscopic and Microscopic Environmental Stress
Climate change, as an environmental stressor, may be broadly divided into macroscopic and microscopic aspects. Macroecological analysis of environmental stress can focus on organism movement, such as habitat changes [174]. This is primarily related to biodiversity change patterns over time, space, and phylogeny, particularly species distribution patterns [175]. It analyzes the spatial movement strategies of populations by using comparative ecology to develop generalizations within and between species at various scales, including demographic, environmental, and life history data. These life history attributes are associated with high genetic diversity [176].
Microecological analysis focuses on the physiological and ecological changes in organisms. It relates to phenology and analyzes the evolutionary driving forces of genomic adaptation and species differentiation [177]. For example, it studies how climate change, as an environmental stressor, alters plants’ seasonal changes, such as flowering, leaf unfolding, and leaf falling.
When climate change acts as a macroscopic environmental stress, it is closely related to habitat loss and organism distribution [178,179]. The rise in global temperature could be a major cause of changes in the latitudinal or altitudinal distribution of terrestrial organisms while shifting the peak of biodiversity [180,181]. Organisms migrate (climate tracking) in search of suitable environments as the climate changes, and this speed is accelerating [181,182,183,184].
Moreover, the risk of extinction due to rapid habitat loss caused by climate change [178,185] cannot be ignored. For instance, Arctic marine mammals experience population distribution changes due to fluctuations in the area of ice cover resulting from climate change [186]. These effects are more pronounced in species already under environmental stress [187]. This could lead to a vicious cycle of accelerated population decline and reduced resilience to environmental stress.
When climate change acts as a microscopic environmental stress, it disrupts interactions between various species and causes changes in their physiological and behavioral characteristics [188]. Temperature increases affect the rate of biological processes, such as aerobic metabolism [127] (see Appendix B for more details). Additionally, mitochondrial respiration necessary for energy generation potentially leads to ROS formation, causing oxidative stress, which can alter an organism’s growth rate and curve. In the long term, it can affect reproduction and the lifespan [127,189,190].
Furthermore, a decrease in the average body size of several organisms has been observed at various levels in response to global warming. Higher temperatures have increased the growth rate (i.e., body mass increase) and developmental speed (i.e., differentiation from egg to adult) but decreased the adult size. Ectotherms, such as lizards and fish, whose internal temperature varies with the external temperature, tend to show more sensitive physiological and ecological changes [191].
3.2. Current Status and Implications of Arithmetic Indicator-Centered Biodiversity Assessment That Fails to Consider Environmental Stress
Assessing biodiversity variability without considering the environmental stresses acting at various scales, from macro to micro, may lead to results that are entirely different from reality [1,4]. This is because even functionally equivalent species in an ecosystem may have different tolerances to environmental stress, affecting not only the functional changes in organisms but also species richness [192,193,194,195]. Moreover, the function and stability of ecosystem communities change with changes in diversity, and environmental stress is an important factor regulating this diversity [194,195,196].
If biodiversity can be evaluated solely based on arithmetic indicators (i.e., typical metrics), there should be a positive correlation between changes in individual numbers and species richness. However, this is not always the case [62,197]. Even though the species richness of functional groups increases over time, a paradoxical decrease in the overall species richness of ecosystem communities can sometimes be observed [4]. This phenomenon may intensify further because temporal and spatial dimensions decouple changes in the total compositional richness and biodiversity indicators, such as species richness [197]. Environmental heterogeneity also influences the degree of spatial variation in species richness [198,199,200]. Furthermore, as environmental stress intensifies, the directionality of these changes becomes more difficult to predict, and the relationship between facilitation and compensation dynamics becomes more complex as the heterogeneity among various functional groups increases [4]. Functional group diversity is more meaningful than species diversity and is closely related to long-term stability, making it an element that cannot be ignored [196]. It is necessary to comprehensively examine the diversity across functional groups and not just within them while considering environmental stress [4].
Compensation refers to the maintenance of the overall richness when the richness of a particular species or functional group decreases whereas that of others increases. Facilitation is a phenomenon in which an increase in species richness causes positive interactions, leading to the increased richness of other species.
Moreover, when comparing the results of local biodiversity assessments based on individual numbers, richness, and evenness with the relationships among various biodiversity indicators, their own correlations are often low [197]. Community changes cannot be evaluated by a single measure because the average change in the entire aggregate estimated independently may be completely different from the changes in each component that makes up the aggregate [201]. In such situations, simply assigning weights to effective species numbers based on species richness alone can lead to results that are entirely different from the actual biodiversity. A bigger problem is that while individual numbers, species richness, and dominance (i.e., the relative abundance of the numerically dominant species quantified and conceptual evenness) are highly variable across datasets, it may be difficult to capture the average directionality.
It is additionally difficult to analyze changes using only arithmetic indicators without understanding the biological mechanisms, as the effects of environmental stress may appear differently due to ecological differences between species [62] or the loss of specific species may have a significant impact on ecosystem function [202]. For example, predictions of species richness between sessile species and highly mobile consumers may vary greatly depending on environmental stress [193]. Predicting the responses of highly mobile consumers, such as birds and fish, poses a greater challenge compared to sessile organisms when abiotic stressors, such as environmental factors, exhibit spatial heterogeneity.
3.3. The Interaction between Biodiversity and Environmental Stress within Changes in Organism Distribution and Migration
The effects of environmental stress on biodiversity should be examined both macroscopically and microscopically. Macroscopic and microscopic environmental stresses create additional changes within biodiversity variability. It is, therefore, necessary to consider these two elements organically [203,204].
Global warming can cause changes in the distribution of organisms, and the rate of these changes is accelerating [205,206]. However, large-scale changes in distribution do not fully reflect detailed trends. Although it may be possible to predict general range shifts in organisms due to the environmental stress of climate change, deviations may be highly probable if no unit of analysis is a large species or group [207]. Altitudinal distributions may differ among species that have moved to higher latitudes because of the elevated climate, indicating that overall trends may not capture variability within taxonomic groups [181]. This reveals that the direct physiological effects of a global temperature rise on organisms may be superseded by biotic interactions or localized non-thermal abiotic conditions [207]. In other words, changes in organism distribution may be solely attributed to changes in temperature.
Changes in the distribution or movement of organisms due to temperature changes occur in interactions with physiological heat tolerance, competition, interactions between predators and prey, and nutritional supply [72]. Additionally, changes in the species that coexist under specific conditions may affect the distribution and migration of organisms. To understand the environmental stress factors faced by various organisms, researchers must consider both macroscopic and microscopic environmental stresses. Only then can specific predictions about changes in individual species be made possible while understanding the large variability that occurs within taxonomic groups [181].
However, this integrated approach has not yet been implemented. The need to interpret how various indicators, such as species diversity, respond to environmental stress caused by natural environmental changes, such as climate change, and how they affect biodiversity has recently increased, but research results related to this are scarce [62]. This study, therefore, examined the possibility of assessing biodiversity variability to spatiotemporally evaluate the life history changes of organisms adapting to environmental stress due to climate change and subsequent changes in carbon cycling.
4. Material Cycling–Environmental Stress–Biodiversity
4.1. Understanding Biodiversity Considering Complex Systems
As discussed previously, the interaction between macroscopic and microscopic environmental stresses is at the core of complex systems [208,209,210]. While research on complex systems is becoming increasingly important in both the natural and social sciences, a universally agreed-upon definition or a precise technical definition has not yet been established [211]. However, several scientists agree on the existence of complex systems and converge on the idea that they are composed of several interacting parts [209,212]. For this study, a complex system is defined as one in which the identities of the parts and the whole are not unidirectionally separated. The constituent parts determine the identity of the entire ecosystem, and the interactions with the entire ecosystem determine the identity of the parts.
Complex ecological systems comprise several elements: (i) diversity and interactions across spatial, temporal, and organizational scales, (ii) ecological memory of past events (i.e., historical effects), and (iii) heterogeneous and variable environmental factors. There are various actors in systems of “open boundaries” like ecosystems, and both their number and the actors themselves can change rapidly [213]. Ecosystems with high diversity can undergo continuous change because of these complex interactions [214]. Chaotic biodiversity dynamics can occur over long periods in spatially diverse ecosystems. Moreover, no environmental stresses, such as climate change, isolate ecological responses [215]. Individual responses of species to environmental stress are connected through their interactions with other species in the same or adjacent food webs. Nonlinear, highly complex, and sometimes directional responses emerge through these biological interactions and feedback processes.
Considering these perspectives, it is impossible for existing fragmented and arithmetic indicator-based biodiversity assessments to capture ecosystem complexity. Ecosystems involve several levels of causal relationships. Therefore, at the level of describing specific topics, although it can provide insights into related processes, it is limited in explaining complexity across varying biodiversity [216,217,218].
Reductionist approaches and existing fragmented quantitative indicators are valuable. However, the conclusions drawn from these approaches should only be considered within the context of an overall complex system. Ecologists have recently paid more attention to changes in biodiversity due to ecosystem dynamics, co-evolution, and interactions, rather than focusing on biodiversity at specific points in time [208]. This shift necessitates an understanding of biodiversity variability through the lens of multiple ecological networks.
4.2. Biodiversity Considering Comprehensive Environmental Changes Based on Material Cycling
It is well-documented that no complex systems are limited to macro–micro relationships [219,220,221,222]. Species as well as local systems interact with each other and integrate into increasingly larger scales up to the entire biosphere, influencing the physical and chemical characteristics on a global level [223,224]. This connection between the biosphere and the geosphere has been strengthened as the inorganic control of organic carbon cycling has diversified. The organic carbon material cycle is closely linked to both biological evolution and overall environmental changes [225,226].
It is obvious that global warming greatly affects carbon cycling, which interacts with photosynthesis and respiration, thereby influencing ecosystem functions [159,224]. Changes in atmospheric carbon levels alter the relative proportions of various species and alter albedo and evapotranspiration, leading to changes in the local climate. Moreover, as climate change can alter the direction, frequency, and intensity of these interactions, it can result in even greater changes in ecosystem functions [165].
The interconnectedness of a constantly changing biological world is closely related to biodiversity. Although ecological processes that maintain biodiversity operate on a smaller scale than the global climate system, global collaborative efforts are necessary for biodiversity conservation. Understanding the direction and scale of ecological responses considering comprehensive environmental changes based on material cycling can help better predict these changes and adapt them as needed [184].
There is currently an urgent need for an integrated and practical approach to biodiversity based on physical and chemical material cycles. Moreover, because environmental changes due to climate change occur rapidly, flexibility is necessary to address this issue. This approach helps respond to current global biodiversity and climate change challenges. Although attempts have been made to address these issues from various perspectives, such as hierarchy theory and species–ecosystem connections, there is still a need for more extensive and comprehensive consideration.
5. Conclusions and Future Research Directions
This study confirms that biodiversity variability can be understood by considering environmental stress based on carbon material cycling. As climate change accelerates, it is necessary to properly understand and predict changes in species and ecosystems; however, existing research frameworks have several limitations. A major obstacle is that assessing biodiversity variability based solely on species richness or evenness may yield results that are entirely different from actual phenomena. Changes in biodiversity may occur in unexpected directions, such as decreased diversity, despite increased organism numbers or a simplification of overall ecosystem functions.
Although genetic-, species-, and ecosystem-level research approaches are important, there is a need to multidimensionally analyze biodiversity variability by integrating each domain. Ecosystems simultaneously possess the characteristics of both complex and open systems. Numerous components strongly influence each other, and carbon cycling occurs in various domains. As these changes become more unpredictable due to climate change, fragmented approaches inevitably face limitations.
Increasing carbon concentrations have contributed to global warming, leading to environmental stress in the form of climate change. Changes in the ecosystem due to climate change occur through carbon-cycling processes, affecting organisms as ecosystem components. To survive environmental stress, organisms regulate oxidative stress through ROS networks in the food chain, leading to changes in their life cycle. This influences not only species but also local systems and the physical and chemical characteristics. Ultimately, understanding the interaction between carbon flow and environmental stress will help in understanding biodiversity variability.
Future research should focus on understanding trends in the development of environmental stress tolerance in organisms in relation to temporal and spatial changes to enhance the current understanding of the relationship between climate change and biodiversity, considering carbon cycling. This is because the responses of organisms to environmental stress vary depending on their characteristics, even under identical conditions. Initially, biodiversity may decrease because of environmental stress when organisms lack tolerance, but variability may occur in unpredicted directions in the medium to long term. A thorough understanding of how specific factors transform organisms to change their tolerance or performance is urgently required in the current context of rapid global climate change.
There is additionally a need to elucidate the interactive effects on carbon cycling structures when environmental stress leads to changes to the food web. Carbon enters organisms and causes various physiological changes that affect their life histories. Organisms also play a role in global carbon cycling. Changes in these relationships can trigger a cascade of effects.
The functional capacity of organisms for carbon capture and storage should also be analyzed, as this capacity affects carbon cycling. Recent studies [106,108] have attempted to quantify the carbon capture and storage functions of organisms, but these have primarily focused on vertebrates and large animals. However, a diverse range of organisms influences carbon material cycling. To understand global carbon flows, it is increasingly necessary to conduct multilayered analyses of carbon capture and storage capabilities across a wider variety of organisms.
By utilizing these research results in the future, we expect to be able to analyze long-term variability trends in climate change and biodiversity, which directly and indirectly influence each other in various ecological aspects, from a material cycling perspective. The ultimate goal of our study is to stimulate further research and discussion of these critical interconnections.
Author Contributions
Conceptualization, A.-Y.K., W.-S.L. and Y.S.; methodology, A.-Y.K., W.-S.L. and Y.S.; investigation, A.-Y.K., W.-S.L. and Y.S.; resources, investigation, writing—original draft preparation, A.-Y.K., W.-S.L. and Y.S.; writing—review and editing, A.-Y.K., W.-S.L. and Y.S.; visualization, A.-Y.K.; supervision, W.-S.L. and Y.S.; project administration, Y.S.; funding acquisition, Y.S. All authors have read and agreed to the published version of the manuscript.
Funding
This research was financially supported by the National Research Foundation of the Republic of Korea, Graduate School Specialized in Carbon Sink provided by Korea Forest Service (Korea Forestry Promotion Institute), and the Korea Forestry Promotion Institute (KoFPI) (RS-2022-KF002024).
Institutional Review Board Statement
Not applicable.
Data Availability Statement
Data are contained within the article.
Conflicts of Interest
The authors declare no conflicts of interest.
Appendix A. Carbon Cycle Structure and the Role of ROS
Cells survive by adapting to carbon exchange conditions between different physiological functions [227]. When environmental stress causes a change in one physiological function, it sequentially affects the carbon available for other processes, determining metabolic costs and feedback between them. Allen et al. [227] explain that the metabolic cost of carbon investment in antioxidant compounds leads to a reduction in one or more physiological functions.
Cells use oxygen as the final electron acceptor in the reduction of carbon-based fuels, which also relates to ROS generation [167]. ROS, which is essential for the adaptive immune response of aerobic organisms, also acts as a signal transducer [169,228]. ROS generated in one plant cell can trigger chain reactions in neighboring cells [116,117]. ROS serves as a mediator in intercellular signaling systems (Figure A1) [229,230,231,232].

Figure A1.
ROS acting as a signal transducer.
ROS is also associated with carbon flow in vertebrates, particularly in herbivores at higher trophic levels of the plant-based food chain, as well as in predators and other vertebrates. To regulate oxidative stress due to increased ROS, primary consumers (herbivores) attempt to consume natural antioxidants through plants, which are primary producers. Secondary consumers (carnivores) regulate oxidative stress through natural antioxidants accumulated in primary consumers [136,158,233]. This series of processes links to changes in biodiversity (Figure A2).

Figure A2.
ROS sequentially affecting the food chain.
Appendix B. Heat Stress and Dietary Shifts in Animals
The discrepancy between the nutrient acquisition rate and the increase in the metabolic rate due to temperature rise is a survival-critical issue for organisms. As the thermal performance curve (TPC) shows, when the external environmental temperature rises, it increases the metabolic rate of organisms, such as ectotherms [127]. As the temperature increases, basic metabolic requirements, including the resting metabolic rate (RMR), increase, which leads to higher food demand [72] and can affect survival. Organisms may cease activity and potentially perish upon reaching their maximum critical temperature threshold. ROS plays a significant role in this process. Elevated ROS levels can induce augmented oxidative stress, potentially causing lethal damage to cells and tissues (Figure A3).
Consequently, some animals exhibit a response known as “behavioral hypothermia”, moving to cooler areas to lower their metabolic demands [234,235]. There is also a hypothesis that ectotherms prioritize the consumption of higher-carbon diets due to increased metabolic requirements [236].

Figure A3.
Theoretical comparison of temperature-dependent ROS and biological process rates.
References
- Pecl, G.T.; Araújo, M.B.; Bell, J.D.; Blanchard, J.; Bonebrake, T.C.; Chen, I.-C.; Clark, T.D.; Colwell, R.K.; Danielsen, F.; Evengård, B. Biodiversity redistribution under climate change: Impacts on ecosystems and human well-being. Science 2017, 355, eaai9214. [Google Scholar] [CrossRef] [PubMed]
- Zandalinas, S.I.; Fritschi, F.B.; Mittler, R. Global Warming, Climate Change, and Environmental Pollution: Recipe for a Multifactorial Stress Combination Disaster. Trends Plant Sci. 2021, 26, 588–599. [Google Scholar] [CrossRef] [PubMed]
- Lee, H.; Calvin, K.; Dasgupta, D.; Krinner, G.; Mukherji, A.; Thorne, P.; Trisos, C.; Romero, J.; Aldunce, P.; Barret, K. IPCC, 2023: Climate Change 2023: Synthesis Report, Summary for Policymakers. Contribution of Working Groups I, II and III to the Sixth Assessment Report of the Intergovernmental Panel on Climate Change; Core Writing Team, Lee, H., Romero, J., Eds.; IPCC: Geneva, Switzerland, 2023. [Google Scholar]
- Romanuk, T.N.; Vogt, R.J.; Young, A.; Tuck, C.; Carscallen, M.W. Maintenance of positive diversity-stability relations along a gradient of environmental stress. PLoS ONE 2010, 5, e10378. [Google Scholar] [CrossRef] [PubMed]
- Schulte, P.M. What is environmental stress? Insights from fish living in a variable environment. J. Exp. Biol. 2014, 217, 23–34. [Google Scholar] [CrossRef] [PubMed]
- Koolhaas, J.M.; Bartolomucci, A.; Buwalda, B.; de Boer, S.F.; Flügge, G.; Korte, S.M.; Meerlo, P.; Murison, R.; Olivier, B.; Palanza, P. Stress revisited: A critical evaluation of the stress concept. Neurosci. Biobehav. Rev. 2011, 35, 1291–1301. [Google Scholar] [CrossRef]
- Tortosa, M.; Velasco, P.; Rodríguez, V.M.; Cartea, M.E. Changes in Brassica oleracea leaves infected with Xanthomonas campestris pv. campestris by proteomics analysis. Front. Plant Sci. 2022, 12, 781984. [Google Scholar] [CrossRef] [PubMed]
- Geyer, J.; Kiefer, I.; Kreft, S.; Chavez, V.; Salafsky, N.; Jeltsch, F.; Ibisch, P.L. Classification of climate-change-induced stresses on biological diversity. Conserv. Biol. 2011, 25, 708–715. [Google Scholar] [CrossRef]
- Jing, X.; Sanders, N.J.; Shi, Y.; Chu, H.; Classen, A.T.; Zhao, K.; Chen, L.; Shi, Y.; Jiang, Y.; He, J.-S. The links between ecosystem multifunctionality and above-and belowground biodiversity are mediated by climate. Nat. Commun. 2015, 6, 8159. [Google Scholar] [CrossRef]
- Singh, A.; Mehta, S.; Yadav, S.; Nagar, G.; Ghosh, R.; Roy, A.; Chakraborty, A.; Singh, I.K. How to cope with the challenges of environmental stresses in the era of global climate change: An update on ROS stave off in plants. Int. J. Mol. Sci. 2022, 23, 1995. [Google Scholar] [CrossRef]
- Chaudhry, S.; Sidhu, G.P.S. Climate change regulated abiotic stress mechanisms in plants: A comprehensive review. Plant Cell Rep. 2022, 41, 1–31. [Google Scholar] [CrossRef]
- Soto-Navarro, C.; Ravilious, C.; Arnell, A.; De Lamo, X.; Harfoot, M.; Hill, S.; Wearn, O.; Santoro, M.; Bouvet, A.; Mermoz, S. Mapping co-benefits for carbon storage and biodiversity to inform conservation policy and action. Philos. Trans. R. Soc. B 2020, 375, 20190128. [Google Scholar] [CrossRef] [PubMed]
- Mehmood, I.; Bari, A.; Irshad, S.; Khalid, F.; Liaqat, S.; Anjum, H.; Fahad, S. Carbon cycle in response to global warming. Environ. Clim. Plant Veg. Growth 2020, 1–15. [Google Scholar] [CrossRef]
- Rosenzweig, C.; Karoly, D.; Vicarelli, M.; Neofotis, P.; Wu, Q.; Casassa, G.; Menzel, A.; Root, T.L.; Estrella, N.; Seguin, B. Attributing physical and biological impacts to anthropogenic climate change. Nature 2008, 453, 353–357. [Google Scholar] [CrossRef] [PubMed]
- Schlesinger, W.H. Biogeochemistry: An Analysis of Global Change; Academic Press: San Diego, CA, USA, 1997. [Google Scholar]
- Kabir, M.; Habiba, U.E.; Khan, W.; Shah, A.; Rahim, S.; Patricio, R.; Ali, L.; Shafiq, M. Climate change due to increasing concentration of carbon dioxide and its impacts on environment in 21st century; a mini review. J. King Saud Univ.-Sci. 2023, 35, 102693. [Google Scholar] [CrossRef]
- Pugnaire, F.I.; Morillo, J.A.; Peñuelas, J.; Reich, P.B.; Bardgett, R.D.; Gaxiola, A.; Wardle, D.A.; Van Der Putten, W.H. Climate change effects on plant-soil feedbacks and consequences for biodiversity and functioning of terrestrial ecosystems. Sci. Adv. 2019, 5, eaaz1834. [Google Scholar] [CrossRef] [PubMed]
- Stuart Chapin III, F.; McFarland, J.; David McGuire, A.; Euskirchen, E.S.; Ruess, R.W.; Kielland, K. The changing global carbon cycle: Linking plant–soil carbon dynamics to global consequences. J. Ecol. 2009, 97, 840–850. [Google Scholar] [CrossRef]
- Manlick, P.J.; Perryman, N.L.; Koltz, A.M.; Cook, J.A.; Newsome, S.D. Climate warming restructures food webs and carbon flow in high-latitude ecosystems. Nat. Clim. Change 2024, 14, 184–189. [Google Scholar] [CrossRef]
- Weiskopf, S.R.; Isbell, F.; Arce-Plata, M.I.; Di Marco, M.; Harfoot, M.; Johnson, J.; Lerman, S.B.; Miller, B.W.; Morelli, T.L.; Mori, A.S. Biodiversity loss reduces global terrestrial carbon storage. Nat. Commun. 2024, 15, 4354. [Google Scholar] [CrossRef]
- Mori, A.S.; Dee, L.E.; Gonzalez, A.; Ohashi, H.; Cowles, J.; Wright, A.J.; Loreau, M.; Hautier, Y.; Newbold, T.; Reich, P.B. Biodiversity–productivity relationships are key to nature-based climate solutions. Nat. Clim. Change 2021, 11, 543–550. [Google Scholar] [CrossRef]
- Pavoine, S.; Bonsall, M.B. Measuring biodiversity to explain community assembly: A unified approach. Biol. Rev. 2011, 86, 792–812. [Google Scholar] [CrossRef]
- Hamann, E.; Blevins, C.; Franks, S.J.; Jameel, M.I.; Anderson, J.T. Climate change alters plant–herbivore interactions. New Phytol. 2021, 229, 1894–1910. [Google Scholar] [CrossRef]
- Urban, M.C. Accelerating extinction risk from climate change. Science 2015, 348, 571–573. [Google Scholar] [CrossRef] [PubMed]
- Cahill, A.E.; Aiello-Lammens, M.E.; Fisher-Reid, M.C.; Hua, X.; Karanewsky, C.J.; Yeong Ryu, H.; Sbeglia, G.C.; Spagnolo, F.; Waldron, J.B.; Warsi, O. How does climate change cause extinction? Proc. R. Soc. B Biol. Sci. 2013, 280, 20121890. [Google Scholar] [CrossRef]
- Åkesson, A.; Curtsdotter, A.; Eklöf, A.; Ebenman, B.; Norberg, J.; Barabás, G. The importance of species interactions in eco-evolutionary community dynamics under climate change. Nat. Commun. 2021, 12, 4759. [Google Scholar] [CrossRef] [PubMed]
- DeLucia, E.H.; Nabity, P.D.; Zavala, J.A.; Berenbaum, M.R. Climate change: Resetting plant-insect interactions. Plant Physiol. 2012, 160, 1677–1685. [Google Scholar] [CrossRef]
- Forrest, J.R. Complex responses of insect phenology to climate change. Curr. Opin. Insect Sci. 2016, 17, 49–54. [Google Scholar] [CrossRef]
- Reich, P.B.; Tilman, D.; Isbell, F.; Mueller, K.; Hobbie, S.E.; Flynn, D.F.; Eisenhauer, N. Impacts of biodiversity loss escalate through time as redundancy fades. Science 2012, 336, 589–592. [Google Scholar] [CrossRef] [PubMed]
- Meyer, S.T.; Ebeling, A.; Eisenhauer, N.; Hertzog, L.; Hillebrand, H.; Milcu, A.; Pompe, S.; Abbas, M.; Bessler, H.; Buchmann, N. Effects of biodiversity strengthen over time as ecosystem functioning declines at low and increases at high biodiversity. Ecosphere 2016, 7, e01619. [Google Scholar] [CrossRef]
- Olsson, M.; Schwartz, T.; Wapstra, E.; Uller, T.; Ujvari, B.; Madsen, T.; Shine, R. Climate change, multiple paternity and offspring survival in lizards. Evolution 2011, 65, 3323–3326. [Google Scholar] [CrossRef]
- Koleček, J.; Reif, J.; Šálek, M.; Hanzelka, J.; Sottas, C.; Kubelka, V. Global population trends in shorebirds: Migratory behaviour makes species at risk. Sci. Nat. 2021, 108, 9. [Google Scholar] [CrossRef]
- Buse, J.; Griebeler, E.M.; Niehuis, M. Rising temperatures explain past immigration of the thermophilic oak-inhabiting beetle Coraebus florentinus (Coleoptera: Buprestidae) in south-west Germany. Biodivers. Conserv. 2013, 22, 1115–1131. [Google Scholar] [CrossRef]
- Alabia, I.D.; García Molinos, J.; Saitoh, S.I.; Hirawake, T.; Hirata, T.; Mueter, F.J. Distribution shifts of marine taxa in the Pacific Arctic under contemporary climate changes. Divers. Distrib. 2018, 24, 1583–1597. [Google Scholar] [CrossRef]
- Losapio, G.; Schöb, C. Resistance of plant–plant networks to biodiversity loss and secondary extinctions following simulated environmental changes. Funct. Ecol. 2017, 31, 1145–1152. [Google Scholar] [CrossRef]
- DeGregorio, B.A.; Westervelt, J.D.; Weatherhead, P.J.; Sperry, J.H. Indirect effect of climate change: Shifts in ratsnake behavior alter intensity and timing of avian nest predation. Ecol. Model. 2015, 312, 239–246. [Google Scholar] [CrossRef]
- Cannizzo, Z.J.; Griffen, B.D. Changes in spatial behaviour patterns by mangrove tree crabs following climate-induced range shift into novel habitat. Anim. Behav. 2016, 121, 79–86. [Google Scholar] [CrossRef]
- Yu, X.-T.; Yang, F.-L.; Da, W.; Li, Y.-C.; Xi, H.-M.; Cotton, A.M.; Zhang, H.-H.; Duan, K.; Xu, Z.-B.; Gong, Z.-X. Species Richness of Papilionidae Butterflies (Lepidoptera: Papilionoidea) in the Hengduan Mountains and Its Future Shifts under Climate Change. Insects 2023, 14, 259. [Google Scholar] [CrossRef] [PubMed]
- Karell, P.; Ahola, K.; Karstinen, T.; Valkama, J.; Brommer, J.E. Climate change drives microevolution in a wild bird. Nat. Commun. 2011, 2, 208. [Google Scholar] [CrossRef]
- Zimova, M.; Mills, L.S.; Nowak, J.J. High fitness costs of climate change-induced camouflage mismatch. Ecol. Lett. 2016, 19, 299–307. [Google Scholar] [CrossRef] [PubMed]
- Campbell, D.R.; Powers, J.M. Natural selection on floral morphology can be influenced by climate. Proc. R. Soc. B Biol. Sci. 2015, 282, 20150178. [Google Scholar] [CrossRef] [PubMed]
- Taylor, B.W.; Flecker, A.S.; Hall, R.O., Jr. Loss of a harvested fish species disrupts carbon flow in a diverse tropical river. Science 2006, 313, 833–836. [Google Scholar] [CrossRef]
- Eilers, E.J.; Kremen, C.; Smith Greenleaf, S.; Garber, A.K.; Klein, A.-M. Contribution of pollinator-mediated crops to nutrients in the human food supply. PLoS ONE 2011, 6, e21363. [Google Scholar] [CrossRef]
- Millard, J.; Outhwaite, C.L.; Ceaușu, S.; Carvalheiro, L.G.; da Silva e Silva, F.D.; Dicks, L.V.; Ollerton, J.; Newbold, T. Key tropical crops at risk from pollinator loss due to climate change and land use. Sci. Adv. 2023, 9, eadh0756. [Google Scholar] [CrossRef]
- Jentsch, A.; Kreyling, J.; Elmer, M.; Gellesch, E.; Glaser, B.; Grant, K.; Hein, R.; Lara, M.; Mirzae, H.; Nadler, S.E. Climate extremes initiate ecosystem-regulating functions while maintaining productivity. J. Ecol. 2011, 99, 689–702. [Google Scholar] [CrossRef]
- Fordham, D.A.; Resit Akçakaya, H.; Araújo, M.B.; Elith, J.; Keith, D.A.; Pearson, R.; Auld, T.D.; Mellin, C.; Morgan, J.W.; Regan, T.J. Plant extinction risk under climate change: Are forecast range shifts alone a good indicator of species vulnerability to global warming? Glob. Change Biol. 2012, 18, 1357–1371. [Google Scholar] [CrossRef]
- Van Strien, A.; Soldaat, L.; Gregory, R. Desirable mathematical properties of indicators for biodiversity change. Ecol. Indic. 2012, 14, 202–208. [Google Scholar] [CrossRef]
- Fleishman, E.; Noss, R.F.; Noon, B.R. Utility and limitations of species richness metrics for conservation planning. Ecol. Indic. 2006, 6, 543–553. [Google Scholar] [CrossRef]
- Lamb, E.G.; Bayne, E.; Holloway, G.; Schieck, J.; Boutin, S.; Herbers, J.; Haughland, D.L. Indices for monitoring biodiversity change: Are some more effective than others? Ecol. Indic. 2009, 9, 432–444. [Google Scholar] [CrossRef]
- Konopiński, M.K. Shannon diversity index: A call to replace the original Shannon’s formula with unbiased estimator in the population genetics studies. PeerJ 2020, 8, e9391. [Google Scholar] [CrossRef] [PubMed]
- Saura, S.; Estreguil, C.; Mouton, C.; Rodríguez-Freire, M. Network analysis to assess landscape connectivity trends: Application to European forests (1990–2000). Ecol. Indic. 2011, 11, 407–416. [Google Scholar] [CrossRef]
- Müller, F.; Burkhard, B. The indicator side of ecosystem services. Ecosyst. Serv. 2012, 1, 26–30. [Google Scholar] [CrossRef]
- Reza, M.I.H.; Abdullah, S.A. Regional Index of Ecological Integrity: A need for sustainable management of natural resources. Ecol. Indic. 2011, 11, 220–229. [Google Scholar] [CrossRef]
- LaRue, E.A.; Hardiman, B.S.; Elliott, J.M.; Fei, S. Structural diversity as a predictor of ecosystem function. Environ. Res. Lett. 2019, 14, 114011. [Google Scholar] [CrossRef]
- Lee, A.C.; Mishler, B. Phylogenetic diversity and endemism: Metrics for identifying critical regions of conifer conservation in Australia. Berkeley Sci. J. 2014, 18. [Google Scholar] [CrossRef]
- Isaac, N.J.; Turvey, S.T.; Collen, B.; Waterman, C.; Baillie, J.E. Mammals on the EDGE: Conservation priorities based on threat and phylogeny. PLoS ONE 2007, 2, e296. [Google Scholar] [CrossRef]
- Rosauer, D.; Laffan, S.W.; Crisp, M.D.; Donnellan, S.C.; Cook, L.G. Phylogenetic endemism: A new approach for identifying geographical concentrations of evolutionary history. Mol. Ecol. 2009, 18, 4061–4072. [Google Scholar] [CrossRef] [PubMed]
- Gilbert, G.S.; Parker, I.M. Phylogenetic distance metrics for studies of focal species in communities: Quantiles and cumulative curves. Diversity 2022, 14, 521. [Google Scholar] [CrossRef]
- Duelli, P.; Obrist, M.K. Biodiversity indicators: The choice of values and measures. Agric. Ecosyst. Environ. 2003, 98, 87–98. [Google Scholar] [CrossRef]
- Soto-Navarro, C.; Harfoot, M.; Hill, S.; Campbell, J.; Mora, F.; Campos, C.; Pretorius, C.; Pascual, U.; Kapos, V.; Allison, H. Towards a multidimensional biodiversity index for national application. Nat. Sustain. 2021, 4, 933–942. [Google Scholar] [CrossRef]
- Feld, C.K.; Martins da Silva, P.; Paulo Sousa, J.; De Bello, F.; Bugter, R.; Grandin, U.; Hering, D.; Lavorel, S.; Mountford, O.; Pardo, I. Indicators of biodiversity and ecosystem services: A synthesis across ecosystems and spatial scales. Oikos 2009, 118, 1862–1871. [Google Scholar] [CrossRef]
- Cao, Y.; Hawkins, C.P. Weighting effective number of species measures by abundance weakens detection of diversity responses. J. Appl. Ecol. 2019, 56, 1200–1209. [Google Scholar] [CrossRef]
- Feld, C.K.; Sousa, J.P.; Da Silva, P.M.; Dawson, T.P. Indicators for biodiversity and ecosystem services: Towards an improved framework for ecosystems assessment. Biodivers. Conserv. 2010, 19, 2895–2919. [Google Scholar] [CrossRef]
- Blowes, S.A.; Belmaker, J.; Chase, J.M. Global reef fish richness gradients emerge from divergent and scale-dependent component changes. Proc. R. Soc. B Biol. Sci. 2017, 284, 20170947. [Google Scholar] [CrossRef]
- Prendergast, J.; Wood, S.; Lawton, J.; Eversham, B. Correcting for variation in recording effort in analyses of diversity hotspots. Biodivers. Lett. 1993, 1, 39–53. [Google Scholar] [CrossRef]
- Balmford, A.; Crane, P.; Dobson, A.; Green, R.E.; Mace, G.M. The 2010 challenge: Data availability, information needs and extraterrestrial insights. Philos. Trans. R. Soc. B Biol. Sci. 2005, 360, 221–228. [Google Scholar] [CrossRef]
- Soininen, J.; Passy, S.; Hillebrand, H. The relationship between species richness and evenness: A meta-analysis of studies across aquatic ecosystems. Oecologia 2012, 169, 803–809. [Google Scholar] [CrossRef]
- Hillebrand, H.; Blasius, B.; Borer, E.T.; Chase, J.M.; Downing, J.A.; Eriksson, B.K.; Filstrup, C.T.; Harpole, W.S.; Hodapp, D.; Larsen, S. Biodiversity change is uncoupled from species richness trends: Consequences for conservation and monitoring. J. Appl. Ecol. 2018, 55, 169–184. [Google Scholar] [CrossRef]
- Tucker, C.M.; Cadotte, M.W.; Carvalho, S.B.; Davies, T.J.; Ferrier, S.; Fritz, S.A.; Grenyer, R.; Helmus, M.R.; Jin, L.S.; Mooers, A.O. A guide to phylogenetic metrics for conservation, community ecology and macroecology. Biol. Rev. 2017, 92, 698–715. [Google Scholar] [CrossRef] [PubMed]
- MacDonald, Z.G.; Nielsen, S.E.; Acorn, J.H. Negative relationships between species richness and evenness render common diversity indices inadequate for assessing long-term trends in butterfly diversity. Biodivers. Conserv. 2017, 26, 617–629. [Google Scholar] [CrossRef]
- Gauthier, J.; Derome, N. Evenness-richness scatter plots: A visual and insightful representation of shannon entropy measurements for ecological community analysis. Msphere 2021, 6, 01019–01020. [Google Scholar] [CrossRef]
- Magurran, A.E. Biological diversity. Curr. Biol. 2005, 15, R116–R118. [Google Scholar] [CrossRef] [PubMed]
- McGlinn, D.J.; Xiao, X.; May, F.; Gotelli, N.J.; Engel, T.; Blowes, S.A.; Knight, T.M.; Purschke, O.; Chase, J.M.; McGill, B.J. Measurement of Biodiversity (MoB): A method to separate the scale-dependent effects of species abundance distribution, density, and aggregation on diversity change. Methods Ecol. Evol. 2019, 10, 258–269. [Google Scholar] [CrossRef]
- Tucker, C.M.; Cadotte, M.W. Unifying measures of biodiversity: Understanding when richness and phylogenetic diversity should be congruent. Divers. Distrib. 2013, 19, 845–854. [Google Scholar] [CrossRef]
- Zillio, T.; Condit, R. The impact of neutrality, niche differentiation and species input on diversity and abundance distributions. Oikos 2007, 116, 931–940. [Google Scholar] [CrossRef]
- Magurran, A.E.; Henderson, P.A. Explaining the excess of rare species in natural species abundance distributions. Nature 2003, 422, 714–716. [Google Scholar] [CrossRef] [PubMed]
- McGill, B.J. A test of the unified neutral theory of biodiversity. Nature 2003, 422, 881–885. [Google Scholar] [CrossRef]
- Habibullah, M.S.; Din, B.H.; Tan, S.-H.; Zahid, H. Impact of climate change on biodiversity loss: Global evidence. Environ. Sci. Pollut. Res. 2022, 29, 1073–1086. [Google Scholar] [CrossRef]
- Mantyka-Pringle, C.S.; Visconti, P.; Di Marco, M.; Martin, T.G.; Rondinini, C.; Rhodes, J.R. Climate change modifies risk of global biodiversity loss due to land-cover change. Biol. Conserv. 2015, 187, 103–111. [Google Scholar] [CrossRef]
- McGill, B.J.; Etienne, R.S.; Gray, J.S.; Alonso, D.; Anderson, M.J.; Benecha, H.K.; Dornelas, M.; Enquist, B.J.; Green, J.L.; He, F. Species abundance distributions: Moving beyond single prediction theories to integration within an ecological framework. Ecol. Lett. 2007, 10, 995–1015. [Google Scholar] [CrossRef] [PubMed]
- Bellwood, D.R.; Streit, R.P.; Brandl, S.J.; Tebbett, S.B. The meaning of the term ‘function’ in ecology: A coral reef perspective. Funct. Ecol. 2019, 33, 948–961. [Google Scholar] [CrossRef]
- Stewart, P.S.; Voskamp, A.; Santini, L.; Biber, M.F.; Devenish, A.J.; Hof, C.; Willis, S.G.; Tobias, J.A. Global impacts of climate change on avian functional diversity. Ecol. Lett. 2022, 25, 673–685. [Google Scholar] [CrossRef]
- Bellwood, D.R.; Pratchett, M.S.; Morrison, T.H.; Gurney, G.G.; Hughes, T.P.; Álvarez-Romero, J.G.; Day, J.C.; Grantham, R.; Grech, A.; Hoey, A.S. Coral reef conservation in the Anthropocene: Confronting spatial mismatches and prioritizing functions. Biol. Conserv. 2019, 236, 604–615. [Google Scholar] [CrossRef]
- Streck, C. Synergies between the Kunming-Montreal Global Biodiversity Framework and the Paris Agreement: The role of policy milestones, monitoring frameworks and safeguards. Clim. Policy 2023, 23, 800–811. [Google Scholar] [CrossRef]
- Strassburg, B.B.; Kelly, A.; Balmford, A.; Davies, R.G.; Gibbs, H.K.; Lovett, A.; Miles, L.; Orme, C.D.L.; Price, J.; Turner, R.K. Global congruence of carbon storage and biodiversity in terrestrial ecosystems. Conserv. Lett. 2010, 3, 98–105. [Google Scholar] [CrossRef]
- Wardle, D.A.; Jonsson, M.; Bansal, S.; Bardgett, R.D.; Gundale, M.J.; Metcalfe, D.B. Linking vegetation change, carbon sequestration and biodiversity: Insights from island ecosystems in a long-term natural experiment. J. Ecol. 2012, 100, 16–30. [Google Scholar] [CrossRef]
- Gan, J.; McCarl, B.A. Measuring transnational leakage of forest conservation. Ecol. Econ. 2007, 64, 423–432. [Google Scholar] [CrossRef]
- Labrière, N.; Locatelli, B.; Vieilledent, G.; Kharisma, S.; Basuki, I.; Gond, V.; Laumonier, Y. Spatial congruence between carbon and biodiversity across forest landscapes of northern Borneo. Glob. Ecol. Conserv. 2016, 6, 105–120. [Google Scholar] [CrossRef]
- Steudel, B.; Hector, A.; Friedl, T.; Löfke, C.; Lorenz, M.; Wesche, M.; Kessler, M. Biodiversity effects on ecosystem functioning change along environmental stress gradients. Ecol. Lett. 2012, 15, 1397–1405. [Google Scholar] [CrossRef] [PubMed]
- Nielsen, U.N.; Ayres, E.; Wall, D.H.; Bardgett, R.D. Soil biodiversity and carbon cycling: A review and synthesis of studies examining diversity–function relationships. Eur. J. Soil Sci. 2011, 62, 105–116. [Google Scholar] [CrossRef]
- Mokany, K.; Ware, C.; Harwood, T.D.; Schmidt, R.K.; Ferrier, S. Habitat-based biodiversity assessment for ecosystem accounting in the Murray-Darling Basin. Conserv. Biol. 2022, 36, e13915. [Google Scholar] [CrossRef]
- Maes, J.; Teller, A.; Erhard, M.; Condé, S.; Vallecillo, S.; Barredo, J.I.; Paracchini, M.L.; Abdul Malak, D.; Trombetti, M.; Vigiak, O.; et al. Mapping and Assessment of Ecosystems and Their Services: An EU Wide Ecosystem Assessment in Support of the EU Biodiversity Strategy; Publications Office of the European Union: Ispra, Italy, 2020. [Google Scholar] [CrossRef]
- Keenan, T.; Williams, C. The terrestrial carbon sink. Annu. Rev. Environ. Resour. 2018, 43, 219–243. [Google Scholar] [CrossRef]
- Gonzalez-Meler, M.A.; Taneva, L.; Trueman, R.J. Plant respiration and elevated atmospheric CO2 concentration: Cellular responses and global significance. Ann. Bot. 2004, 94, 647–656. [Google Scholar] [CrossRef] [PubMed]
- Huntley, M.; Lopez, M.; Karl, D. Top predators in the Southern Ocean: A major leak in the biological carbon pump. Science 1991, 253, 64–66. [Google Scholar] [CrossRef]
- Dangal, S.R.; Tian, H.; Zhang, B.; Pan, S.; Lu, C.; Yang, J. Methane emission from global livestock sector during 1890–2014: Magnitude, trends and spatiotemporal patterns. Glob. Change Biol. 2017, 23, 4147–4161. [Google Scholar] [CrossRef] [PubMed]
- Hessen, D.O.; Ågren, G.I.; Anderson, T.R.; Elser, J.J.; De Ruiter, P.C. Carbon sequestration in ecosystems: The role of stoichiometry. Ecology 2004, 85, 1179–1192. [Google Scholar] [CrossRef]
- Meunier, C.L.; Liess, A.; Andersson, A.; Brugel, S.; Paczkowska, J.; Rahman, H.; Skoglund, B.; Rowe, O.F. Allochthonous carbon is a major driver of the microbial food web–A mesocosm study simulating elevated terrestrial matter runoff. Mar. Environ. Res. 2017, 129, 236–244. [Google Scholar] [CrossRef]
- Schmitz, O.J.; Leroux, S.J. Food webs and ecosystems: Linking species interactions to the carbon cycle. Annu. Rev. Ecol. Evol. Syst. 2020, 51, 271–295. [Google Scholar] [CrossRef]
- Steinberg, D.K.; Landry, M.R. Zooplankton and the ocean carbon cycle. Annu. Rev. Mar. Sci. 2017, 9, 413–444. [Google Scholar] [CrossRef] [PubMed]
- Middelburg, J.J. Marine Carbon Biogeochemistry: A Primer for Earth System Scientists; Springer Nature: London, UK, 2019; p. 118. [Google Scholar] [CrossRef]
- Schmitz, O.J.; Wilmers, C.C.; Leroux, S.J.; Doughty, C.E.; Atwood, T.B.; Galetti, M.; Davies, A.B.; Goetz, S.J. Animals and the zoogeochemistry of the carbon cycle. Science 2018, 362, eaar3213. [Google Scholar] [CrossRef]
- Thompson, R.M.; Brose, U.; Dunne, J.A.; Hall, R.O.; Hladyz, S.; Kitching, R.L.; Martinez, N.D.; Rantala, H.; Romanuk, T.N.; Stouffer, D.B. Food webs: Reconciling the structure and function of biodiversity. Trends Ecol. Evol. 2012, 27, 689–697. [Google Scholar] [CrossRef]
- Monroe, J.G.; Markman, D.W.; Beck, W.S.; Felton, A.J.; Vahsen, M.L.; Pressler, Y. Ecoevolutionary dynamics of carbon cycling in the anthropocene. Trends Ecol. Evol. 2018, 33, 213–225. [Google Scholar] [CrossRef]
- De Deyn, G.B.; Cornelissen, J.H.; Bardgett, R.D. Plant functional traits and soil carbon sequestration in contrasting biomes. Ecol. Lett. 2008, 11, 516–531. [Google Scholar] [CrossRef] [PubMed]
- Schmitz, O.J.; Sylvén, M.; Atwood, T.B.; Bakker, E.S.; Berzaghi, F.; Brodie, J.F.; Cromsigt, J.P.; Davies, A.B.; Leroux, S.J.; Schepers, F.J. Trophic rewilding can expand natural climate solutions. Nat. Clim. Change 2023, 13, 324–333. [Google Scholar] [CrossRef]
- Malhi, Y.; Lander, T.; le Roux, E.; Stevens, N.; Macias-Fauria, M.; Wedding, L.; Girardin, C.; Kristensen, J.Å.; Sandom, C.J.; Evans, T.D. The role of large wild animals in climate change mitigation and adaptation. Curr. Biol. 2022, 32, R181–R196. [Google Scholar] [CrossRef] [PubMed]
- Berzaghi, F.; Chami, R.; Cosimano, T.; Fullenkamp, C. Financing conservation by valuing carbon services produced by wild animals. Proc. Natl. Acad. Sci. USA 2022, 119, e2120426119. [Google Scholar] [CrossRef]
- Mariani, G.; Cheung, W.W.; Lyet, A.; Sala, E.; Mayorga, J.; Velez, L.; Gaines, S.D.; Dejean, T.; Troussellier, M.; Mouillot, D. Let more big fish sink: Fisheries prevent blue carbon sequestration—Half in unprofitable areas. Sci. Adv. 2020, 6, eabb4848. [Google Scholar] [CrossRef]
- Martin, A.H.; Pearson, H.C.; Saba, G.K.; Olsen, E.M. Integral functions of marine vertebrates in the ocean carbon cycle and climate change mitigation. One Earth 2021, 4, 680–693. [Google Scholar] [CrossRef]
- Rodil, I.F.; Lohrer, A.M.; Attard, K.M.; Thrush, S.F.; Norkko, A. Positive contribution of macrofaunal biodiversity to secondary production and seagrass carbon metabolism. Ecology 2022, 103, e3648. [Google Scholar] [CrossRef]
- Cassia, R.; Nocioni, M.; Correa-Aragunde, N.; Lamattina, L. Climate change and the impact of greenhouse gasses: CO2 and NO, friends and foes of plant oxidative stress. Front. Plant Sci. 2018, 9, 273. [Google Scholar] [CrossRef]
- Kohli, S.K.; Khanna, K.; Bhardwaj, R.; Abd_Allah, E.F.; Ahmad, P.; Corpas, F.J. Assessment of subcellular ROS and NO metabolism in higher plants: Multifunctional signaling molecules. Antioxidants 2019, 8, 641. [Google Scholar] [CrossRef] [PubMed]
- Ma, X.; Bai, L. Elevated CO2 and reactive oxygen species in stomatal closure. Plants 2021, 10, 410. [Google Scholar] [CrossRef]
- Qiu, Q.-S.; Huber, J.L.; Booker, F.L.; Jain, V.; Leakey, A.D.; Fiscus, E.L.; Yau, P.M.; Ort, D.R.; Huber, S.C. Increased protein carbonylation in leaves of Arabidopsis and soybean in response to elevated [CO2]. Photosynth. Res. 2008, 97, 155–166. [Google Scholar] [CrossRef] [PubMed]
- Miller, G.; Schlauch, K.; Tam, R.; Cortes, D.; Torres, M.A.; Shulaev, V.; Dangl, J.L.; Mittler, R. The plant NADPH oxidase RBOHD mediates rapid systemic signaling in response to diverse stimuli. Sci. Signal. 2009, 2, ra45. [Google Scholar] [CrossRef] [PubMed]
- Mittler, R.; Vanderauwera, S.; Suzuki, N.; Miller, G.; Tognetti, V.B.; Vandepoele, K.; Gollery, M.; Shulaev, V.; Van Breusegem, F. ROS signaling: The new wave? Trends Plant Sci. 2011, 16, 300–309. [Google Scholar] [CrossRef] [PubMed]
- Taub, D.R.; Wang, X. Why are nitrogen concentrations in plant tissues lower under elevated CO2? A critical examination of the hypotheses. J. Integr. Plant Biol. 2008, 50, 1365–1374. [Google Scholar] [CrossRef] [PubMed]
- Beligni, M.V.; Lamattina, L. Nitric oxide counteracts cytotoxic processes mediated by reactive oxygen species in plant tissues. Planta 1999, 208, 337–344. [Google Scholar] [CrossRef]
- Correa-Aragunde, N.; Foresi, N.; Lamattina, L. Nitric oxide is a ubiquitous signal for maintaining redox balance in plant cells: Regulation of ascorbate peroxidase as a case study. J. Exp. Bot. 2015, 66, 2913–2921. [Google Scholar] [CrossRef] [PubMed]
- Paital, B.; Panda, S.K.; Hati, A.K.; Mohanty, B.; Mohapatra, M.K.; Kanungo, S.; Chainy, G.B.N. Longevity of animals under reactive oxygen species stress and disease susceptibility due to global warming. World J. Biol. Chem. 2016, 7, 110. [Google Scholar] [CrossRef] [PubMed]
- Mittler, R. ROS are good. Trends Plant Sci. 2017, 22, 11–19. [Google Scholar] [CrossRef] [PubMed]
- Belcher, J.D.; Beckman, J.D.; Balla, G.; Balla, J.; Vercellotti, G. Heme degradation and vascular injury. Antioxid. Redox Signal. 2010, 12, 233–248. [Google Scholar] [CrossRef]
- Hermes-Lima, M.; Zenteno-Savın, T. Animal response to drastic changes in oxygen availability and physiological oxidative stress. Comp. Biochem. Physiol. Part C Toxicol. Pharmacol. 2002, 133, 537–556. [Google Scholar] [CrossRef]
- Metcalfe, N.B.; Monaghan, P. Does reproduction cause oxidative stress? An open question. Trends Ecol. Evol. 2013, 28, 347–350. [Google Scholar] [CrossRef] [PubMed]
- Murphy, M.P.; Holmgren, A.; Larsson, N.-G.; Halliwell, B.; Chang, C.J.; Kalyanaraman, B.; Rhee, S.G.; Thornalley, P.J.; Partridge, L.; Gems, D. Unraveling the biological roles of reactive oxygen species. Cell Metab. 2011, 13, 361–366. [Google Scholar] [CrossRef]
- Schulte, P.M. The effects of temperature on aerobic metabolism: Towards a mechanistic understanding of the responses of ectotherms to a changing environment. J. Exp. Biol. 2015, 218, 1856–1866. [Google Scholar] [CrossRef] [PubMed]
- Vitikainen, E.I.; Cant, M.A.; Sanderson, J.L.; Mitchell, C.; Nichols, H.J.; Marshall, H.H.; Thompson, F.J.; Gilchrist, J.S.; Hodge, S.J.; Johnstone, R.A. Evidence of oxidative shielding of offspring in a wild mammal. Front. Ecol. Evol. 2016, 4, 58. [Google Scholar] [CrossRef]
- Smith, S.M.; Nager, R.G.; Costantini, D. Meta-analysis indicates that oxidative stress is both a constraint on and a cost of growth. Ecol. Evol. 2016, 6, 2833–2842. [Google Scholar] [CrossRef]
- Ritchie, D.J.; Friesen, C.R. Invited review: Thermal effects on oxidative stress in vertebrate ectotherms. Comp. Biochem. Physiol. Part A Mol. Integr. Physiol. 2022, 263, 111082. [Google Scholar] [CrossRef]
- Speakman, J.R.; Blount, J.D.; Bronikowski, A.M.; Buffenstein, R.; Isaksson, C.; Kirkwood, T.B.; Monaghan, P.; Ozanne, S.E.; Beaulieu, M.; Briga, M. Oxidative stress and life histories: Unresolved issues and current needs. Ecol. Evol. 2015, 5, 5745–5757. [Google Scholar] [CrossRef] [PubMed]
- Vedder, O.; Bouwhuis, S.; Sheldon, B.C. Quantitative assessment of the importance of phenotypic plasticity in adaptation to climate change in wild bird populations. PLoS Biol. 2013, 11, e1001605. [Google Scholar] [CrossRef]
- Martin, R.A.; da Silva, C.R.; Moore, M.P.; Diamond, S.E. When will a changing climate outpace adaptive evolution? Wiley Interdiscip. Rev. Clim. Change 2023, 14, e852. [Google Scholar] [CrossRef]
- Menzel, A.; Sparks, T.H.; Estrella, N.; Koch, E.; Aasa, A.; Ahas, R.; Alm-Kübler, K.; Bissolli, P.; Braslavská, O.g.; Briede, A. European phenological response to climate change matches the warming pattern. Glob. Change Biol. 2006, 12, 1969–1976. [Google Scholar] [CrossRef]
- Waldvogel, A.-M.; Feldmeyer, B.; Rolshausen, G.; Exposito-Alonso, M.; Rellstab, C.; Kofler, R.; Mock, T.; Schmid, K.; Schmitt, I.; Bataillon, T. Evolutionary genomics can improve prediction of species’ responses to climate change. Evol. Lett. 2020, 4, 4–18. [Google Scholar] [CrossRef]
- Sarode, R.M.; Das, A.; Verma, A.K.; Singh, P.; Saini, M.; Bhardwaj, Y.; Sharma, A.K. Partial replacement of dietary buffalo meat on the bone with chicken carcass improves serum antioxidant profile of zoo-housed Indian leopards (Panthera pardus fusca). Zoo Biol. 2019, 38, 292–304. [Google Scholar] [CrossRef]
- Zeng, Z.; Zdzieblik, D.; Centner, C.; Brauchle, C.; Gollhofer, A.; König, D. Changing dietary habits increases the intake of antioxidant vitamins and reduces the concentration of reactive oxygen species in blood: A pilot study. Int. J. Food Prop. 2020, 23, 1337–1346. [Google Scholar] [CrossRef]
- Durge, S.M.; Das, A.; Saha, S.K.; Pande, A.; Thakuria, D.; Saxena, A.; Bhardvaj, Y.; Verma, A.K. Dietary lutein supplementation improves immunity and antioxidant status of captive Indian leopards (Panthera fusca). Zoo Biol. 2022, 41, 328–339. [Google Scholar] [CrossRef]
- Casagrande, S.; DeMoranville, K.J.; Trost, L.; Pierce, B.; Bryła, A.; Dzialo, M.; Sadowska, E.T.; Bauchinger, U.; McWilliams, S.R. Dietary antioxidants attenuate the endocrine stress response during long-duration flight of a migratory bird. Proc. R. Soc. B 2020, 287, 20200744. [Google Scholar] [CrossRef]
- Beaulieu, M.; Haas, A.; Schaefer, H.M. Self-supplementation and effects of dietary antioxidants during acute thermal stress. J. Exp. Biol. 2014, 217, 370–375. [Google Scholar] [CrossRef] [PubMed]
- Bešlo, D.; Golubić, N.; Rastija, V.; Agić, D.; Karnaš, M.; Šubarić, D.; Lučić, B. Antioxidant activity, metabolism, and bioavailability of polyphenols in the diet of animals. Antioxidants 2023, 12, 1141. [Google Scholar] [CrossRef]
- Monaghan, P.; Metcalfe, N.B.; Torres, R. Oxidative stress as a mediator of life history trade-offs: Mechanisms, measurements and interpretation. Ecol. Lett. 2009, 12, 75–92. [Google Scholar] [CrossRef] [PubMed]
- Schaefer, H.M.; McGraw, K.; Catoni, C. Birds use fruit colour as honest signal of dietary antioxidant rewards. Funct. Ecol. 2008, 22, 303–310. [Google Scholar] [CrossRef]
- Zhang, F.P.; Cai, X.H.; Wang, H.; Ren, Z.X.; Larson-Rabin, Z.; Li, D.Z. Dark purple nectar as a foraging signal in a bird-pollinated Himalayan plant. New Phytol. 2012, 193, 188–195. [Google Scholar] [CrossRef]
- Alan, R.R.; McWilliams, S.R.; McGraw, K.J. The importance of antioxidants for avian fruit selection during autumn migration. Wilson J. Ornithol. 2013, 125, 513–525. [Google Scholar] [CrossRef]
- Bolser, J.A.; Alan, R.R.; Smith, A.D.; Li, L.; Seeram, N.P.; McWilliams, S.R. Birds select fruits with more anthocyanins and phenolic compounds during autumn migration. Wilson J. Ornithol. 2013, 125, 97–108. [Google Scholar] [CrossRef]
- Skrip, M.M.; Bauchinger, U.; Goymann, W.; Fusani, L.; Cardinale, M.; Alan, R.R.; McWilliams, S.R. Migrating songbirds on stopover prepare for, and recover from, oxidative challenges posed by long-distance flight. Ecol. Evol. 2015, 5, 3198–3209. [Google Scholar] [CrossRef] [PubMed]
- Xia, C.; Møller, A.P. Long-lived birds suffer less from oxidative stress. Avian Res. 2018, 9, 41. [Google Scholar] [CrossRef]
- Beaulieu, M.; Schaefer, H.M. Rethinking the role of dietary antioxidants through the lens of self-medication. Anim. Behav. 2013, 86, 17–24. [Google Scholar] [CrossRef]
- Catoni, C.; Peters, A.; Schaefer, H.M. Life history trade-offs are influenced by the diversity, availability and interactions of dietary antioxidants. Anim. Behav. 2008, 76, 1107–1119. [Google Scholar] [CrossRef]
- Manach, C.; Scalbert, A.; Morand, C.; Rémésy, C.; Jiménez, L. Polyphenols: Food sources and bioavailability. Am. J. Clin. Nutr. 2004, 79, 727–747. [Google Scholar] [CrossRef] [PubMed]
- Selman, C.; McLaren, J.S.; Meyer, C.; Duncan, J.S.; Redman, P.; Collins, A.R.; Duthie, G.G.; Speakman, J.R. Life-long vitamin C supplementation in combination with cold exposure does not affect oxidative damage or lifespan in mice, but decreases expression of antioxidant protection genes. Mech. Ageing Dev. 2006, 127, 897–904. [Google Scholar] [CrossRef]
- Skrip, M.M.; McWilliams, S.R. Oxidative balance in birds: An atoms-to-organisms-to-ecology primer for ornithologists. J. Field Ornithol. 2016, 87, 1–20. [Google Scholar] [CrossRef]
- Skrip, M.M. Oxidative State of Songbirds during Migration and Best Practices to Communicate the Science. Ph.D. Dissertation, University of Rhode Island, Kingston, RI, USA, 2016. [Google Scholar]
- Moskaug, J.Ø.; Carlsen, H.; Myhrstad, M.C.; Blomhoff, R. Polyphenols and glutathione synthesis regulation. Am. J. Clin. Nutr. 2005, 81, 277S–283S. [Google Scholar] [CrossRef]
- Yeh, C.-T.; Ching, L.-C.; Yen, G.-C. Inducing gene expression of cardiac antioxidant enzymes by dietary phenolic acids in rats. J. Nutr. Biochem. 2009, 20, 163–171. [Google Scholar] [CrossRef]
- Spanier, G.; Xu, H.; Xia, N.; Tobias, S.; Deng, S.; Wojnowski, L.; Forstermann, U.; Li, H. Resveratrol reduces endothelial oxidative stress by modulating the gene expression of superoxide dismutase 1 (SOD1), glutathione peroxidase 1 (GPx1) and NADPH oxidase subunit (Nox4). J. Physiol. Pharmacol. 2009, 60, 111–116. [Google Scholar] [PubMed]
- Slifka, K.A.; Bowen, P.E.; Stacewicz-Sapuntzakis, M.; Crissey, S.D. A survey of serum and dietary carotenoids in captive wild animals. J. Nutr. 1999, 129, 380–390. [Google Scholar] [CrossRef]
- Yvon-Durocher, G.; Allen, A.P. Linking community size structure and ecosystem functioning using metabolic theory. Philos. Trans. R. Soc. B Biol. Sci. 2012, 367, 2998–3007. [Google Scholar] [CrossRef] [PubMed]
- Crissey, S.D.; Jacobsen, K.L.; Slifka, K.A.; Ange, K.D.; Bowen, P.E.; Stacewicz-Sapuntzakis, M.; Langman, C.B.; Sadler, W.; Kahn, S.; Ward, A. Serum concentrations of lipids, vitamin D metabolites, retinol, retinyl esters, tocopherols and selected carotenoids in twelve captive wild felid species at four zoos. J. Nutr. 2003, 133, 160–166. [Google Scholar] [CrossRef]
- Møller, A.P.; Erritzøe, J.; Karadas, F. Levels of antioxidants in rural and urban birds and their consequences. Oecologia 2010, 163, 35–45. [Google Scholar] [CrossRef] [PubMed]
- Cohen, A.A.; McGraw, K.J.; Robinson, W.D. Serum antioxidant levels in wild birds vary in relation to diet, season, life history strategy, and species. Oecologia 2009, 161, 673–683. [Google Scholar] [CrossRef] [PubMed]
- Galván, I.; Erritzøe, J.; Karadaş, F.; Møller, A.P. High levels of liver antioxidants are associated with life-history strategies characteristic of slow growth and high survival rates in birds. J. Comp. Physiol. B 2012, 182, 947–959. [Google Scholar] [CrossRef] [PubMed]
- Walther, G.-R. Community and ecosystem responses to recent climate change. Philos. Trans. R. Soc. B Biol. Sci. 2010, 365, 2019–2024. [Google Scholar] [CrossRef] [PubMed]
- Blois, J.L.; Zarnetske, P.L.; Fitzpatrick, M.C.; Finnegan, S. Climate change and the past, present, and future of biotic interactions. Science 2013, 341, 499–504. [Google Scholar] [CrossRef]
- Carbeck, K.M.; DeMoranville, K.J.; D’Amelio, P.B.; Goymann, W.; Trost, L.; Pierce, B.; Bryła, A.; Dzialo, M.; Bauchinger, U.; McWilliams, S.R. Environmental cues and dietary antioxidants affect breeding behavior and testosterone of male European starlings (Sturnus vulgaris). Horm. Behav. 2018, 103, 36–44. [Google Scholar] [CrossRef]
- Dowling, D.K.; Simmons, L.W. Reactive oxygen species as universal constraints in life-history evolution. Proc. R. Soc. B Biol. Sci. 2009, 276, 1737–1745. [Google Scholar] [CrossRef] [PubMed]
- Metcalfe, N.B.; Alonso-Alvarez, C. Oxidative stress as a life-history constraint: The role of reactive oxygen species in shaping phenotypes from conception to death. Funct. Ecol. 2010, 24, 984–996. [Google Scholar] [CrossRef]
- Garratt, M.; Brooks, R.C. Oxidative stress and condition-dependent sexual signals: More than just seeing red. Proc. R. Soc. B Biol. Sci. 2012, 279, 3121–3130. [Google Scholar] [CrossRef] [PubMed]
- Ito, H.; Kurokawa, H.; Matsui, H. Mitochondrial reactive oxygen species and heme, non-heme iron metabolism. Arch. Biochem. Biophys. 2021, 700, 108695. [Google Scholar] [CrossRef]
- Piantadosi, C.A. Carbon monoxide, reactive oxygen signaling, and oxidative stress. Free Radic. Biol. Med. 2008, 45, 562–569. [Google Scholar] [CrossRef]
- Zgliczynski, B.J.; Sandin, S.A. Size-structural shifts reveal intensity of exploitation in coral reef fisheries. Ecol. Indic. 2017, 73, 411–421. [Google Scholar] [CrossRef]
- McCauley, D.J.; Gellner, G.; Martinez, N.D.; Williams, R.J.; Sandin, S.A.; Micheli, F.; Mumby, P.J.; McCann, K.S. On the prevalence and dynamics of inverted trophic pyramids and otherwise top-heavy communities. Ecol. Lett. 2018, 21, 439–454. [Google Scholar] [CrossRef]
- Beck, J.; Ballesteros-Mejia, L.; Buchmann, C.M.; Dengler, J.; Fritz, S.A.; Gruber, B.; Hof, C.; Jansen, F.; Knapp, S.; Kreft, H. What’s on the horizon for macroecology? Ecography 2012, 35, 673–683. [Google Scholar] [CrossRef]
- Bromham, L.; Hua, X.; Cardillo, M. Macroevolutionary and macroecological approaches to understanding the evolution of stress tolerance in plants. Plant Cell Environ. 2020, 43, 2832–2846. [Google Scholar] [CrossRef]
- Buckley, Y.M.; Puy, J. The macroecology of plant populations from local to global scales. New Phytol. 2022, 233, 1038–1050. [Google Scholar] [CrossRef] [PubMed]
- Nevo, E. Evolution under environmental stress at macro-and microscales. Genome Biol. Evol. 2011, 3, 1039–1052. [Google Scholar] [CrossRef]
- Travis, J. Climate change and habitat destruction: A deadly anthropogenic cocktail. Proc. R. Soc. London. Ser. B Biol. Sci. 2003, 270, 467–473. [Google Scholar] [CrossRef]
- Mair, L.; Hill, J.K.; Fox, R.; Botham, M.; Brereton, T.; Thomas, C.D. Abundance changes and habitat availability drive species’ responses to climate change. Nat. Clim. Change 2014, 4, 127–131. [Google Scholar] [CrossRef]
- Boag, T.H.; Gearty, W.; Stockey, R.G. Metabolic tradeoffs control biodiversity gradients through geological time. Curr. Biol. 2021, 31, 2906–2913.e2903. [Google Scholar] [CrossRef]
- Chen, I.-C.; Hill, J.K.; Ohlemüller, R.; Roy, D.B.; Thomas, C.D. Rapid range shifts of species associated with high levels of climate warming. Science 2011, 333, 1024–1026. [Google Scholar] [CrossRef]
- Ramalho, Q.; Vale, M.M.; Manes, S.; Diniz, P.; Malecha, A.; Prevedello, J.A. Evidence of stronger range shift response to ongoing climate change by ectotherms and high-latitude species. Biol. Conserv. 2023, 279, 109911. [Google Scholar] [CrossRef]
- Easterling, D.R.; Meehl, G.A.; Parmesan, C.; Changnon, S.A.; Karl, T.R.; Mearns, L.O. Climate extremes: Observations, modeling, and impacts. Science 2000, 289, 2068–2074. [Google Scholar] [CrossRef]
- Weiskopf, S.R.; Rubenstein, M.A.; Crozier, L.G.; Gaichas, S.; Griffis, R.; Halofsky, J.E.; Hyde, K.J.; Morelli, T.L.; Morisette, J.T.; Muñoz, R.C. Climate change effects on biodiversity, ecosystems, ecosystem services, and natural resource management in the United States. Sci. Total Environ. 2020, 733, 137782. [Google Scholar] [CrossRef] [PubMed]
- Segan, D.B.; Murray, K.A.; Watson, J.E. A global assessment of current and future biodiversity vulnerability to habitat loss–climate change interactions. Glob. Ecol. Conserv. 2016, 5, 12–21. [Google Scholar] [CrossRef]
- Laidre, K.L.; Stirling, I.; Lowry, L.F.; Wiig, Ø.; Heide-Jørgensen, M.P.; Ferguson, S.H. Quantifying the sensitivity of Arctic marine mammals to climate-induced habitat change. Ecol. Appl. 2008, 18, S97–S125. [Google Scholar] [CrossRef]
- Hazen, E.L.; Jorgensen, S.; Rykaczewski, R.R.; Bograd, S.J.; Foley, D.G.; Jonsen, I.D.; Shaffer, S.A.; Dunne, J.P.; Costa, D.P.; Crowder, L.B. Predicted habitat shifts of Pacific top predators in a changing climate. Nat. Clim. Change 2013, 3, 234–238. [Google Scholar] [CrossRef]
- Bozinovic, F.; Pörtner, H.O. Physiological ecology meets climate change. Ecol. Evol. 2015, 5, 1025–1030. [Google Scholar] [CrossRef]
- Huang, M.; Ding, L.; Wang, J.; Ding, C.; Tao, J. The impacts of climate change on fish growth: A summary of conducted studies and current knowledge. Ecol. Indic. 2021, 121, 106976. [Google Scholar] [CrossRef]
- Lee, W.-S.; Monaghan, P.; Metcalfe, N.B. Experimental demonstration of the growth rate–lifespan trade-off. Proc. R. Soc. B Biol. Sci. 2013, 280, 20122370. [Google Scholar] [CrossRef] [PubMed]
- Ohlberger, J. Climate warming and ectotherm body size–from individual physiology to community ecology. Funct. Ecol. 2013, 27, 991–1001. [Google Scholar] [CrossRef]
- Scrosati, R.A.; Knox, A.S.; Valdivia, N.; Molis, M. Species richness and diversity across rocky intertidal elevation gradients in Helgoland: Testing predictions from an environmental stress model. Helgol. Mar. Res. 2011, 65, 91–102. [Google Scholar] [CrossRef]
- Scrosati, R.A.; van Genne, B.; Heaven, C.S.; Watt, C.A. Species richness and diversity in different functional groups across environmental stress gradients: A model for marine rocky shores. Ecography 2011, 34, 151–161. [Google Scholar] [CrossRef]
- Pires, A.P.; Srivastava, D.S.; Marino, N.A.; MacDonald, A.A.M.; Figueiredo-Barros, M.P.; Farjalla, V.F. Interactive effects of climate change and biodiversity loss on ecosystem functioning. Ecology 2018, 99, 1203–1213. [Google Scholar] [CrossRef]
- Pires, A.P.; Srivastava, D.S.; Farjalla, V.F. Is biodiversity able to buffer ecosystems from climate change? What we know and what we don’t. Bioscience 2018, 68, 273–280. [Google Scholar] [CrossRef]
- Montoya, D.; Yallop, M.L.; Memmott, J. Functional group diversity increases with modularity in complex food webs. Nat. Commun. 2015, 6, 7379. [Google Scholar] [CrossRef]
- Blowes, S.A.; Daskalova, G.N.; Dornelas, M.; Engel, T.; Gotelli, N.J.; Magurran, A.E.; Martins, I.S.; McGill, B.; McGlinn, D.J.; Sagouis, A. Local biodiversity change reflects interactions among changing abundance, evenness, and richness. Ecology 2022, 103, e3820. [Google Scholar] [CrossRef]
- Hawkins, B.A.; Field, R.; Cornell, H.V.; Currie, D.J.; Guégan, J.-F.; Kaufman, D.M.; Kerr, J.T.; Mittelbach, G.G.; Oberdorff, T.; O’Brien, E.M. Energy, water, and broad-scale geographic patterns of species richness. Ecology 2003, 84, 3105–3117. [Google Scholar] [CrossRef]
- Tews, J.; Brose, U.; Grimm, V.; Tielbörger, K.; Wichmann, M.C.; Schwager, M.; Jeltsch, F. Animal species diversity driven by habitat heterogeneity/diversity: The importance of keystone structures. J. Biogeogr. 2004, 31, 79–92. [Google Scholar] [CrossRef]
- Guégan, J.-F.; Lek, S.; Oberdorff, T. Energy availability and habitat heterogeneity predict global riverine fish diversity. Nature 1998, 391, 382–384. [Google Scholar] [CrossRef]
- Avolio, M.L.; Komatsu, K.J.; Collins, S.L.; Grman, E.; Koerner, S.E.; Tredennick, A.T.; Wilcox, K.R.; Baer, S.; Boughton, E.H.; Britton, A.J. Determinants of community compositional change are equally affected by global change. Ecol. Lett. 2021, 24, 1892–1904. [Google Scholar] [CrossRef] [PubMed]
- O’Gorman, E.J.; Yearsley, J.M.; Crowe, T.P.; Emmerson, M.C.; Jacob, U.; Petchey, O.L. Loss of functionally unique species may gradually undermine ecosystems. Proc. R. Soc. B Biol. Sci. 2011, 278, 1886–1893. [Google Scholar] [CrossRef] [PubMed]
- Storch, D.; Gaston, K.J. Untangling ecological complexity on different scales of space and time. Basic Appl. Ecol. 2004, 5, 389–400. [Google Scholar] [CrossRef]
- Parmesan, C. Ecological and evolutionary responses to recent climate change. Annu. Rev. Ecol. Evol. Syst. 2006, 37, 637–669. [Google Scholar] [CrossRef]
- King, N.G.; Wilmes, S.B.; Smyth, D.; Tinker, J.; Robins, P.E.; Thorpe, J.; Jones, L.; Malham, S.K. Climate change accelerates range expansion of the invasive non-native species, the Pacific oyster, Crassostrea gigas. ICES J. Mar. Sci. 2021, 78, 70–81. [Google Scholar] [CrossRef]
- Bellard, C.; Thuiller, W.; Leroy, B.; Genovesi, P.; Bakkenes, M.; Courchamp, F. Will climate change promote future invasions? Glob. Change Biol. 2013, 19, 3740–3748. [Google Scholar] [CrossRef] [PubMed]
- Gibson-Reinemer, D.K.; Rahel, F.J. Inconsistent range shifts within species highlight idiosyncratic responses to climate warming. PLoS ONE 2015, 10, e0132103. [Google Scholar] [CrossRef]
- Anand, M.; Gonzalez, A.; Guichard, F.; Kolasa, J.; Parrott, L. Ecological systems as complex systems: Challenges for an emerging science. Diversity 2010, 2, 395–410. [Google Scholar] [CrossRef]
- Estrada, E. What is a complex system, after all? Found. Sci. 2023, 1–28. [Google Scholar] [CrossRef]
- Staniczenko, P.P.; Sivasubramaniam, P.; Suttle, K.B.; Pearson, R.G. Linking macroecology and community ecology: Refining predictions of species distributions using biotic interaction networks. Ecol. Lett. 2017, 20, 693–707. [Google Scholar] [CrossRef] [PubMed]
- Ladyman, J.; Lambert, J.; Wiesner, K. What is a complex system? Eur. J. Philos. Sci. 2013, 3, 33–67. [Google Scholar] [CrossRef]
- Kolasa, J. Complexity, system integration, and susceptibility to change: Biodiversity connection. Ecol. Complex. 2005, 2, 431–442. [Google Scholar] [CrossRef]
- Phillips, M.A.; Ritala, P. A complex adaptive systems agenda for ecosystem research methodology. Technol. Forecast. Soc. Change 2019, 148, 119739. [Google Scholar] [CrossRef]
- Roy, F.; Barbier, M.; Biroli, G.; Bunin, G. Complex interactions can create persistent fluctuations in high-diversity ecosystems. PLoS Comput. Biol. 2020, 16, e1007827. [Google Scholar] [CrossRef] [PubMed]
- Fisher, J.A.; Frank, K.T.; Leggett, W.C. Dynamic macroecology on ecological time-scales. Glob. Ecol. Biogeogr. 2010, 19, 1–15. [Google Scholar] [CrossRef]
- Kamarainen, A.M.; Grotzer, T.A. Constructing causal understanding in complex systems: Epistemic strategies used by ecosystem scientists. BioScience 2019, 69, 533–543. [Google Scholar] [CrossRef]
- Allen, T.F.; Hoekstra, T.W. Toward a Unified Ecology; Columbia University Press: New York, NY, USA, 2015. [Google Scholar]
- Wilensky, U.; Resnick, M. Thinking in levels: A dynamic systems approach to making sense of the world. J. Sci. Educ. Technol. 1999, 8, 3–19. [Google Scholar] [CrossRef]
- Lachowicz, M. Microscopic, mesoscopic and macroscopic descriptions of complex systems. Probabilistic Eng. Mech. 2011, 26, 54–60. [Google Scholar] [CrossRef]
- Bonan, G.B.; Doney, S.C. Climate, ecosystems, and planetary futures: The challenge to predict life in Earth system models. Science 2018, 359, eaam8328. [Google Scholar] [CrossRef] [PubMed]
- Lu, X.; Cadotte, M.W.; Wang, P.; Rao, S.; Shi, X.; Ren, S.; Wang, X.; Li, S.p. Multiple dimensions of phylogenetic diversity are needed to explain the complex aboveground–belowground diversity relationships. Oikos 2023, e10474. [Google Scholar] [CrossRef]
- Levin, S.A. Self-organization and the emergence of complexity in ecological systems. Bioscience 2005, 55, 1075–1079. [Google Scholar] [CrossRef]
- Loreau, M. Linking biodiversity and ecosystems: Towards a unifying ecological theory. Philos. Trans. R. Soc. B Biol. Sci. 2010, 365, 49–60. [Google Scholar] [CrossRef] [PubMed]
- Arneth, A.; Harrison, S.P.; Zaehle, S.; Tsigaridis, K.; Menon, S.; Bartlein, P.; Feichter, J.; Korhola, A.; Kulmala, M.; O’donnell, D. Terrestrial biogeochemical feedbacks in the climate system. Nat. Geosci. 2010, 3, 525–532. [Google Scholar] [CrossRef]
- Galvez, M.E.; Fischer, W.W.; Jaccard, S.L.; Eglinton, T.I. Materials and pathways of the organic carbon cycle through time. Nat. Geosci. 2020, 13, 535–546. [Google Scholar] [CrossRef]
- Ivlev, A.A. Global redox cycle of biospheric carbon: Interaction of photosynthesis and earth crust processes. BioSystems 2015, 137, 1–11. [Google Scholar] [CrossRef]
- Allen, J.; Polimene, L. Linking physiology to ecology: Towards a new generation of plankton models. J. Plankton Res. 2011, 33, 989–997. [Google Scholar] [CrossRef][Green Version]
- Carmody, M.; Waszczak, C.; Idänheimo, N.; Saarinen, T.; Kangasjärvi, J. ROS signalling in a destabilised world: A molecular understanding of climate change. J. Plant Physiol. 2016, 203, 69–83. [Google Scholar] [CrossRef] [PubMed]
- Gilroy, S.; Białasek, M.; Suzuki, N.; Górecka, M.; Devireddy, A.R.; Karpiński, S.; Mittler, R. ROS, calcium, and electric signals: Key mediators of rapid systemic signaling in plants. Plant Physiol. 2016, 171, 1606–1615. [Google Scholar] [CrossRef]
- Gilroy, S.; Suzuki, N.; Miller, G.; Choi, W.-G.; Toyota, M.; Devireddy, A.R.; Mittler, R. A tidal wave of signals: Calcium and ROS at the forefront of rapid systemic signaling. Trends Plant Sci. 2014, 19, 623–630. [Google Scholar] [CrossRef]
- Steinhorst, L.; Kudla, J. Calcium and reactive oxygen species rule the waves of signaling. Plant Physiol. 2013, 163, 471–485. [Google Scholar] [CrossRef]
- Hamanaka, R.B.; Chandel, N.S. Mitochondrial reactive oxygen species regulate cellular signaling and dictate biological outcomes. Trends Biochem. Sci. 2010, 35, 505–513. [Google Scholar] [CrossRef]
- Blanco, G.; Hornero-Méndez, D.; Lambertucci, S.A.; Bautista, L.M.; Wiemeyer, G.; Sanchez-Zapata, J.A.; Garrido-Fernandez, J.; Hiraldo, F.; Donázar, J.A. Need and seek for dietary micronutrients: Endogenous regulation, external signalling and food sources of carotenoids in New World vultures. PLoS ONE 2013, 8, e65562. [Google Scholar] [CrossRef]
- Hardison, E.A.; Eliason, E.J. Diet effects on ectotherm thermal performance. Biol. Rev. 2024, 99, 1537–1555. [Google Scholar] [CrossRef]
- Gilbert, A.L.; Miles, D.B. Food, temperature and endurance: Effects of food deprivation on the thermal sensitivity of physiological performance. Funct. Ecol. 2016, 30, 1790–1799. [Google Scholar] [CrossRef]
- Malzahn, A.M.; Doerfler, D.; Boersma, M. Junk food gets healthier when it’s warm. Limnol. Oceanogr. 2016, 61, 1677–1685. [Google Scholar] [CrossRef]
Disclaimer/Publisher’s Note: The statements, opinions and data contained in all publications are solely those of the individual author(s) and contributor(s) and not of MDPI and/or the editor(s). MDPI and/or the editor(s) disclaim responsibility for any injury to people or property resulting from any ideas, methods, instructions or products referred to in the content. |
© 2024 by the authors. Licensee MDPI, Basel, Switzerland. This article is an open access article distributed under the terms and conditions of the Creative Commons Attribution (CC BY) license (https://creativecommons.org/licenses/by/4.0/).