Abstract
The Amazon ecosystem plays a vital role in global climate regulation and biodiversity conservation but faces escalating threats from deforestation and degradation. The resulting secondary forests (SFs) provide a promising opportunity for Transformative Territorial Management, fostering restoration and enhancing conservation values. This study evaluated aboveground biomass (AGB), species diversity, forest structure, and soil properties in SFs of the Colombian Amazon along a chronosequence, from early to mature successional stages, in landscapes of mountains and of hills to identify key indicators for effective restoration management. The results show a consistent increase in AGB, species diversity, forest structure, and soil quality with forest age, though recovery patterns varied between both landscapes evaluated. Topographic differences influenced successional dynamics, with mountainous landscapes showing faster early recovery compared to the steadier, linear growth observed in hill areas. In hills, AGB at 10 years reached 12.65% of the biomass expected in a mature forest, increasing to nearly 42% by 40 years of abandonment, at a rate of 0.708 Mg C ha−1 year−1. In contrast, in the mountain landscape, AGB at 10 years reached approximately 8.35% of the carbon in a mature forest and increased to nearly 63.55% at 40 years. Forest age and soil properties emerged as primary drivers of AGB recovery, while diversity and forest structure played indirect but significant roles. In hill areas, soil conservation practices are critical for maintaining steady growth, whereas mountain regions benefit from assisted natural regeneration (ANR) to accelerate recovery. These findings highlight the importance of prioritizing the management of SFs as a central strategy for achieving restoration goals. Such practices are essential to enhance the ecological resilience of SFs and ensure their long-term sustainability, fostering their role as key contributors to restoration efforts and the provision of ecosystem services.
1. Introduction
The Amazon is one of the richest and most biodiverse biomes on Earth, with vast forests that remain largely undisturbed by direct human use [1]. It plays a crucial role in climate regulation as a major carbon reservoir [2] and serves as a vital refuge for biodiversity, housing nearly half of the world’s tropical forest species [3]. Despite its immense ecological significance, the Amazon biome is severely threatened by human activities, which compromise its integrity and resilience. These pressures have led to habitat loss, landscape fragmentation, and the disruption of fundamental ecological processes [4]. In the Colombian Amazon, deforestation is intensified by colonization processes that convert forests into pastures, trigger forest fires, and promote the establishment of illicit crops, further aggravated by illegal logging and mining activities [5]. These disturbances reduce biodiversity and undermine ecosystems’ capacity to recover from natural disruptions, adapt to climate change, and continue providing essential services, such as carbon storage in biomass [6].
Widespread deforestation has transformed Amazonian ecosystems into a fragmented mosaic of secondary forests (SFs), which currently cover about 4.1% of the Amazon biome. Evidence suggests that these SFs are caught in a destructive “Degradative Cycle” of regrowth followed by clearing, often occurring within five years or less. This cycle is particularly concerning in regions with high deforestation rates, where forest recovery is significantly hindered [7]. In the Colombian Amazon, 50% of SFs are found in areas heavily impacted by human activity [8]. Data show that 70% of these regenerating SFs are subsequently converted back into pastures, perpetuating the “Degradative Cycle” and severely compromising their ability to regenerate [8].
The management of SFs is essential to harness their functional potential while preventing them from falling into the previously mentioned “Degradative Cycle”. Ecological restoration, through assisted natural regeneration and enrichment planting, can serve as a key management strategy for enhancing the ecological and functional recovery of SFs. In addition, the ecological restoration of SFs can mitigate the adverse effects of deforestation and aligns with global initiatives such as the Bonn Challenge, which aims to restore 350 million hectares (Mha) by 2030, and the Kunming-Montreal Global Biodiversity Framework, targeting the rehabilitation of 30% of degraded areas by the same year. Achieving these ambitious goals presents a significant challenge for Colombia. The National Restoration Strategy, launched in 2024, sets an objective to restore 735,000 hectares by 2026, employing a comprehensive approach that adapts restoration actions to various contexts, including full, partial, and productive recovery [9]. Given the extensive distribution of SFs, effectively managing these areas is critical to achieving national and global restoration targets [10,11]. However, large-scale tree planting is prohibitively expensive for developing countries and often fails to restore native biodiversity effectively [12]. Therefore, it is vital to identify scenarios where the restoration of SFs can be optimized [12,13].
Restoring SFs requires integrating the existing knowledge of ecological processes such as natural regeneration and succession. The rate and success of recovering the composition, structure, and function of these forests depend on factors like forest type, climatic conditions, land-use history, and landscape configuration [14,15]. Consequently, restoration strategies must be tailored to these conditions and may include actions like Assisted Natural Regeneration (ANR), which promotes forest recovery by removing barriers to natural regeneration and enhancing biodiversity and resilience [16,17,18]. Other strategies involve enriching SFs with native species to accelerate succession and improve ecosystem functionality [19,20], implementing fire and livestock protection measures, and ensuring continuous monitoring.
This research aims to enhance the existing body of evidence on the ecological attributes that contribute to forest integrity in Amazonian ecosystems in Colombia [21], providing a foundation for strategies focused on Transformative Territorial Management centered around the ecological restoration of SFs. Previous studies have demonstrated that plant species richness increases as the duration since the cessation of productive activities lengthens, with a threshold influenced by the vulnerability of the plant community [22]. Additionally, SFs have been observed to exhibit trends toward biotic homogenization within plant communities [10]. Despite these findings, there remains a limited understanding of how aboveground plant biomass changes over time and how various environmental factors influence these dynamics. Evidence indicates that the speed and time required to recover aboveground biomass (AGB) are affected by factors such as forest type, climatic conditions, land-use history, seed dispersal, and the establishment of new trees [23,24,25,26]. The dominance or relative abundance of specific tree species groups, as opposed to shrub groups, also plays a significant role in shaping diversity, biomass stocks, and other functional attributes of SFs during succession [27]. Moreover, functional plant groups, such as nitrogen fixers, have been shown to enhance soil nutrient availability [28], positively impacting long-term biomass growth and optimizing soil carbon sequestration [29]. Furthermore, understanding how factors such as previous management intensity and landscape configuration influence soil and vegetation recovery is crucial for informing restoration efforts. Such insights are essential for developing effective restoration strategies and ensuring their successful implementation [15]. Therefore, this study aimed to assess the successional trends in the recovery of forest aboveground biomass carbon, tree diversity, and forest structure in a chronosequence of tropical SFs following the abandonment of cattle ranching according to two types of landscape (hill and mountain). We also evaluated the recovery of biomass in response to changes in forest age, species diversity, forest structure, and soil properties, which are key aspects for designing future strategies aimed at transformative ecological restoration in Colombian deforested areas.
2. Materials and Methods
2.1. Study Area and Sampling Design
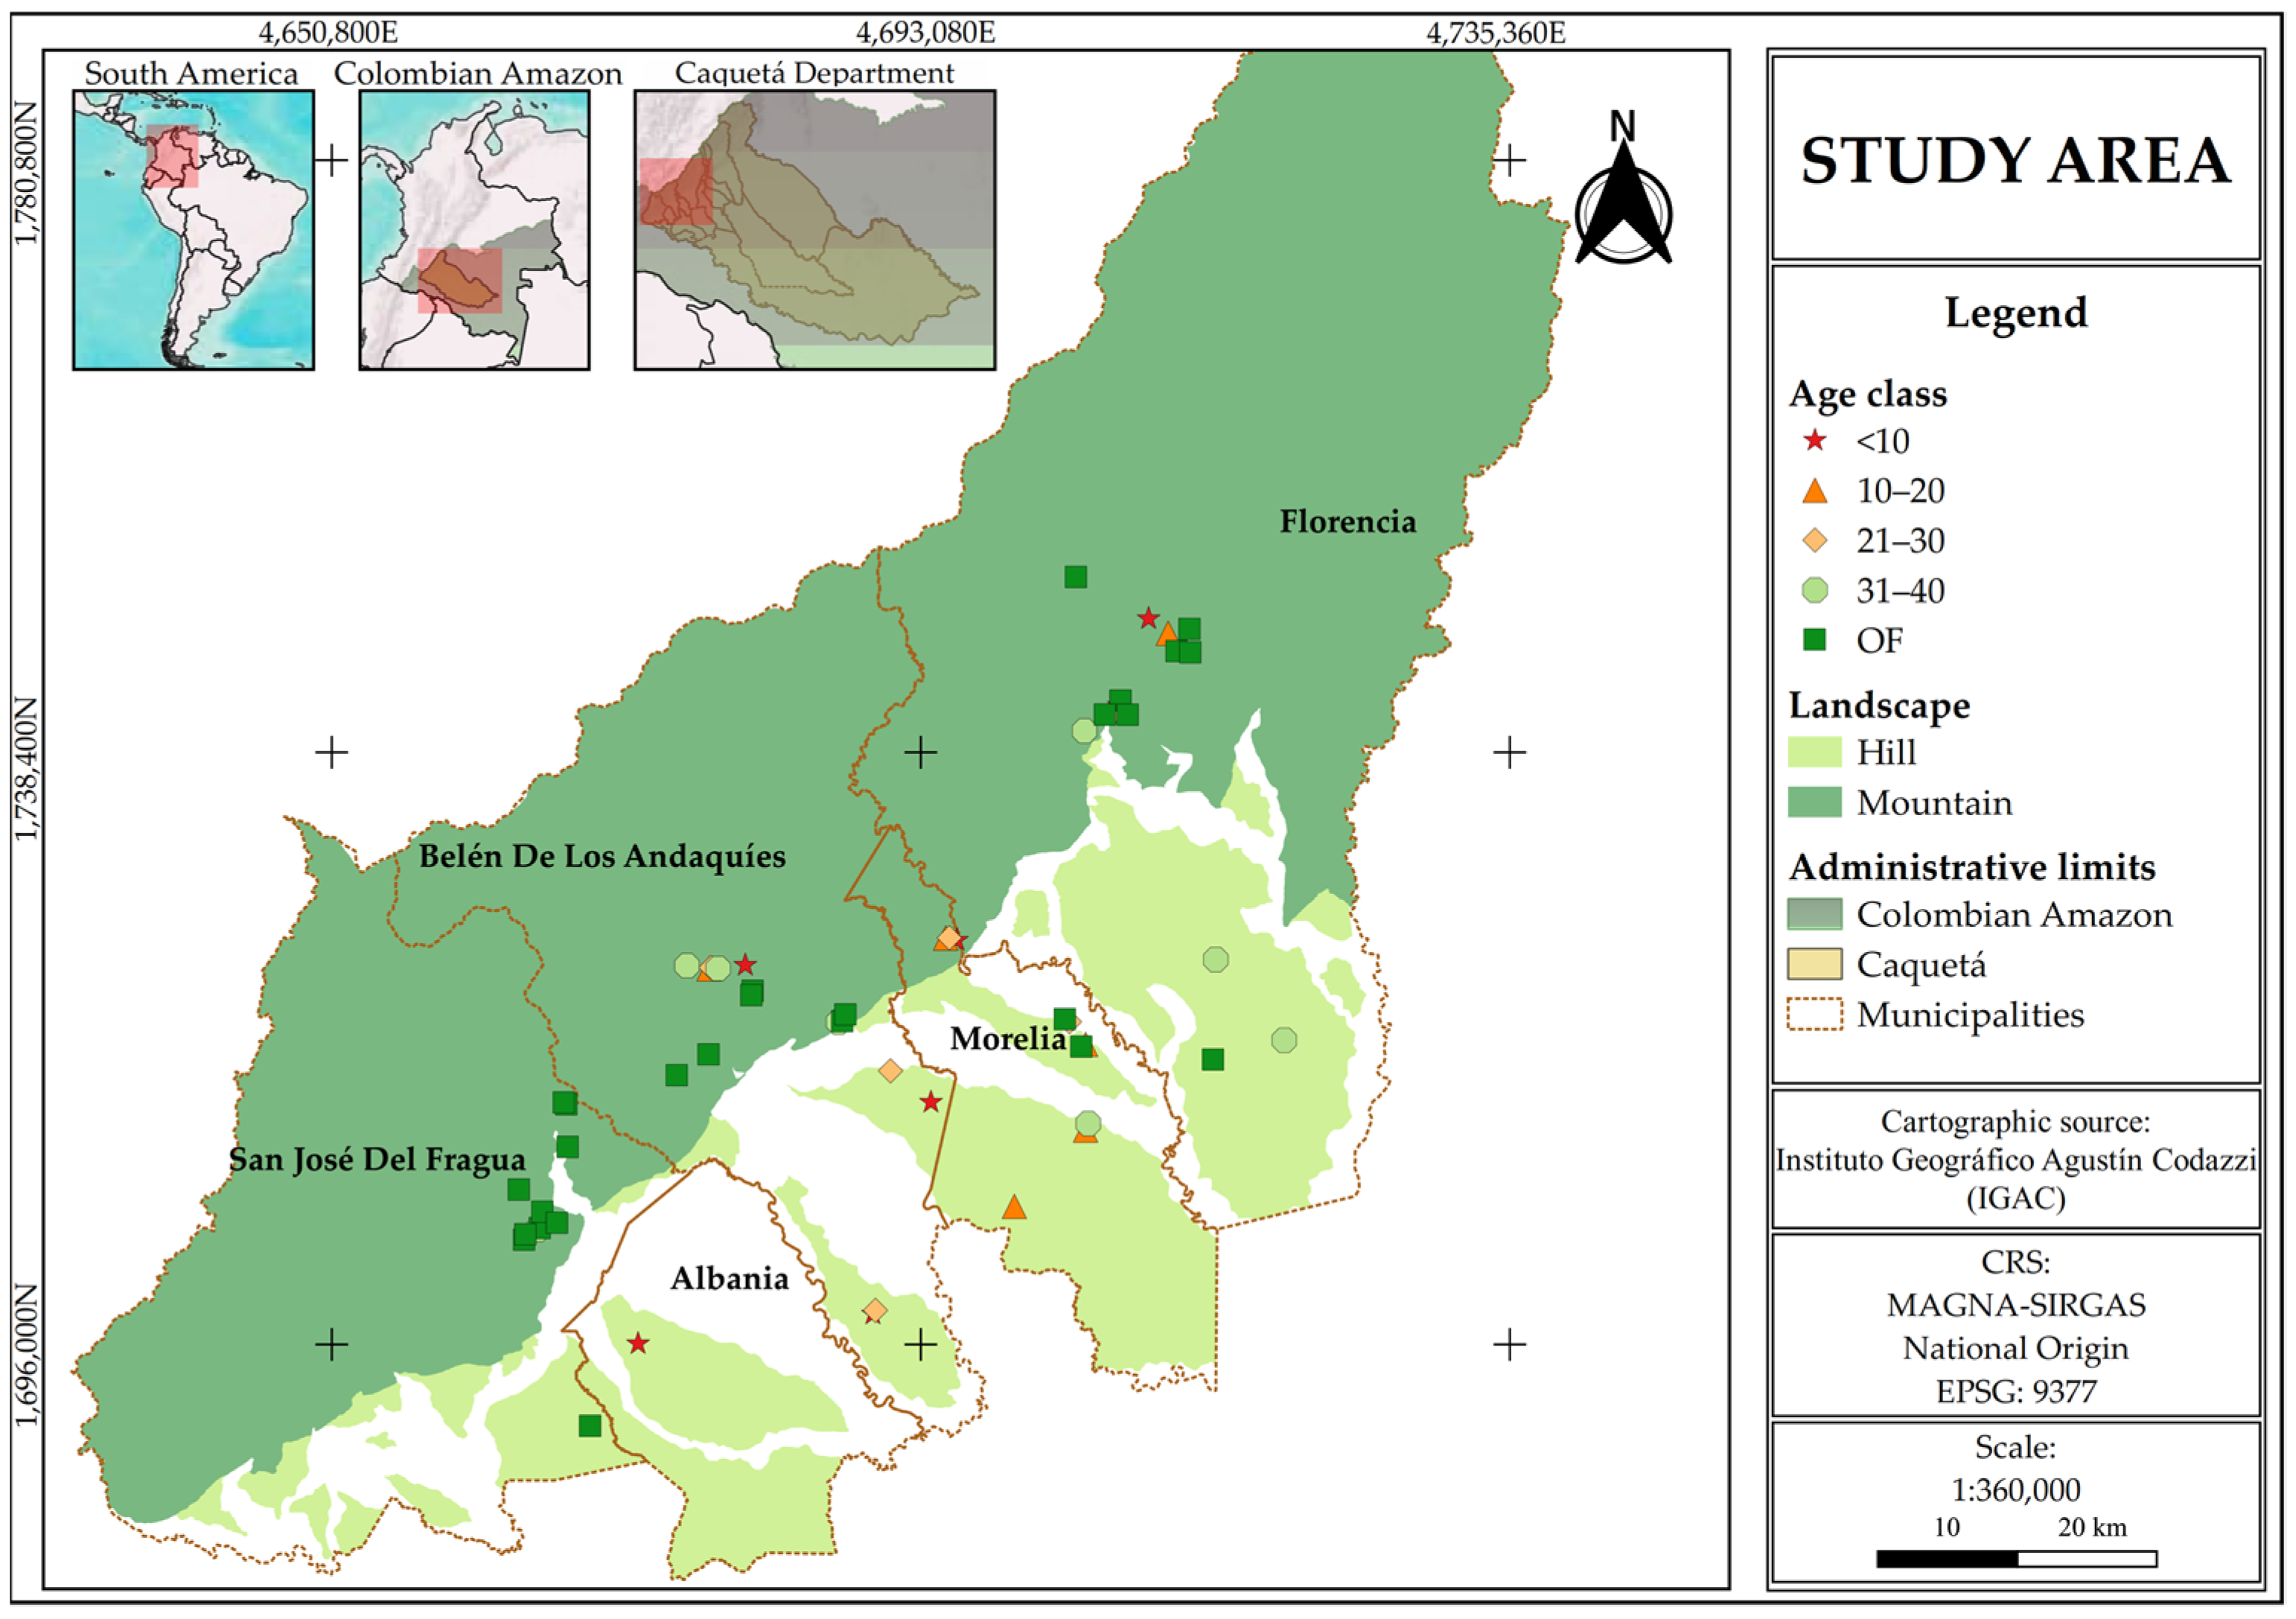
The study area is located in the department of Caquetá, in the northwestern Colombian Amazon, covering the municipalities of Florencia (1°36′50″ N; 75°36′46″ W), Morelia (1°29′09″ N; 75°43′28″ W), Belén de los Andaquíes (1°24′59.1″ N; 75°52′21.2″ W), San José del Fragua (1°19′52″ N; 75°58′28″ W), and Albania (1°19′44″ N; 75°52′42″ W) (Figure 1). The region’s climate is classified as humid tropical, with an average annual precipitation of 3235 mm, concentrated during a rainy season from March to June, and a mean temperature of 25° [30]. The predominant soils are Inceptisols and Oxisols, according to USDA classification, characterized by fine texture, drainage limitations, high acidity (pH ranging from 4.5 to 5.8), high aluminum saturation, and low base saturation. These soils have limited contents of carbon, phosphorus, potassium, and magnesium, affecting their fertility and aeration capacity [31].
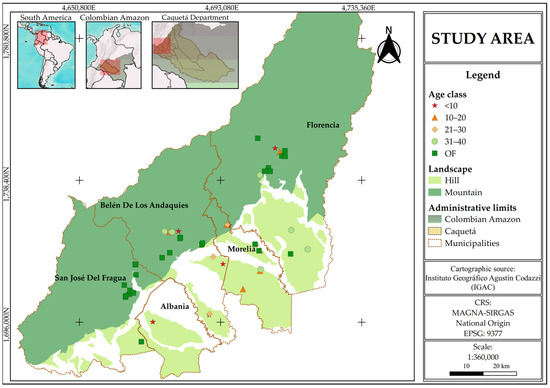
Figure 1.
Study area and distribution of forest sampling plots in Caquetá, Colombian Amazon.
This region comprises two main landscapes: hill and mountain. Hills, with altitudes below 300 m and slopes ranging from 7 to 12%, represent a typical undulating landscape of the Amazonian plains, primarily used for extensive cattle grazing and agriculture, with a high level of degradation and remnants of natural forests. In contrast, mountains, with altitudes above 300 m and slopes between 12.1 and 75%, form part of the Andean–Amazon transition and are dominated by natural forests, pastures, crops, and SFs [31,32].
Sampling sites were selected based on the age of land abandonment (chronosequence) and grouped into five successional categories in each landscape type: (i) sites <10 years, representing early successional stages with shrub and pioneer vegetation; (ii) 11–20 years, corresponding to young SFs; (iii) 21–30 years, representing intermediate SFs; (iv) 31–40 years, reflecting advanced SF stages; and (v) old-growth forest (OF), characterizing mature forests similar to those reported by Rodríguez-León et al. [32].
2.2. Vegetation Sampling
The data were collected from 54 plots of 50 × 50 m (0.25 ha) distributed across hill and mountain landscapes, selected based on the age of land abandonment (chronosequence). The identification of the plots was carried out through interviews with farm owners, who provided information about land-use history [32,33], and complemented with observations of specific vegetation attributes, such as floristic composition, species density, trunk diameter, and basal area [34]. Of the 54 sampled plots, 29 correspond to SFs aged between 5 and 40 years, while 25 represent OFs, distributed across various municipalities in the region (Table 1).

Table 1.
Number of forest plots sampled in secondary and old-growth forests in the Colombian Amazon.
Within each plot, all trees with a diameter at breast height (DBH) ≥ 1 cm were marked and identified to the species and family levels. The collected samples were processed, taxonomically determined, and stored at the “Colombian Amazon Herbarium-COAH” of the Sinchi Institute in Bogotá, Colombia, ensuring the traceability of taxonomic information [10,22].
2.3. Aboveground Biomass
To estimate the AGB of trees, the allometric equation developed by Chave et al. [35] was used. This equation is widely applied in tropical forest studies due to its ability to capture local variations in forest conditions [29,36]. The equation applied is as follows (Equation (1)):
where AGB represents the aboveground biomass in kilograms, WD is the wood density (g cm−3), DBH is the diameter at breast height (cm), and HT is the total tree height (m). This model has proven suitable for the study area as it incorporates local species data, ensuring accurate forest biomass estimates [29,35].
To calculate the carbon stored in AGB, wood carbon fractions (Wood CFs) were determined using the approach proposed by Doraisami et al. [37]. This method establishes conversion factors based on the wood density (WD) using the following equation (Equation (2)):
In this equation, WD is the wood density in g cm−3, while coefficients −3.5 and 49.3 represent the relationship between wood density and carbon fraction, respectively.
The calculated Wood CF values were multiplied by the estimated AGB for each tree to obtain the carbon stored in AGB. Finally, AGB values for all trees within each plot were summed, and the results are reported in Mg C ha−1.
2.4. Forest Diversity and Structure Indices
This study considered two key dimensions of biodiversity: taxonomic diversity and forest structure. To evaluate taxonomic diversity, three Hill numbers were used, essential tools for measuring effective diversity by considering species relative abundances [38,39]. Hill numbers are defined by three orders of “q” reflecting different degrees of sensitivity to relative abundance: species richness (q = 0), which includes all species equally; exponential of Shannon entropy (q = 1), which assigns less weight to rare species, considering both richness and evenness within a community (Equation (3)); and inverse Simpson diversity (q = 2), which assigns more weight to dominant species, assigning less importance to rare ones (Equation (4)). These indices were calculated using the “iNEXT” package in R [38].
In these equations, represents the proportion of individuals of species relative to the total number of individuals in the community, calculated as , where is the number of individuals of species and is the total number of individuals of all species. is the total number of species in the respective forest plot. Higher values in these indices indicate a more equitable species distribution within the community [40,41].
To quantify β-diversity and assess differences in species composition between plots, the Chao–Jaccard dissimilarity index was used. This index accounts for both observed and unobserved shared species among communities, reducing sampling bias (Equation (5)).
In this equation, U and V represent the relative abundances of shared species in the compared communities. Values close to 1 indicate high similarity, while values near 0 reflect marked differences [27]. These calculations were performed using the CommEcol package in R [42].
The forest structure was evaluated through various structural indices, including the mean diameter at breast height (DBH, cm), the mean total tree height (Height, m), the average wood density (WD, g cm−3), and the total basal area (BA, m2 ha−1) of all woody species per plot. These indicators provide a detailed perspective on the size and vertical distribution of trees in the forest community [43].
Additionally, to analyze the horizontal structure of the communities, the Importance Value Index (IVI) was used. This index combines relative abundance, relative dominance, and relative frequency of each species in the community (Equation (6)).
In this equation, Abun (%) is relative abundance, Dom (%) is relative dominance, and Frec (%) is relative frequency. IVI helps identify the species with the greatest ecological importance within the community [44]. Calculations were carried out using the BiodiversityR package in R [45].
2.5. Soil Properties and Landscape-Related Parameters
In each plot, three soil samples were randomly collected at a depth of 0 to 20 cm of the mineral soil layer on the same day as vegetation sampling. Following the methods described in Garate-Quispe et al. [36] and Coelho et al. [15], fifteen soil properties were analyzed using standardized laboratory techniques detailed in previous studies [10,32]. These included the organic matter content (OM, %) determined by the Walkley–Black method using potassium dichromate, while the total nitrogen concentration (N, %) was determined using the Kjeldahl method. Other analyses included pH, measured in a saturation paste using the conductimetric method of the USDA, and soil moisture saturation (SMS, %) determined gravimetrically in a saturation paste following the USDA method. The soil texture (percentages of clay, sand, and silt) was determined using the Bouyoucos method. Additionally, the effective cation exchange capacity (CEC, meq 100 g−1), exchangeable potassium (E_K, mg kg−1), and exchangeable calcium (E_Ca, mg kg−1) were determined by ammonium acetate extraction and quantified by ICP-OES spectroscopy. The iron concentration (Fe, mg kg-1) was measured using Mehlich I acid extraction, while the available phosphorus (P, mg kg−1) was determined by Bray II extraction. Magnesium (Mg_S, %) and aluminum (Al_S, %) saturation levels were calculated as the fraction represented by each relative to the effective cation exchange capacity (CEC, meq 100 g−1), expressed as a percentage. Finally, the soil organic carbon (SOC, Mg ha−1) was calculated using the method of Maia et al. [46], estimating the carbon concentration (g g−1) multiplied by the bulk density (kg cm−3) and soil layer thickness (m).
In addition, two landscape-related parameters were evaluated in each plot as follows: slope (%) and elevation (m) according to previous studies [10,22]. The slope was recorded with a laser hypsometer (Forestry Pro II), while the elevation was measured with a digital altimeter (GPSMAP 64CSX) similar to that reported by Rodríguez et al. [22].
2.6. Data Analysis
Generalized linear models (GLMs) were applied to evaluate the effect of forest age, landscape, and their interaction on AGB variable, as well as those related to species diversity, forest structure, and the physical–chemical properties of the soil using the lme function from the nlme package [47] in R language v. 4.3.3 [48] and the interface in InfoStat v.2020 [49]. A normal distribution was employed for all variables, except for tree species richness, where a Poisson distribution was used. The species diversity and forest structure variables were fitted for normal distribution with logarithmic transformation. The assumptions of normality and homogeneity of variances were validated through an exploratory analysis of the model’s residuals (n = 54), with quantile–quantile plots (QQ-plot) for normality and residuals vs. predicted plots (fitted-plot) for homoscedasticity. Corrections for heteroscedasticity for species diversity and forest structure variables were made by age class using the varIdent function [47] from the nlme package in R. When significant differences were found, a Fisher’s LSD test at 95% confidence was used to separate the means of the studied effects.
To model the recovery of biomass, biodiversity, and forest structure over the chronosequence, simple and quadratic linear regression functions were applied using the lm function, along with nonlinear regression models, such as logistic, monomolecular, and Gompertz, using the nls function from the stats package [50] in R, and Chapman–Richards using the sar_chapman function from the sars package [51] in R. The evaluation of the models included coefficients of determination (R2) and residual analysis to verify the quality of the fit, similar to that has been reported in previous studies [29,36].
A non-metric multidimensional scaling (nMDS) analysis (50 iterations) was conducted based on the Chao–Jaccard similarity index to visualize species composition across different age classes and landscapes using the metaMDS function from the vegan package in R [52]. The accepted stress level was ≤0.2, following the criteria of Oberleitner et al. [53] and Chao et al. [54]. A Permutational Multivariate Analysis of Variance Using Distance Matrices (PERMANOVA) based on Chao–Jaccard distance and 9999 permutations was performed using the adonis2 function from the vegan package in R [52]. The pairwise.adonis function with 9999 permutations from the pairwiseAdonis package in R [55] was used to conduct pairwise multi-level comparisons of the studied effects.
Finally, a Pearson correlation analysis and simple linear regression using the pairs.panels function from the psych package in R [56] were employed to study the bivariate relationships between the studied variables, and structural equation models (SEMs) were used to analyze direct and indirect causal relationships among forest age, soil properties, species diversity, floristic structure, and carbon in aboveground biomass. The SEM were conducted using the sem and semPaths functions from the lavaan package in R [57], utilizing latent variables that grouped the most relevant components and applying logarithmic transformations to improve model fit, similar to what has been reported in previous studies [15,22,29,36]. The multivariate analyses in R were performed using the interface in RStudio v. 2024.04.1 [58].
3. Results
3.1. Effects of Age and Landscape on the Recovery of AGB, Tree Diversity, and Forest Structure
The results of this study show a clear recovery pattern in forest structural and diversity attributes throughout succession (Figure 2 and Supplementary Figure S1). The GLMs revealed a significant effect of abandonment age on all forest attributes. Diameter at breast height, tree height, wood density, Shannon exponential diversity, and Simpson’s inverse diversity varied significantly across abandonment ages but not between landscape units (p > 0.05). Basal area, AGB, and tree species richness showed significant variations both across age classes and at the landscape level (both, p < 0.05). Additionally, the interaction between abandonment age and landscape was only significant for tree species richness (F = 12.20, p < 0.0001) (Supplementary Figure S1). This finding indicates that the recovery of tree species richness varied depending on both the successional stage and landscape type, being more pronounced in mountainous landscapes during advanced stages of succession.
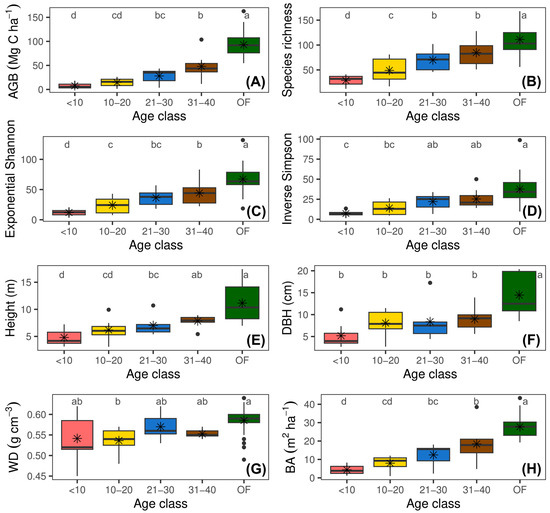
Figure 2.
Changes in forest structural and diversity attributes across four age classes of secondary forests and in reference forest following the abandonment of cattle ranching. (A) Aboveground biomass stock (AGB); (B) tree species richness; (C) exponential Shannon diversity (ExpH); (D) inverse Simpson diversity (1/D); (E) mean tree height (Height); (F) diameter at breast height (DBH); (G) wood density (WD); and (H) basal area (BA). Different letters indicate significant differences among age classes (Fisher’s LSD test; p < 0.05).
The AGB increased from 7.60 Mg C ha−1 in young vegetation plots (<10 years) to 84.08 Mg C ha−1 in OF plots (Figure 2A). This pattern was also evident in BA, which varied from 4.32 m2 ha−1 in young forests to 26.32 m2 ha−1 in mature forests (Figure 2H). Similarly, DBH increased from 5.30 cm in young vegetation plots to 12.81 cm in reference forests (Figure 2F), while height showed an upward trend with age, rising from 4.80 m in young vegetation plots to 9.62 m in reference forests (Figure 2E).
The WD showed a slight increase in more mature vegetation plots, reaching a maximum of 0.59 g cm−3 in reference vegetation plots (OF) (Figure 2G).
The mean tree species richness increased from 28.46 species in young vegetation plots to 115.72 in reference plots (Figure 2B). This trend was similar to what was observed in ExpH and 1/D, which reflect greater evenness in species distribution during advanced stages of succession (Figure 2C,D).
At the landscape level, higher averages of BA (15.57 m2 ha−1), AGB (42.57 Mg C ha−1), and tree species richness (66.90) were observed in mountains compared to those observed in hills.
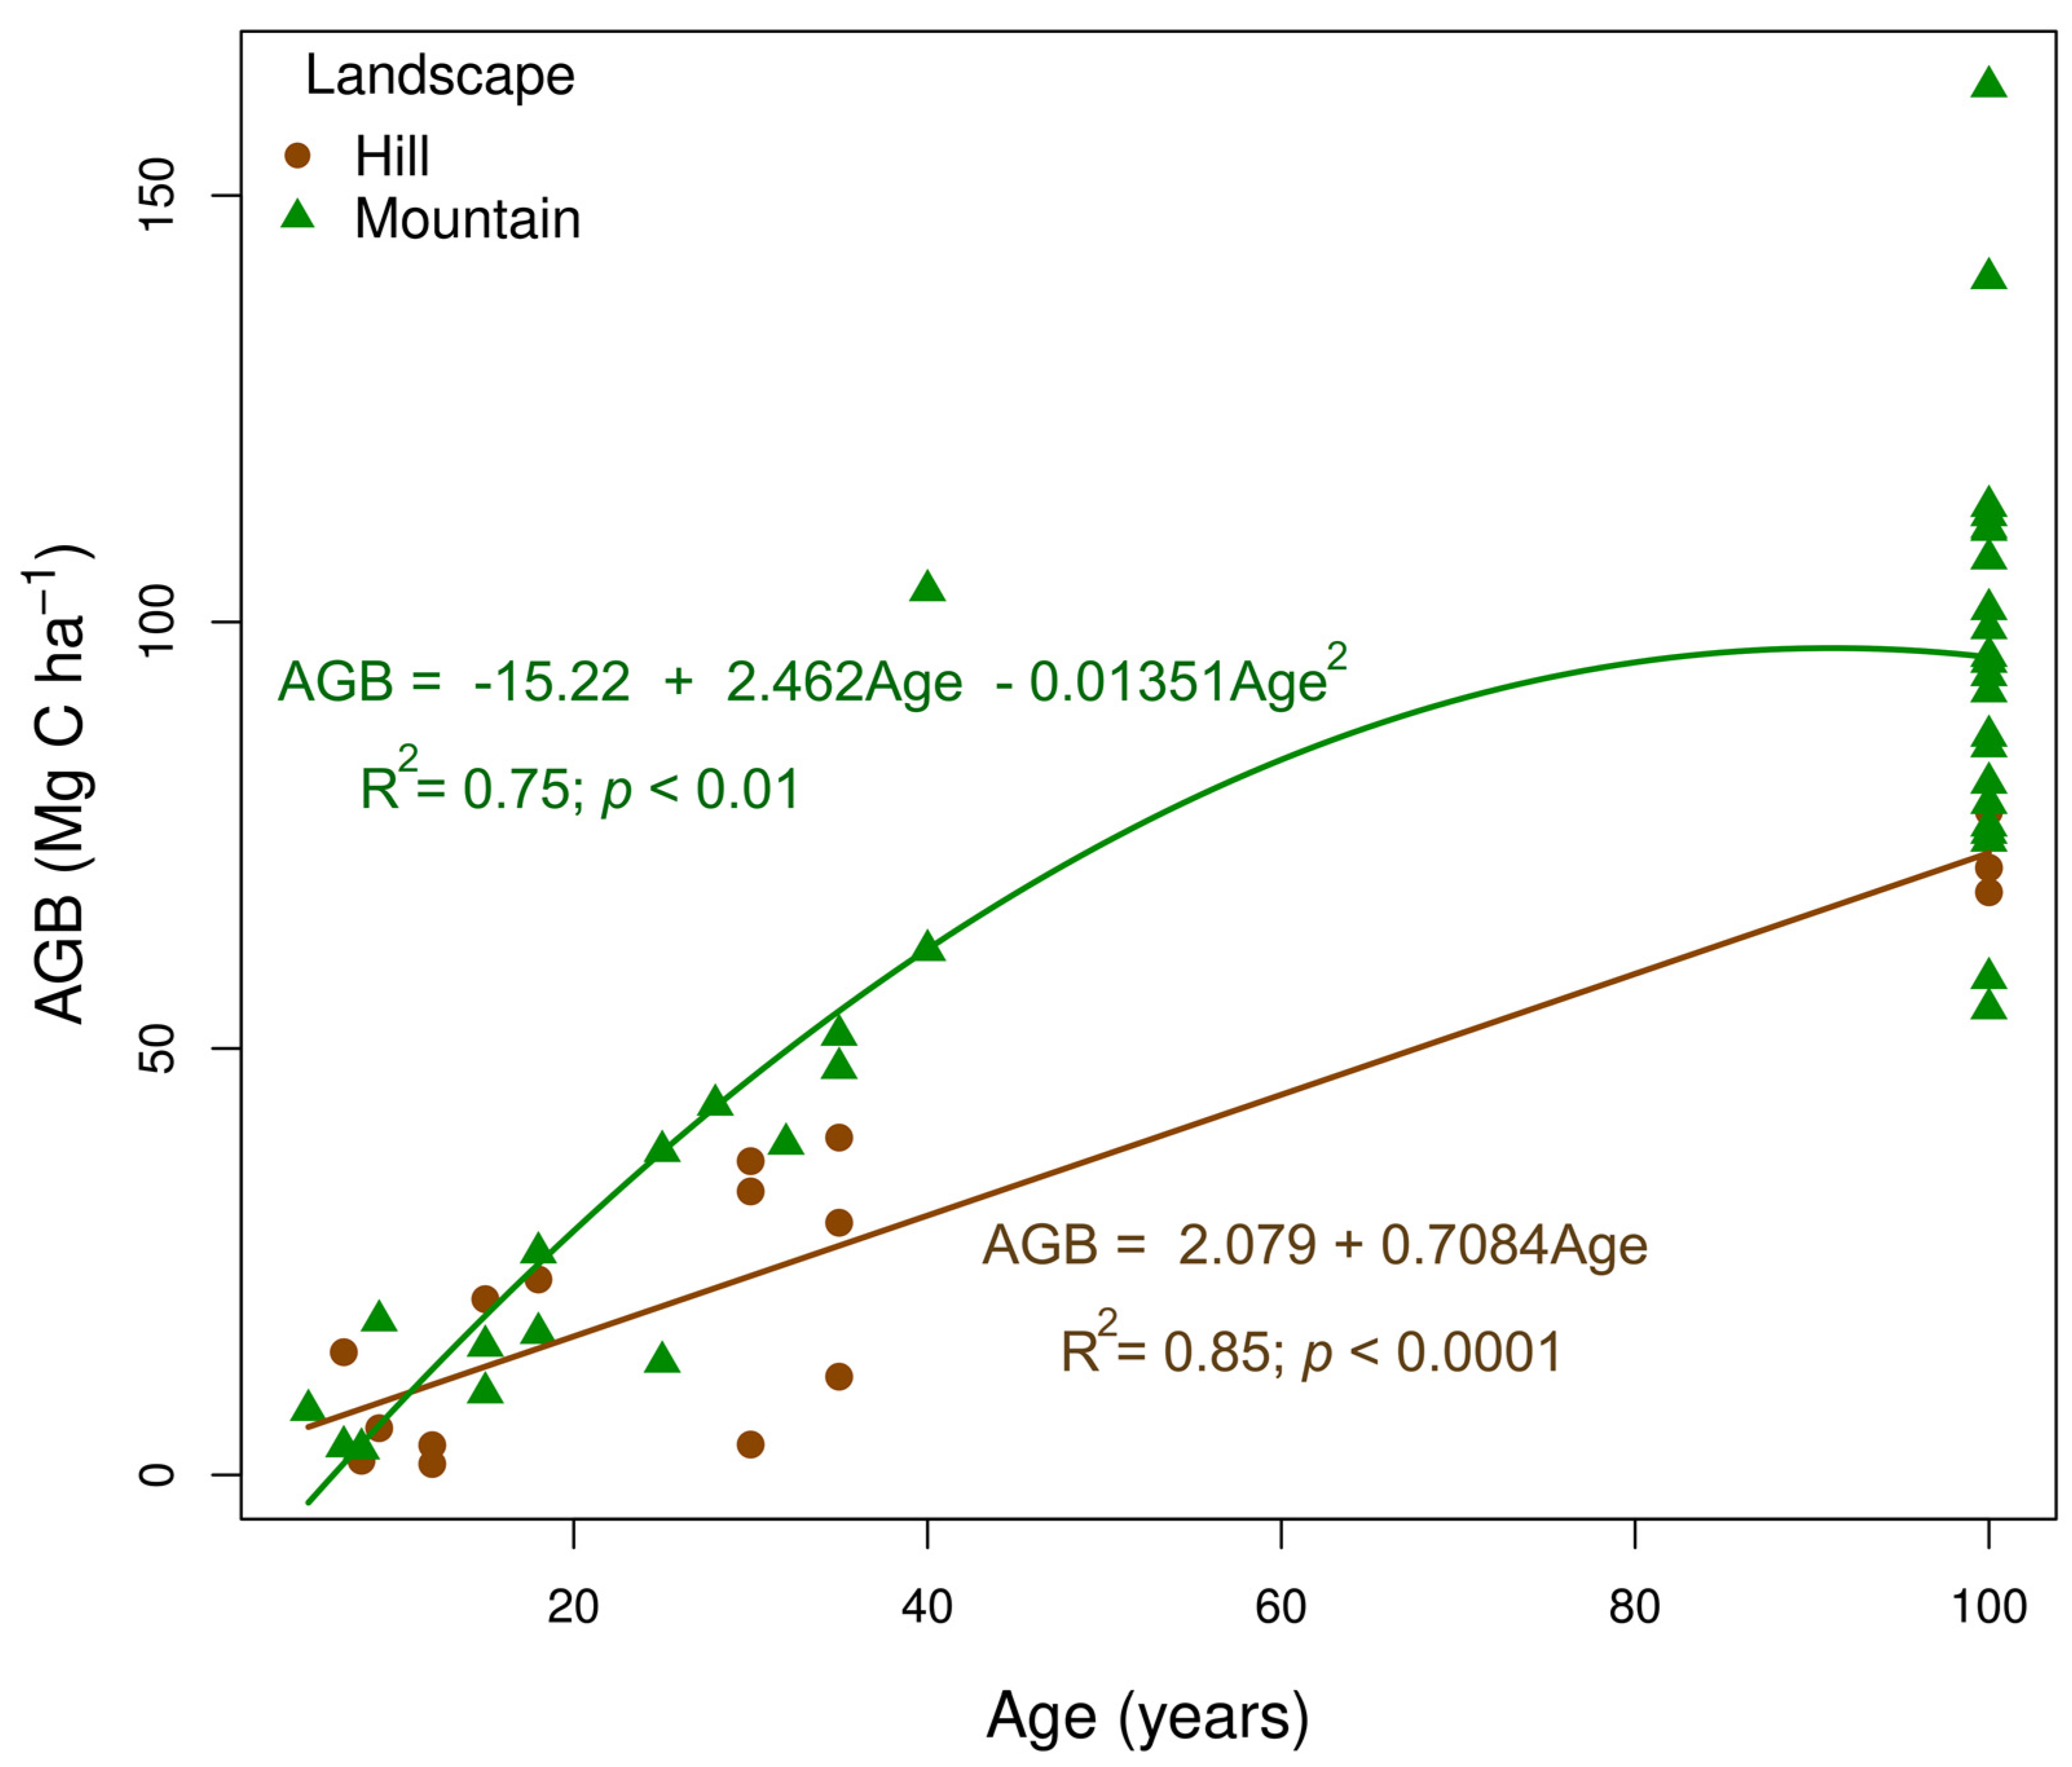
The rate of AGB (Mg C ha−1) accumulation throughout succession followed distinct patterns depending on the landscape type (Figure 3). In the hill landscape, AGB increased linearly (R2 = 0.85), reaching 12.65% of the biomass expected in a mature forest after 10 years and nearly 42% at 40 years of abandonment. This increase, at a rate of 0.708 Mg C ha−1 year−1, showed consistent growth over time. In contrast, in the mountainous landscape, the change in AGB followed a quadratic linear trend (R2 = 0.75), with a faster increase in the initial stages. In the mountainous landscape, AGB at 10 years reached approximately 8.35% of the carbon in a mature forest and increased to nearly 63.55% at 40 years. These findings suggest that the mountainous landscape provides a favorable environment for rapid recovery in the early stages, while the hill landscape shows a uniform, linear growth pattern.
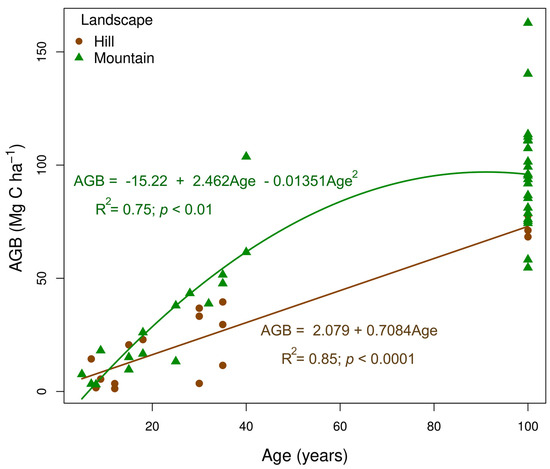
Figure 3.
Relationship between aboveground biomass carbon (AGB, in Mg C ha−1) and forest age in two landscape types (hill and mountain) across a chronosequence of natural regeneration following the abandonment of cattle ranching in the Colombian, deforested Amazon. The solid lines represent the fitted linear regression models for each landscape.
On the other hand, the recovery trajectories of various forest structural and diversity attributes, modeled using the Chapman–Richards functions and quadratic regression (Supplementary Figure S2), revealed how AGB, tree species richness, ExpH, 1/D, and BA followed a sigmoidal growth pattern, with AGB and BA showing the highest explanatory power (R2 = 0.77 and 0.73, respectively). Meanwhile, mean tree height, DBH, and WD exhibited quadratic trends with R2 values of 0.5, 0.47, and 0.21, respectively. Overall, a stabilization of growth curves for floristic attributes in terms of diversity and structure was observed after 80 years of abandonment of degraded pastures.
3.2. Soil Property Dynamics
The comparative analysis between hills and mountains revealed significant differences in several soil properties (Supplementary Table S1). Soils in hills showed a slightly higher SOC content, with 77.01 Mg ha−1 compared to 75.46 Mg ha−1 in mountains (p > 0.05). However, the pH was significantly higher in hill soils (4.46) than in mountain soils (4.15), indicating that hill soils are less acidic. This lower acidity is associated with a reduced aluminum saturation (Al_S), which was 75.06% in hill soils compared to 59.97% in mountain soils. Hill soils also exhibited a higher cation exchange capacity (CEC) (7.58 meq 100 g−1) compared to mountain soils (5.08 meq 100 g−1), reinforcing their ability to retain essential nutrients. On the other hand, mountain soils have a higher sand content (64.25%) and a lower clay percentage (24.68%), which could limit their capacity to retain water and nutrients.
The age of the plots’ vegetation influenced SOC accumulation. This parameter reached its maximum value in the plots’ aged vegetation between 10 and 20 years (81.90 Mg ha−1) and remained stable in older plots’ vegetation (OF, 80.83 Mg ha−1). Similarly, soil pH decreased with age, from 4.47 in young plots’ vegetation (<10 years) to 4.12 in older plots’ vegetation (>40 years), where a higher aluminum saturation (Al_S) (66.35%) was evident.
The CEC increased with plot vegetation age, reaching a maximum value of 7.86 meq 100 g−1 in the 31–40-year age class, indicating a greater nutrient retention capacity in older vegetation soils. Similarly, organic matter (OM) and total nitrogen (N) increased during the early stages of succession and stabilized in vegetation plots >40 years old. Regarding soil texture, the clay content increased with vegetation age, reaching 39.75% in soils aged 31–40 years, while the proportion of sand decreased throughout the chronosequence.
3.3. Changes in Dominance and Composition of Tree Species Throughout Succession
The five most abundant species showed differential dominance patterns throughout successional stages in the hill and mountain landscapes (Supplementary Table S2). In early successional stages (<10 years), pioneer species dominated in both landscapes, with Piptocoma discolor (Kunth) Pruski (IVI = 33.6%) and Trattinnickia boliviana (Swart) Daly (26.3%) in hills, while in mountains, Henriettea fascicularis (Sw.) M.Gómez (47.4%) and Bellucia grossularioides (L.) Triana (21.2%) were predominant. In intermediate successional stages (11 to <30 years), species such as H. fascicularis and Jacaranda copaia (Aubl.) D. Don dominated in hills, whereas in mountains, Cyathea lasiosora (Kuhn) Domin and Graffenrieda conostegioides Triana were prominent. In both stages, pioneer species began to lose importance to secondary species. In advanced succession (31 to <40 years), dominant species in hills included Tapirira guianensis Aubl. (IVI = 20.1%) and Inga thibaudiana DC. (15.2%), while in mountains, Casearia arborea (Rich.) Urb. (7.5%) and T. guianensis (20.1%) were significant, indicating a transition towards a more mature community. In the OF plots, the composition was dominated by species typical of mature forests, such as Pseudosenefeldera inclinata (Müll.Arg.) Esser (IVI = 18.4% in hills and 8.8% in mountains) and Virola elongata (Benth.) Warb.
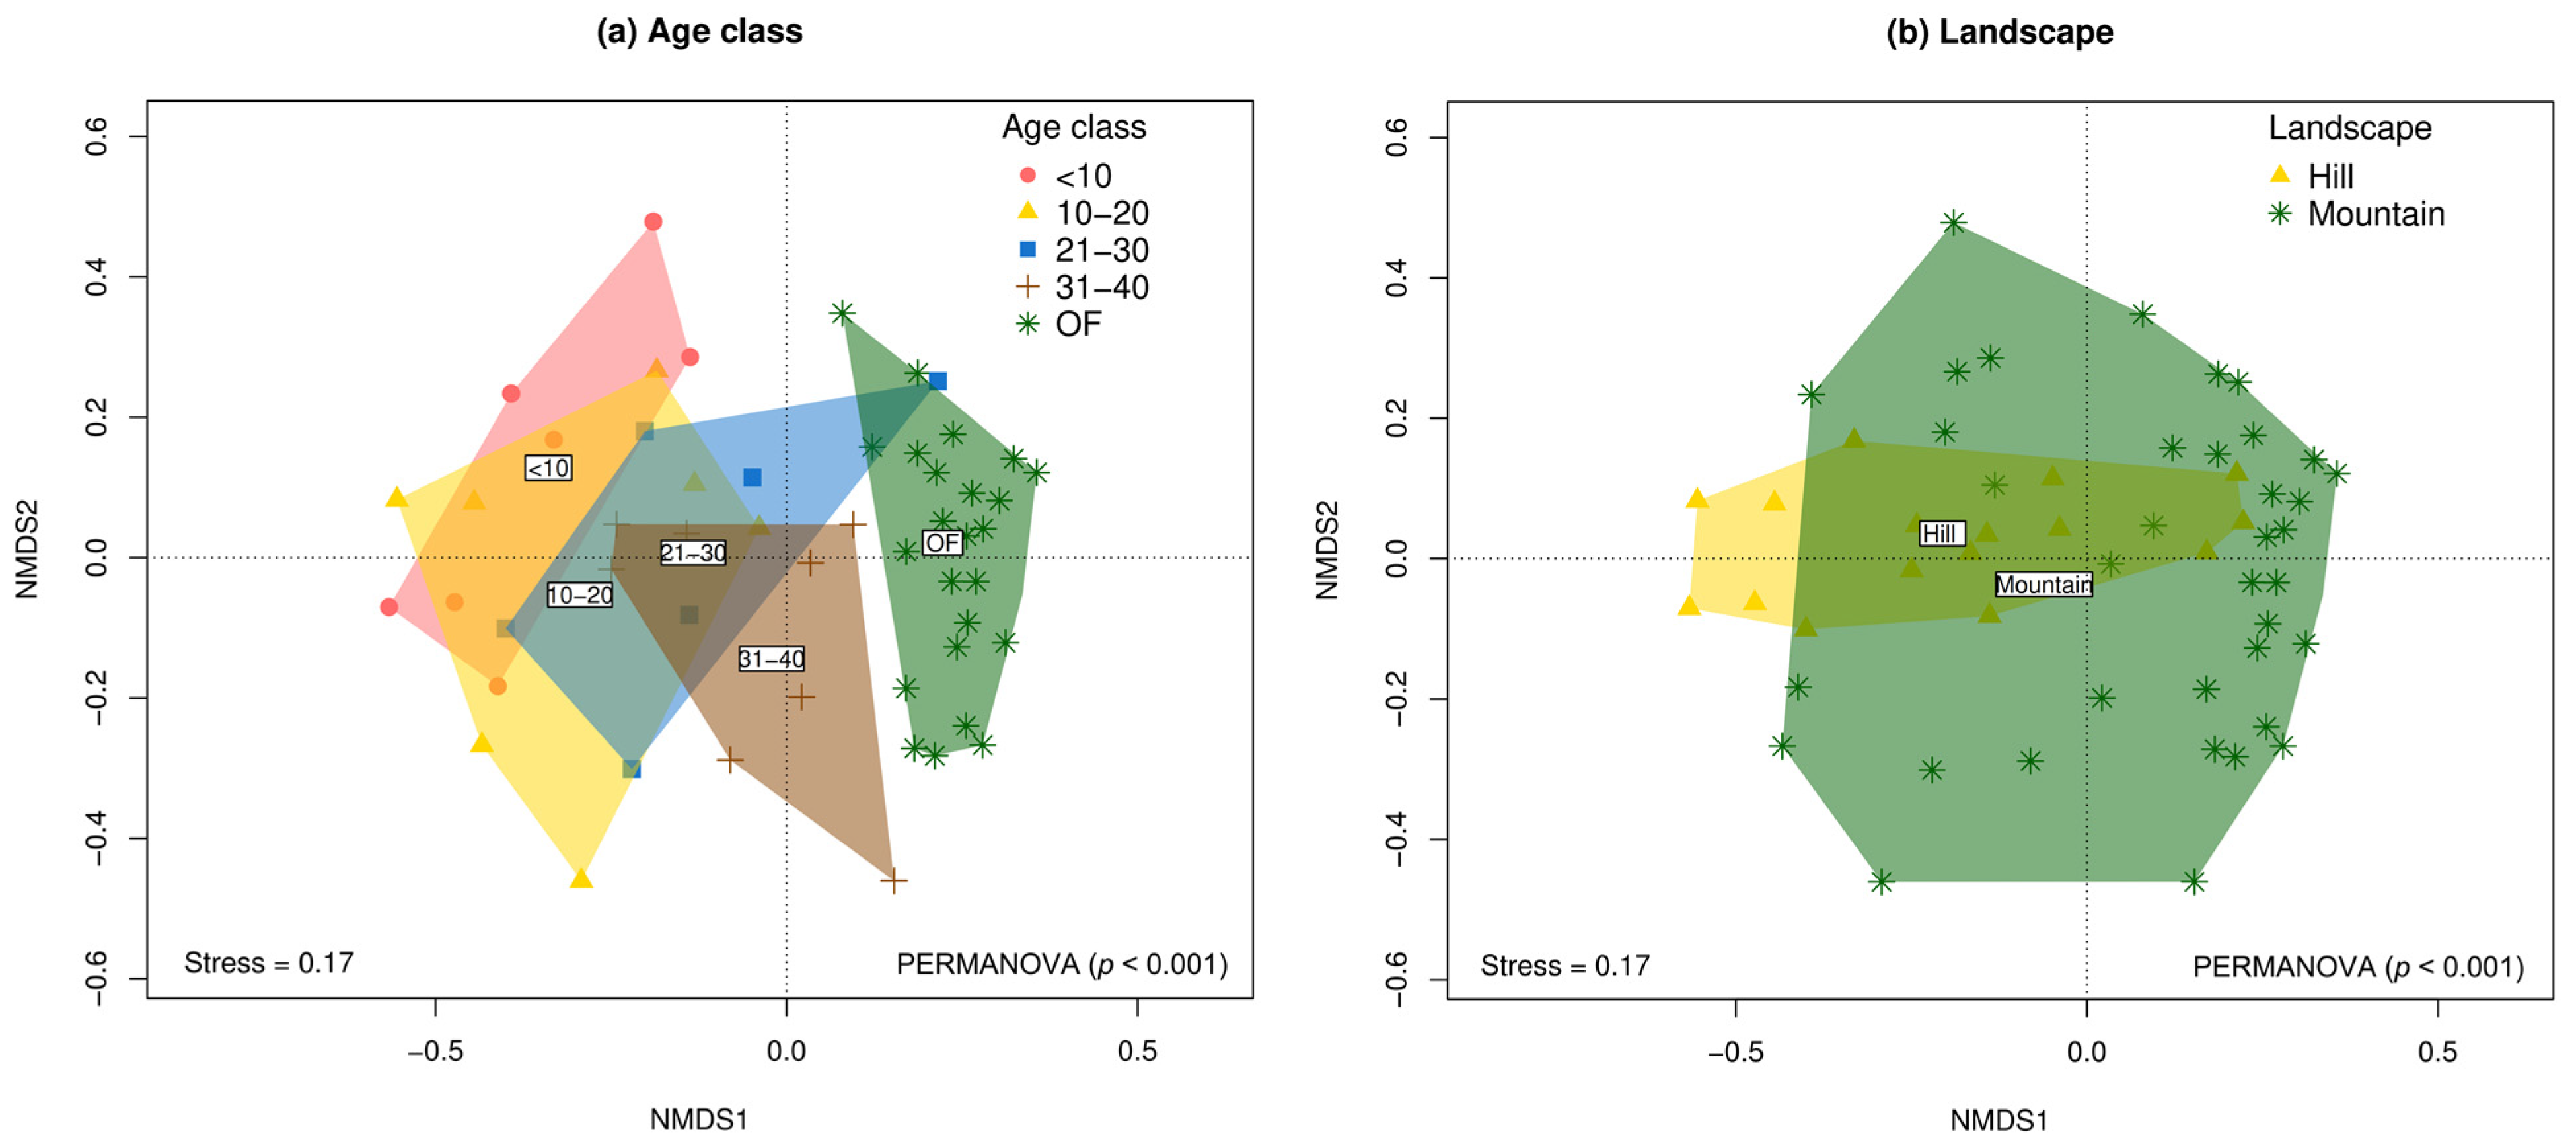
The results of the PERMANOVA and nMDS ordinations show significant variation in species composition both among age classes (F = 3.52; p < 0.001) and landscape types (F = 3.20; p < 0.001) (Figure 4 and Supplementary Table S3). Although the interaction age_class*landscape was not significant (p > 0.05), a greater divergence in the species composition was observed between SF and the reference forest in the hill landscape compared to the mountain (Supplementary Figure S3 and Supplementary Table S3). Consequently, post hoc pairwise comparisons revealed that tree species composition varied significantly between early regeneration stages (<10 years) and the oldest vegetation plots (OFs). In this regard, the community composition of the four SF categories differed significantly from the reference forest, and the SFs aged 31–40 years was significantly different from the SFs aged <10 and 10–20 years (p < 0.05) (Supplementary Table S4).
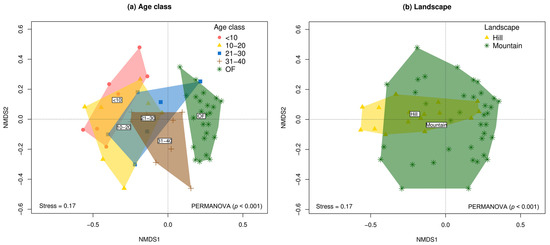
Figure 4.
Non-metric multidimensional scaling (nMDS) ordinations of tree community composition (beta diversity) based on Chao–Jaccard similarity between natural regeneration plots following abandonment of cattle ranching and reference forests in the Colombian, deforested Amazon. (a) Age classes. (b) Landscapes.
3.4. Bivariate Relationships Between Biomass, Diversity, Structure, and Soil Properties
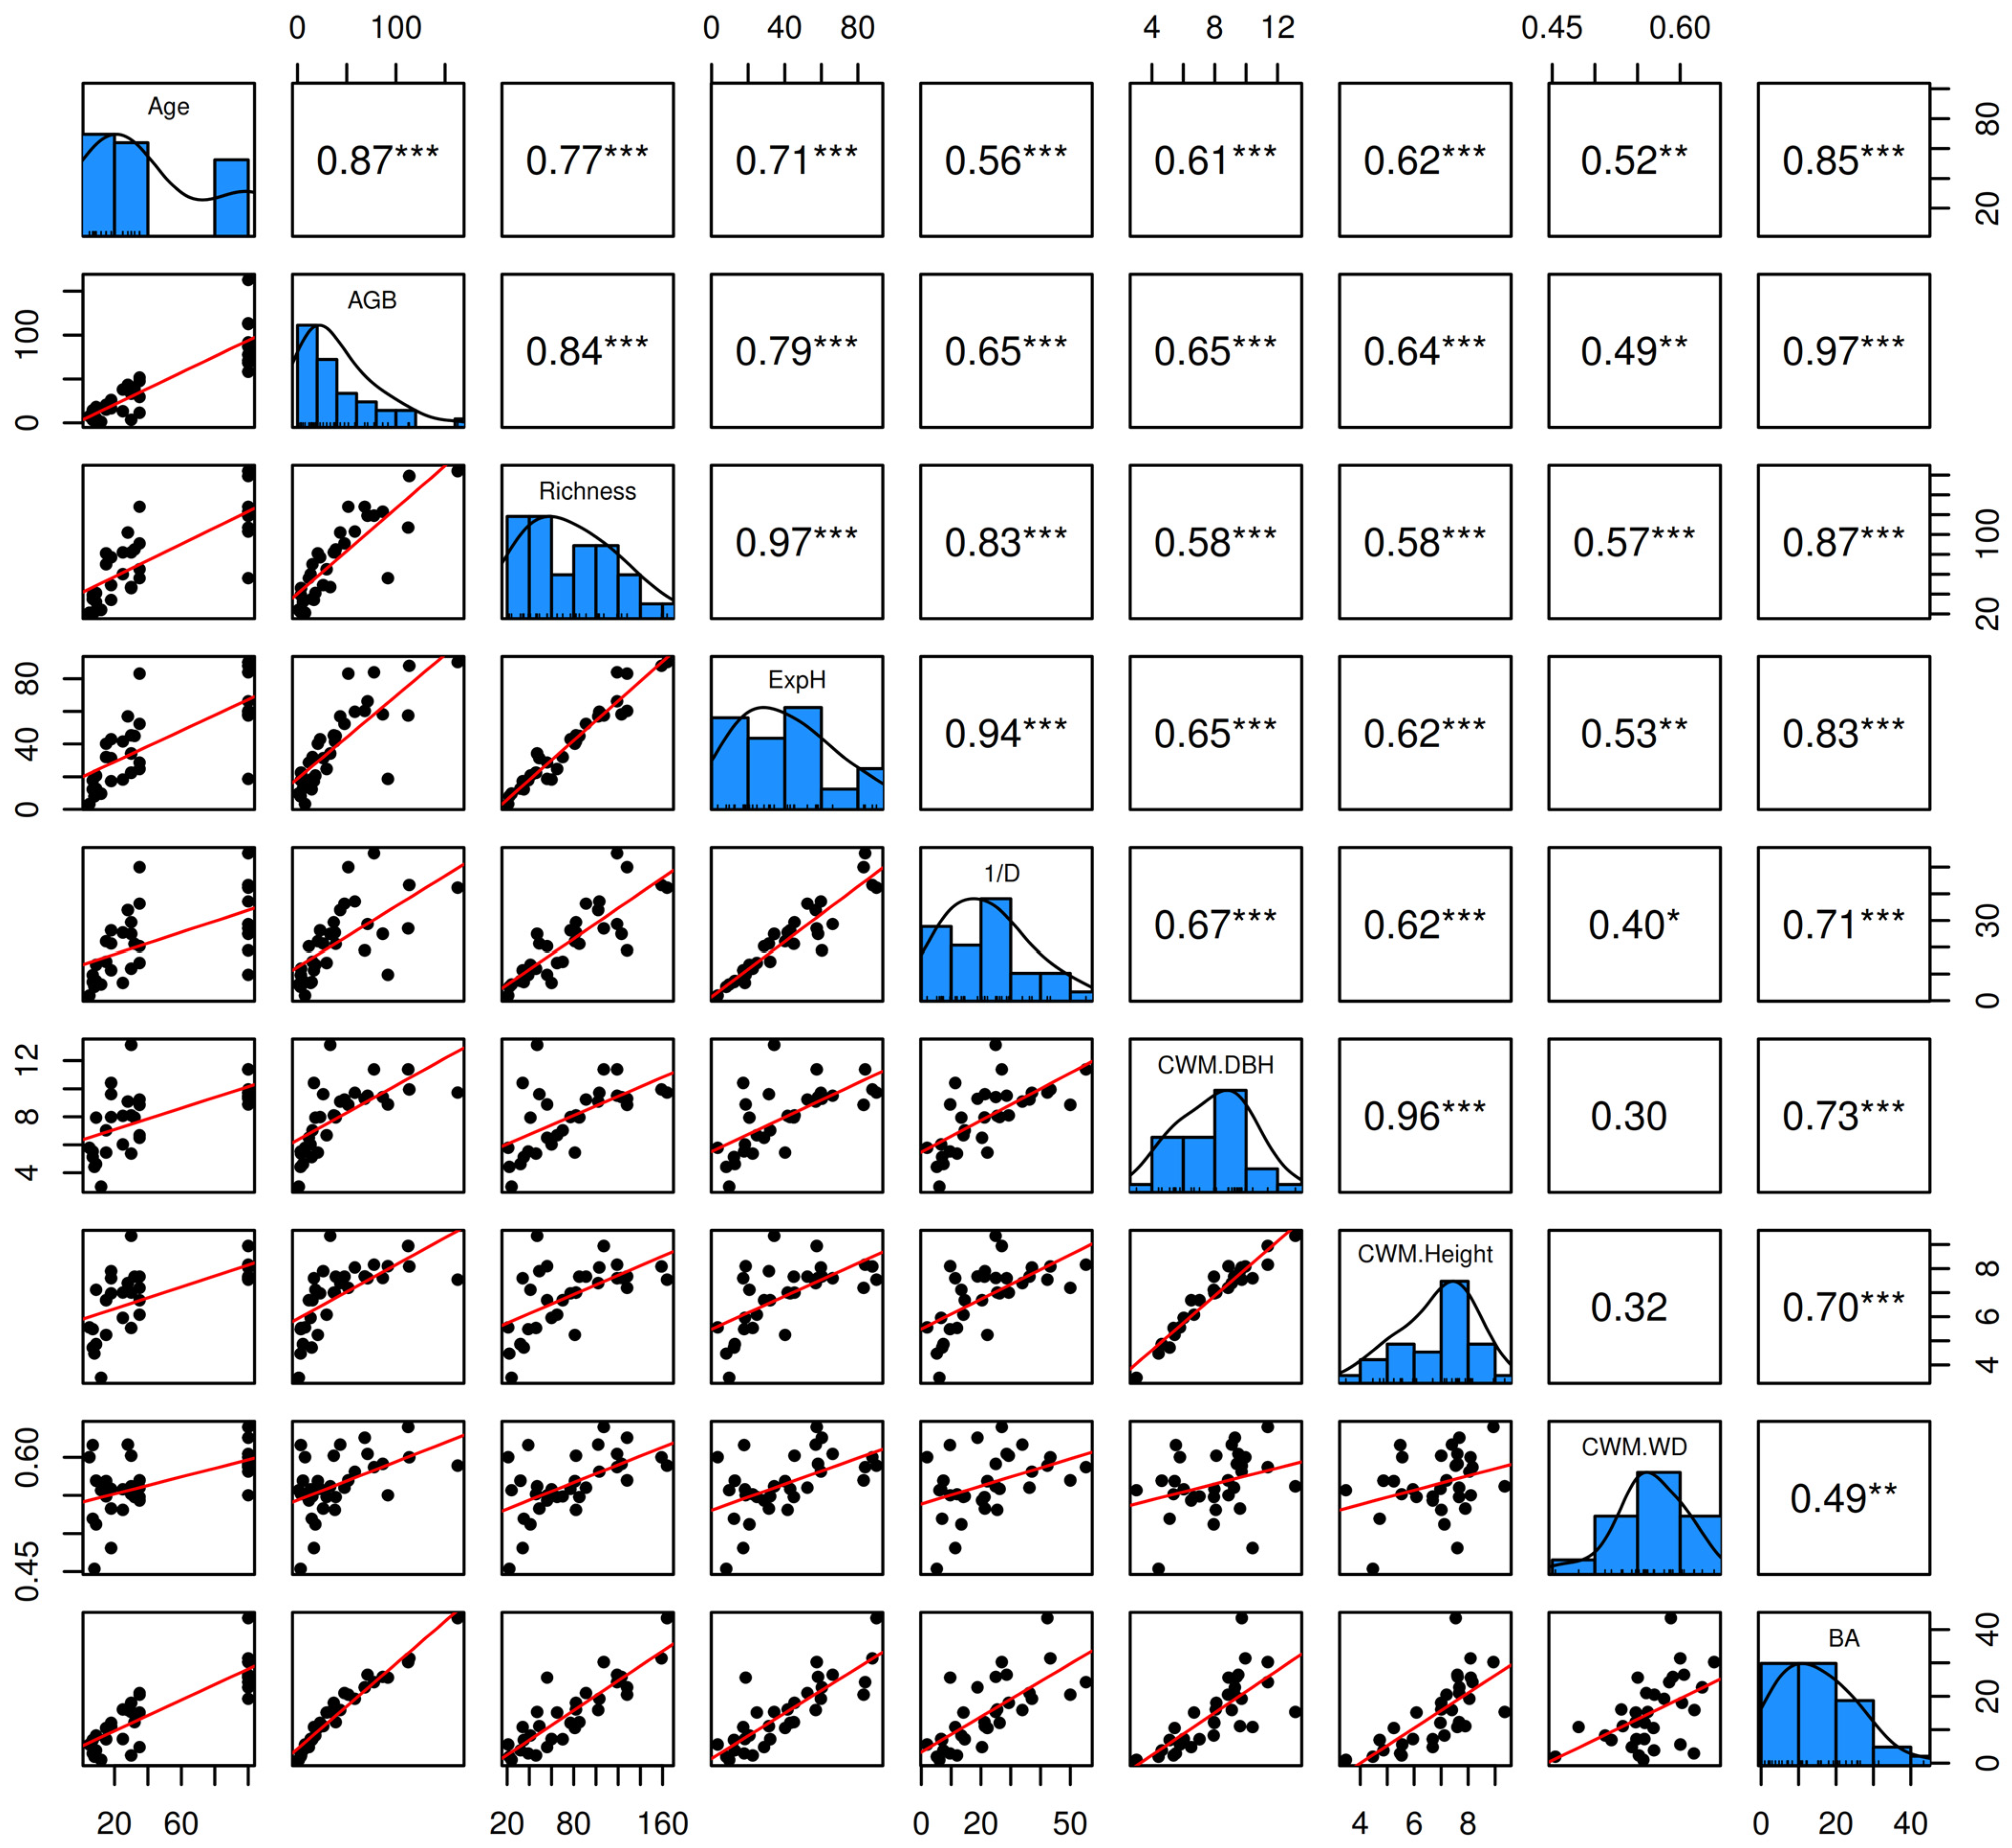
Figure 5 reveals a strong positive correlation between forest age (Age) and various structural and diversity metrics, such as aboveground biomass carbon (r = 0.87, p < 0.0001), tree species richness (r = 0.77, p < 0.0001), and ExpH (r = 0.71, p < 0.0001), indicating that forest aging promotes both carbon accumulation and diversity. Similarly, BA showed a significant correlation with Age (r = 0.85, p < 0.0001) and AGB (r = 0.97, p < 0.0001). Community-weighted mean diameter (CWM.DBH) and height (CWM.Height) were also positively correlated with forest age (r = 0.61 and r = 0.62, respectively; both, p < 0.01). On the other hand, although community-weighted mean wood density (CWM.WD) showed moderate positive correlations with Age (r = 0.52, p = 0.0025) and AGB (r = 0.49, p = 0.0049), its relationship with other structural metrics, such as CWM.DBH and CWM.Height, was less evident (both, r < 0.4; p < 0.05).
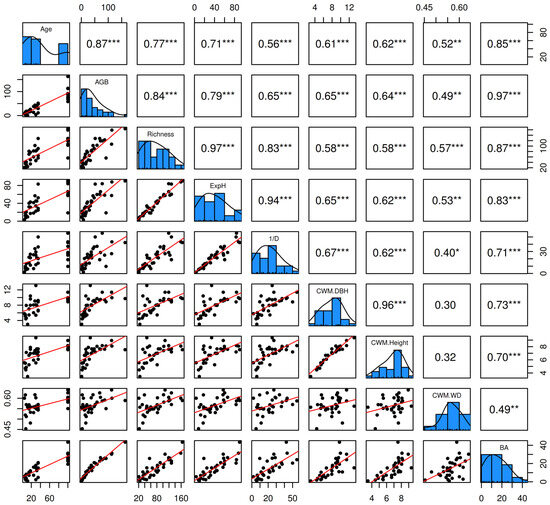
Figure 5.
Pairwise correlation matrix among the key variables forest age (Age), aboveground biomass carbon (AGB), tree species richness (Richness), exponential Shannon diversity index (ExpH), Simpson’s diversity index (1/D), community-weighted mean diameter at breast height (CWM.DBH), community-weighted mean tree height (CWM.Height), community-weighted mean wood density (CWM.WD), and basal area (BA).
On the other hand, significant correlations between soil properties and AGB were observed (Supplementary Figure S4). Thus, a significant negative correlation between AGB and soil pH was evidenced, and a significant positive correlation with exchangeable magnesium (Mg_S). SOC showed no significant correlation with AGB, but strong positive correlations with SMS, OM, and N were observed. Soil moisture saturation presented positive correlations with Clay and Silt and negative correlations with Sand and Mg_S, highlighting the ability of soils with a higher proportion of clay and silt to retain water. Cation exchange capacity correlated positively with SOC, Clay, and Al_S and negatively with Sand and Mg_S. Aluminum saturation (Al_S) showed a negative correlation with Mg_S, evidencing a possible competitive interaction between these elements in soils with high CEC.
3.5. Influence of Age, Diversity, Structure, Soil Properties and Landscape-Related Parameters on Biomass
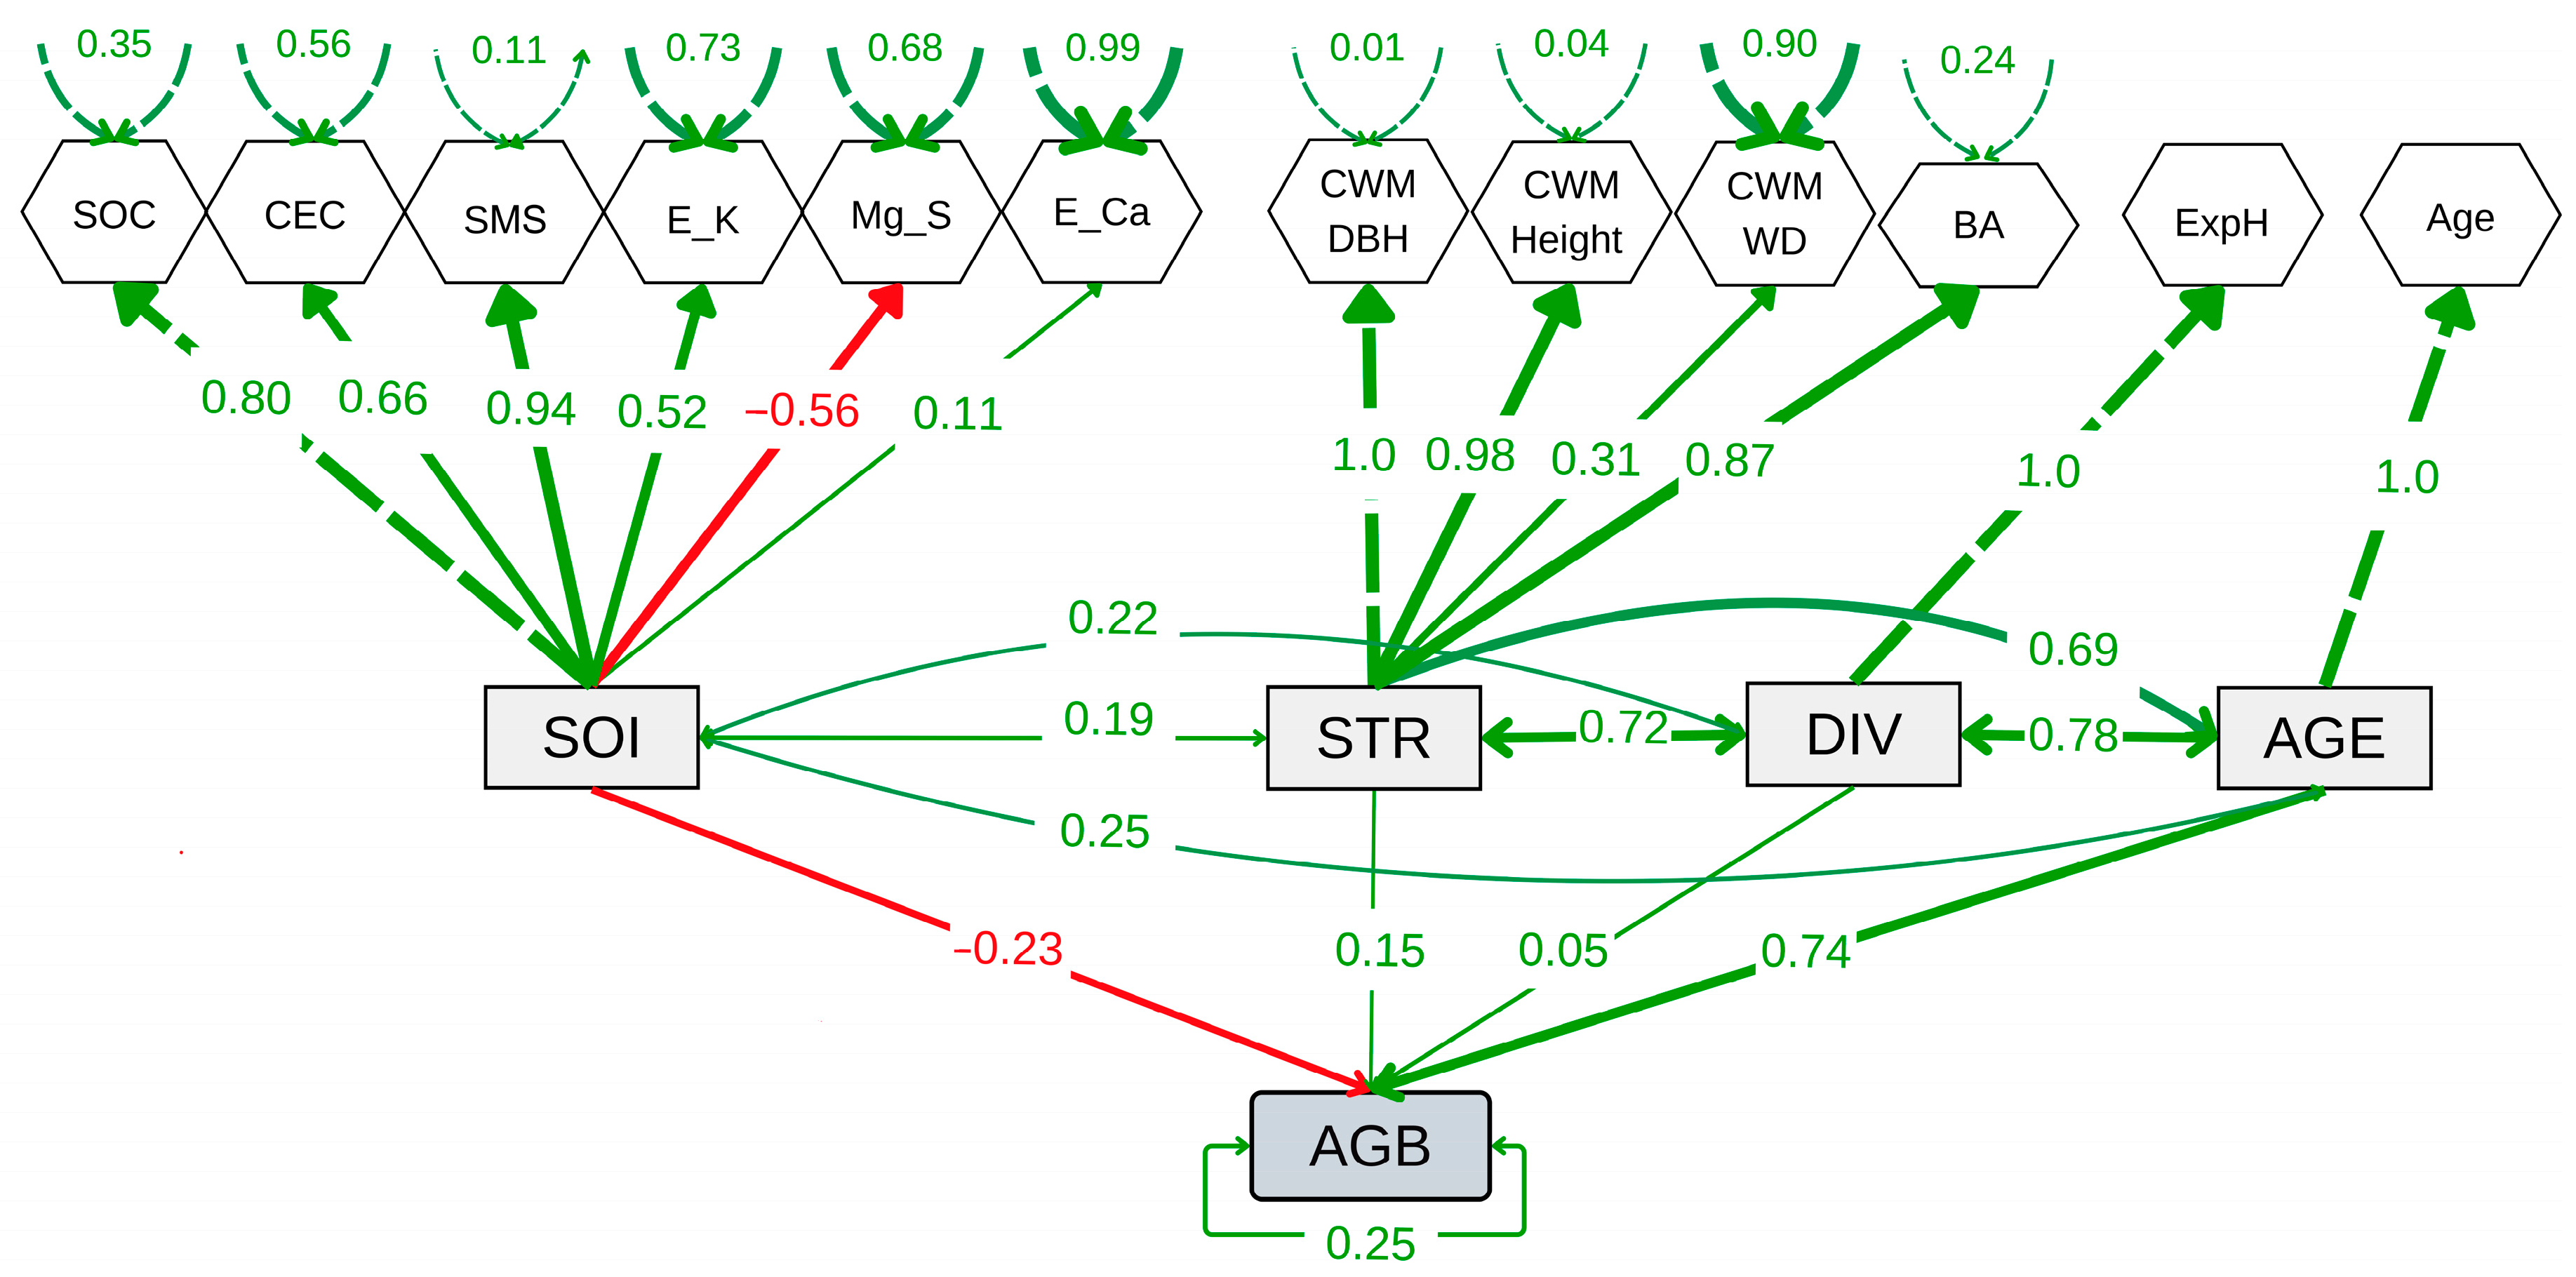
The SEM showed a good fit compared to the baseline model and converged (CFI = 0.78, lower AIC and BIC values, and Test statistic = 142.74, p < 0.001) (Figure 6 and Supplementary Table S5). The SEM revealed a significant positive effect of forest age (AGE) (E = 0.74, p < 0.001), but not of tree diversity (DIV) or forest structure (STR) on AGB. However, a slightly negative effect of soil properties (SOI) on AGB was observed (E = −0.23, p = 0.024). In contrast, SOI showed no significant relationship with STR (covariance = 0.192, p = 0.312) or DIV (covariance = 0.218, p = 0.253) (Figure 6). The age-mediated effect on STR was significant and positive (covariance = 0.69, p = 0.001), indicating that STR improves with AGE. Similarly, the relationship between DIV and STR was significant (covariance = 0.72, p = 0.001), highlighting the importance of diversity in shaping STR. The covariance between AGE and DIV was positive and highly significant (covariance = 0.78, p < 0.001), suggesting an increase in diversity as ecological succession progresses. These results demonstrate that SFs’ age and diversity play a predominant positive role in forest structure over time. No significant effect of the landscape-related parameters (elevation or slope) on AGB was observed. On the contrary, the inclusion of these variables increased the SEM parameterization and reduced its fit; therefore, they were excluded from the final model.
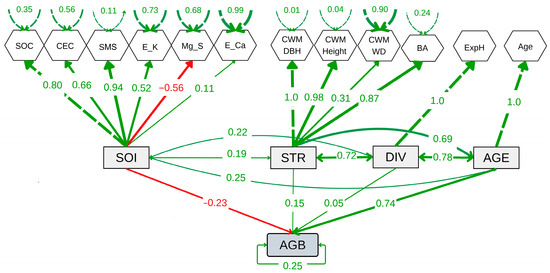
Figure 6.
Structural equation model showing the relationships among aboveground biomass carbon (AGB), forest age (AGE), tree diversity (DIV), soil properties (SOI), and forest structure (STR). DIV, STR, and SOI are latent variables constructed from observed indicators such as the log-transformed exponential Shannon index (ExpH), log-transformed community-weighted mean diameter at breast height (CWM.DBH), log-transformed community-weighted mean tree height (CWM.Height), log-transformed community-weighted mean wood density (CWM.WD), log-transformed mean basal area (BA), log-transformed soil organic carbon (SOC), cation exchange capacity (CEC), soil moisture saturation (SMS), log-transformed exchangeable potassium (E_K), exchangeable magnesium (Mg_S), log-transformed exchangeable calcium (E_Ca), and log-transformed forest age (Age).
4. Discussion
4.1. Aboveground Biomass and Forest Structure Recovery
The recovery of carbon in AGB observed in this study follows a similar pattern to that reported in other studies of tropical SFs. The increase from 7.60 Mg C ha−1 in young vegetation plots to 84.08 Mg C ha−1 in mature vegetation plots aligns with research highlighting these ecosystems’ capacity to rapidly accumulate carbon after the abandonment of agricultural or mining activities [14,29,36,53,59]. Tropical forests are crucial for climate change mitigation, storing more than 60% of terrestrial carbon in their AGB [60]. The differential recovery patterns between hills and mountains reinforce that topographic conditions influence forest recovery dynamics. In mountainous landscapes, where AGB growth follows a quadratic pattern, accumulation is more rapid in the early successional stages. Such a pattern may be due to higher moisture retention and better microclimatic conditions [61]. In contrast, AGB growth in hills is linear, reflecting a steadier but less efficient accumulation [33]. However, it is possible that the relatively small sample size (i.e., hills with n = 16) may not accurately represent the population, which could indicate that the rate of change in AGB is less pronounced than that shown in the simple linear model presented in Figure 3. This is particularly due to the limited data available on AGB in older vegetation plots (OFs) within the hilly landscape.
The improvement in structural parameters, such as DBH and BA, as the forest ages advances supports the idea that more mature forest communities develop greater structural complexity, facilitating biomass accumulation [62,63]. Additionally, the increase in WD suggests a transition toward slower-growing species with denser wood, which has also been observed in other studies [14,64]. The vegetation age of the plots has a significant impact on the accumulation of SOC and CEC. This indicates that the early stages of succession are marked by the rapid incorporation of organic matter and cations from plant residues. At the same time, soil pH decreases with age, reflecting an acidification process driven by the accumulation of organic acids and the leaching of basic cations. This process is further accompanied by an increase in aluminum saturation in older vegetation plots, which may restrict nutrient availability, especially in hill landscapes [15,29,32]
Soils with higher clay content and SMS were positively correlated with these structural parameters (DBH and Height), indicating that more fertile soils with better water retention facilitate the establishment of larger, taller trees [35]. Despite soil variation, the relationship between soil properties and biomass was limited, suggesting that stand structure and species composition play a more significant role in biomass recovery [65]. These findings are consistent with previous studies indicating that, while soil properties are important, their impact on biomass is indirect, mediated by structure and diversity [66].
4.2. Species Composition and Diversity
The increase in tree diversity with forest age observed in this study reflects the dynamics of ecological succession. Tree species richness rises from 28.46 in young vegetation plots to 115.72 in mature vegetation plots, consistent with the literature reporting a rise in diversity throughout secondary succession [67]. This change is evident in diversity indices, such as the ExpH and 1/D, which indicate a more equitable distribution of species in older forests [68].
Floristic composition varies between landscapes, with higher initial diversity in mountainous areas than hills. However, it is important to note that the smaller sample size considered for the hill region (n = 16) could increase the risk of overlooking trivial differences in species composition compared to the mountainous region (n = 38), which could explain the high overlap observed in Figure 4b. The last results could be influenced by the greater availability of propagules and favorable conditions in mountainous landscapes [69] and the topographic conditions of these ecosystems [67]. The dominance of pioneer species, such as P. discolor and H. fascicularis, in early successional stages is a typical pattern in tropical SFs [59,70]. The transition to shade-tolerant species in later successional stages suggests a process of ecological stabilization, supporting the initial floristic composition hypothesis [53,71].
Notably, the interaction between forest age and landscape significantly impacted species richness, indicating that landscape configuration can modulate the recovery of diversity [72]. These shifts in composition align with theories of ecological assembly and environmental filtering, where landscape heterogeneity and local conditions play a crucial role in species selection [73].
4.3. Limitations and Implications of Research in Ecological Restoration
This study provides valuable insights for developing restoration strategies in the Amazon. The rapid recovery of biomass and diversity observed in mountain landscapes highlights their high potential for restoration projects, given their ability to accumulate carbon and biodiversity more rapidly [59]. Additionally, improvements in soil properties with forest age emphasize the importance of implementing management practices that promote organic matter accumulation and nutrient stability [33].
This study underscores the importance that SF restoration consider diversity and forest structure, to promote efficient recovery of carbon and biodiversity [74]. In less favorable landscapes, restoration strategies such as planting key species may be critical to accelerating the recovery of forest functionality [67,75]. Species composition varies significantly between hill and mountains landscapes, necessitating tailored strategies. Assisted Natural Regeneration and SF enrichment must adapt to the ecological characteristics of each landscape. Assisted Natural Regeneration practices in hill areas should focus on maintaining and promoting existing diversity, while enrichment may be needed in mountainous regions to accelerate the recovery of more diverse compositions. Local factors such as topography, soil, and microclimate should be integral to planning ANR interventions. Structural variables such as DBH, BA, and AGB show significant differences based on SF age, emphasizing the need for age-specific interventions. Early-stage (<10 years) interventions should promote rapid growth and stabilization of pioneer species, such as protecting against disturbances or planting fast-growing species. In intermediate stages (11–30 years), facilitating transitions toward greater structural complexity through secondary species enrichment and ecological interaction promotion is critical. Advanced stages (31–40 years) should focus on conserving forest diversity and stability, aiming to restore structures resembling mature forests through density management and the protection of key species. The linear growth of AGB in hills and the faster quadratic pattern in mountains indicate that interventions must be tailored to these dynamics. In hills, practices should aim to maintain long-term uniform growth through soil conservation and the establishment of ecological corridors. In mountains, leveraging favorable conditions for rapid growth requires early-stage ANR and the protection of key species that promote accelerated recovery. Differences in WD and forest structure underscore the need for interventions prioritizing ecological functions, such as carbon storage and biodiversity protection, to accelerate ecosystem recovery effectively.
In early successional SFs, pioneer species are essential for initiating regeneration but gradually lose importance as the SFs matures, giving way to secondary species. Management should encourage this natural transition to facilitate ecological succession. It is essential to recognize that dominant pioneer species play a crucial role in stabilizing ecosystems during early stages, facilitating the transition to more diverse and functionally complex communities that are critical for maximizing forest resilience to future disturbances [64,67]. In contrast, the inclusion of shade-tolerant species during advanced successional stages can accelerate the recovery of forest structure and function, enhancing ecosystem services such as carbon sequestration and water regulation [71,76]. In intermediate and advanced stages, introducing or protecting secondary species can enhance forest structure and functionality, contributing to more stable and resilient ecosystems. Significant differences in β-diversity between plot ages and landscapes highlight the importance of maintaining species composition heterogeneity for ecosystem resilience. Assisted Natural Regeneration strategies should focus on conserving this diversity, potentially through planting or protecting species that maximize β-diversity, particularly in stages where diversity tends to decline. Our results allow implementers and decision-makers to design a Transformative Ecological Restoration Program involving SFs.
Our findings emphasize the necessity of managing SFs through ecological restoration as a central component of Transformative Territorial Management (TTM). The use and management of SFs in the Amazon Basin, particularly in the Colombian Amazon, requires comprehensive planning that involves: (1) Generating and utilizing knowledge about SF integrity within transformed landscapes; (2) Prioritizing SFs as strategic areas for ecological restoration, accounting for socio-economic and environmental contexts [18]; and (3) Implementing evidence-based restoration practices to enhance conservation value and biodiversity [13,77]. These efforts aim to ensure SF functionality and the provision of essential ecosystem services [14], while strengthening ecological connectivity between the Andes and the Amazon, as well as across regions within the Amazon [69]. In addition to achieving the goals set for restoration, both from international and national demands, and beyond these demands, understanding the need to ensure the viability of life on the planet.
5. Conclusions
The natural recovery of AGB in secondary Amazonian forests is influenced mainly by forest age and soil properties. Among these factors, forest age stands out as the key driver, mediating significant increases in structural metrics such as BA, DBH, and WD. These changes reflect the transition toward more mature forest communities with greater carbon storage capacity. Similarly, tree diversity increases with succession, indicating a more equitable species distribution in mature forests.
Comparatively, mountainous landscapes demonstrate faster AGB recovery during early successional stages, while hilly areas exhibit steadier, linear growth. These differences highlight the critical role of topographic conditions in shaping successional dynamics. Soil properties also improve with SF age, promoting the accumulation of organic matter and nutrient retention as is expected in the natural regeneration process. However, the observed increase in aluminum saturation and declining pH levels indicate an ongoing acidification process that could limit the availability of certain nutrients, highlighting the soil limitation conditions of the Amazon region.
These findings provide key insights to guide adaptive restoration strategies that consider and integrate landscape heterogeneity. Such adapted strategies are essential to maximize carbon sequestration, enhance ecological resilience, and ensure the long-term sustainability of SFs in the Amazon. The results highlight the complexity of natural regeneration and underscore the need of achieve Transformative Territorial Management of SFs through future-oriented restoration strategies. Assisted natural regeneration, aimed at accelerating the recovery of carbon (C) stocks, must be tailored to the specific conditions of each landscape and successional stage, prioritizing biodiversity, connectivity, and continuous monitoring. By adopting these tailored approaches, the effective and sustainable recovery of SFs in the Amazon can be achieved, contributing to global restoration goals and the ecological health of the region.
Supplementary Materials
The following supporting information can be downloaded at: https://www.mdpi.com/article/10.3390/d17010039/s1, Figure S1: Interaction between forest age and landscape on structural and diversity attributes. (A) Aboveground biomass carbon (AGB), (B) tree species richness, (C) exponential Shannon diversity (ExpH), (D) inverse Simpson diversity (1/D), (E) mean tree height (Height), (F) diameter at breast height (DBH), (G) wood density (WD), and (H) basal area (BA). Different letters indicate significant differences between age classes and landscapes (p < 0.05); Figure S2: Modeled trends of forest attributes recovery. (A) Aboveground biomass carbon (AGB), (B) tree Species richness, (C) exponential Shannon diversity (ExpH), (D) inverse Simpson diversity (1/D), (E) mean tree height (Height), (F) diameter at breast height (DBH), (G) wood density (WD), and (H) basal area (BA); Figure S3: Non-metric multidimensional scaling (nMDS) ordinations of tree community composition (beta diversity) based on Chao–Jaccard similarity between natural regeneration plots following abandonment of cattle ranching and reference forests in two landscape units in the Colombian deforested Amazon. (A) Hills. (B) Mountains. In both plots, hulls are overlaid for each variable; Figure S4: Pairwise correlation matrix among key soil and biomass variables, including aboveground biomass carbon (AGB), soil organic carbon (SOC), pH, cation exchange capacity (CEC), mean moisture saturation (SMS), organic matter (MO), nitrogen (N), clay content (Clay), sand content (Sand), silt content (Silt), exchangeable potassium (E_K), exchangeable calcium (E_Ca), available iron (Fe), available phosphorus (P), exchangeable magnesium (Mg_S), and aluminum saturation (Al_S); Table S1: Mean values of the evaluated soil variables in five forest age class and two landscape types (hill and mountain). Soil organic carbon (SOC, Mg ha−1), pH in water (pH), cation exchange capacity (CEC, meq 100 g−1), soil moisture saturation (SMS, %), organic matter (OM, %), total nitrogen (N, %), clay content (Clay, %), sand content (Sand, %), silt content (Silt, %), exchangeable potassium (E_K, mg kg−1), exchangeable calcium (E_Ca, mg kg−1), available iron (Fe, mg kg−1), available phosphorus (P, mg kg−1), exchangeable magnesium (Mg_S, %), and exchangeable aluminum (Al_S, %); Table S2: Comparison of the five species with the highest importance value index (IVI) of the tree community by forest stand age and landscape type (hill and mountain) across a chronosequence in degraded lands of the Amazon; Table S3: Results of analysis of variance (PERMANOVA) tests on natural regeneration of tree communities across a chronosequence in degraded lands of the Amazon. Landscape was treated as a fixed effect and stand age (years) was used as a covariate; Table S4: Post hoc analysis results of floristic similarity between age classes using pairwise Adonis with Chao index; Table S5: Details of structural equation model.
Author Contributions
Conceptualization, C.H.R.-L., A.S., and L.L.R.-F.; methodology, C.H.R.-L., A.S., and L.L.R.-F.; software, A.S.; validation, A.S., C.H.R.-L., and L.L.R.-F.; formal analysis, A.S.; investigation, C.H.R.-L., L.L.R.-F., and A.S.; resources, C.H.R.-L.; data curation, A.T.-B., Y.D.S.-C., and A.S.; writing—original draft preparation, C.H.R.-L., A.S., A.T.-B., Y.D.S.-C., and L.L.R.-F.; writing—review and editing, C.H.R.-L., L.L.R.-F., A.S., and Y.D.S.-C.; visualization, A.S. and Y.D.S.-C.; supervision, C.H.R.-L., A.S., and L.L.R.-F.; project administration, C.H.R.-L.; funding acquisition, C.H.R.-L. All authors have read and agreed to the published version of the manuscript.
Funding
This research was part of the project: “Restauración de áreas disturbadas por implementación de sistemas productivos agropecuarios en zonas de alta intervención en el Caquetá”, funded by the Fondo de Ciencia, Tecnología e Innovación FCTeI—SGR, the Amazonian Scientific Research Institute Sinchi, the Government of Caquetá, the Universidad de la Amazonía, the Asociación de Reforestadores y Cultivadores de Caucho del Caquetá ASOHECA, and the Federación Departamental de Ganaderos del Caquetá FEDEGANGA. Contract 60/2013; and by the Government of Colombia through the project BPIN 202300000000285 “Investigación científica transformativa para potenciar el bienestar, la conservación y la gobernanza ambiental en la Amazonia colombiana Amazonas, Caquetá, Guainía, Guaviare, Meta, Putumayo, Vaupés”.
Institutional Review Board Statement
Not applicable.
Data Availability Statement
Data are available from the authors upon request.
Acknowledgments
The authors thank all the farmers in the study area for their help and support during the fieldwork.
Conflicts of Interest
The authors declare no conflicts of interest. The funders had no role in the design of the study; in the collection, analyses, or interpretation of the data; in the writing of the manuscript, or in the decision to publish the results.
References
- Potapov, P.; Hansen, M.C.; Laestadius, L.; Turubanova, S.; Yaroshenko, A.; Thies, C.; Smith, W.; Zhuravleva, I.; Komarova, A.; Minnemeyer, S.; et al. The Last Frontiers of Wilderness: Tracking Loss of Intact Forest Landscapes from 2000 to 2013. Sci. Adv. 2017, 3, e1600821. [Google Scholar] [CrossRef]
- Mitchard, E.T.A. The Tropical Forest Carbon Cycle and Climate Change. Nature 2018, 559, 527–534. [Google Scholar] [CrossRef]
- Cooper, D.L.M.; Lewis, S.L.; Sullivan, M.J.P.; Prado, P.I.; ter Steege, H.; Barbier, N.; Slik, F.; Sonké, B.; Ewango, C.E.N.; Adu-Bredu, S.; et al. Consistent Patterns of Common Species across Tropical Tree Communities. Nature 2024, 625, 728–734. [Google Scholar] [CrossRef]
- Tito, R.; Salinas, N.; Cosio, E.G.; Boza Espinoza, T.E.; Muñiz, J.G.; Aragón, S.; Nina, A.; Roman-Cuesta, R.M. Secondary Forests in Peru: Differential Provision of Ecosystem Services Compared to Other Post-Deforestation Forest Transitions. Ecol. Soc. 2022, 27, art12. [Google Scholar] [CrossRef]
- Armenteras, D.; Murcia, U.; González, T.M.; Barón, O.J.; Arias, J.E. Scenarios of Land Use and Land Cover Change for NW Amazonia: Impact on Forest Intactness. Glob. Ecol. Conserv. 2019, 17, e00567. [Google Scholar] [CrossRef]
- Csillik, O.; Asner, G.P. Aboveground Carbon Emissions from Gold Mining in the Peruvian Amazon. Environ. Res. Lett. 2020, 15, 014006. [Google Scholar] [CrossRef]
- Smith, C.C.; Healey, J.R.; Berenguer, E.; Young, P.J.; Taylor, B.; Elias, F.; Espírito-Santo, F.; Barlow, J. Old-Growth Forest Loss and Secondary Forest Recovery across Amazonian Countries. Environ. Res. Lett. 2021, 16, 085009. [Google Scholar] [CrossRef]
- SIAT-AC Sistema de Información Ambiental Territorial de La Amazonia Colombiana—SIAT-AC. Available online: https://siatac.co/ (accessed on 25 October 2024).
- Gann, G.D.; McDonald, T.; Walder, B.; Aronson, J.; Nelson, C.R.; Jonson, J.; Hallett, J.G.; Eisenberg, C.; Guariguata, M.R.; Liu, J.; et al. International Principles and Standards for the Practice of Ecological Restoration. Second Edition. Restor. Ecol. 2019, 27, S3–S46. [Google Scholar] [CrossRef]
- Rodríguez-León, C.H.; Roa-Fuentes, L.L.; Sterling, A.; Suárez, J.C. Plant Biodiversity Homogenization across the Chronosequence in Highly Fragmented Landscapes in the Colombian Andean–Amazonian Transition. Forests 2022, 13, 1422. [Google Scholar] [CrossRef]
- Pain, A.; Marquardt, K.; Khatri, D. Secondary Forests and Agrarian Transitions: Insights from Nepal and Peru. Hum. Ecol. 2021, 49, 249–258. [Google Scholar] [CrossRef]
- Williams, B.A.; Beyer, H.L.; Fagan, M.E.; Chazdon, R.L.; Schmoeller, M.; Sprenkle-Hyppolite, S.; Griscom, B.W.; Watson, J.E.M.; Tedesco, A.M.; Gonzalez-Roglich, M.; et al. Global Potential for Natural Regeneration in Deforested Tropical Regions. Nature 2024, 636, 131–137. [Google Scholar] [CrossRef] [PubMed]
- Crouzeilles, R.; Ferreira, M.S.; Chazdon, R.L.; Lindenmayer, D.B.; Sansevero, J.B.B.; Monteiro, L.; Iribarrem, A.; Latawiec, A.E.; Strassburg, B.B.N. Ecological Restoration Success Is Higher for Natural Regeneration than for Active Restoration in Tropical Forests. Sci. Adv. 2017, 3, e1701345. [Google Scholar] [CrossRef]
- Poorter, L.; Bongers, F.; Aide, T.M.; Almeyda Zambrano, A.M.; Balvanera, P.; Becknell, J.M.; Boukili, V.; Brancalion, P.H.S.; Broadbent, E.N.; Chazdon, R.L.; et al. Biomass Resilience of Neotropical Secondary Forests. Nature 2016, 530, 211–214. [Google Scholar] [CrossRef]
- Coelho, A.J.P.; Mancini Teixeira, H.; Verweij, P.; Matos, F.A.R.; Villa, P.M.; Meira-Neto, J.A.A.; Teixeira, H.M.; Verweij, P.; Matos, F.A.R.; Villa, P.M.; et al. Functional Richness Mediates Landscape and Management Effects on Tree Biomass and Soil Fertility during Secondary Forest Succession. Ecol. Indic. 2024, 162, 112029. [Google Scholar] [CrossRef]
- Lamb, D.; Erskine, P.D.; Parrotta, J.A. Restoration of Degraded Tropical Forest Landscapes. Science 2005, 310, 1628–1632. [Google Scholar] [CrossRef]
- Shono, K.; Cadaweng, E.A.; Durst, P.B. Application of Assisted Natural Regeneration to Restore Degraded Tropical Forestlands. Restor. Ecol. 2007, 15, 620–626. [Google Scholar] [CrossRef]
- Chazdon, R.L.; Guariguata, M.R. Natural Regeneration as a Tool for Large-scale Forest Restoration in the Tropics: Prospects and Challenges. Biotropica 2016, 48, 716–730. [Google Scholar] [CrossRef]
- Parrotta, J.A.; Knowles, O.H. Restoration of Tropical Moist Forests on Bauxite-Mined Lands in the Brazilian Amazon. Restor. Ecol. 1999, 7, 103–116. [Google Scholar] [CrossRef]
- Holl, K.D.; Aide, T.M. When and Where to Actively Restore Ecosystems? For. Ecol. Manag. 2011, 261, 1558–1563. [Google Scholar] [CrossRef]
- Rosenfield, M.F.; Jakovac, C.C.; Vieira, D.L.M.; Poorter, L.; Brancalion, P.H.S.; Vieira, I.C.G.; de Almeida, D.R.A.; Massoca, P.; Schietti, J.; Albernaz, A.L.M.; et al. Ecological Integrity of Tropical Secondary Forests: Concepts and Indicators. Biol. Rev. 2023, 98, 662–676. [Google Scholar] [CrossRef] [PubMed]
- Rodríguez-León, C.H.; Roa-Fuentes, L.L.; Sterling, A.; Suárez, J.C. Plant-Community Vulnerability in Highly Fragmented Landscapes Is Higher in Secondary Forests Than in Old Growth Forests in the Andean–Amazonian Transition. Plants 2022, 11, 3284. [Google Scholar] [CrossRef]
- Aryal, D.R.; De Jong, B.H.J.; Ochoa-Gaona, S.; Esparza-Olguin, L.; Mendoza-Vega, J. Carbon Stocks and Changes in Tropical Secondary Forests of Southern Mexico. Agric. Ecosyst. Environ. 2014, 195, 220–230. [Google Scholar] [CrossRef]
- Bauters, M.; Vercleyen, O.; Vanlauwe, B.; Six, J.; Bonyoma, B.; Badjoko, H.; Hubau, W.; Hoyt, A.; Boudin, M.; Verbeeck, H.; et al. Long-term Recovery of the Functional Community Assembly and Carbon Pools in an African Tropical Forest Succession. Biotropica 2019, 51, 319–329. [Google Scholar] [CrossRef]
- Palma, A.C.; Goosem, M.; Fensham, R.J.; Goosem, S.; Preece, N.D.; Stevenson, P.R.; Laurance, S.G.W. Dispersal and Recruitment Limitations in Secondary Forests. J. Veg. Sci. 2021, 32, e12975. [Google Scholar] [CrossRef]
- Cecilio Rebola, L.; Pandolfo Paz, C.; Valenzuela Gamarra, L.; Burslem, D.F.R.P. Land Use Intensity Determines Soil Properties and Biomass Recovery after Abandonment of Agricultural Land in an Amazonian Biodiversity Hotspot. Sci. Total Environ. 2021, 801, 149487. [Google Scholar] [CrossRef] [PubMed]
- Rozendaal, D.M.A.; Bongers, F.; Aide, T.M.; Alvarez-Dávila, E.; Ascarrunz, N.; Balvanera, P.; Becknell, J.M.; Bentos, T.V.; Brancalion, P.H.S.; Cabral, G.A.L.; et al. Biodiversity Recovery of Neotropical Secondary Forests. Sci. Adv. 2019, 5, eaau3114. [Google Scholar] [CrossRef]
- Lai, H.R.; Hall, J.S.; Batterman, S.A.; Turner, B.L.; van Breugel, M. Nitrogen Fixer Abundance Has No Effect on Biomass Recovery during Tropical Secondary Forest Succession. J. Ecol. 2018, 106, 1415–1427. [Google Scholar] [CrossRef]
- Aryal, D.R.; De Jong, B.H.J.; Sánchez-Silva, S.; Haas-Ek, A.; Esparza-Olguin, L.; Ochoa-Gaona, S.; Ghimire, R.; Morales-Ruiz, D.E. Biomass Recovery along a Tropical Forest Succession: Trends on Tree Diversity, Wood Traits and Stand Structure. For. Ecol. Manag. 2024, 555, 121709. [Google Scholar] [CrossRef]
- Murad, C.A.; Pearse, J. Landsat Study of Deforestation in the Amazon Region of Colombia: Departments of Caquetá and Putumayo. Remote Sens. Appl. Soc. Environ. 2018, 11, 161–171. [Google Scholar] [CrossRef]
- IGAC. Estudio General de Suelos y Zonificación de Tierras Departamento de Caquetá. Escala 1:100.000; Imprenta Nacional de Colombia: Bogotá, Colombia, 2014; ISBN 978-958-8323-73-2. [Google Scholar]
- Rodríguez-León, C.H.; Peña-Venegas, C.P.; Sterling, A.; Castro, D.; Mahecha-Virguez, L.K.; Virguez-Díaz, Y.R.; Silva-Olaya, A.M. Soil Quality Restoration during the Natural Succession of Abandoned Cattle Pastures in Deforested Landscapes in the Colombian Amazon. Agronomy 2021, 11, 2484. [Google Scholar] [CrossRef]
- Teixeira, H.M.; Cardoso, I.M.; Bianchi, F.J.J.A.; da Cruz Silva, A.; Jamme, D.; Peña-Claros, M. Linking Vegetation and Soil Functions during Secondary Forest Succession in the Atlantic Forest. For. Ecol. Manag. 2020, 457, 117696. [Google Scholar] [CrossRef]
- Norden, N.; Angarita, H.A.; Bongers, F.; Martínez-Ramos, M.; Granzow-de la Cerda, I.; van Breugel, M.; Lebrija-Trejos, E.; Meave, J.A.; Vandermeer, J.; Williamson, G.B.; et al. Successional Dynamics in Neotropical Forests Are as Uncertain as They Are Predictable. Proc. Natl. Acad. Sci. USA 2015, 112, 8013–8018. [Google Scholar] [CrossRef] [PubMed]
- Chave, J.; Réjou-Méchain, M.; Búrquez, A.; Chidumayo, E.; Colgan, M.S.; Delitti, W.B.C.; Duque, A.; Eid, T.; Fearnside, P.M.; Goodman, R.C.; et al. Improved Allometric Models to Estimate the Aboveground Biomass of Tropical Trees. Glob. Chang. Biol. 2014, 20, 3177–3190. [Google Scholar] [CrossRef]
- Garate-Quispe, J.; Herrera-Machaca, M.; Pareja Auquipata, V.; Alarcón Aguirre, G.; Baez Quispe, S.; Carpio-Vargas, E.E. Resilience of Aboveground Biomass of Secondary Forests Following the Abandonment of Gold Mining Activity in the Southeastern Peruvian Amazon. Diversity 2024, 16, 233. [Google Scholar] [CrossRef]
- Doraisami, M.; Domke, G.M.; Martin, A.R. Improving Wood Carbon Fractions for Multiscale Forest Carbon Estimation. Carbon Balance Manag. 2024, 19, 25. [Google Scholar] [CrossRef]
- Hsieh, T.C.; Ma, K.H.; Chao, A. INEXT: An R Package for Rarefaction and Extrapolation of Species Diversity (Hill Numbers). Methods Ecol. Evol. 2016, 7, 1451–1456. [Google Scholar] [CrossRef]
- Rother, D.C.; Liboni, A.P.; Magnago, L.F.S.; Chao, A.; Chazdon, R.L.; Rodrigues, R.R. Ecological Restoration Increases Conservation of Taxonomic and Functional Beta Diversity of Woody Plants in a Tropical Fragmented Landscape. For. Ecol. Manag. 2019, 451, 117538. [Google Scholar] [CrossRef]
- Gotelli, N.J.; Chao, A. Measuring and Estimating Species Richness, Species Diversity, and Biotic Similarity from Sampling Data. In Encyclopedia of Biodiversity; Elsevier: Amsterdam, The Netherlands, 2013; pp. 195–211. [Google Scholar]
- Chao, A.; Kubota, Y.; Zelený, D.; Chiu, C.; Li, C.; Kusumoto, B.; Yasuhara, M.; Thorn, S.; Wei, C.; Costello, M.J.; et al. Quantifying Sample Completeness and Comparing Diversities among Assemblages. Ecol. Res. 2020, 35, 292–314. [Google Scholar] [CrossRef]
- Melo, A.S. CommEcol: Community Ecology Analyses. CRAN Contributed Packages. 2016. Available online: https://cran.r-project.org/web/packages/CommEcol/CommEcol.pdf (accessed on 30 October 2024).
- Su, L.; Heydari, M.; Omidipour, R.; Soheili, F.; Cheraghi, J.; Manuel Villa, P.; Prévosto, B. Stand Structural Diversity and Elevation Rather than Functional Diversity Drive Aboveground Biomass in Historically Disturbed Semiarid Oak Forests. For. Ecol. Manag. 2023, 543, 121139. [Google Scholar] [CrossRef]
- Curtis, J.T.; McIntosh, R.P. An Upland Forest Continuum in the Prairie-Forest Border Region of Wisconsin. Ecology 1951, 32, 476–496. [Google Scholar] [CrossRef]
- Kindt, R. BiodiversityR: Package for Community Ecology and Suitability Analysis. CRAN Contributed Packages. 2024. Available online: https://cran.r-project.org/web/packages/BiodiversityR/index.html (accessed on 30 October 2024).
- Maia, S.M.F.; Ogle, S.M.; Cerri, C.C.; Cerri, C.E.P. Changes in Soil Organic Carbon Storage under Different Agricultural Management Systems in the Southwest Amazon Region of Brazil. Soil Tillage Res. 2010, 106, 177–184. [Google Scholar] [CrossRef]
- Pinheiro, J.; Bates, D.; DebRoy, S.; Sarkar, D. Nlme: Linear and Nonlinear Mixed Effects Models. R Package Version 3.1-131.1. 2018. Available online: https://cran.r-project.org/web/packages/nlme/index.html (accessed on 30 October 2024).
- R Core Team. R: A Language and Environment for Statistical Computing, v.4.3.3; The Comprehensive R Archive Network: Viena, Austria, 2024.
- Di Rienzo, J.A.; Casanoves, F.; Balzarini, M.G.; Gonzalez, L.; Tablada, M.; Robledo, C.W. InfoStat, Universidad Nacional de Córdoba: Córdoba, Argentina, 2020.
- Worldwide, R.C.T. Contributors Package The R Stats Package Version 4.3.3. 2024. Available online: https://CRAN.R-project.org/package=STAT (accessed on 30 October 2024).
- Matthews, T.J.; Guilhaumon, F.; Cazelles, K. Package Sars: Fit and Compare Species-Area Relationship Models Using Multimodel Inference—Version 1.3.7. 2024. Available online: https://cran.r-project.org/web/packages/sars/sars.pdf (accessed on 30 October 2024).
- Oksanen, J.; Blanchet, G.; Friendly, M.; Kindt, R.; Legendre, P.; McGlinn, D.; Minchin, P.; O’Hara, R.; Simpson, G.; Solymos, P.; et al. Package ‘Vegan’, Community Ecology Package Version 2.5-7; The Comprehensive R Archive Network: Viena, Austria, 2018.
- Oberleitner, F.; Egger, C.; Oberdorfer, S.; Dullinger, S.; Wanek, W.; Hietz, P. Recovery of Aboveground Biomass, Species Richness and Composition in Tropical Secondary Forests in SW Costa Rica. For. Ecol. Manag. 2021, 479, 118580. [Google Scholar] [CrossRef]
- Chao, A.; Chazdon, R.L.; Colwell, R.K.; Shen, T. A New Statistical Approach for Assessing Similarity of Species Composition with Incidence and Abundance Data. Ecol. Lett. 2005, 8, 148–159. [Google Scholar] [CrossRef]
- Martinez-Arbizu, P. Package: “PairwiseAdonis”, Pairwise Multilevel Comparison Using Adonis Package Version: 0.0.1; The Comprehensive R Archive Network: Viena, Austria, 2017.
- Revelle, W. Package: Psych, Procedures for Psychological, Psychometric, and Personality Research—Version 2.4.6.26; The Comprehensive R Archive Network: Viena, Austri, 2024.
- Rosseel, Y. Lavaan: An R Package for Structural Equation Modeling. J. Stat. Softw. 2012, 48, 1–36. [Google Scholar] [CrossRef]
- RStudio Team. RStudio: Integrated Development Environment for R; RStudio Team: Boston, MA, USA, 2024. [Google Scholar]
- Kalamandeen, M.; Gloor, E.; Johnson, I.; Agard, S.; Katow, M.; Vanbrooke, A.; Ashley, D.; Batterman, S.A.; Ziv, G.; Holder-Collins, K.; et al. Limited Biomass Recovery from Gold Mining in Amazonian Forests. J. Appl. Ecol. 2020, 57, 1730–1740. [Google Scholar] [CrossRef]
- Poorter, L.; Craven, D.; Jakovac, C.C.; van der Sande, M.T.; Amissah, L.; Bongers, F.; Chazdon, R.L.; Farrior, C.E.; Kambach, S.; Meave, J.A.; et al. Multidimensional Tropical Forest Recovery. Science 2021, 374, 1370–1376. [Google Scholar] [CrossRef] [PubMed]
- Kim, S.; Zang, H.; Mortimer, P.; Shi, L.; Li, Y.; Xu, J.; Ostermann, A. Tree Species and Recovery Time Drives Soil Restoration after Mining: A Chronosequence Study. Land Degrad. Dev. 2018, 29, 1738–1747. [Google Scholar] [CrossRef]
- Mensah, S.; Noulèkoun, F.; Salako, V.K.; Lokossou, C.S.M.J.; Akouété, P.; Seifert, T.; Glèlè Kakaï, R. Structural and Taxonomic Diversity Predict Above-ground Biomass Better than Functional Measures of Maximum Height in Mixed-species Forests. Appl. Veg. Sci. 2023, 26, e12732. [Google Scholar] [CrossRef]
- Gris, D.; Casagrande, J.C.; Marques, M.R.; Oldeland, J.; Damasceno-Júnior, G.A. Periodic Flooding and Edaphic Factors Shape Erythrina Fusca Dominance in Riparian Forests in the Pantanal Wetland. Trop. Ecol. 2024, 65, 224–238. [Google Scholar] [CrossRef]
- Bello, C.; Galetti, M.; Pizo, M.A.; Magnago, L.F.S.; Rocha, M.F.; Lima, R.A.F.; Peres, C.A.; Ovaskainen, O.; Jordano, P. Defaunation Affects Carbon Storage in Tropical Forests. Sci. Adv. 2015, 1, 6310. [Google Scholar] [CrossRef]
- Ali, A.; Lin, S.-L.; He, J.-K.; Kong, F.-M.; Yu, J.-H.; Jiang, H.-S. Climate and Soils Determine Aboveground Biomass Indirectly via Species Diversity and Stand Structural Complexity in Tropical Forests. For. Ecol. Manag. 2019, 432, 823–831. [Google Scholar] [CrossRef]
- Gavito, M.E.; Paz, H.; Barragán, F.; Siddique, I.; Arreola-Villa, F.; Pineda-García, F.; Balvanera, P. Indicators of Integrative Recovery of Vegetation, Soil and Microclimate in Successional Fields of a Tropical Dry Forest. For. Ecol. Manag. 2021, 479, 118526. [Google Scholar] [CrossRef]
- Rodrigues, A.C.; Villa, P.M.; Silla, F.; Gomes, L.P.; Meira-Neto, J.A.A.; Torres, C.M.M.E.; Neri, A.V. Functional Composition Enhances Aboveground Carbon Stock during Tropical Late-Secondary Forest Succession. Plant Biosyst.—An Int. J. Deal. with all Asp. Plant Biol. 2023, 157, 1–11. [Google Scholar] [CrossRef]
- Coelho, A.J.P.; Ribeiro Matos, F.A.; Villa, P.M.; Heringer, G.; Pontara, V.; de Paula Almado, R.; Alves Meira-Neto, J.A. Multiple Drivers Influence Tree Species Diversity and Above-Ground Carbon Stock in Second-Growth Atlantic Forests: Implications for Passive Restoration. J. Environ. Manag. 2022, 318, 115588. [Google Scholar] [CrossRef] [PubMed]
- Arroyo-Rodríguez, V.; Rito, K.F.; Farfán, M.; Navia, I.C.; Mora, F.; Arreola-Villa, F.; Balvanera, P.; Bongers, F.; Castellanos-Castro, C.; Catharino, E.L.M.; et al. Landscape-Scale Forest Cover Drives the Predictability of Forest Regeneration across the Neotropics. Proc. R. Soc. B Biol. Sci. 2023, 290, 20222203. [Google Scholar] [CrossRef]
- Coelho, A.J.P.; Villa, P.M.; Matos, F.A.R.; Heringer, G.; Bueno, M.L.; de Paula Almado, R.; Meira-Neto, J.A.A. Atlantic Forest Recovery after Long-Term Eucalyptus Plantations: The Role of Zoochoric and Shade-Tolerant Tree Species on Carbon Stock. For. Ecol. Manag. 2022, 503, 119789. [Google Scholar] [CrossRef]
- Poorter, L.; Amissah, L.; Bongers, F.; Hordijk, I.; Kok, J.; Laurance, S.G.W.; Lohbeck, M.; Martínez-Ramos, M.; Matsuo, T.; Meave, J.A.; et al. Successional Theories. Biol. Rev. 2023, 98, 2049–2077. [Google Scholar] [CrossRef]
- Matos, F.A.R.; Magnago, L.F.S.; Aquila Chan Miranda, C.; de Menezes, L.F.T.; Gastauer, M.; Safar, N.V.H.; Schaefer, C.E.G.R.; da Silva, M.P.; Simonelli, M.; Edwards, F.A.; et al. Secondary Forest Fragments Offer Important Carbon and Biodiversity Cobenefits. Glob. Chang. Biol. 2020, 26, 509–522. [Google Scholar] [CrossRef]
- Laliberté, E.; Legendre, P. A Distance-based Framework for Measuring Functional Diversity from Multiple Traits. Ecology 2010, 91, 299–305. [Google Scholar] [CrossRef] [PubMed]
- Mori, A.S.; Dee, L.E.; Gonzalez, A.; Ohashi, H.; Cowles, J.; Wright, A.J.; Loreau, M.; Hautier, Y.; Newbold, T.; Reich, P.B.; et al. Biodiversity–Productivity Relationships Are Key to Nature-Based Climate Solutions. Nat. Clim. Chang. 2021, 11, 543–550. [Google Scholar] [CrossRef]
- Aerts, R.; Honnay, O. Forest Restoration, Biodiversity and Ecosystem Functioning. BMC Ecol. 2011, 11, 29. [Google Scholar] [CrossRef] [PubMed]
- Balvanera, P.; Pfisterer, A.B.; Buchmann, N.; He, J.; Nakashizuka, T.; Raffaelli, D.; Schmid, B. Quantifying the Evidence for Biodiversity Effects on Ecosystem Functioning and Services. Ecol. Lett. 2006, 9, 1146–1156. [Google Scholar] [CrossRef]
- Crouzeilles, R.; Beyer, H.L.; Monteiro, L.M.; Feltran-Barbieri, R.; Pessôa, A.C.M.; Barros, F.S.M.; Lindenmayer, D.B.; Lino, E.D.S.M.; Grelle, C.E.V.; Chazdon, R.L.; et al. Achieving Cost-effective Landscape-scale Forest Restoration through Targeted Natural Regeneration. Conserv. Lett. 2020, 13, e12709. [Google Scholar] [CrossRef]

Disclaimer/Publisher’s Note: The statements, opinions and data contained in all publications are solely those of the individual author(s) and contributor(s) and not of MDPI and/or the editor(s). MDPI and/or the editor(s) disclaim responsibility for any injury to people or property resulting from any ideas, methods, instructions or products referred to in the content. |
© 2025 by the authors. Licensee MDPI, Basel, Switzerland. This article is an open access article distributed under the terms and conditions of the Creative Commons Attribution (CC BY) license (https://creativecommons.org/licenses/by/4.0/).