Article

Resolving Rapid Radiation of Voles and Lemmings (Arvicolinae: Cricetinae, Rodentia) with QuaddRAD Sequencing and Transcriptome Analysis

1
Zoological Institute Russian Academy of Sciences, 199034 St. Petersburg, Russia
2
A.N. Severtsov Institute of Ecology and Evolution, Russian Academy of Sciences, 119071 Moscow, Russia
*
Author to whom correspondence should be addressed.
Diversity 2025, 17(1), 61; https://doi.org/10.3390/d17010061
Submission received: 13 November 2024 / Revised: 15 January 2025 / Accepted: 16 January 2025 / Published: 17 January 2025
(This article belongs to the Special Issue Phylogeny and Evolution Hot Topics in 2024)

Abstract

:
Voles and lemmings (subfamily Arvicolinae) remain some of the most difficult groups for disentangling phylogenetic relations owing to recent and very fast explosive radiation. The rapid radiation events are challenging for phylogenetic analysis and produce bushes of various shapes that are impossible to resolve with a straightforward approach using individual loci. Here using the quaddRAD-seq technique and transcriptomes, we tested whether data from the nuclear genome are consistent with trees inferred earlier from individual loci and from mitogenomes in topology and divergence dating. Both the transcriptome and quaddRAD-seq data convincingly place Arvicola as the earliest derivative within Arvicolini. This result is in agreement with the fossil record and conventional taxonomy. For the first time, whole-genome sequencing data resolved relations within the third radiation wave of the subfamily’s taxa, namely the tribes Arvicolini, Lagurini, and Ellobiusini, which have formed polytomy in mitochondrial trees in earlier articles. This study indicates that divergence dating is highly dependent on the number and position of calibration points in a tree and on taxa sampling. In terms of phylogenetic inference, the position of nodes with insufficient taxa representation is the most susceptible to errors.

1. Introduction

For years, voles and lemmings (subfamily Arvicolinae) have remained some of the most difficult groups for disentangling evolutionary history and phylogenetic relations; consequently, the taxonomic structure at the super species level has remained poorly substantiated. The objective reason for the complexity of these tasks is the very fast explosive radiation of the subfamily since 7 million years ago (Ma) [1,2]. The first molecular studies involving one or a few markers allowed distinguishing repetitive radiation waves within Arvicolinae’s fast diversification [3], later on conditionally described as the three radiations [4]. These three radiation waves with constant tribe composition have been confirmed in subsequent papers with the addition of molecular markers and taxa [5,6,7]. In modern fauna, the first radiation is represented by four tribes: long-clawed mole voles (Prometheomyini), collared (Dicrostonychini) and true (Lemmini) lemmings, and muskrats (Ondatrini). The second radiation consists exclusively of forest and rock voles, which belong to the tribe Clethrionomyini. The third and last radiation is the most diverse and numerous, and includes three tribes, steppe voles (Lagurini), mole voles (Ellobiusini), and Arvicolini, with the water-vole (Arvicola Lacepede, 1799) and a dozen genera known under the common name, gray voles.
The first fossil record assigned to Arvicolinae comes from the Late Miocene, closer to the Miocene–Pliocene boundary; already in the Pliocene, a first explosive burst of arvicoline radiation is well pronounced. Soon after its origination in Eurasia, representatives of this radiation spread into North America and gave birth to several lineages there. Most representatives of Early-Pliocene arvicoline fauna, both in Eurasia and in North America, had become extinct before the Pliocene–Pleistocene boundary, and only a few descendants of the first radiation have survived to the present day. In modern fauna, these few survivors of the voles’ first radiation are represented in total by eight genera and 10–18 species (depending on splitting–lumping preferences of researchers) assigned to four tribes: Ondatrini, Dicrostonychini, Lemmini, and monotypic Prometheomyini, as stated above. Despite the constant composition of the tribe-level taxa within this radiation, relationships between the above groups and the order of splitting remain obscure. Resolving them is a very difficult task for two reasons. First, their ancestors have appeared and diversified almost simultaneously, producing very short inner branches in any phylogenetic trees built from few loci, so-called bushy trees. Second, most taxa of the first radiation had become extinct before the Pleistocene, thereby leaving few descendants within each group or even only one in monotypic Prometheomyini; thus, an artifact called long branch attraction (very long external branches) may also falsify the phylogenetic signal [8].
The so-called second radiation [4,6,7] is represented by only one monophyletic tribe of forest and rock voles (Clethrionomyini) and includes five genera and more than 30 species in total. This quite successful group has spread to and settled in all forest and rocky mountain habitats, mainly in the Palearctic. The first fossil remains assigned to the genus Clethrionomys Tilesius, 1850, in Europe since the Pliocene–Pleistocene border, Villafranchian (ca. 2.5–2.8 Ma), are known [9,10]. Molecular dates estimating the origin of this clade vary from 4 Ma [7] to 3.4 Ma [11], which slightly precedes the period known as the Middle Pliocene Warm Period. According to fossil pollen and plant megafossil data, the distribution of coniferous forests was much wider and spread to the modern tundra and polar desert regions, forests, and woodlands, and these forests grew in some regions now covered by steppe or grassland [12]. This environment was favorable for the evolution and diversification of the forest-dwelling animals in question. In contrast to members of the first radiation, members of the second radiation have eventually evolved, and the ratio of surviving to extinct taxa within the group is in favor of survivors. This phenomenon facilitates the reconstruction of phylogenetic relations within this group, and because the inner and outer branches are comparable in length, even trees built from few loci [13,14,15] have given satisfactory resolution. The only point that should be kept in mind is interspecies hybridization and incomplete lineage sorting, which leads to mito–nuclear discordance, and as a consequence, true phylogenetic relations could not be inferred from the mitochondrial data alone.
The third, most diverse, and successful radiation is the most tangled and complicated for phylogenetic and taxonomic studies. This radiation started at the earliest approximately in the mid-Pliocene with a speciation peak at the Pliocene–Pleistocene boundary. The process of speciation has continued till now [16,17], and new species and cryptic species are continuously described. This third radiation, except for the three tribes mentioned above (Arvicolini, Ellobiusini, and Lagurini) also includes several genera of an uncertain position (Dinaromys Kretzoi, 1955, Lemmiscus Thomas, 1912, and Hyperacrius Miller, 1896) and constitutes almost two-thirds of modern diversity of the subfamily, encompassing at least 16 genera with ≥93 species in total. The heyday of taxa within this radiation coincided with the onset of the Pleistocene and global aridization, cooling, and the strongest reduction in woodlands. Only the representatives of this radiation occur throughout all natural zones and landscapes of the Northern Hemisphere and have spread to and settled in all possible ecological niches including subterranean ones, high altitudes, and arctic tundra. Therefore, the most difficult task for the researcher is to obtain a comprehensive sample for the analysis. The untangling of phylogenetic relations and uncovering of evolutionary histories of major groups within the third radiation is thus a challenge due to not only fast diversification but also short inner branches.
Tangled phylogenetic relations are inevitably reflected in an equally confusing and changing taxonomy within the largest among these groups: Arvicolini and especially the genus Microtus Schrank, 1798. The detailed taxonomic history of the genus Microtus was recently reviewed by Withnell and Scarpetta [11]. For a long time, it included a number of subgenera, such as Chionomys Miller, 1908, Lasiopodomys Lataste, 1887, and Neodon Horsfield, 1841. Even before the epoch of molecular studies and only on the basis of morphological features, these taxa had been excluded from the genus Microtus and elevated to the generic rank. We will not repeat here the long story of genus splitting and of the elevation of subgenera to generic status because it has been covered extensively [11,18]. Nevertheless, this process has not been completed until recently, and as we obtain more detailed phylogenetic inferences, this area of systematics will be updated and improved; at the moment, it is incomplete. Nonetheless, taking in account all phylogenetic information up to now and keeping the balance between phylogenetic logic, i.e., nested hierarchy, nomenclature stability, and trying maximally to treat sister taxa equally, we believe that the genus Microtus contains only two subgenera: Microtus proper and Sumeriomys Argyropulo, 1933 [7,19]. Similarly, for simplicity, we refer to all North American “Microtus” species studied here as Mynomes Rafinesque, 1817, though we understand that this group needs further research and certainly has its own complicated structure; no doubt, the monophyletic clade uniting all American former Microtus representatives will be split into a number of subgenera under another genus name. On the other hand, at the moment, all evidence indicates that North American microtines are a strictly monophyletic group having a sister position toward a set of genera of Palearctic voles such as Terricola Fatio, 1867, Microtus, and Blanfordimys Argyropulo, 1933 [6,7,20]. By combining all these taxa under the generic name Microtus [11,21], we will lose a great deal of phylogenetic information (subgenus Sumeriomys, for example). Here we are faced with a well-known dilemma: the better we know the phylogeny, the more difficult it is to fit it into the Procrustean bed of conventional Linnean taxonomic categories [22,23]. Be that as it may, we can only agree with the opinion offered in ref. [11] that “an answer for ‘What is Microtus?’” is yet to be obtained, and this is a topic for a separate paper.
Previous numerous attempts at phylogenetic reconstruction of the subfamily by means of few loci and incomplete sampling [4,6,11,14,24] have failed to achieve a reliable resolution of the supraspecies taxa within the first and third radiation waves, thereby showing the crucial role of both the molecular characters involved and comprehensive sampling. In our previous study [7], via an analysis of mitochondrial genomes, we managed to overcome one of the obstacles and collected a comprehensive sample containing almost all genera and subgenera of the subfamily owing to the inclusion of museum samples collected in the previous century. Nevertheless, the analysis of a 11,391 bp concatenated alignment of protein-coding mitochondrial genes failed to resolve the order of divergence and relationships of tribal-level taxa within the first radiation and the last (largest) radiation. On the other hand, this analysis, for the first time, showed robust support of the phylogenetic relations between genus-level taxa within the species-rich tribe Arvicolini and, in particular, allowed us to advance a new hypothesis on the phylogenetic placement of the monotypic genus Lemmiscus. At the same time, the results of mitogenome analysis in that work failed to uncover the phylogenetic position of the genus Arvicola, to resolve the trichotomy of the tribes Ellobiusini, Arvicolini, and Lagurini and the phylogenetic relations of the only extant representative of Pliomyini: the genus Dinaromys. Thus, although complete mitogenomes have been widely used in the last several decades for the reconstruction of phylogenetic relations within many groups [25,26,27], phylogenetic conclusions based only upon mitochondrial genes should be treated with caution. The main reasons are multiple events of gene introgression [28,29,30], saturation, and strong selective pressure [31,32,33]. All of the above greatly distort true phylogenetic relations.
In phylogenetics, for problems where relatively small numbers of loci do not provide sufficient information to resolve relationships but genomic data or resources are not available to develop genome scale targeted marker sets, the Double-digest restriction site-associated DNA paired-end sequencing (quaddRAD-seq) technique (hereinafter: ddRADseq) appears to be appropriate [34,35,36]. This approach inspired us here to proceed with the research on phylogenetic relations at the supraspecific level within the subfamily Arvicolinae using a comprehensive collection of tissue samples. In addition, we employed a very limited sample of freshly collected tissues for transcriptome analysis (RNA-seq), because for this analysis, it is impossible to use material stored in a collection. Applying this approach, we tested the stability of phylogenies derived from various numbers of genes and taxa, and this dataset is expected to be utilized in our further work in a search for selective signatures.
As a result, using two datasets—one from transcriptome data (but with limited taxa representation) and the other one based on single-nucleotide polymorphisms (SNPs) and on the comprehensive sample—we aimed to test whether the data from the nuclear genome are consistent with the tree inferred from the mitogenome both in topology and divergence dating. The specific questions that we wanted to answer deal with (1) the order of divergence within the first radiation and the position of Prometheomyini and (2) the order of divergence of tribe-level and genus-level taxa within the third most diverse radiation, namely resolving the trichotomy of Lagurini, Ellobiusini, and Arvicolini and, in particular, inferring the phylogenetic position of genera Dinaromys and Arvicola.

2. Materials and Methods

2.1. Sampling

The transcriptomic dataset contained data from 30 species: 29 Arvicolinae representatives belonging to eight tribes and 18 genera (Table S1); the Chinese hamster Cricetulus griseus Milne-Edwards, 1867, served as an outgroup. For 19 species, transcripts were either obtained from the National Center for Biotechnology Information (NCBI) or sequenced and assembled previously [37,38]. Eleven species were sequenced for the first time in the current study.
The dataset for the ddRADseq analysis contained 51 Arvicolinae species affiliated with 26 genera (Table S1). All ddRADseq data were obtained in the current study.
For DNA isolation, muscle tissue samples were fixed in 96% ethanol and stored at −20 °C. For the subsequent RNA isolation, a tissue mix (muscles, liver, heart, lungs, and testes for males) was fixed in the intactRNA buffer (Evrogen, Moscow, Russia) to avoid RNA degradation at the moment of catching of an animal in the field. This study was conducted according to the guidelines of the Declaration of Helsinki and was approved by the Ethics Committee of the Zoological Institute of the Russian Academy of Sciences (permission No. 2-17/24 September 2024).
NCBI accession numbers for both RNA-seq and ddRADseq SRA data are given in the Supplementary Materials (Table S1).

2.2. DNA and RNA Isolation, Library Preparation, and Sequencing

Total RNA was isolated from the tissue mix using the RNeasy Mini Kit (Qiagen) Hilden, Germany according to the animal cells/spin protocol. RNA quality was evaluated on a Bioanalyzer 2100 instrument (Agilent Genomics, Boulder, CO, USA), ensuring a minimum RNA Integrity Number of 7.0. DNA libraries were prepared by a combined protocol of the NEBNext Poly(A) mRNA Magnetic Isolation Module and the NEBNext Ultra II Directional RNA Library Prep Kit for Illumina. DNA concentrations were quantified on a Qubit 2.0 fluorometer (Invitrogen, Waltham, MA, USA). Nucleic-acid samples were sequenced on the Illumina HiSeq 4000 sequencing platform producing paired-end reads with an average length of 75 bp per read.
Total DNA was isolated from muscle tissue samples with the QIAmp DNA Mini Kit (lot # 160049272) and was eluted with 50 µL of nuclease-free water. Then, the concentration of the pure DNA was measured on the Qubit 2.0 fluorometer. The ddRADseq library preparation was performed according to a standard protocol [39] with modifications detailed by Dvoyashov et al. [30]. The concentration of the obtained libraries was measured on the Qubit 2.0 fluorometer. The quality and length of the libraries were checked by means of the Agilent 2100 Bioanalyzer automated electrophoresis system. Samples were sequenced on the Illumina HiSeq 4000 sequencing platform producing paired-end reads with an average length of 150 bp per read.
DNA and RNA isolation, library preparation, and sequencing were performed with the help of Skoltech Genomics Core Facility resources (https://www.skoltech.ru/research/en/grants-contracts/ (accessed on 3 June 2022)).

2.3. Phylogenetic-Tree Reconstruction Using the Transcriptomic Dataset

Quality control checks of raw sequence data were performed in FastQC v.0.11.9 [40] (http://www.bioinformatics.babraham.ac.uk/projects/fastqc/ (accessed on 10 April 2020)). Reads were trimmed with Trimmomatic v.0.36 [41]. Adaptors were removed with fastp [42], and contaminated reads were filtered out by means of Bowtie v.2.3.5.1 [43]. Each sample was de novo assembled in Trinity v.2.1.1 [44] with default parameters. The completeness of the assemblies was assessed with the help of BUSCO v.5.4.2 and the mammalia odb10 database [45]. The assembly statistics are provided in Table S2. TransDecoder v.5.5.0 (https://github.com/TransDecoder/TransDecoder (accessed on 3 June 2022)) was used to predict the corresponding set of coding nucleotide and amino acid sequences in the assembled transcriptomes. To reduce redundancy in the predicted sequences, we employed CD-HIT v.4.8.1 [46] with an identity threshold of 0.99, aiming to prevent the exclusion of paralogs. Single-copy protein orthologs were detected with Proteinortho v.6.2.3 [47]. A total of 1104 orthologs present in each studied species were identified. The respective coding sequences were aligned in PRANK v.170427 [48] and trimmed both automatically with bioutils (https://github.com/mkviatkovskii/bioutils (accessed on 3 June 2022)) and manually using Ugene v.48.1 [49]. Trimmed gene alignments, 1069 in total, were concatenated into a supermatrix containing 792,000 loci using SeqKit v.2.3.1 [50].
We performed multiple phylogenetic analyses via concatenation (maximum likelihood [ML] analysis in IQ-TREE2, Bayesian analysis in BEAST2, and fossil calibrations) and coalescent tree-building methods (StarBeast3, ASTRAL-III, and wASTRAL). Visualization of phylogenetic trees was conducted using FigTree v.1.4.4 (http://tree.bio.ed.ac.uk/software/figtree/ (accessed on 26 November 2021)).
The concatenated supermatrix, which underwent additional filtering in GBlocks v.0.91b [51] (with default parameters), comprised 786,579 aligned loci and served as input for concatenation-based methods. An ML-concatenated tree was inferred in IQ-TREE v.2.2.2.7 [52] with 10,000 ultrafast bootstrap replicates [53] under a best-fit nucleotide substitution model selected automatically by ModelFinder [54].
We inferred 1069 individual gene trees from nucleotide alignments by the ML method implemented in ParGenes v.1.2.0 [55] with 100 bootstrap replicates. ModelTest-NG (https://github.com/ddarriba/modeltest (accessed on 6 May 2024)) and RAxML-NG [56] were employed to perform model selection and tree inference, respectively. To visualize gene trees together, we converted them into rooted ultrametric trees using the python ete3 package [57] and plotted them in DensiTree v.3.0.2 [58]. Gene tree topologies were utilized as input for ASTRAL-III v.5.7.8 [59] and wASTRAL v.1.18.3.5 [60] (hybrid weighting) to reconstruct a species tree.
Bayesian estimation of species-level phylogeny was inferred using StarBeast3 [61]. The analysis was repeated several times on different sets of orthologs. Firstly, we randomly split 1069 gene alignments into 11 groups comprising 100 orthologs each (10 groups), and 69 orthologs ended up in the remaining group. Each group was analyzed individually by means of StarBeast3 via a general time reversible (GTR) model, with base frequencies estimated from the data. Secondly, we performed the analysis on two sets of genes by randomly splitting the original 1069 alignments into sets of 534 and 535. Thirdly, we ran the analysis on all 1069 alignments together. For the latter two analyses, we chose the Jukes-Cantor (JC69) substitution model. In all analyses, the Yule model and a species tree relaxed clock were employed. Model parameter values were unlinked, and each analysis ran for at least 20 million generations and was performed at least three times. Convergence of the runs and adequate effective sample sizes were assessed in Tracer v.1.7 [62]. Species trees were produced via combining of the trees, with a burn-in of 10–20% from the runs using LogCombiner before visualization in DensiTree. Consensus species trees were summarized in TreeAnnotator with the maximum clade credibility tree option and median heights as node heights.

2.4. Phylogenetic-Tree Reconstruction Using the ddRADseq Dataset

The sequence reads from the DNA samples were demultiplexed by means of outer indexes in bcl2fastq 2.20 (https://support.illumina.com/downloads/bcl2fastq-conversion-software-v2-20.html (accessed on 6 November 2023)). Next, the reads were processed in Fastp [42] with default settings to remove adapters and perform quality filtering. PCR duplicates were removed using the clone_filter program from the Stacks v.2.6.0 software suite [63]. The data from the DNA samples were demultiplexed by means of inner indexes with the help of the process_radtags program from Stacks.
The quality of the raw reads was evaluated using FastQC v.0.11.9 [40], and then they were aligned on a reference (Mynomes ochrogaster Wagner, 1842) genome (GCF_902806735.1) in BWA v.0.7.17 [64] with default settings. The generated SAM files were sorted and converted to BAM format, with the exclusion of reads having mapping quality (mapq) below 30, using SAMtools v.1.18 [65]. The identification of orthologous loci and SNPs within them was conducted using the ref_map.pl script from the Stacks v.2.6.0 software [63] with the flag-R 1 (all individuals are necessary to process a locus). The resulting VCF file was transformed into FASTA format by means of vcf2phylip v.2.0 [66]. Descriptive statistics of the ddRADseq dataset are provided in Table S3.
Raw whole-genome sequencing reads for the outgroup species, C. griseus, were obtained from the NCBI database (accession numbers SRR329953 and SRR329954) and mapped onto the M. ochrogaster genome. After that, SNPs were identified in regions where they were present in our ddRADseq data using the SAMtools v.1.18 [65] mpileup and VarScan v.2.3.9 [67] pileup2cns commands. These data were converted to FASTA format in AWK v4.2.1 and added to a FASTA file.
An ML phylogenetic tree was constructed in RAxML-NG v.1.2.2 [56] via the GTR + G model of nucleotide evolution (-m flag) with 1000 bootstrap replicates.

2.5. Molecular Dating
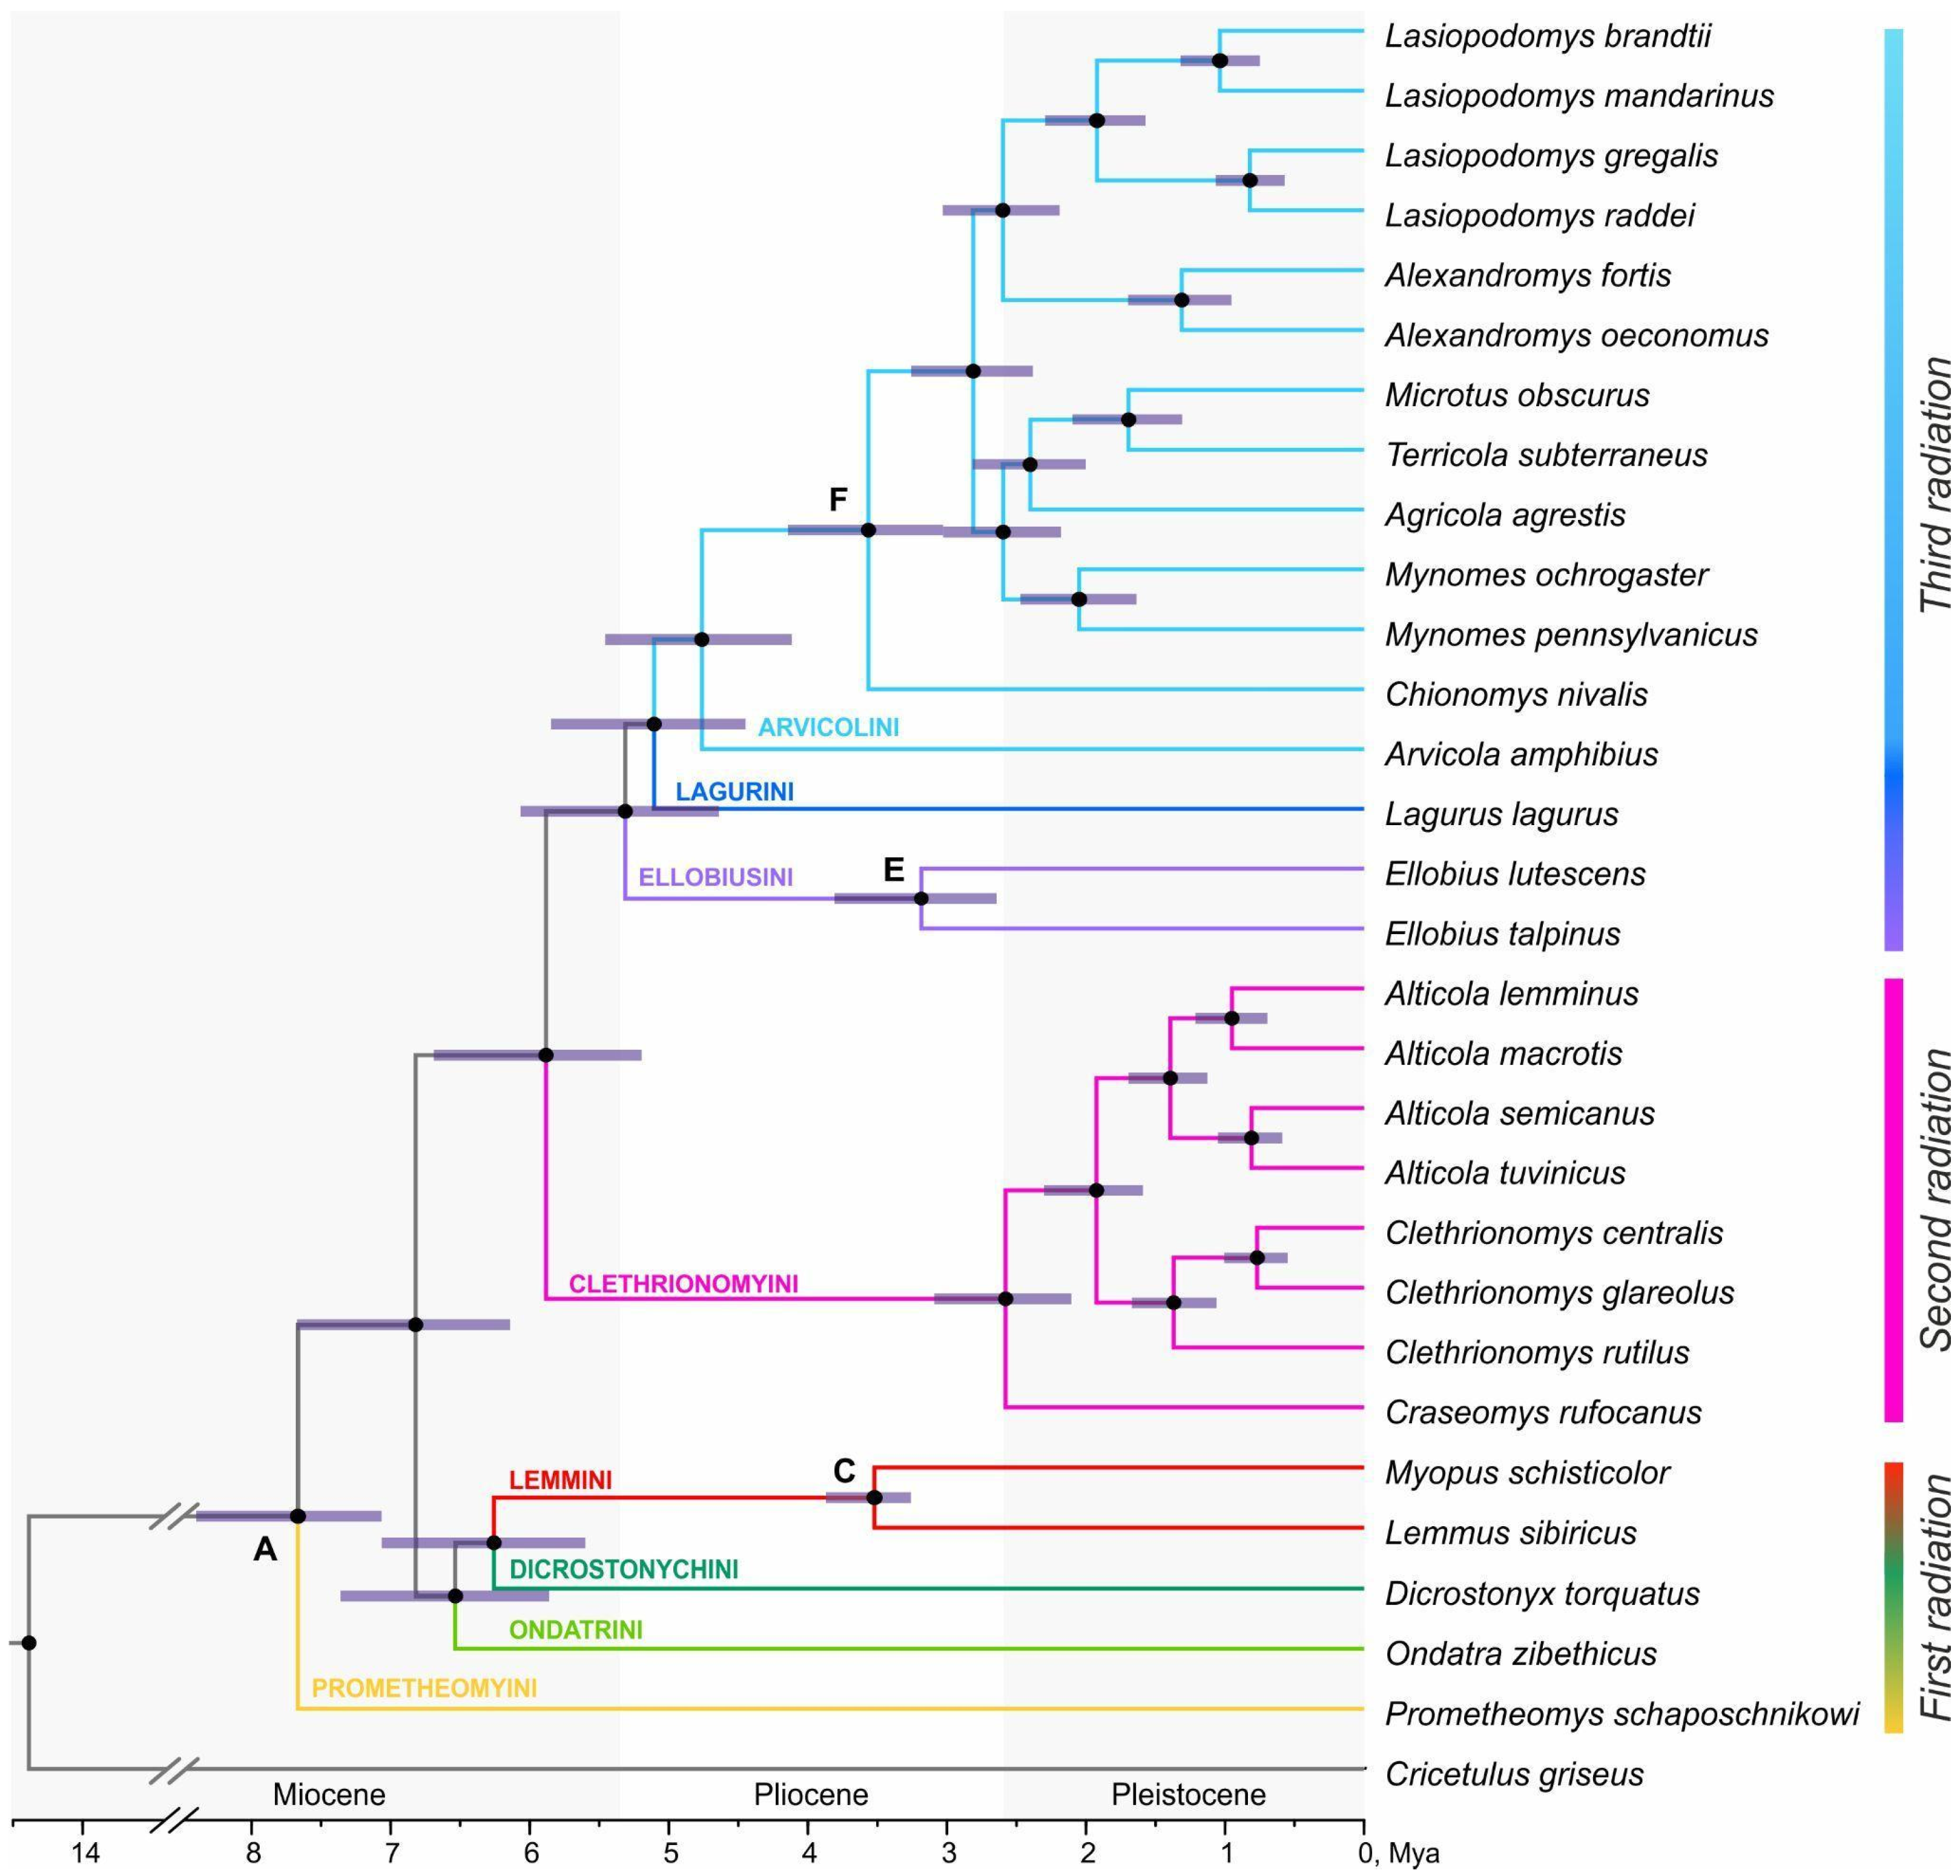
Divergence times were estimated by means of the concatenated transcriptomic dataset and ddRADseq dataset via Bayesian inference (BI) implemented in BEAST v.2.7.5 [68]. An XML file for BEAST was generated by means of BEAUti. Site model parameters were inferred during the Markov chain Monte Carlo analysis in bModelTest v.1.3.3 [69]. An optimized lognormal relaxed clock and the Yule branching model with a uniform prior were employed. We used fossil calibration schemes as described by Abramson et al. [7], applying four calibrations to the transcriptomic dataset and six to the ddRADseq dataset (Table S4). Each analysis was run for 20–40 million generations. Trace files were assessed in Tracer to ensure the convergence of independent runs. Trees from two independent runs were combined with LogCombiner (with 10% discarded as burn-in) and were summarized with TreeAnnotator using the maximum clade credibility tree option and mean heights as node heights. To validate the result, we repeated analyses with each calibration alternately excluded (Table S5) and executed the analyses without data to sample from a prior.

3. Results

3.1. Transcriptome Sequencing and Assembly

Transcriptomic data from 11 Arvicolinae species were sequenced for the first time in this study. De novo transcriptome assembly yielded between 43,277 and 518,062 transcripts, with N50 values ranging from 1168 to 2963 and the percentage of complete BUSCOs from 39 to 75.1 (Table S2), which was sufficient for the subsequent phylogenetic analysis. We compiled newly obtained transcriptomic datasets along with data from 18 Arvicolinae species and an outgroup, C. griseus, available in NCBI (Table S1). A Proteinortho search for single-copy orthologs followed by an additional filtering resulted in 1069 orthologs that are present in all 30 species. The aligned CDS of the orthologs had an average length of 741 bp, with an average gap proportion of 0.2%. After concatenation and filtering with Gblocks, the total concatenated alignment length was 786,579 bp, with an average gap proportion of 0.07%.

3.2. Phylogenetic Inference from the Transcriptomic Dataset

The ML analysis (IQ-TREE) and summary coalescence-based methods (ASTRAL-III and wASTRAL) applied to the transcriptomic data of Arvicolinae revealed the same, fully supported topology (Figure 1 and Figures S1–S3). The resulting phylogeny shows the basal position of Prometheomys Satunin, 1901, and the subsequent divergence of two clusters: the first one containing the tribes Ondatrini, Lemmini, and Dicrostonychini (two groups of lemmings turned out to be sister clusters) and the second cluster uniting representatives of the second and third radiations. Within the third radiation, the tribe Ellobiusini appears to be an earlier derivative, while the tribe Lagurini is a sister taxon to Arvicolini. Arvicola proved to be the basal genus within Arvicolini. Within the tribe Clethrionomyini, genera Alticola Blanford, 1881, and Clethrionomys are monophyletic.
Species tree reconstruction was performed using ASTRAL-III and wASTRAL (summary coalescence-based methods) as well as StarBeast3 (a Bayesian multispecies coalescent method). As input to the summary methods, we used 1069 gene tree topologies. Both summary methods yielded the same species tree topology and identical branch local posterior probabilities of 0.99–1.00, supporting the ML topology (Figure 1 and Figures S1–S3). Additionally, we visualized all 1069 gene trees together in DensiTree (Figure S4). The obtained plot illustrates a distribution across all possible topologies, highlighting an increase in uncertainty—inside clades—from leaves to a root.
Bayesian species tree analysis was run multiple times on different datasets: the full analysis of 1069 gene alignments (Figure 2), an analysis of the dataset randomly split in half (Figure S5), and an analysis of 11 subsets with 100 genes each at most (Figure S6). We observed variations of species tree topologies and of the statistical support of certain nodes inferred by StarBeast3 as compared to the results from other tools. Differences depending on the set of genes serving as input to StarBeast3 were also evident. The most notable inconsistency across all StarBeast3 runs was the unstable position of Lagurus lagurus Pallas, 1773. It was inferred that this species is either a sister taxon to the second and third radiations (Figures S5A and S6A,C–F,J) or nested within the first radiation (Figure 2, Figures S5B and S6B,G–I,K). Phylogenetic relations within the first radiation were also unstable and depended on the number of genes used. In some cases, we noticed the earliest derivation of true lemmings (Myopus schisticolor Lilljeborg, 1844, and Lemmus sibiricus Kerr, 1792) among Arvicolinae taxa (Figure 2, Figures S5A and S6B,F,G,J), and Ondatra Link, 1795, was found to be a sister taxon to Dicrostonyx Gloger, 1841 (Figure 2). Aside from the variations listed above, the monophyly of the radiations persisted, and the topology at the genus-level was consistent with the ML topology. Notably, in all analyses, the relationships within the tribe Clethrionomyini remained stable.

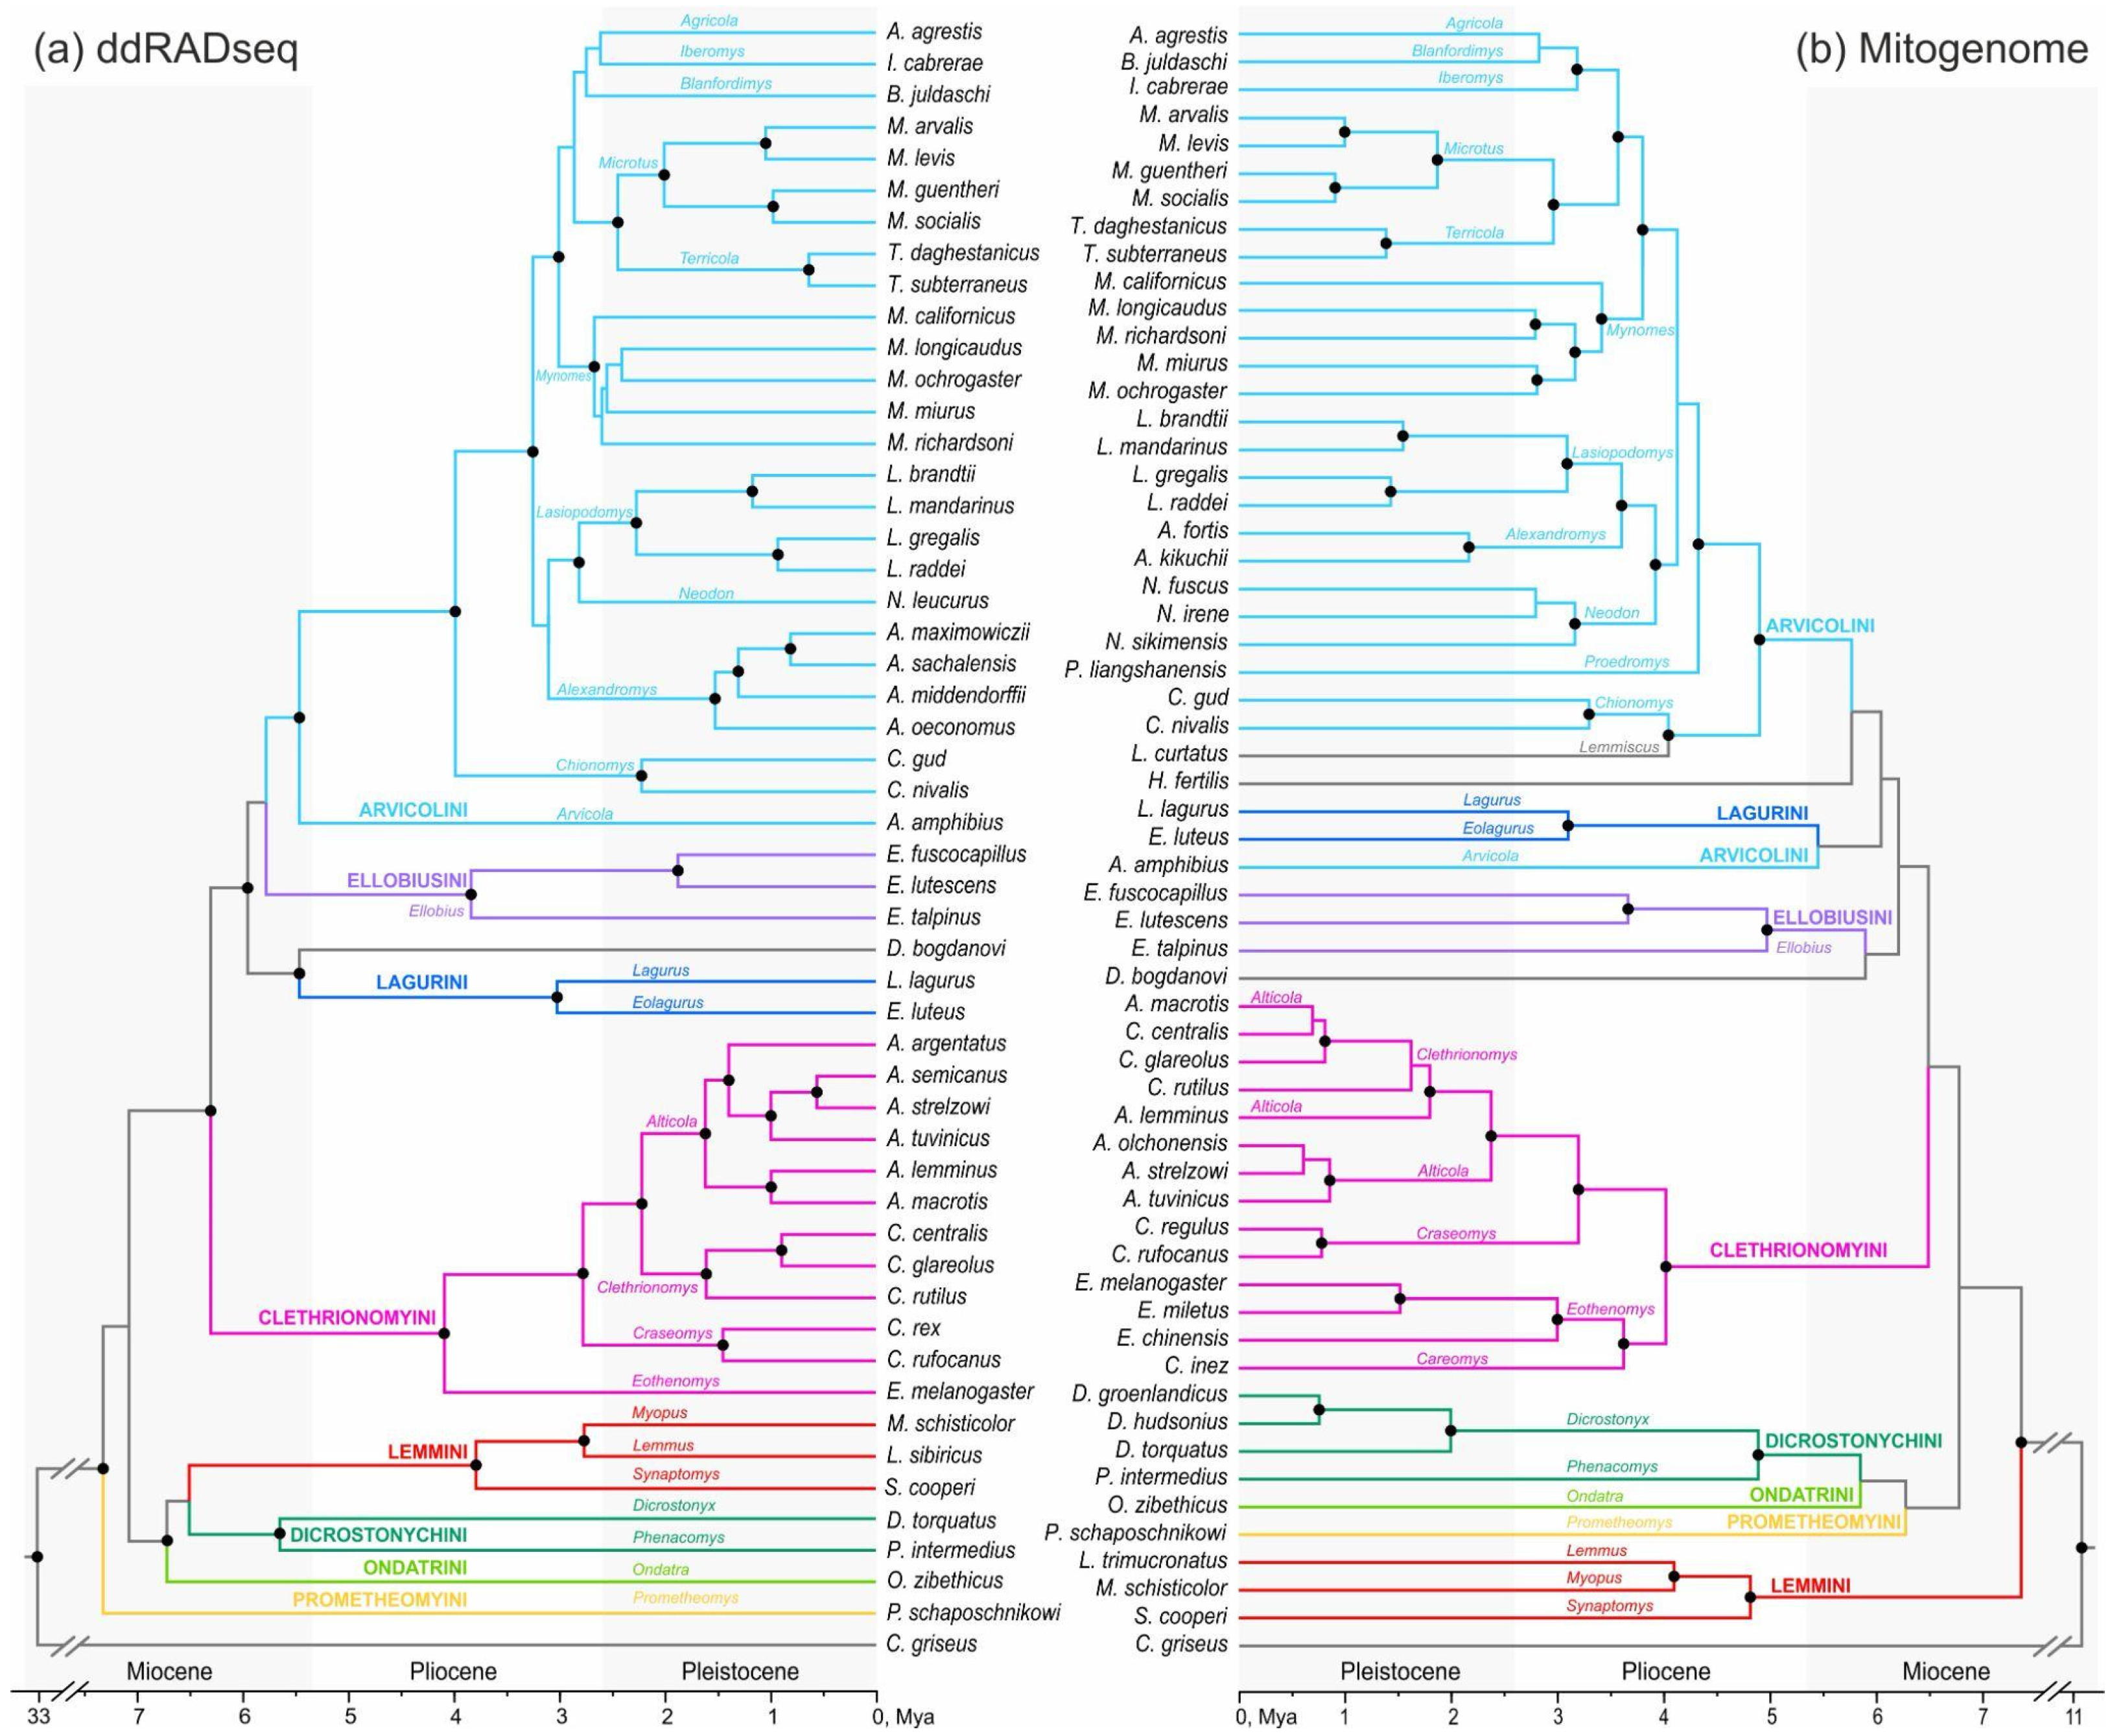
3.3. DdRADseq-Based Phylogenetic Reconstruction

The resulting dataset comprised 15,899 variable sites (SNPs), with no missing sites for any individuals except the outgroup. The outgroup sample (C. griseus) contained only 9832 of these SNPs.
The topology based on the results of the ddRADseq analysis (Figure 3 and Figure S7) revealed a trichotomy at the base of the tree: the basal position of Prometheomys is not supported. For the rest of the nodes, BI support is quite high (most of the major nodes are supported at the 1.0 level), while ML support is slightly weaker. The muskrat (Ondatra zibethicus) turned out to be external to the cluster that unites true (Lemmini) and collared lemmings (Dicrostonychini). Within the third radiation, the cluster combining Dinaromys and Lagurini (with maximum support) was found to be derived earlier, before Ellobiusini branched off. Arvicola is the early derivative within the tribe Arvicolini.

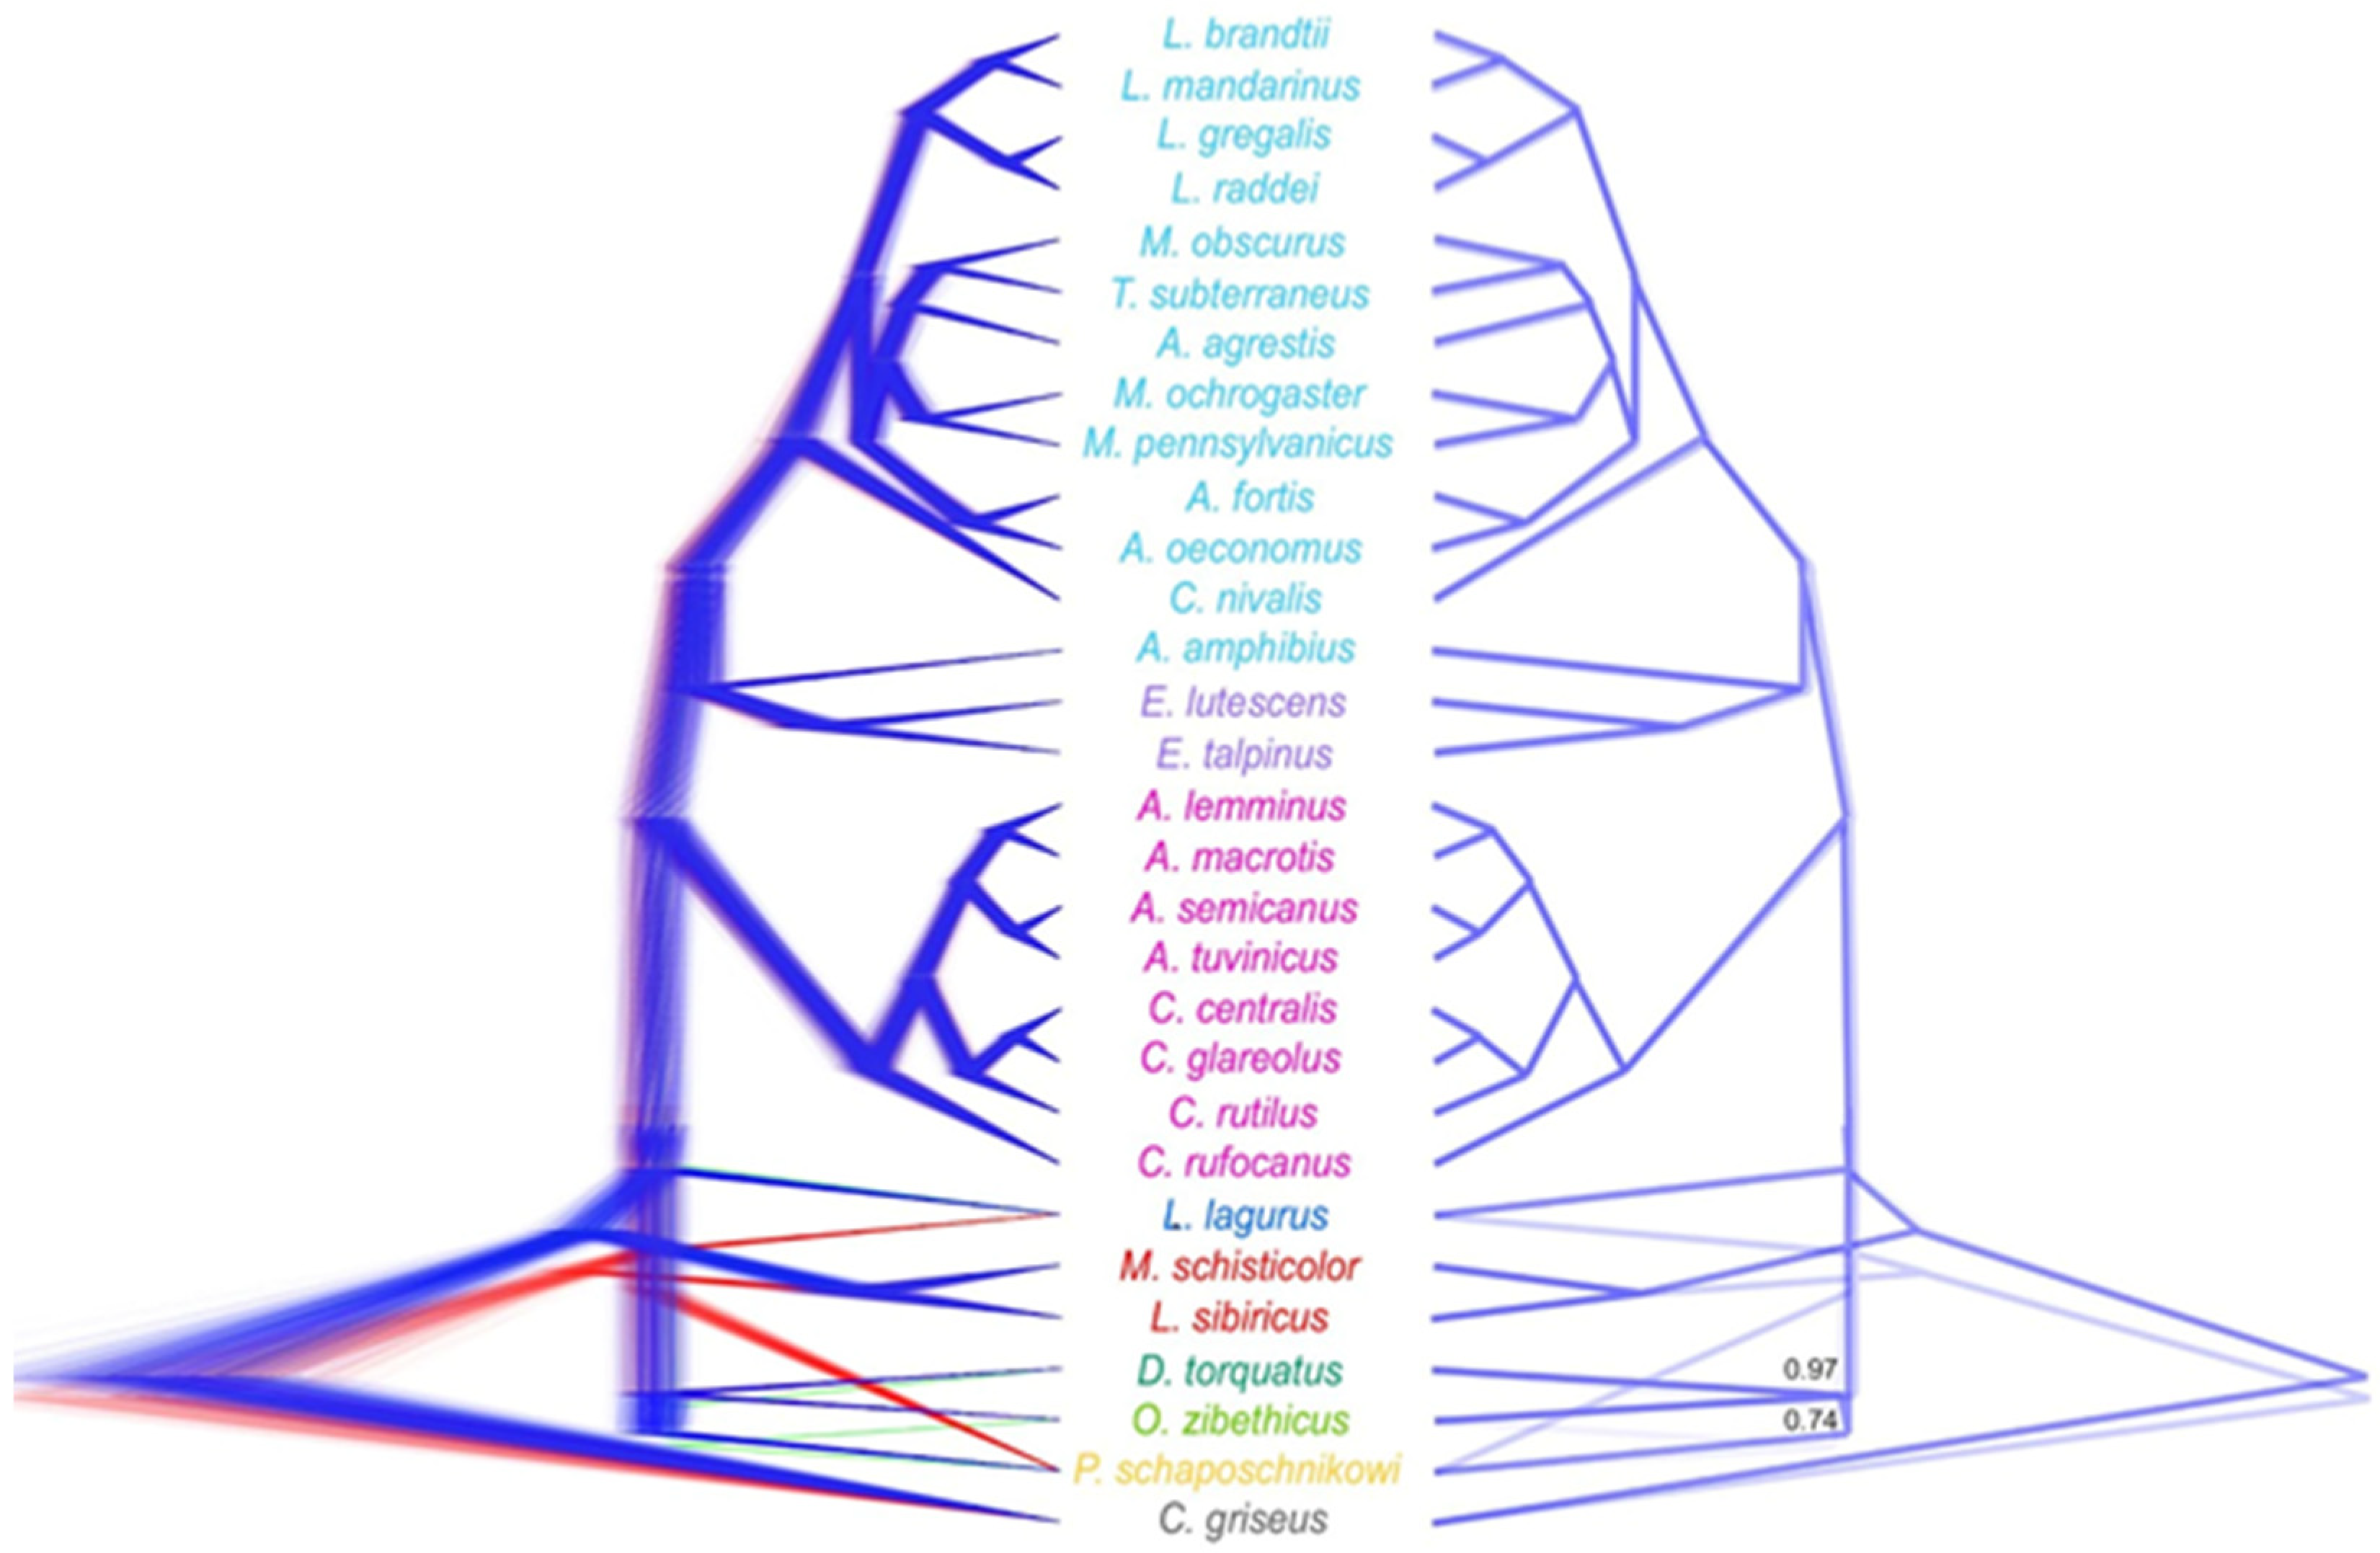
3.4. Divergence Dating

Fossil-constrained molecular dating based on the RNA-seq data yielded a fully resolved tree with all branches supported by maximum posterior probabilities (Figure 1). When each calibration was excluded one at a time, the resulting divergence times remained stable (Table S5). According to this analysis, Arvicolinae branched off from Cricetidae in the Middle Miocene: ~14.4 Ma (95% HPD: 10.39–18.54). Four surviving tribes of the first rapid radiation—Prometheomyini, Ondatrini, Dicrostonychini, and Lemmini—seemed to originate approximately within the Late Miocene [~6.3 Ma (95% HPD: 5.6–7.07) to 7.7 Ma (95% HPD: 7.07–8.53)]. The species belonging to the second radiation (tribe Clethrionomyini) have gradually evolved starting from the Pliocene–Pleistocene border ~2.6 Ma (95% HPD: 2.11–3.09). According to our estimates, the most diverse radiation (the third one) started on the Miocene–Pliocene border, ~5.3 Ma (95% HPD: 4.64–6.07), when Ellobiusini branched off from Lagurini and Arvicolini. The most recent common ancestor (MRCA) of Lagurini and Arvicolini was dated at ~5.11 Ma (95% HPD: 4.45–5.85). The diversification of species within Arvicolini began in the Pliocene ~4.8 (95% HPD: 4.11–5.46), and the diversification within Arvicolini sensu stricto (the node designated here as “F”: all the representatives of the Arvicolini tribe, with the exception of the basal Arvicola) started at ~3.56 Ma (95% HPD: 3.03–4.14) and continued into the Pleistocene. The most recent clade among those analyzed corresponding to the genus Alexandromys Ognev, 1914, diversified ~1.3 Ma (95% HPD: 0.95–1.7).
The calibrated tree built from the ddRADseq data (Figure 3) was found to be slightly less supported than the transcriptomic one. With the alternate exclusion of each of six calibrations, the dating values slightly differed only in the absence of the deepest of them: the MRCA of Arvicolinae, node “A” (Table S6). With the exclusion of this calibration point, node age estimates, especially those close to the root of the tree, appeared to be younger. In particular, these are the nodes of the origin of the subfamily, the split of Dicrostonychini/Lemmini and Ondatrini/(Dicrostonychini + Lemmini) and the split of Clethrionomyini. According to SNP analysis, Arvicolinae branched off from Cricetidae 33 Ma. The first rapid radiation occurred ~6.51 Ma (95% HPD 5.94–7.03) to 7.33 Ma (7.05–7.73). The second radiation began ~4.09 Ma (3.41–4.78). According to the findings of the ddRADseq analysis, the last radiation (the third one) began ~5.96 Ma (5.37–6.54); Lagurini and the Dinaromys cluster derivate first, whereas the MRCA of this group was assigned to ~5.47 Ma (95% HPD: 4.89–6.06). The MRCA of Ellobiusini and Arvicolini was dated at ~5.78 Ma (95% HPD: 5.22–6.38). The divergence within Arvicolini began ~5.47 Ma (95% HPD: 4.88–6.04), and the divergence within Arvicolini sensu stricto at ~3.99 Ma (3.47–4.51).

4. Discussion

4.1. Features of the Different Radiation Waves Within Arvicolinae

The difficulties with untangling phylogenetic relations within the first and third radiation waves are caused by various factors. Even though both have involved very rapid diversification, within the first radiation—aside from complexities caused by the relatively small amount of time that separated ancestral lineages—the matters are further complicated by large amounts of divergence time separating the extant taxa. Moreover, this radiation contains a large number of extinct forms, and therefore the final sample of recent forms represents a small proportion of the diversity of this radiation. These facts taken together lead to an artifact: the so-called long branch attraction [70]. In this situation, a short internode time span that causes lineage sorting issues is next superimposed on lineage-specific changes that follow the divergence.
The third and last radiation is also characterized by very a rapid diversification of lineages but differs from the first one in radiation depth, which is almost twofold less. Consequently, these radiation waves differ principally, in the shape of the bush-like tree [71]. The outer branches leading to extant taxa within the last radiation are thus much shorter and the ratio of recent to extinct genera is in favor of the recent. As emphasized repeatedly [70,71], both cases of rapid radiation producing bushes of various shapes are difficult to resolve via a straightforward approach based on an analysis of individual loci because separate gene trees do not necessarily reflect a species tree [72].
It is no surprise that all previous attempts involving a few loci [4,6,11,14,24] have given insufficient resolution of the subfamily tree. Accordingly, much hope for resolving the bush-like tree caused by the rapid radiation waves has been placed on a substantial increase in the number of the molecular traits used. With the advent and rapid development of new sequencing technologies and bioinformatics, this hope has become a completely feasible reality. As compared to previous technologies, the number of molecular markers being assessed has grown by hundreds of thousands. Impressive results have been obtained in the resolving of cases of ancient and recent rapid radiation events [73,74]. Nonetheless, increasing the number of analyzed markers by itself cannot solve the unresolved tree problem caused by rapid diversification. To achieve success in this field, it is equally important to have as complete a sample as possible. The latter prerequisite explains why our first step [7] in attempting to resolve the complex issues of arvicoline phylogenetic relations involved an analysis of mitochondrial genomes; this is because this approach enabled the use of rare museum samples, and we included almost all extant genera and major species groups in that previous study. The sample analyzed in that work was the most comprehensive, but despite good resolution, the phylogenetic hypothesis inferred from mitogenomes requires caution owing to high saturation, a distortion related to hybridization and introgression, and a strong influence of selection on mitochondrial genes. Therefore, in the present study, we continued to test the phylogenetic relations of supraspecies taxa within the subfamily Arvicolinae using two datasets derived from nuclear data: RNA-seq (29 Arvicolinae species and 1069 genes, with total length 786,579 bp) and ddRADseq data (15,899 SNPs for 51 species). In this way, by means of these two datasets, we checked whether the data from the nuclear genome are consistent with the tree inferred from the mitogenome data both in topology and divergence dating, and finally, how serious the challenge of rapid radiation is for resolving branching at the bottom of a bush.

4.2. Phylogenetic Relations of Supraspecies Taxa Within the First Radiation

Phylogenies inferred from the RNA-seq data (Figure 1 and Figures S1–S3)—by the ML topology (IQ-TREE2), Bayesian approach (BEAST2), and summary methods for species tree estimation (ASTRAL and wASTRAL)—had overall topologies similar to those in a previous transcriptomic analysis involving 19 Arvicolinae species [38] and a limited number of genes. Compared with the tree derived from mitochondrial genomes (Figure 4b, summarized according to Abramson et al. [7]), the main discrepancies concern the basal placement of Prometheomys and a sister position of Ondatra toward the cluster of the tribes Lemmini and Dicrostonychini. Nevertheless, in species trees computed via BI in StarBeast3 (Figure 2, Figures S5 and S6) with a random subset of genes from the total sample, the topology of the resultant trees deviated from the one described above. With a decrease in the gene number and resampling, the topology within the first radiation (Figures S5 and S6) became the most unstable. Quite often, we observed the basal position of the tribe Lemmini (M. schisticolor and L. sibiricus) among Arvicolinae, similar to the mitogenomic topology (Figure 4b) [7]. In some trees, the earliest derivative was the collared lemming (Dicrostonyx), and its clustering with Ondatra was absent, but these topologies were found to not be supported.
We believe that the number of genes used in the StarBeast3 analysis directly influenced the obtained trees. When fewer genes (in our case, 100 or 69) were included in the analysis, the resulting tree showed a much greater number of different evolutionary trajectories because the input of each individual gene was more valuable, and stochastic processes affecting each individual gene were less controlled, as explained elsewhere [75]. When a larger number of genes was employed for the calculations [in our case, either half of the identified orthologs (535 or 534) or the full dataset (1069 genes)], the results became more stable, with only one dominant trajectory observed, resembling the outcome of the “concatenation” and “summary” methods. This observation is in agreement with multiple articles indicating that sampling of more genes greatly improves the accuracy of species trees [75,76,77,78]. Nonetheless, the basal position of Lagurus lagurus (which is inconsistent with the topology obtained by other phylogeny reconstruction methods) was still present in all StarBeast3 runs, possibly owing to the limited sampling (one individual per species); this is because the number of individuals per species is known to affect the accuracy of species tree topology [75,76]. Our experience with tree construction from RNA-seq data suggests that, aside from the number of genes, the number of samples in a cluster is no less important for obtaining a reliable, stable, and consistently true topology. Thus, the erroneous and unstable position of L. lagurus at the base of the Arvicolinae tree may be attributed to the absence of a close sister taxon (Eolagurus Argyropulo, 1946) and to the artifact (long branch attraction).
Due to the availability of previously fixed tissues for the analysis, the ddRADseq-based phylogeny (Figure 3 and Figure 4a) turned out to be more taxonomically complete; particularly, it included Dinaromys and several genera absent in the RNA-seq analysis (Eolagurus, Phenacomys Merriam, 1889, and Synaptomys Baird, 1857) and more representatives of the largest tribe: Arvicolini. The topology within the first radiation overall is very similar to that obtained from transcriptomes (Figure 1); in particular, the same branching order of Prometheomys and Ondatra followed by clades containing Dicrostonychini and Lemmini was reproduced. It should be pointed out that node support levels overall, especially ML support, were lower as compared to the RNA-seq analysis.

4.3. Phylogenetic Relations Within the Third Radiation

There is a difference in the branching order within the third radiation: both between the two nuclear dataset results reported here (Figure 1 and Figure 3) and between the nuclear and mitogenome data (Figure 4). The tribe Lagurini split earlier than Ellobiusini did in the tree inferred from ddRADseq (Figure 4a), although ML support was lower here than in the RNA-seq analysis, where the tribe Ellobiusini was the first one to split (while BI was maximal in both datasets). The effect of adding Dinaromys to the ddRADseq dataset cannot be ruled out. A fundamental distinctive feature of the tree topology inferred from the ddRADseq data is the position of the Balkan vole—Dinaromys. With mitogenome data [7,79], Dinaromys is reported to have a sister position toward Ellobiusini (Figure 4b), albeit without support. The phylogeny derived from our ddRADseq data shows its sister position to Lagurini with rigorous support (Figure 4a). Remarkably, both the order of divergence, namely Lagurini preceding Ellobiusini, and the clustering of Dinaromys with Lagurini have been obtained earlier, in a paper by Steppan and Schenk [6], where for these taxa, these investigators had only cytb sequences. On the other hand, these nodes in the tree depicted therein are not supported. Another important difference of the nuclear genome sequencing reported here from the mitogenome-based phylogenies [7,79] is that both RNA-seq and ddRADseq data convincingly place Arvicola basal within Arvicolini, thereby reproducing the result of Wang et al. [80] on other sampled taxa and gene sets. This finding is consistent with the fossil record and conventional taxonomy [81,82].
We deliberately do not consider here the phylogenetic relations and taxonomic structure of the largest tribe Arvicolini in detail. Overall, the order of genus-level taxa inferred here does not contradict data previously obtained in other studies based on nuclear [6,80] or mitochondrial loci [7,79]. Once again, in our opinion, this topic needs to be examined elsewhere via whole-genome sequencing with a comprehensive taxa sample, including among other genera of uncertain position such as Hyperacrius and Lemmiscus. The evidence obtained here, however, convincingly supports the monophyly of the clade with the earliest derivative of Arvicola.
Summing up the comparison of phylogenetic inferences of supraspecies taxa in the subfamily Arvicolinae among the three datasets (mitogenome, transcriptome, and SNPs) we can see that first, overall, both sets of data from the nuclear genome show good agreement, and second, it is easy to notice that the main discrepancies and uncertainty are within the first and third radiation waves, whereas relations within the second one (represented only by the tribe Clethrionomyini) show good resolution and are consistent across all the analyses and datasets. The only discordance between nuclear and mitochondrial datasets (Figure 4a,b) here is the case of Clethrionomys paraphyly in mitochondrial trees. This issue is evidently caused by either ancient introgression [30] or incomplete lineage sorting. Compared to the other radiation waves, the inner and outer branches within this tribe are almost of equal length, suggestive of a relatively uniform speed of evolution.

4.4. Comparison of Divergence Dating Results

The ages of most of the major nodes, as estimated in this study based on both the RNA-seq and ddRADseq data (Table 1), fall within the range of variation detected in the previously time-calibrated mitochondrial phylogeny [7]. The only major discrepancy is that our estimate of divergence time between Arvicolinae and Cricetinae is ca. 14.4 Ma (10.39–18.54 Ma) based on RNA-seq and 33.17 Ma (23.25–43.66 Ma) based on ddRADseq data; the latter is an implausibly old date, presumably caused by more than 30% of missing data in the outgroup C. griseus (Tables S5 and S6, respectively). It is noteworthy that the timing of the MRCA of Arvicolinae is almost consistent across all datasets (with mean values ~7.33–7.67 Ma and 95% HPDs 7.05–8.53 Ma). The estimated ages derived from the RNA-seq data are slightly younger, whereas our ddRADseq results are more similar to mitogenomic ones [7,11,79]. This pattern is especially noticeable in the second radiation (tribe Clethrionomyini) (Table 1), where the age of this radiation inferred from the RNA-seq data is significantly younger. We believe that this discordance in the age estimates is undoubtedly related to the incomplete sample in the RNA-seq data, while the inclusion of Eothenomys Miller, 1896, which is the earliest derivative within Clethrionomyini, gives a more ancient date.
The slightly younger node estimates obtained in the RNA-seq dataset may be explained by the fact that in the transcriptome data, we have a greater number of sites that are more conserved than in either the ddRADseq or mitogenome data. Moreover, both the ddRADseq and mitogenome datasets contain much more taxa, and for this reason, a direct comparison is not entirely correct. The calibrated mitochondrial phylogeny of Arvicolinae in a recent paper by Alfaro-Ibáñez et al. [79] has almost the same divergence dates for all main nodes as in our previous study [7], but by adding the mitogenome of extinct Pliomys lenki Heller, 1930, those researchers obtained the dating for a new node representing the tribe Pliomyini and divergence time of two genera (Dinaromys and Pliomys Méhely, 1914) within it at 3.8 Ma (95% HPD = 2.6–4.9 Ma). It should be kept in mind that the position of Dinaromys is one of the few principal discordances between mitochondrial and nuclear phylogenies. In the trees derived from mitochondrial data, Dinaromys—and, accordingly, Pliomys [79]—clusters with Ellobiusini, whereas nuclear ddRADseq data support Dinaromys’ close relation with Lagurini. Judging by our estimates from ddRADseq data, the most recent date of the Ellobiusini split is ca. 3.25 (2.68–3.85) (Table S6), which does not contradict the age estimate of Dinaromys or Pliomys reported above.
After the attempted random exclusion of one of the calibration points in the RNA-seq data (Table S5), the results remained quite stable. Meanwhile, in the ddRADseq dataset, with the exclusion of calibration point “A” (Arvicolinae) (Table S6), the obtained dates appeared to be significantly younger both compared to (i) the analysis with all points included and (ii) the analysis where each one of the remaining points was randomly excluded. It is even younger as compared to the one obtained by Withnell and Scarpetta [11]; those authors consciously avoided using calibration at the root of Arvicolinae, owing to the uncertain phylogenetic placement of putative early arvicoline fossils.
This effect was found to be more pronounced for the nodes that are closer to the base of the tree. This observation confirms recent findings [84] that molecular-clock estimates are sensitive to positions of calibration(s) in a phylogenetic tree.
Because calibration point “A” is close to the root of the tree, it has a greater influence on the resulting estimates, as evidenced by the outcome of this point’s exclusion. The rest of the calibration points do not have such an impact, although they constrain the tree in different nodes; all of them are close in time and represent internal calibrations. In many articles, the role of calibrations at the root of a tree or at deeper nodes has been underlined, and generally such calibrations are preferable to shallower ones [85,86,87,88]. It is noteworthy that the age estimate for the MRCA of Arvicolinae with all calibration points included proved to be identical to the one that was obtained in the analysis of RY-coded mitogenomes (Table S6).
The consistency of divergence date estimates may be explained by a rather large number of them for all the calibration points of the datasets, among which five are located close to 2.5 Ma and only one at 7 Ma. Consequently, the exclusion of one of the points near the 2.5 Ma date will not have a noticeable effect as four similar calibrations remain, whereas if we exclude the point at 7 Ma, we thus withdraw the constraint for the node of Arvicolinae, and its estimate becomes younger.

5. Conclusions

Our work based on whole-genome sequencing showed that the most plausible and reliable phylogeny of Arvicolinae at the supraspecific level can be obtained from nuclear data. Accordingly, the topology of the trees derived from nuclear datasets indicate several important points. The main inconsistency with mitochondrial data is in the topologies near the root of the first and third radiation waves. Namely, within the third radiation in nuclear datasets, we see highly resolved relations of the tribes Arvicolini, Lagurini, and Ellobiusini, which have formed polytomy in mitochondrial trees in earlier articles. Moreover, in our analysis, the genus Arvicola occupies the correct position at the base of the nominal tribe. This phylogenetic placement is consistent with morphological data and paleontological data, and taken together, this evidence favors more confidence in genome-wide nuclear datasets. The divergence dates inferred from nuclear sets overall show a good match with such dates derived from mitochondrial data but are a bit younger and therefore more plausible dates (for a review of fossil evidence for Arvicolinae, see [4,11,79] and references therein). On the other hand, as demonstrated here, divergence dating is highly dependent on the number and placement of calibration points and on the number of taxa, and hence caution should be exercised with this technique.

Supplementary Materials

The following supporting information can be downloaded at: https://www.mdpi.com/article/10.3390/d17010061/s1, Figure S1: The ML phylogenetic tree computed in IQ-TREE2 from the RNA-seq dataset (1069 concatenated genes); Figure S2: ASTRAL-III species tree estimation (1069 individual genes, the RNA-seq dataset); Figure S3: wASTRAL species tree estimation (1069 individual genes, the RNA-seq dataset); Figure S4: A total of 1069 gene trees plotted together using DensiTree (RNA-seq dataset); Figure S5: Species trees estimated by means of the RNA-seq dataset using two sets of genes [the original 1069 alignments randomly split into sets of 534 (A) and 535 (B)]; Figure S6: Species trees estimated on the basis of the RNA-seq dataset using 11 sets of genes (the original 1069 alignments randomly split into 10 sets of 100 genes and a set of the remaining 69 genes); Figure S7: The ML tree computed in RaXML-NG from the ddRADseq dataset; Table S1: Species used in this study; Table S2: Transcriptome assembly statistics; Table S3: DdRADseq dataset descriptive statistics; Table S4: Fossil calibrations used in the molecular dating; Table S5: Divergence time estimates for the major lineages within the subfamily Arvicolinae according to the transcriptomic analysis; Table S6: Divergence time estimates for the major lineages within the subfamily Arvicolinae according to the ddRADseq analysis.

Author Contributions

Conceptualization, N.A. and E.S.; methodology, E.S., O.B., S.B. and I.D.; software, E.S. and O.B.; validation, N.A., E.S. and S.B.; formal analysis, E.S., O.B., T.P. and I.D.; data curation, N.A. and S.B.; writing—original draft preparation, N.A., E.S., I.D., T.P. and S.B.; writing—review and editing, N.A., E.S., I.D., T.P. and S.B.; visualization, T.P. and E.S.; supervision, project administration, resources, and funding acquisition, N.A. All authors have read and agreed to the published version of the manuscript.

Funding

This research was funded by Russian Science Foundation grant N19-74-20110-P for all authors.

Institutional Review Board Statement

The animal study protocol was approved by the Institutional Ethics Committee of the Zoological Institute (protocol code 2-17/24 September 2024 and date of approval 24 September 2024 for studies involving animals).

Data Availability Statement

The ddRADseq and RNA-seq SRA data presented in this study are openly available in NCBI SRA; NCBI accession numbers are given in Table S1. Raw data are available upon request.

Acknowledgments

The authors thank all colleagues who helped in numerous field research trips and shared materials necessary for the study: A.V. Abramov, F.N. Golenishchev, V.G. Malikov, M.V. Gavrilo, K.Yu. Zueva, and A.V. Smorkatcheva (St. Petersburg); A.A. Lissovsky, Ya.A. Redkin, A.A. Bannikova, A.V. Surov, L.A. Khlyap, and A.V. Chabovskiy (Moscow); G.B. Bakhtadze (Rostov-on-Don); A.S. Grafodatsky and T.A. Dupal (Novosibirsk); Vinogradov V.V. (Krasnoyarsk); V.V. Zaika and A.N. Kuksin (Kyzyl); N.E. Dokuchaev (Magadan); A.P. Nikanorov (Kamchatka); A. Grachev (Almaty, Kazakhstan); A. Mahmoudi (Urmia, Iran); A.V. Borisenko (Guelph, Canada); and E. Buzan (Ljubljana, Slovenia). We would like to thank the Genomics Core Facility of the Skolkovo Institute of Science and Technology for the NGS library preparation. In addition, we would like to thank our former colleagues E.A. Genelt-Yanovskiy and L.S. Tursunova for maintaining a creative and friendly atmosphere in the laboratory and for assistance and support in the field and laboratory research. We also thank two anonymous reviewers for taking time and their fruitful comments that help to improve the initial version of the manuscript The English language was corrected by shevchuk-editing.com.

Conflicts of Interest

The authors declare no conflicts of interest. The funders had no role in the design of the study; in the collection, analyses, or interpretation of the data; in the writing of the manuscript; or in the decision to publish the results.

References

  1. Fejfar, O.; Heinrich, W.-D.; Kordos, L.; Maul, L.C. Microtoid Cricetids and the Early History of Arvicolids (Mammalia, Rodentia). Palaeontol. Electron. 2011, 14, 1–38. [Google Scholar]
  2. Martin, R.A. Arvicolidae. In Evolution of Tertiary Mammals of North America; Janis, C.M., Gunnell, G.F., Uhen, M.D., Eds.; Cambridge University Press: Cambridge, UK, 2007; Volume 2, pp. 480–497. [Google Scholar]
  3. Conroy, C.J.; Cook, J.A. MtDNA Evidence for Repeated Pulses of Speciation Within Arvicoline and Murid Rodents. J. Mamm. Evol. 1999, 6, 221–245. [Google Scholar] [CrossRef]
  4. Abramson, N.I.; Lebedev, V.S.; Tesakov, A.S.; Bannikova, A.A. Supraspecies Relationships in the Subfamily Arvicolinae (Rodentia, Cricetidae): An Unexpected Result of Nuclear Gene Analysis. Mol. Biol. 2009, 43, 834–846. [Google Scholar] [CrossRef]
  5. Fabre, P.-H.; Hautier, L.; Dimitrov, D.; P Douzery, E.J. A Glimpse on the Pattern of Rodent Diversification: A Phylogenetic Approach. BMC Evol. Biol. 2012, 12, 88. [Google Scholar] [CrossRef] [PubMed]
  6. Steppan, S.J.; Schenk, J.J. Muroid Rodent Phylogenetics: 900-Species Tree Reveals Increasing Diversification Rates. PLoS ONE 2017, 12, e0183070. [Google Scholar] [CrossRef] [PubMed]
  7. Abramson, N.I.; Bodrov, S.Y.; Bondareva, O.V.; Genelt-Yanovskiy, E.A.; Petrova, T.V. A Mitochondrial Genome Phylogeny of Voles and Lemmings (Rodentia: Arvicolinae): Evolutionary and Taxonomic Implications. PLoS ONE 2021, 16, e0248198. [Google Scholar] [CrossRef] [PubMed]
  8. Susko, E.; Roger, A.J. Long Branch Attraction Biases in Phylogenetics. Syst. Biol. 2021, 70, 838–843. [Google Scholar] [CrossRef] [PubMed]
  9. Koufos, G.D. The Villafranchian Mammalian Faunas and Biochronology of Greece. Boll. Della Soc. Paleontol. Ital. 2001, 40, 217–223. [Google Scholar]
  10. Jánossy, D. Pleistocene Vertebrate Faunas of Hungary; Developments in Palaeontology and Stratigraphy; Elsevier: Amsterdam, The Netherlands, 1986; ISBN 978-0-08-086849-3. [Google Scholar]
  11. Withnell, C.B.; Scarpetta, S.G. A New Perspective on the Taxonomy and Systematics of Arvicolinae (Gray, 1821) and a New Time-Calibrated Phylogeny for the Clade. PeerJ 2024, 12, e16693. [Google Scholar] [CrossRef]
  12. Thompson, R.S.; Fleming, R.F. Middle Pliocene Vegetation: Reconstructions, Paleoclimatic Inferences, and Boundary Conditions for Climate Modeling. Mar. Micropaleontol. 1996, 27, 27–49. [Google Scholar] [CrossRef]
  13. Kohli, B.A.; Speer, K.A.; Kilpatrick, C.W.; Batsaikhan, N.; Damdinbaza, D.; Cook, J.A. Multilocus Systematics and Non-Punctuated Evolution of Holarctic Myodini (Rodentia: Arvicolinae). Mol. Phylogenet. Evol. 2014, 76, 18–29. [Google Scholar] [CrossRef]
  14. Buzan, E.V.; Krystufek, B.; Hänfling, B.; Hutchinson, W.F. Mitochondrial Phylogeny of Arvicolinae Using Comprehensive Taxonomic Sampling Yields New Insights: Phylogeny of Arvicolinae. Biol. J. Linn. Soc. 2008, 94, 825–835. [Google Scholar] [CrossRef]
  15. Bodrov, S.Y.; Kostygov, A.Y.; Rudneva, L.V.; Abramson, N.I. Revision of the Taxonomic Position of the Olkhon Mountain Vole (Rodentia, Cricetidae). Biol. Bull. 2016, 43, 136–145. [Google Scholar] [CrossRef]
  16. Tryfonopoulos, G.; Thanou, E.; Chondropoulos, B.; Fraguedakis-Tsolis, S. mtDNA Analysis Reveals the Ongoing Speciation on Greek Populations of Microtus (Terricola) Thomasi (Arvicolidae, Rodentia): Ongoing Speciation in Greek Voles. Biol. J. Linn. Soc. 2008, 95, 117–130. [Google Scholar] [CrossRef]
  17. Paupério, J.; Herman, J.S.; Melo-Ferreira, J.; Jaarola, M.; Alves, P.C.; Searle, J.B. Cryptic Speciation in the Field Vole: A Multilocus Approach Confirms Three Highly Divergent Lineages in Eurasia. Mol. Ecol. 2012, 21, 6015–6032. [Google Scholar] [CrossRef] [PubMed]
  18. Musser, G.G.; Carleton, M.D. Superfamily Muroidea. In Mammal Species of the World: A Taxonomic and Geographic Reference; Wilson, D.E., Reeder, D.M., Eds.; The Johns Hopkins University Press: Baltimore, MD, USA, 2005; pp. 894–1531. [Google Scholar]
  19. Abramson, N.I.; Lissovsky, A.A. Subfamily Arvicolinae. In The Mammals of Russia: A Taxonomic and Geographic Reference; Pavlinov, I.Y., Lissovsky, A.A., Eds.; KMK Scientific Press: Moscow, Russia, 2012; pp. 127–141. [Google Scholar]
  20. Romanenko, S.A.; Serdyukova, N.A.; Perelman, P.L.; Trifonov, V.A.; Golenishchev, F.N.; Bulatova, N.S.; Stanyon, R.; Graphodatsky, A.S. Multiple Intrasyntenic Rearrangements and Rapid Speciation in Voles. Sci. Rep. 2018, 8, 14980. [Google Scholar] [CrossRef] [PubMed]
  21. Kryštufek, B.; Shenbrot, G. Voles and Lemmings (Arvicolinae) of the Palaearctic Region; University of Maribor, University Press: Maribor, Slovenia, 2022; ISBN 978-961-286-611-2. [Google Scholar]
  22. De Queiroz, K.; Gauthier, J. Phylogenetic Taxonomy. Annu. Rev. Ecol. Syst. 1992, 23, 449–480. [Google Scholar] [CrossRef]
  23. De Queiroz, K.; Gauthier, J. Toward a Phylogenetic System of Biological Nomenclature. Trends Ecol. Evol. 1994, 9, 27–31. [Google Scholar] [CrossRef] [PubMed]
  24. Galewski, T.; Tilak, M.; Sanchez, S.; Chevret, P.; Paradis, E.; Douzery, E.J. The Evolutionary Radiation of Arvicolinae Rodents (Voles and Lemmings): Relative Contribution of Nuclear and Mitochondrial DNA Phylogenies. BMC Evol. Biol. 2006, 6, 80. [Google Scholar] [CrossRef] [PubMed]
  25. Hassanin, A.; Bonillo, C.; Tshikung, D.; Pongombo Shongo, C.; Pourrut, X.; Kadjo, B.; Nakouné, E.; Tu, V.T.; Prié, V.; Goodman, S.M. Phylogeny of African Fruit Bats (Chiroptera, Pteropodidae) Based on Complete Mitochondrial Genomes. J. Zool. Syst. Evol. Res. 2020, 58, 1395–1410. [Google Scholar] [CrossRef]
  26. Hassanin, A.; Veron, G.; Ropiquet, A.; Jansen Van Vuuren, B.; Lécu, A.; Goodman, S.M.; Haider, J.; Nguyen, T.T. Evolutionary History of Carnivora (Mammalia, Laurasiatheria) Inferred from Mitochondrial Genomes. PLoS ONE 2021, 16, e0240770. [Google Scholar] [CrossRef]
  27. Kundu, S.; Kumar, V.; Tyagi, K.; Chandra, K. The Complete Mitochondrial Genome of the Endangered Assam Roofed Turtle, Pangshura Sylhetensis (Testudines: Geoemydidae): Genomic Features and Phylogeny. PLoS ONE 2020, 15, e0225233. [Google Scholar] [CrossRef]
  28. Barnett, R.; Larson, G. A Phenol–Chloroform Protocol for Extracting DNA from Ancient Samples. In Ancient DNA; Shapiro, B., Hofreiter, M., Eds.; Methods in Molecular Biology; Humana Press: Totowa, NJ, USA, 2012; Volume 840, pp. 13–19. ISBN 978-1-61779-515-2. [Google Scholar]
  29. Wallis, G.P.; Cameron-Christie, S.R.; Kennedy, H.L.; Palmer, G.; Sanders, T.R.; Winter, D.J. Interspecific Hybridization Causes Long-term Phylogenetic Discordance between Nuclear and Mitochondrial Genomes in Freshwater Fishes. Mol. Ecol. 2017, 26, 3116–3127. [Google Scholar] [CrossRef] [PubMed]
  30. Dvoyashov, I.A.; Bodrov, S.Y.; Mamaev, N.V.; Glagoleva, E.S.; Abramson, N.I. Inferring Phylogenetic Structure, Taxa Hybridization, and Divergence Times within Rock Voles of Subgenus Aschizomys (Cricetidae: Alticola) Using QuaddRAD Sequencing and a Cytb Dataset. Ecol. Evol. 2023, 13, e10742. [Google Scholar] [CrossRef]
  31. Da Fonseca, R.R.; Johnson, W.E.; O’Brien, S.J.; Ramos, M.J.; Antunes, A. The Adaptive Evolution of the Mammalian Mitochondrial Genome. BMC Genom. 2008, 9, 119. [Google Scholar] [CrossRef]
  32. Romero, P.E.; Weigand, A.M.; Pfenninger, M. Positive Selection on Panpulmonate Mitogenomes Provide New Clues on Adaptations to Terrestrial Life. BMC Evol. Biol. 2016, 16, 164. [Google Scholar] [CrossRef] [PubMed]
  33. Strohm, J.H.T.; Gwiazdowski, R.A.; Hanner, R. Fast Fish Face Fewer Mitochondrial Mutations: Patterns of dN/dS across Fish Mitogenomes. Gene 2015, 572, 27–34. [Google Scholar] [CrossRef]
  34. Lemmon, A.R.; Emme, S.A.; Lemmon, E.M. Anchored Hybrid Enrichment for Massively High-Throughput Phylogenomics. Syst. Biol. 2012, 61, 727–744. [Google Scholar] [CrossRef]
  35. Lemmon, E.M.; Lemmon, A.R. High-Throughput Genomic Data in Systematics and Phylogenetics. Annu. Rev. Ecol. Evol. Syst. 2013, 44, 99–121. [Google Scholar] [CrossRef]
  36. Weitemier, K.; Straub, S.C.K.; Cronn, R.C.; Fishbein, M.; Schmickl, R.; McDonnell, A.; Liston, A. Hyb-Seq: Combining Target Enrichment and Genome Skimming for Plant Phylogenomics. Appl. Plant Sci. 2014, 2, 1400042. [Google Scholar] [CrossRef]
  37. Petrova, T.; Skazina, M.; Kuksin, A.; Bondareva, O.; Abramson, N. Narrow-Headed Voles Species Complex (Cricetidae, Rodentia): Evidence for Species Differentiation Inferred from Transcriptome Data. Diversity 2022, 14, 512. [Google Scholar] [CrossRef]
  38. Bondareva, O.; Petrova, T.; Bodrov, S.; Gavrilo, M.; Smorkatcheva, A.; Abramson, N. How Voles Adapt to Subterranean Lifestyle: Insights from RNA-Seq. Front. Ecol. Evol. 2023, 11, 1085993. [Google Scholar] [CrossRef]
  39. Franchini, P.; Monné Parera, D.; Kautt, A.F.; Meyer, A. quaddRAD: A New High-multiplexing and PCR Duplicate Removal ddRAD Protocol Produces Novel Evolutionary Insights in a Nonradiating Cichlid Lineage. Mol. Ecol. 2017, 26, 2783–2795. [Google Scholar] [CrossRef] [PubMed]
  40. Andrews, S. FastQC: A Quality Control Tool for High Throughput Sequence Data 2010. Available online: http://www.bioinformatics.babraham.ac.uk/projects/fastqc (accessed on 1 September 2019).
  41. Bolger, A.M.; Lohse, M.; Usadel, B. Trimmomatic: A Flexible Trimmer for Illumina Sequence Data. Bioinformatics 2014, 30, 2114–2120. [Google Scholar] [CrossRef] [PubMed]
  42. Chen, S.; Zhou, Y.; Chen, Y.; Gu, J. Fastp: An Ultra-Fast All-in-One FASTQ Preprocessor. Bioinformatics 2018, 34, i884–i890. [Google Scholar] [CrossRef] [PubMed]
  43. Langmead, B.; Trapnell, C.; Pop, M.; Salzberg, S.L. Ultrafast and Memory-Efficient Alignment of Short DNA Sequences to the Human Genome. Genome Biol. 2009, 10, R25. [Google Scholar] [CrossRef] [PubMed]
  44. Haas, B.J.; Papanicolaou, A.; Yassour, M.; Grabherr, M.; Blood, P.D.; Bowden, J.; Couger, M.B.; Eccles, D.; Li, B.; Lieber, M. De Novo Transcript Sequence Reconstruction from RNA-Seq Using the Trinity Platform for Reference Generation and Analysis. Nat. Protoc. 2013, 8, 1494–1512. [Google Scholar] [CrossRef]
  45. Manni, M.; Berkeley, M.R.; Seppey, M.; Simão, F.A.; Zdobnov, E.M. BUSCO Update: Novel and Streamlined Workflows along with Broader and Deeper Phylogenetic Coverage for Scoring of Eukaryotic, Prokaryotic, and Viral Genomes. Mol. Biol. Evol. 2021, 38, 4647–4654. [Google Scholar] [CrossRef]
  46. Fu, L.; Niu, B.; Zhu, Z.; Wu, S.; Li, W. CD-HIT: Accelerated for Clustering the next-Generation Sequencing Data. Bioinformatics 2012, 28, 3150–3152. [Google Scholar] [CrossRef]
  47. Lechner, M.; Findeiß, S.; Steiner, L.; Marz, M.; Stadler, P.F.; Prohaska, S.J. Proteinortho: Detection of (Co-)Orthologs in Large-Scale Analysis. BMC Bioinform. 2011, 12, 124. [Google Scholar] [CrossRef] [PubMed]
  48. Löytynoja, A. Phylogeny-Aware Alignment with PRANK. In Multiple Sequence Alignment Methods; Russell, D.J., Ed.; Methods in Molecular Biology; Humana Press: Totowa, NJ, USA, 2014; Volume 1079, pp. 155–170. ISBN 978-1-62703-645-0. [Google Scholar]
  49. Okonechnikov, K.; Golosova, O.; Fursov, M.; The UGENE team. Unipro UGENE: A Unified Bioinformatics Toolkit. Bioinformatics 2012, 28, 1166–1167. [Google Scholar] [CrossRef] [PubMed]
  50. Shen, W.; Sipos, B.; Zhao, L. SeqKit2: A Swiss Army Knife for Sequence and Alignment Processing. iMeta 2024, 3, e191. [Google Scholar] [CrossRef] [PubMed]
  51. Castresana, J. Selection of Conserved Blocks from Multiple Alignments for Their Use in Phylogenetic Analysis. Mol. Biol. Evol. 2000, 17, 540–552. [Google Scholar] [CrossRef] [PubMed]
  52. Minh, B.Q.; Schmidt, H.A.; Chernomor, O.; Schrempf, D.; Woodhams, M.D.; Von Haeseler, A.; Lanfear, R. IQ-TREE 2: New Models and Efficient Methods for Phylogenetic Inference in the Genomic Era. Mol. Biol. Evol. 2020, 37, 1530–1534. [Google Scholar] [CrossRef]
  53. Hoang, D.T.; Chernomor, O.; Von Haeseler, A.; Minh, B.Q.; Vinh, L.S. UFBoot2: Improving the Ultrafast Bootstrap Approximation. Mol. Biol. Evol. 2018, 35, 518–522. [Google Scholar] [CrossRef] [PubMed]
  54. Kalyaanamoorthy, S.; Minh, B.Q.; Wong, T.K.F.; Von Haeseler, A.; Jermiin, L.S. ModelFinder: Fast Model Selection for Accurate Phylogenetic Estimates. Nat. Methods 2017, 14, 587–589. [Google Scholar] [CrossRef]
  55. Morel, B.; Kozlov, A.M.; Stamatakis, A. ParGenes: A Tool for Massively Parallel Model Selection and Phylogenetic Tree Inference on Thousands of Genes. Bioinformatics 2019, 35, 1771–1773. [Google Scholar] [CrossRef] [PubMed]
  56. Kozlov, A.M.; Darriba, D.; Flouri, T.; Morel, B.; Stamatakis, A. RAxML-NG: A Fast, Scalable and User-Friendly Tool for Maximum Likelihood Phylogenetic Inference. Bioinformatics 2019, 35, 4453–4455. [Google Scholar] [CrossRef] [PubMed]
  57. Huerta-Cepas, J.; Serra, F.; Bork, P. ETE 3: Reconstruction, Analysis, and Visualization of Phylogenomic Data. Mol. Biol. Evol. 2016, 33, 1635–1638. [Google Scholar] [CrossRef]
  58. Bouckaert, R.R. DensiTree: Making Sense of Sets of Phylogenetic Trees. Bioinformatics 2010, 26, 1372–1373. [Google Scholar] [CrossRef]
  59. Zhang, C.; Rabiee, M.; Sayyari, E.; Mirarab, S. ASTRAL-III: Polynomial Time Species Tree Reconstruction from Partially Resolved Gene Trees. BMC Bioinform. 2018, 19, 153. [Google Scholar] [CrossRef] [PubMed]
  60. Zhang, C.; Mirarab, S. Weighting by Gene Tree Uncertainty Improves Accuracy of Quartet-Based Species Trees. Mol. Biol. Evol. 2022, 39, msac215. [Google Scholar] [CrossRef] [PubMed]
  61. Douglas, J.; Jiménez-Silva, C.L.; Bouckaert, R. StarBeast3: Adaptive Parallelized Bayesian Inference under the Multispecies Coalescent. Syst. Biol. 2022, 71, 901–916. [Google Scholar] [CrossRef]
  62. Rambaut, A.; Drummond, A.J.; Xie, D.; Baele, G.; Suchard, M.A. Posterior Summarization in Bayesian Phylogenetics Using Tracer 1.7. Syst. Biol. 2018, 67, 901–904. [Google Scholar] [CrossRef] [PubMed]
  63. Catchen, J.; Hohenlohe, P.A.; Bassham, S.; Amores, A.; Cresko, W.A. Stacks: An Analysis Tool Set for Population Genomics. Mol. Ecol. 2013, 22, 3124–3140. [Google Scholar] [CrossRef]
  64. Li, H.; Durbin, R. Fast and Accurate Short Read Alignment with Burrows-Wheeler Transform. Bioinformatics 2009, 25, 1754–1760. [Google Scholar] [CrossRef] [PubMed]
  65. Danecek, P.; Bonfield, J.K.; Liddle, J.; Marshall, J.; Ohan, V.; Pollard, M.O.; Whitwham, A.; Keane, T.; McCarthy, S.A.; Davies, R.M.; et al. Twelve Years of SAMtools and BCFtools. GigaScience 2021, 10, giab008. [Google Scholar] [CrossRef]
  66. Ortiz, E.M. Vcf2phylip v2.0: Convert a VCF Matrix into Several Matrix Formats for Phylogenetic Analysis. 2019. Available online: https://github.com/edgardomortiz/vcf2phylip (accessed on 1 September 2019).
  67. Koboldt, D.C.; Zhang, Q.; Larson, D.E.; Shen, D.; McLellan, M.D.; Lin, L.; Miller, C.A.; Mardis, E.R.; Ding, L.; Wilson, R.K. VarScan 2: Somatic Mutation and Copy Number Alteration Discovery in Cancer by Exome Sequencing. Genome Res. 2012, 22, 568–576. [Google Scholar] [CrossRef] [PubMed]
  68. Bouckaert, R.; Vaughan, T.G.; Barido-Sottani, J.; Duchêne, S.; Fourment, M.; Gavryushkina, A.; Heled, J.; Jones, G.; Kühnert, D.; De Maio, N.; et al. BEAST 2.5: An Advanced Software Platform for Bayesian Evolutionary Analysis. PLOS Comput. Biol. 2019, 15, e1006650. [Google Scholar] [CrossRef] [PubMed]
  69. Bouckaert, R.R.; Drummond, A.J. bModelTest: Bayesian Phylogenetic Site Model Averaging and Model Comparison. BMC Evol. Biol. 2017, 17, 42. [Google Scholar] [CrossRef] [PubMed]
  70. Whitfield, J.B.; Lockhart, P.J. Deciphering Ancient Rapid Radiations. Trends Ecol. Evol. 2007, 22, 258–265. [Google Scholar] [CrossRef]
  71. Patel, S. Error in Phylogenetic Estimation for Bushes in the Tree of Life. J. Phylogenet. Evol. Biol. 2013, 01, 110. [Google Scholar] [CrossRef]
  72. Nichols, R. Gene Trees and Species Trees Are Not the Same. Trends Ecol. Evol. 2001, 16, 358–364. [Google Scholar] [CrossRef] [PubMed]
  73. Nesi, N.; Tsagkogeorga, G.; Tsang, S.M.; Nicolas, V.; Lalis, A.; Scanlon, A.T.; Riesle-Sbarbaro, S.A.; Wiantoro, S.; Hitch, A.T.; Juste, J.; et al. Interrogating Phylogenetic Discordance Resolves Deep Splits in the Rapid Radiation of Old World Fruit Bats (Chiroptera: Pteropodidae). Syst. Biol. 2021, 70, 1077–1089. [Google Scholar] [CrossRef] [PubMed]
  74. Olave, M.; Meyer, A. Implementing Large Genomic Single Nucleotide Polymorphism Data Sets in Phylogenetic Network Reconstructions: A Case Study of Particularly Rapid Radiations of Cichlid Fish. Syst. Biol. 2020, 69, 848–862. [Google Scholar] [CrossRef] [PubMed]
  75. Maddison, W.P.; Knowles, L.L. Inferring Phylogeny Despite Incomplete Lineage Sorting. Syst. Biol. 2006, 55, 21–30. [Google Scholar] [CrossRef] [PubMed]
  76. McCormack, J.E.; Huang, H.; Knowles, L.L. Maximum Likelihood Estimates of Species Trees: How Accuracy of Phylogenetic Inference Depends upon the Divergence History and Sampling Design. Syst. Biol. 2009, 58, 501–508. [Google Scholar] [CrossRef]
  77. Heled, J.; Drummond, A.J. Bayesian Inference of Species Trees from Multilocus Data. Mol. Biol. Evol. 2010, 27, 570–580. [Google Scholar] [CrossRef]
  78. Corl, A.; Ellegren, H. Sampling Strategies for Species Trees: The Effects on Phylogenetic Inference of the Number of Genes, Number of Individuals, and Whether Loci Are Mitochondrial, Sex-Linked, or Autosomal. Mol. Phylogenet. Evol. 2013, 67, 358–366. [Google Scholar] [CrossRef] [PubMed]
  79. Alfaro-Ibáñez, M.; Lira-Garrido, J.; Cuenca-Bescós, G.; Pons, J.; Bover, P. Insights on the Evolution of the Tribe Pliomyini (Arvicolinae, Rodentia): Ancient DNA from the Extinct Pliomys Lenki. Palaeontol. Electron. 2024, 27, a47. [Google Scholar] [CrossRef]
  80. Wang, X.; Liang, D.; Wang, X.; Tang, M.; Liu, Y.; Liu, S.; Zhang, P. Phylogenomics Reveals the Evolution, Biogeography, and Diversification History of Voles in the Hengduan Mountains. Commun. Biol. 2022, 5, 1124. [Google Scholar] [CrossRef] [PubMed]
  81. Heinrich, W.-D. Some Aspects of Evolution and Biostratigraphy of Arvicola (Mammalia, Rodentia) in the Central European Pleistocene. In Evolution, Phylogeny and Biostratigraphy of Arvicolids (Rodentia.Mammalia); Fejfar, O., Heinrich, W.-D., Eds.; Geological Survey: Prague, Czech Republic, 1990; pp. 165–182. [Google Scholar]
  82. Koenigswald, W.; van Kolfschoten, T. The Mimomys-Arvicola Boundary and the Enamel Thickness Quotient (SDQ) of Arvicola as Stratigraphic Markers in the Middle Pleistocene. In The Early Middle Pleistocene in Europe; Nurner, E., Ed.; Balkema: Rotterdam, The Netherlands, 1996; pp. 211–226. [Google Scholar]
  83. Pardiñas, U.F.J.; Myers, P.; León-Paniagua, L.; Ordóñez Garza, N.; Cook, J.A.; Kryštufek, B. Family Cricetidae (True Hamsters, Voles, Lemmings and New World Rats and Mice). In Handbook of the Mammals of the World; Lynx Edicions: Barcelona, Spain, 2017; Volume 7, pp. 204–279. [Google Scholar]
  84. Villaverde, T.; Maguilla, E.; Luceño, M.; Hipp, A.L. Assessing the Sensitivity of Divergence Time Estimates to Locus Sampling, Calibration Points, and Model Priors in a RAD-seq Phylogeny of Carex Section Schoenoxiphium. J. Syst. Evol. 2021, 59, 687–697. [Google Scholar] [CrossRef]
  85. Near, T.J.; Sanderson, M.J. Assessing the Quality of Molecular Divergence Time Estimates by Fossil Calibrations and Fossil–Based Model Selection. Philos. Trans. R. Soc. Lond. B Biol. Sci. 2004, 359, 1477–1483. [Google Scholar] [CrossRef]
  86. Hug, L.A.; Roger, A.J. The Impact of Fossils and Taxon Sampling on Ancient Molecular Dating Analyses. Mol. Biol. Evol. 2007, 24, 1889–1897. [Google Scholar] [CrossRef]
  87. Sauquet, H.; Ho, S.Y.W.; Gandolfo, M.A.; Jordan, G.J.; Wilf, P.; Cantrill, D.J.; Bayly, M.J.; Bromham, L.; Brown, G.K.; Carpenter, R.J.; et al. Testing the Impact of Calibration on Molecular Divergence Times Using a Fossil-Rich Group: The Case of Nothofagus (Fagales). Syst. Biol. 2012, 61, 289–313. [Google Scholar] [CrossRef] [PubMed]
  88. Duchêne, S.; Holmes, E.C.; Ho, S.Y.W. Analyses of Evolutionary Dynamics in Viruses Are Hindered by a Time-Dependent Bias in Rate Estimates. Proc. R. Soc. B Biol. Sci. 2014, 281, 20140732. [Google Scholar] [CrossRef] [PubMed]
Figure 1. Time-calibrated phylogeny of Arvicolinae on the basis of RNA-seq data. Black circles denote nodes with BEAST2 (BI) support of 1.0, ASTRAL support of 0.99–1.0, and ML support of 100. Node bars show 95% highest posterior density (HPD) intervals of node heights. Letters A, C, E, and F near the nodes correspond to fossil constraints (Table S4). Tribes are distinguished by different branch colors.
Diversity 17 00061 g001
Figure 2. The species tree estimated on the basis of 1069 genes by means of StarBeast3 and visualized in DensiTree. All trees generated in the analysis (excluding the 10% burn-in) are displayed on the left. Trees with the most common topology (48.4% of trees) are highlighted in blue, those with the second most common topology (35.8%) in red, those with the third most common topology (14.2%) in pale green, and all other trees (1.6%) are in dark green. On the right, consensus trees of the three most common topologies are displayed, with intensity being proportional to the frequency of each topology. The Bayesian posterior probability is 1.0 for all nodes, except for the two nodes indicated in the figure. Tribes are distinguished by different font colors.
Diversity 17 00061 g002
Figure 3. Time-calibrated phylogeny of Arvicolinae on the basis of the ddRADseq data. Node labels indicate BI or ML support levels. Black circles show nodes with BI support of 0.99–1.0 and ML support of 99–100. Node bars represent 95% highest posterior density (HPD) intervals of node heights. Letters A–F at nodes correspond to fossil constraints (Table S4). Tribes are distinguished by different branch colors.
Diversity 17 00061 g003
Figure 4. Comparison of results of ddRADseq (a) and mitogenome (b) analyses. Black circles show nodes with BI support of 0.95–1.0 and ML support of 95–100. Tribes are distinguished by different branch colors. Mitochondrial phylogeny summarized according to Abramson et al. [7].
Diversity 17 00061 g004
Table 1. Divergence time estimates for major lineages within the subfamily Arvicolinae.
MRCARNA-seqddRADseqmt Complete [5]mt RY-Masked [5]
Arvicolinae7.67 (7.07–8.53)7.33 (7.05–7.73)7.36 (7.04–7.78)7.33 (7.05–7.73)
Ondatrini/(Dicrostonychini + Lemmini)6.54 (5.86–7.36)6.73 (6.18–7.27)n/an/a
Dicrostonychini/Lemmini6.26 (5.6–7.07)6.51 (5.94–7.03)n/an/a
Dicrostonychinin/a5.66 (4.97–6.32)4.89 (4.08–5.7)4.49 (3.23–5.86)
Lemmini3.52 (3.26–3.87)3.79 (3.32–4.32)4.81 (3.68–5.97)4.37 (3.31–5.71)
Clethrionomyini2.58 (2.11–3.09)4.09 (3.41–4.78)4.02 (3.33–4.72)4.46 (3.35–5.64)
Third radiation (Arvicolini, Ellobiusini,
Lagurini, and Dinaromys *)
5.31 (4.64–6.07)5.96 (5.37–6.54)6.2 (5.65–6.76)6.11 (5.17–6.92)
Lagurini and Dinaromysn/a5.47 (4.89–6.06)n/an/a
Arvicolini4.76 (4.11–5.46)5.47 (4.88–6.04)n/an/a
Arvicolini s. str. *3.56 (3.03–4.14)3.99 (3.47–4.51)4.9 (4.33–5.47)5.02 (4.12–5.89)
Lagurini and Arvicolini5.11 (4.45–5.85)n/a6.04 (5.5–6.61)6.03 (5.12–6.86)
Ellobiusini and Arvicolinin/a5.78 (5.22–6.38)n/an/a
Ellobiusini3.18 (2.54–3.81)3.84 (3.14–4.56)4.97 (4.21–5.69)4.58 (3.42–5.68)
Lagurinin/a3.02 (2.58–3.52)3.1 (2.59–3.75)3.05 (2.56–3.75)
Chionomysn/a2.22 (1.66–2.8)3.29 (2.5–4.04)3.45 (2.13–4.67)
Microtus ** (Microtus, Terricola, Agricola,
Blanfordimys *, and Iberomys *)
2.4 (2–2.81)2.86 (2.49–3.25)3.8 (3.31–4.3)3.87 (3.07–4.63)
Mynomes2.05 (1.64–2.48)2.67 (2.29–3.08)3.41 (2.89–3.91)3.32 (2.48–4.11)
Microtus + Terricola1.69 (1.31–2.1)2.45 (2.08–2.81)2.96 (2.46–3.5)3.18 (2.35–3.95)
Microtusn/a2.01 (1.67–2.36)1.87 (1.43–2.33)2.06 (1.31–2.8)
Terricolan/a0.64 (0.42–0.87)1.38 (0.89–1.93)1.46 (0.7–2.32)
Iberomys + Agricola + Blanfordimysn/a2.75 (2.39–3.15)3.18 (2.66–3.71)3.11 (2.23–3.99)
Alexandromys, Lasiopodomys, and Neodon *2.6 (2.19–3.03)3.11 (2.71–3.51)3.92 (3.4–4.4)4.12 (3.31–4.9)
Lasiopodomys1.92 (1.57–2.3)2.27 (1.91–2.65)3.09 (2.59–3.56)3.07 (2.27–3.85)
Alexandromys1.31 (0.95–1.7)1.53 (1.23–1.84)2.16 (1.55–2.81)2.2 (1.27–3.22)
Mean node ages (highlighted in bold) and 95% HPD intervals (in parentheses) in millions of years ago (Ma) were estimated by means of RNA-seq or ddRADseq datasets. The last two columns contain data from Abramson et al. [7]. * Excluding Arvicola and Hyperacrius. ** In the sense of Pardinas et al. [83].
Disclaimer/Publisher’s Note: The statements, opinions and data contained in all publications are solely those of the individual author(s) and contributor(s) and not of MDPI and/or the editor(s). MDPI and/or the editor(s) disclaim responsibility for any injury to people or property resulting from any ideas, methods, instructions or products referred to in the content.

