Abstract
This study investigated the genetic diversity and genomic variation in wild Cordyceps chanhua populations from four regions in China—Dazhou, Sichuan (ICD); Lu’an, Anhui (ICL); Taizhou, Zhejiang (ICT); and Yixing, Jiangsu (ICY)—to elucidate genetic differentiation patterns and provide a scientific foundation for resource conservation and sustainable utilization. Whole-genome resequencing was performed, yielding high-quality sequencing data (Q20 > 98%, Q30 > 94%, coverage: 93.62–95.79%) and enabling the detection of 82,428 single-nucleotide polymorphisms (SNPs) and 12,517 insertion–deletion markers (InDels). Genomic variations were unevenly distributed across chromosomes, with chromosome chrU05 exhibiting the highest SNP density (5187.86), suggesting a potential hotspot of genetic diversity. Phylogenetic analysis confirmed that all samples belonged to the C. chanhua lineage but revealed significant genetic differentiation among regions. Population structure analysis, supported by structure analysis and PCA, identified two distinct subgroups (G1 and G2) closely associated with geographic origins, reflecting the influence of both environmental and geographic factors on genetic differentiation. These findings underscore the substantial interregional genetic diversity in C. chanhua populations, highlighting the importance of tailored conservation strategies and region-specific germplasm utilization. The study provides critical genomic insights to support marker-assisted breeding, regional cultivation optimization, and the sustainable development of C. chanhua resources.
1. Introduction
Cordyceps chanhua Z. Z. Li, F. G. Luan, Hywel-Jones, C. R. Li & S. L. Zhang, also known as “golden cicada flower”, is a traditional edible and medicinal fungus in China [1]. Originally classified by Miquel in 1838 as Isaria cicadae, this name long represented the species complex [2]. Over the past century, its taxonomy underwent multiple revisions [3,4,5]. In 2021, Li et al. [6] confirmed through DNA sequence analysis of specimens from Jinggang Mountain that Isaria cicadae is a species complex. They identified C. chanhua as a distinct species, which is now widely accepted [7]. C. chanhua has a long history of use in Chinese medicine and is primarily distributed in Zhejiang, Anhui, Jiangsu, and Sichuan provinces [8,9]. Historical texts such as Leigong Paozhi Lun and Bencao Gangmu document its medicinal value [10,11,12]. Modern research highlights its bioactive components, including adenosine, polysaccharides, and cordycepin, which exhibit multiple health benefits such as immune enhancement, uric acid reduction, and improved sleep [13,14,15,16,17,18,19]. These findings underscore its significant development potential.
Due to limited wild resources and environmental vulnerability, wild C. chanhua faces safety concerns like heavy metal contamination and spoilage, restricting stable supply and quality control [20]. Artificial cultivation has emerged as a viable solution. In 2021, China’s National Health Commission approved artificially cultivated C. chanhua fruiting bodies as a “new food material,” facilitating its application in food and health products [21]. Cultivated C. chanhua demonstrates comparable bioactive components and controlled cultivation conditions, ensuring consistent quality [22,23].
Advances in genetics and molecular biology have expanded genetic diversity detection methods, including morphological, cytological, biochemical, and nucleic acid analyses [24,25,26]. While these methods reveal diversity from various perspectives, studies on C. chanhua at the population level remain limited. For instance, Zeng et al. [27] reported no polymorphism in the ITS region of 75 samples from 15 populations, indicating low genetic diversity. However, Fan et al. [28] found mitochondrial genome length polymorphisms, with sizes ranging from 49,138 to 56,581 bp among three strains. Notably, C. chanhua exhibits a genome size of 36.9 Mb, with higher gene density and coding potential than related fungi, suggesting robust bioactive compound expression.
This study analyzes the genetic diversity of wild C. chanhua samples from Dazhou (Sichuan), Lu’an (Anhui), Taizhou (Zhejiang), and Yixing (Jiangsu). By revealing genetic differences across regions, it provides scientific insights into resource conservation, strain selection, and the further development of C. chanhua.
2. Materials and Methods
2.1. Experimental Materials
The wild Cordyceps chanhua samples used in this study were collected from four regions in China: Dazhou, Sichuan (30°47′ N, 107°20′ E; sample code: ICD); Lu’an, Anhui (31°25′ N, 116°0′ E; sample code: ICL); Taizhou, Zhejiang (28°48′ N, 121°9′ E; sample code: ICT); and Yixing, Jiangsu (31°17′ N, 119°44′ E; sample code: ICY). The sampling points within each region were approximately 1500 m apart, with collection sites primarily located in hilly areas of moso bamboo (Phyllostachys edulis) forests characterized by gentle terrain and loose soil. Dazhou, situated in Northeastern Sichuan, has a subtropical monsoon climate with an annual average temperature of 16.6 °C and precipitation of 1193.3 mm. Lu’an, located at the northern foot of the Dabie Mountains in Anhui, lies in a transitional zone between northern subtropical and warm temperate climates, with an average annual temperature of 15.6 °C and precipitation of 1145.7 mm. Taizhou, on the eastern coast of Zhejiang, features a subtropical monsoon climate with an annual average temperature of 17.1 °C and precipitation of 2029 mm. Yixing, in Southwestern Jiangsu, has a northern subtropical humid monsoon climate, with an annual average temperature of 16.6 °C and precipitation of 1593.6 mm.
2.2. Methods
2.2.1. Extraction and Molecular Identification of C. chanhua Genomic DNA
Genomic DNA was extracted using a Fungal Genomic DNA Rapid Extraction Kit, and ITS regions were amplified with universal primers ITS1 and ITS4 under standard PCR conditions. PCR products were sequenced, and the ITS sequences were aligned using MEGA 7.0. A neighbor-joining phylogenetic tree was constructed with 1000 bootstrap replicates for validation [29].
The ITS sequences obtained from the samples have been uploaded to the National Microbial Data Center (NMDC) of China, with the following accession numbers: ICD1 (NMDCNO0069V4), ICD2 (NMDCNO0069V4), ICD3 (NMDCNO0069V5); ICL1 (NMDCNO0069V6), ICL2 (NMDCNO0069V7), ICL3 (NMDCNO0069V8); ICT1 (NMDCNO0069V9), ICT2 (NMDCNOO069VA), ICT3 (NMDCNO0069VB); ICY1 (NMDCNO0069VC), ICY2 (NMDCNO0069VD), and ICY3 (NMDCNO0069VE).
2.2.2. Whole-Genome Resequencing Analysis of C. chanhua
Whole-genome resequencing followed standard protocols, including sample preparation, library construction, quality control, and sequencing. Genomic DNA was extracted, and its quality confirmed by agarose gel electrophoresis, Nanodrop OD260/OD280 ratios (1.8–2.2), and Qubit 3.0 quantification (>40 ng/μL). Libraries were prepared using the NEBNext® Ultra™ II DNA Library Prep Kit (Illumina®, San Diego, CA, USA), with DNA fragmentation, end repair, adapter ligation, and PCR enrichment performed according to the manufacturer’s instructions. Library quality was verified through Qubit 3.0 quantification, Agilent 2100 Bioanalyzer fragment analysis (San Diego, CA, USA), and real-time PCR to confirm effective concentrations (>2 nmol/L). Qualified libraries were sequenced on the Illumina HiSeq platform using paired-end sequencing (150 bp reads). This process ensured high-quality data suitable for downstream analyses [30,31,32].
2.3. Statistical Methods
Data analysis was performed using SPSS and Excel, while Photoshop was used for image processing and Origin 9.1 for data visualization. Phylogenetic tree construction for internal transcribed spacer (ITS) sequences was conducted using MEGA 7.0, and variation analysis was performed with GATK (version 3.7). PCA was carried out using PLINK (version v1.90p) [33].
Population structure analysis was conducted with STRUCTURE software (version 2.3.4) using the Correlated Allele Frequencies model. The burn-in step was set to 10,000, followed by 100,000 sampling steps after burn-in. We tested a range of K values from 1 to 8 and determined the optimal number of subgroups using the ΔK method. Each K value was analyzed in 10 independent runs to ensure the stability of the results [34].
3. Results
3.1. Collection, Isolation, and Preservation of Wild Cordyceps chanhua Strains
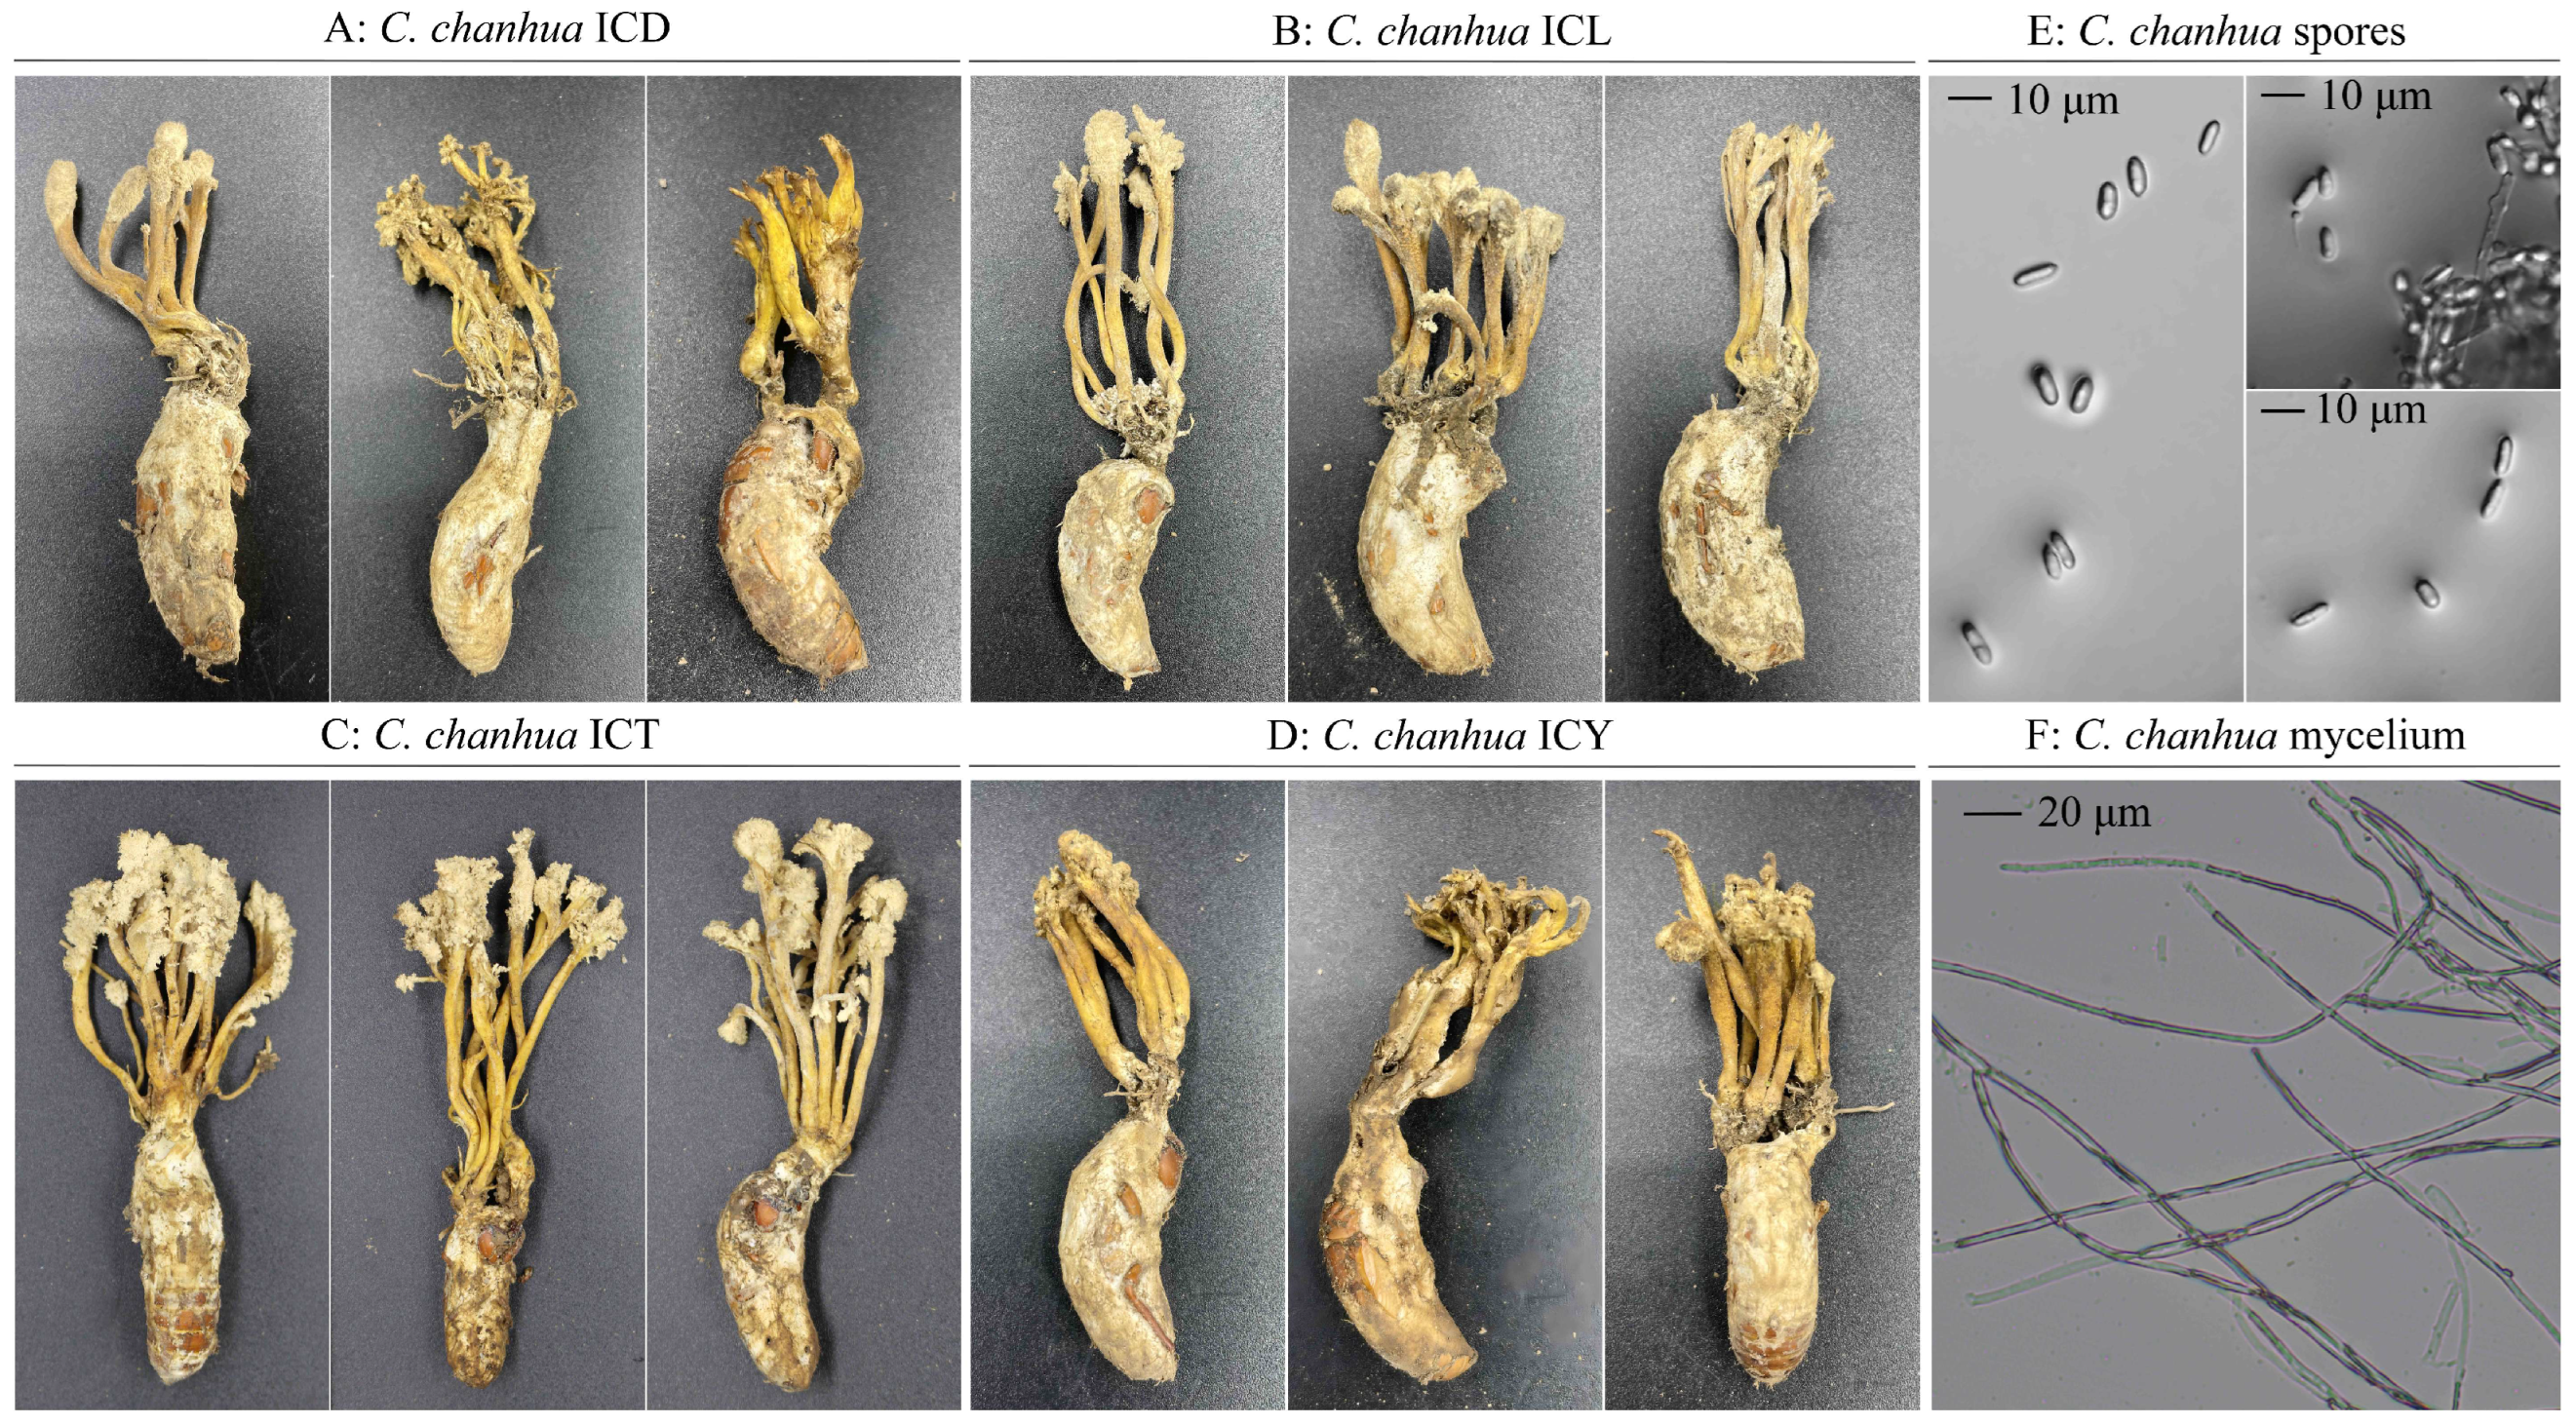
The status of the collected wild C. chanhua specimens is shown in Figure 1. These wild C. chanhua specimens were formed by the infection of cicada larvae during their nymph stage by C. chanhua strains. The fruiting bodies displayed slight morphological differences across collection sites, but the insect hosts were consistently plump and firm, with intact morphological features, including complete “crowns”. Most fruiting body tips were covered with grayish-white, powdery conidia. Microscopic examination indicated no significant differences among specimens from different regions. The hyphal diameters of C. chanhua ranged from 1.5 to 4.5 μm, while spore diameters ranged from 2 to 5 μm, with lengths measuring 7 to 12 μm.

Figure 1.
Morphology and microscopic morphology of wild C. chanhua. (A) The wild C. chanhua specimen collected from Dazhou, Sichuan. (B) The wild C. chanhua specimen collected from Lu’an, Anhui. (C) The wild C. chanhua specimen collected from Taizhou, Zhejiang. (D) The wild C. chanhua specimen collected from Yixing, Jiangsu. (E) The microscopic morphology of C. chanhua spores. (F) The microscopic morphology of C. chanhua mycelium.
3.2. Molecular Identification and Phylogenetic Analysis of C. chanhua
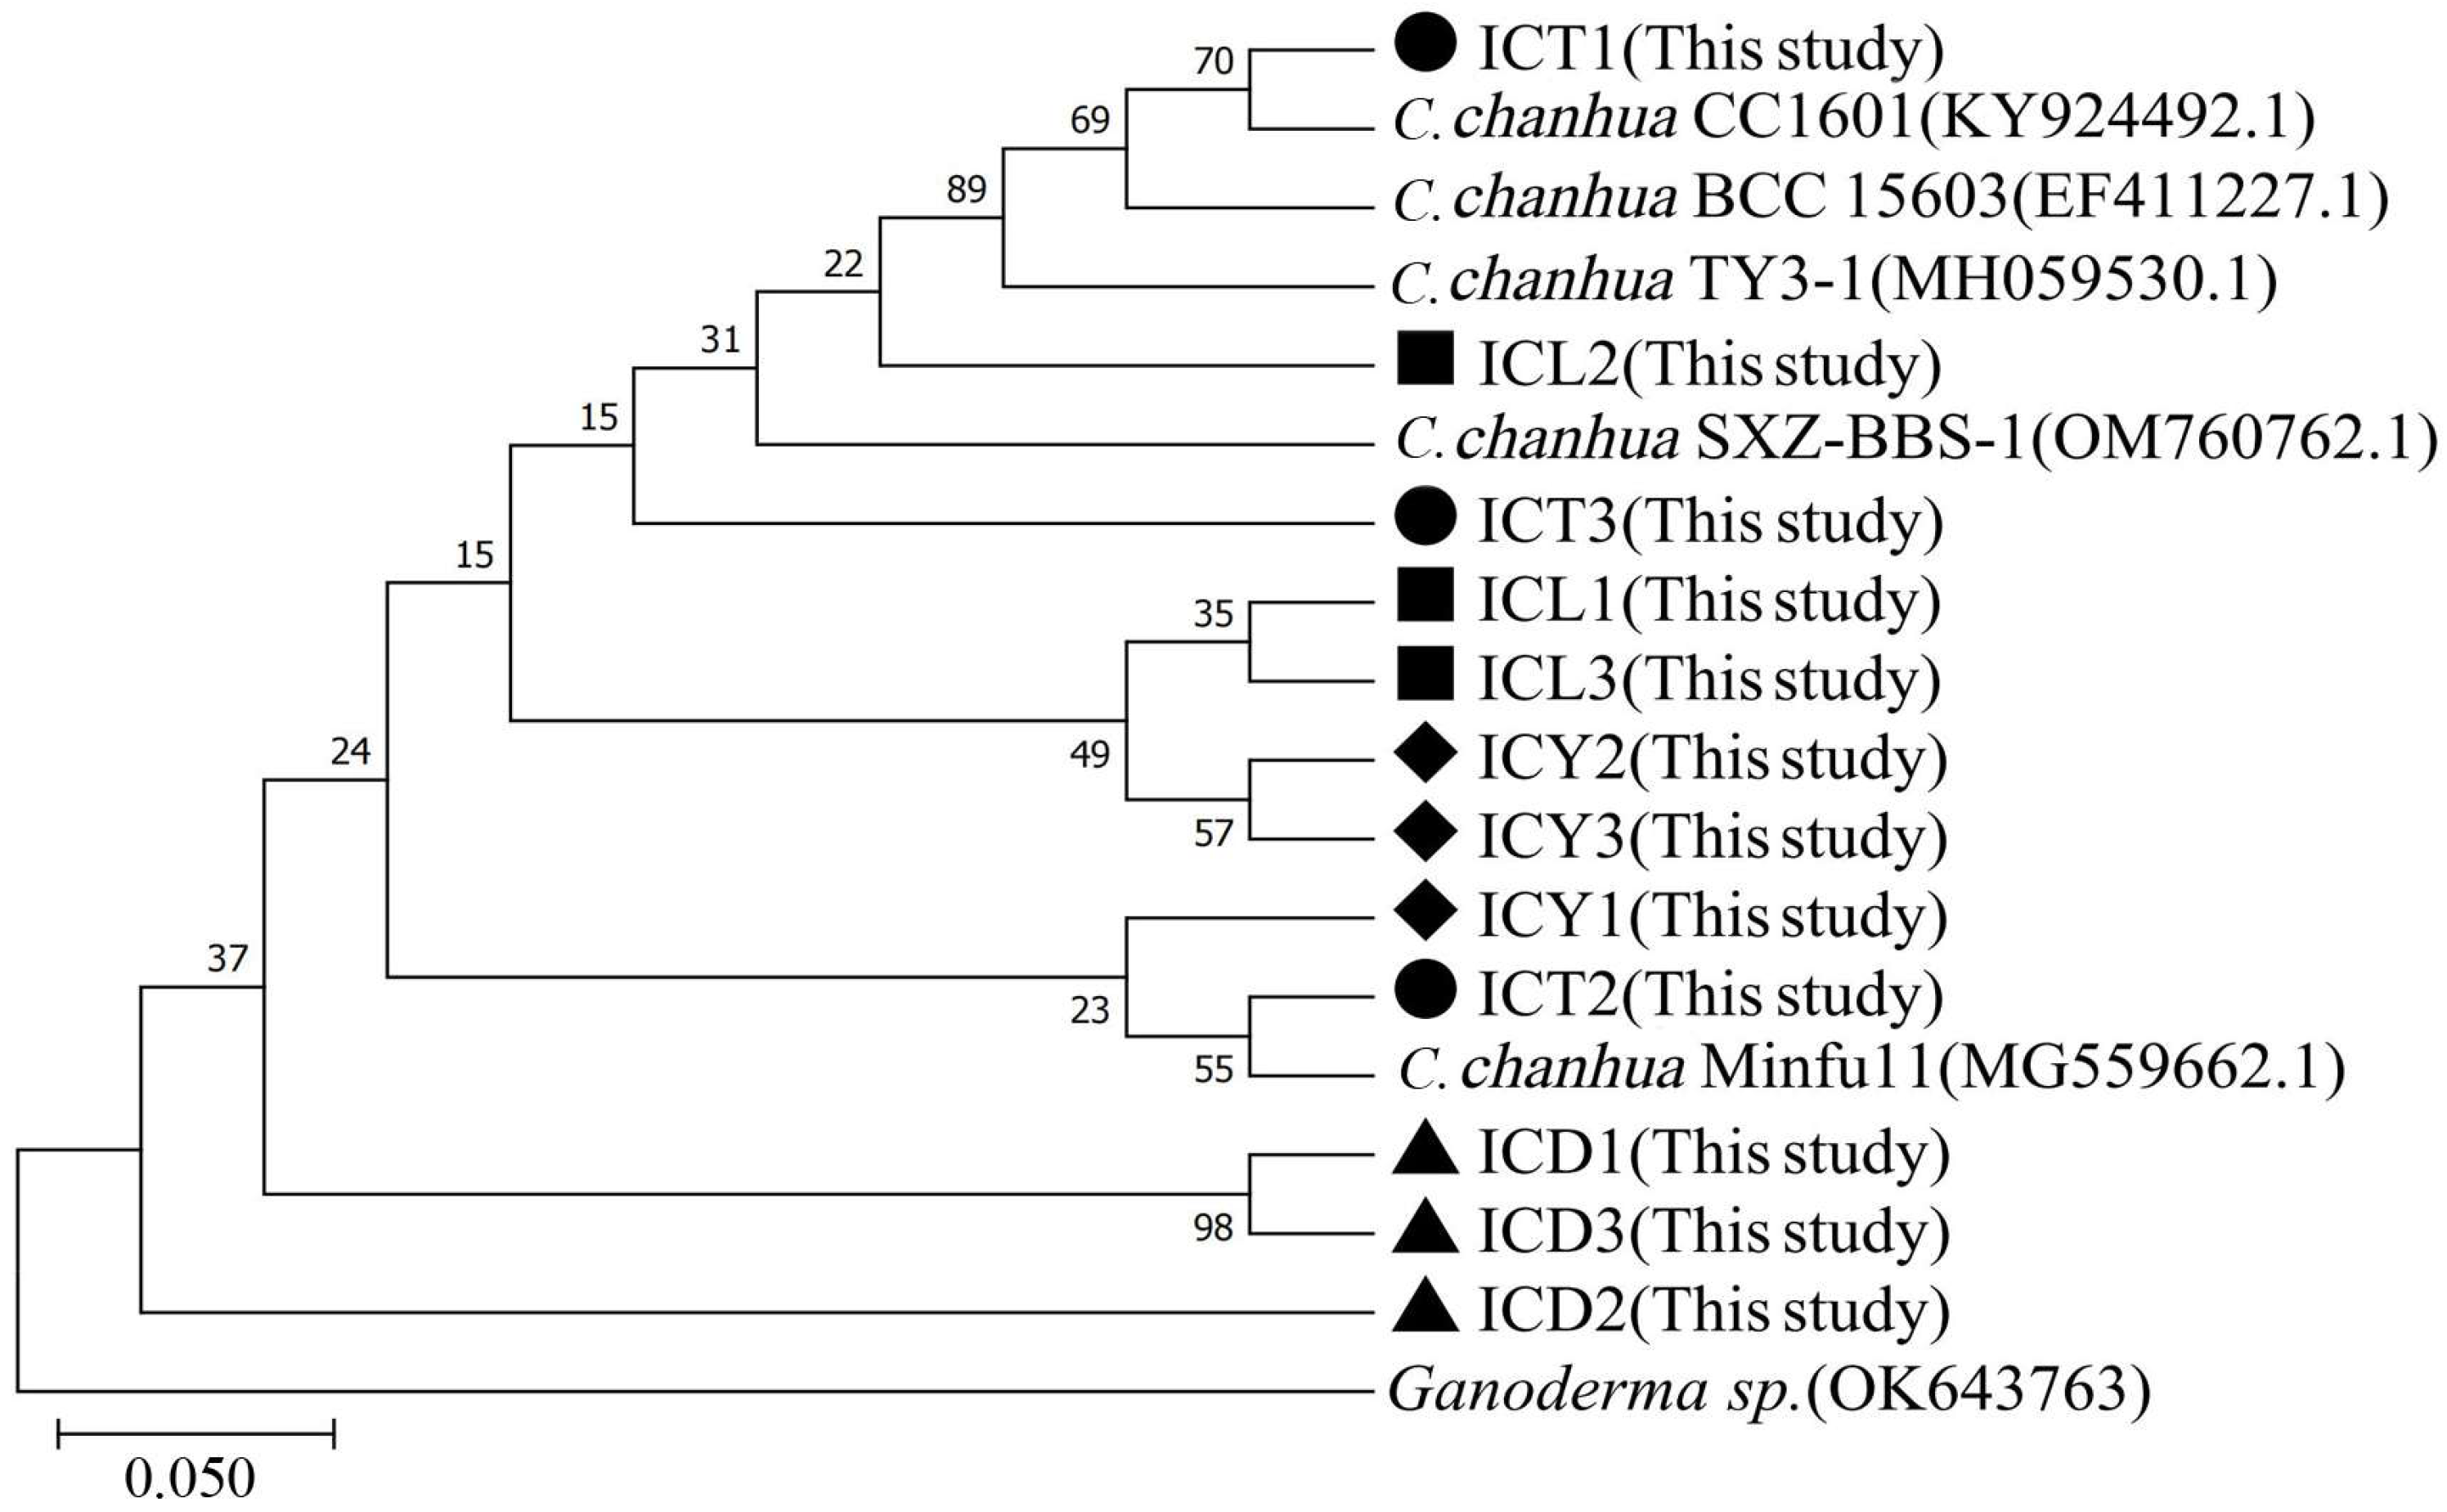
The genetic relationships among the samples were analyzed based on the phylogenetic tree constructed using the neighbor-joining method (Figure 2). The results indicate that all samples (ICT, ICL, ICY, and ICD) cluster closely with C. chanhua strains, exhibiting high similarity with known C. chanhua strains. Most branches in the phylogenetic tree are supported by moderate-to-high bootstrap values, such as the clade containing ICT1 and C. chanhua CC1601, which has a bootstrap value of 70, and the clade containing ICD group samples, which is strongly supported with a bootstrap value of 98.

Figure 2.
Phylogenetic tree of C. chanhua.
Combined with the macroscopic and microscopic characteristics of the wild C. chanhua shown in Figure 1, these samples were further confirmed to be C. chanhua. Ganoderma sp. was used as an outgroup, further validating the taxonomic accuracy of the samples.
3.3. Sequencing Data Statistical Analysis
The quality control results are summarized in Table 1. The Q20 and Q30 values for all samples exceeded 98% and 94%, respectively, indicating high-quality sequencing data suitable for subsequent genetic diversity analyses. GC content varied among samples, ranging from 44.37% in ICL3 to 51.98% in ICT1.

Table 1.
Statistics of sequencing data.
The number of reads and bases also exhibited some variability among samples, with ICY1 showing the highest values and ICT2 the lowest. Overall, the total reads and bases from samples collected in Sichuan (Dazhou), Anhui (Lu’an), Zhejiang (Taizhou), and Jiangsu (Yixing) were relatively balanced.
3.4. Alignment Rate Statistical Analysis
As shown in Table 2, the unique alignment rates varied significantly among samples, with an average of 59.00%. The highest alignment rate was observed in ICD3 (75.99%), while ICT2 had the lowest (34.65%). This indicates that most samples achieved a high alignment success rate against the reference genome.
Table 2.
Comparison rate statistics of sequencing data.
The average multiple alignment rate was 1.96%, ranging from 1.56% to 2.50%, suggesting that the majority of reads were uniquely aligned to specific positions. The unaligned rates differed markedly, with ICT2 having the highest unaligned rate at 63.34% and ICD3 the lowest at 21.52%. The average unaligned rate was 39.04%. Samples with higher unaligned rates (e.g., ICT2 and ICY2) may contain a substantial proportion of sequences divergent from the reference genome.
Overall, the unique alignment rate exceeded 50% for most samples, indicating high data quality. The average number of uniquely aligned reads was 2,501,756, accounting for 59.00% of total reads, while the average number of unaligned reads was 1,703,385, representing 39.04%.
3.5. Coverage and Depth Statistical Analysis
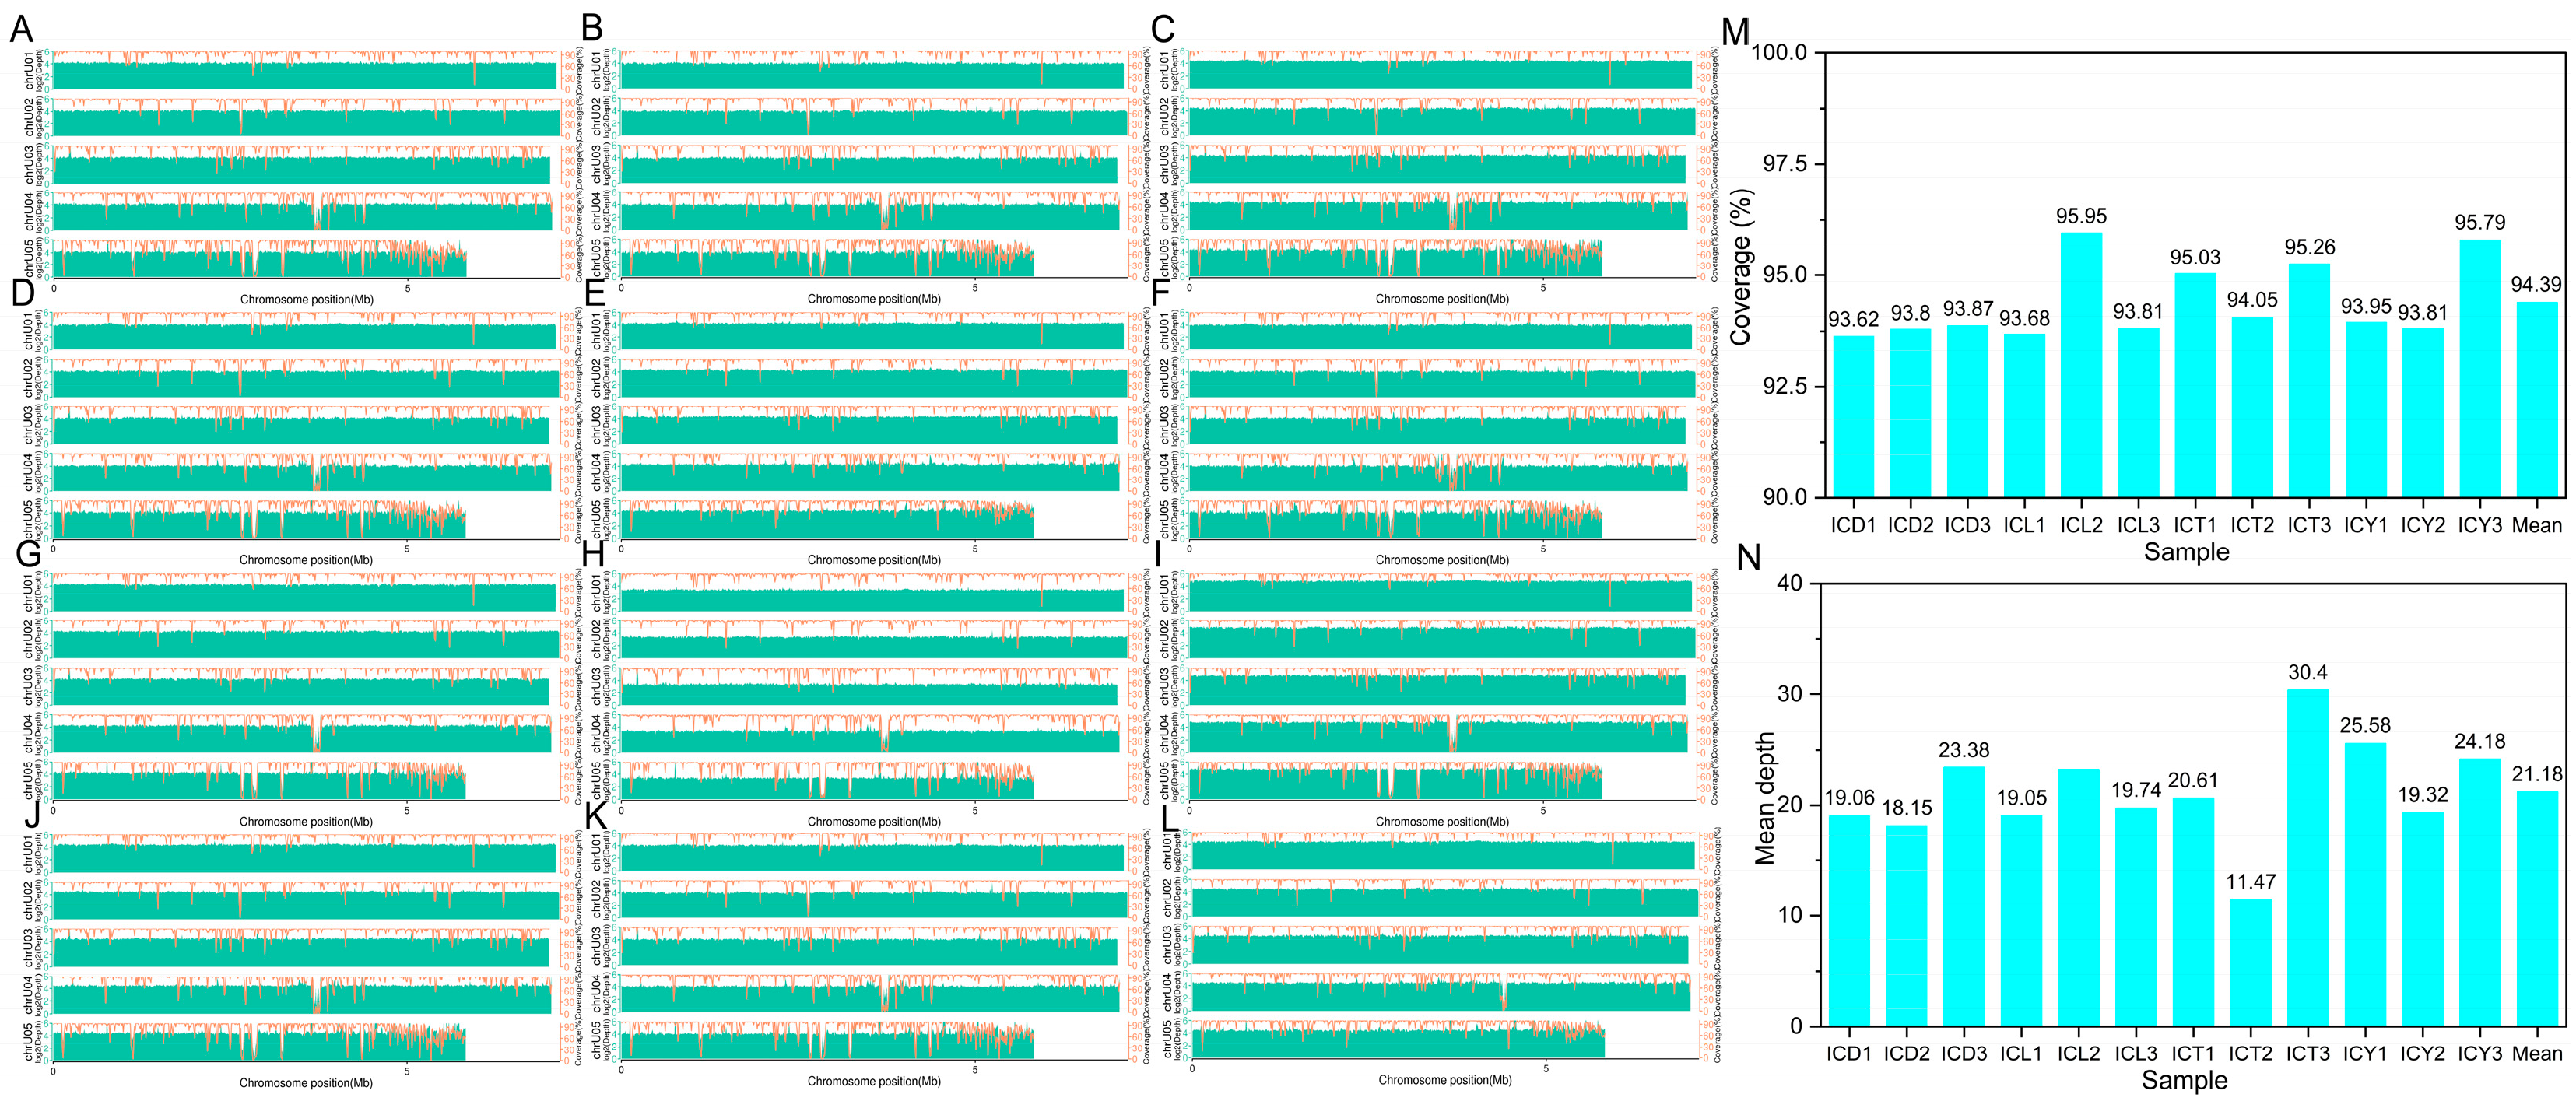
As shown in Figure 3, the coverage rate for the samples ranged from 93.62% to 95.79%, with an average of 94.39%. The overall high coverage indicates that most genomic regions were covered by reads, ensuring good completeness in detecting variant sites. Sample ICY3 had the highest coverage (95.79%), while ICD1 showed slightly lower coverage (93.62%). Samples with higher coverage, such as ICY3, ICT3, and ICL2, provided a more comprehensive capture of variation information, laying a solid foundation for subsequent variant analyses.

Figure 3.
Genomic coverage and depth: statistics and distribution. (A–L) Panels (A–L) represent samples ICD1, ICD2, ICD3, ICL1, ICL2, ICL3, ICT1, ICT2, ICT3, ICY1, ICY2, and ICY3, respectively. (M) Genomic coverage. (N) Genomic depth.
The average sequencing depth ranged from 11.47 to 30.40, with a mean of 21.18. Samples with higher depths, such as ICT3 (30.40), ICY1 (25.58), and ICY3 (24.18), demonstrated greater accuracy in detecting variants, particularly in non-repetitive genomic regions. On the other hand, ICT2 had the lowest sequencing depth (11.47), potentially limiting the precision of its variant detection.
Overall, the samples exhibited high coverage depth, ensuring the reliable detection of variants in most regions. Samples with a sequencing depth exceeding 20 are particularly robust in minimizing sequencing errors, further enhancing the reliability of results.
3.6. Analysis of Variation Types
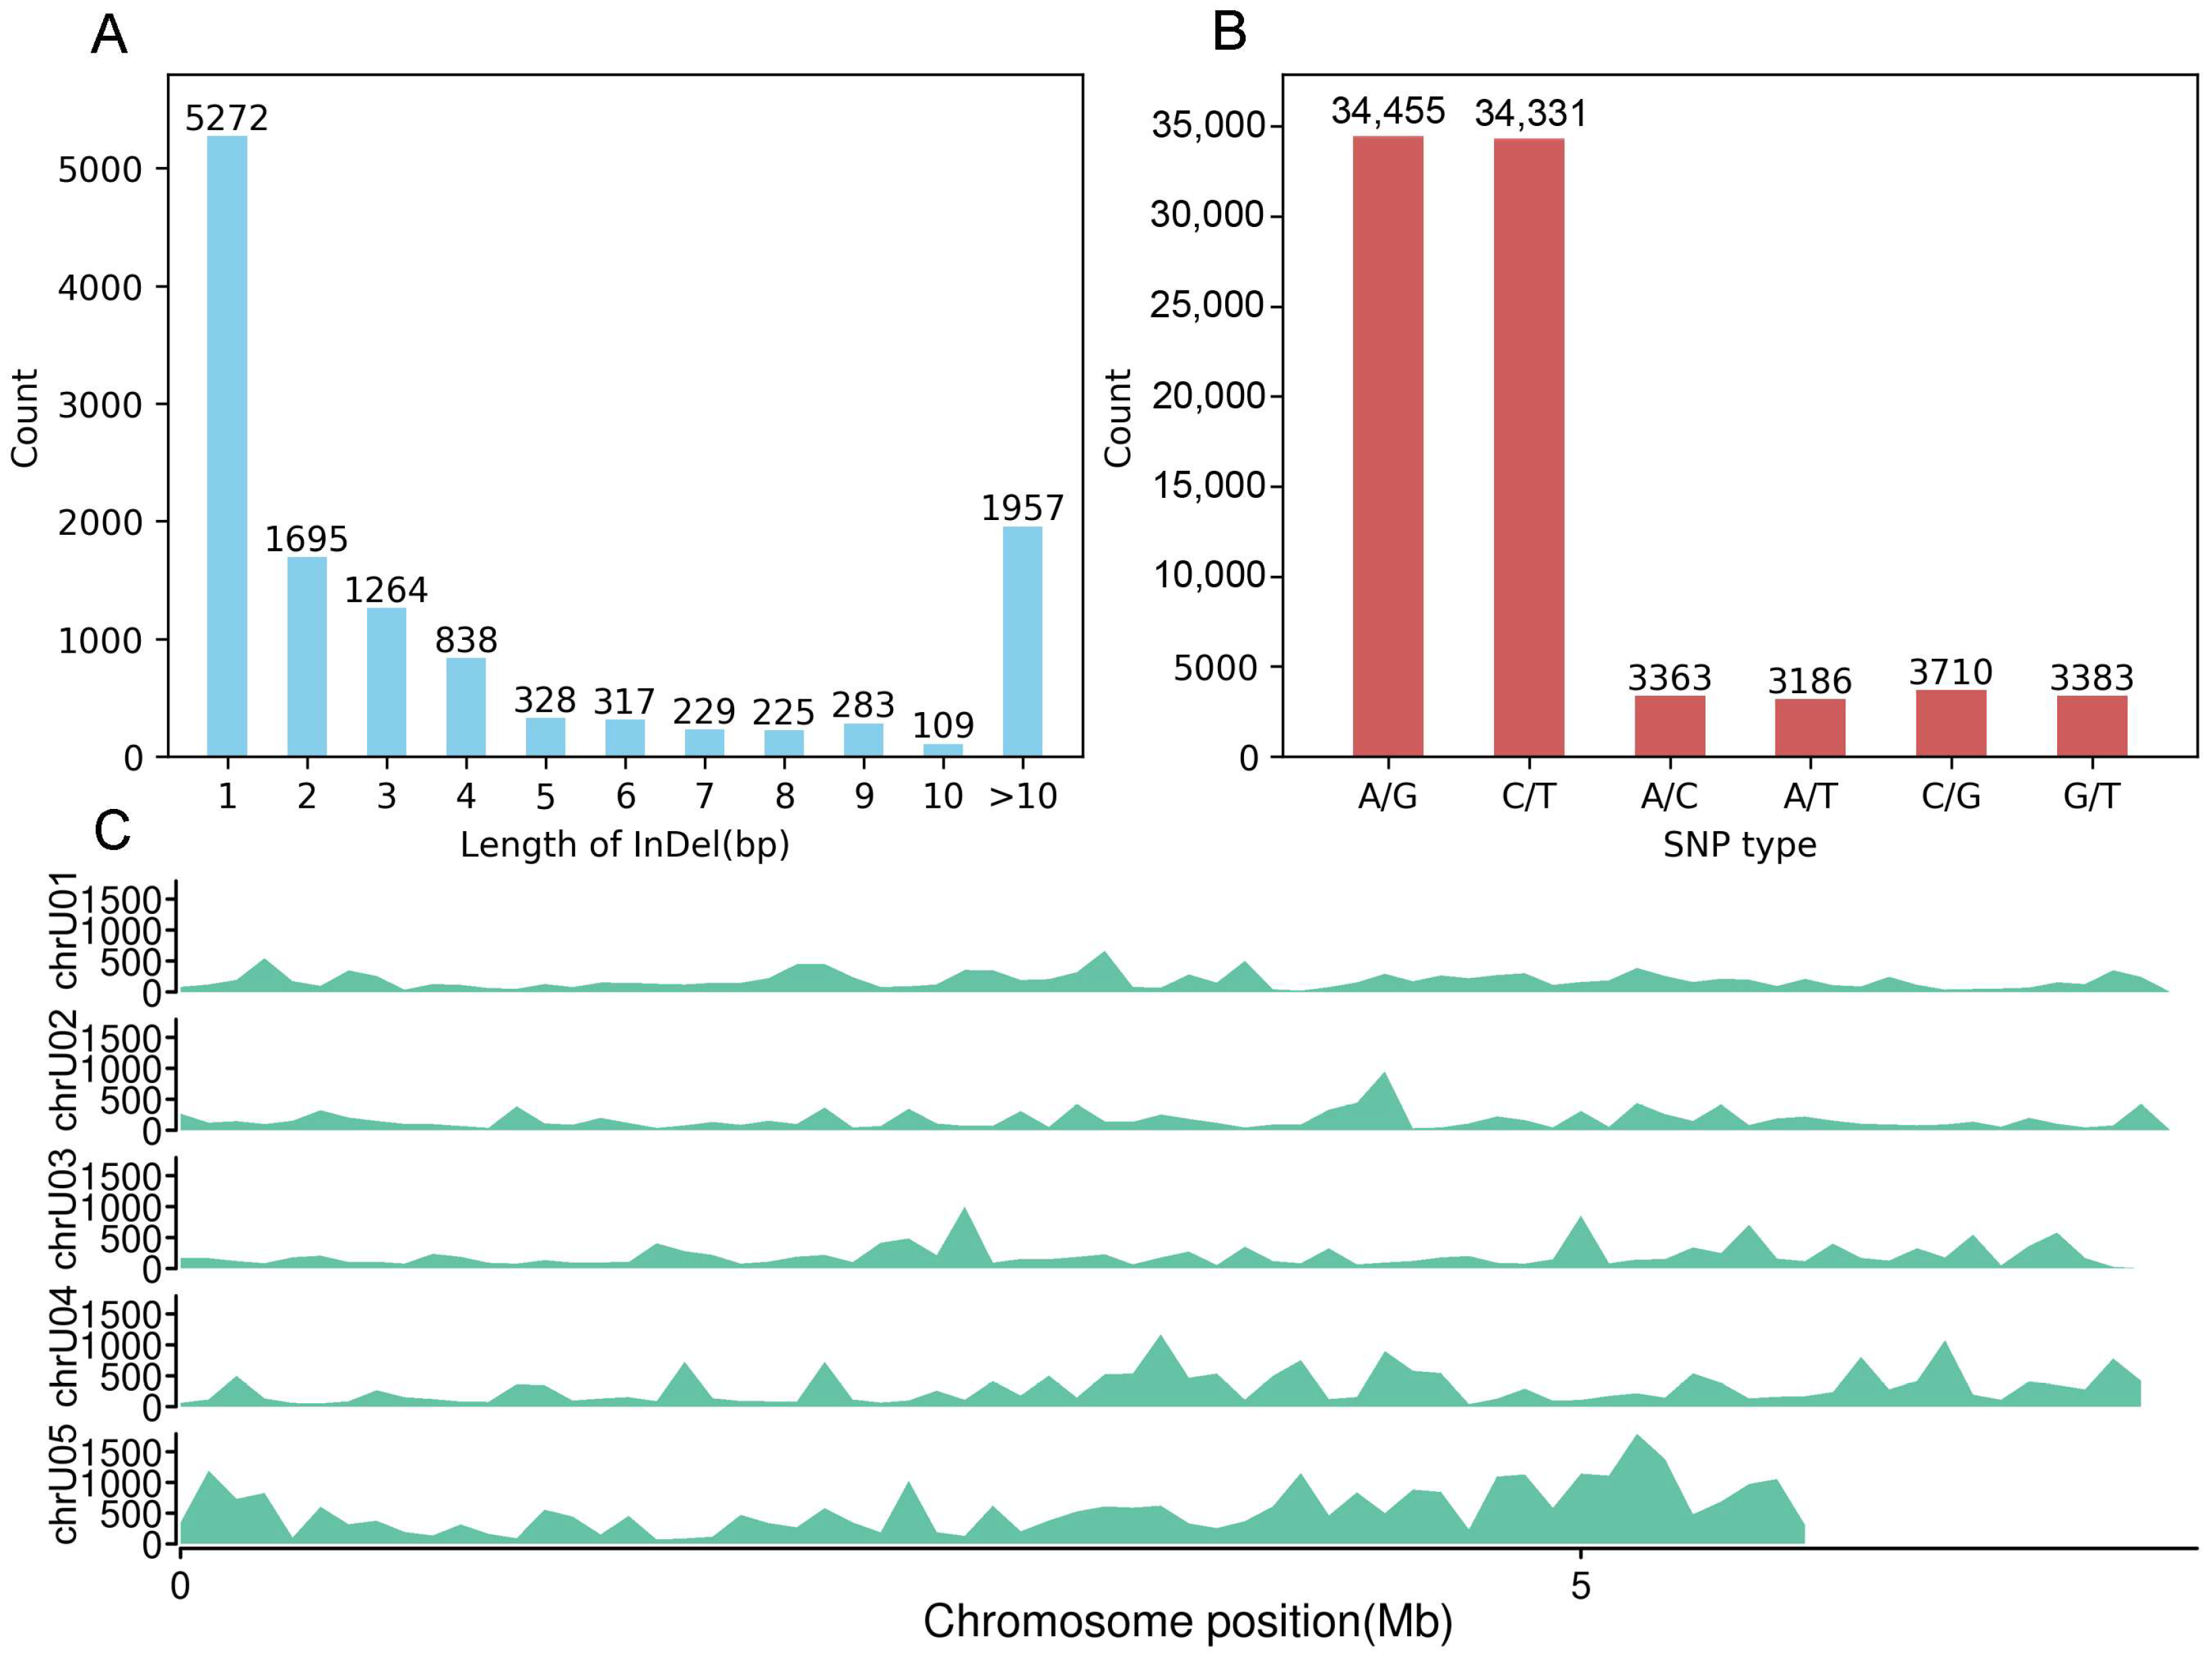
The statistical results for single-nucleotide polymorphism (SNP) types and insertion–deletion (InDel) lengths are shown in Figure 4. A total of 705,742 variation sites were identified in this study, of which 82,428 were SNPs, and 12,517 were InDels.

Figure 4.
The length of InDels, types of SNPs, and distribution of variations in the C. chanhua genome. (A) The length statistics of InDels. (B) The statistics of SNP types. (C) The distribution of variations across the genome.
Among the SNPs, 68,786 were transitions (A/G and C/T, i.e., purine-to-purine or pyrimidine-to-pyrimidine substitutions), while 13,642 were transversions (A/C, A/T, C/G, and G/T, i.e., purine-to-pyrimidine substitutions). The transition/transversion ratio (Ts/Tv) was 5.04, indicating that transition SNPs were significantly more frequent than transversion SNPs.
For InDels, 84.37% were ≤10 bp in length, while 15.63% were >10 bp. InDels of 1 bp length were the most abundant, accounting for 5272 occurrences.
These results highlight the predominant types of genetic variation in the analyzed samples, providing insights into the genetic structure and evolutionary dynamics of the wild C. chanhua populations.
3.7. Distribution of Variations Across the Genome
As shown in Table 3 and Figure 4C, SNP density, defined as the number of SNPs per million base pairs, varies significantly among chromosomes. The SNP density ranges from 1400.93 on chrU02 to 5187.86 on chrU05. The SNP density on chrU05 is notably higher than on other chromosomes. The genome-wide average SNP density is 2412.54. InDel density, representing the number of InDels per million base pairs, is relatively consistent, ranging from 311.30 on chrU02 to 399.33 on chrU05. The InDel density on chrU05 (399.33) is slightly above the genome-wide average of 366.35. The densities on other chromosomes are close to the average, indicating a less pronounced variation in InDel distribution compared to SNPs. ChrU05 stands out for its high SNP and InDel counts and densities. Although chrU04 has a similar total length to other chromosomes, it also exhibits a relatively high SNP density (2661.66).
Table 3.
Number of mutations and density.
Regions with high variation density, particularly SNP-rich areas, may represent loci under evolutionary selection pressure or adaptive responses to environmental factors. Across the genome, which spans a total length of 34,166,548 bp, 82,428 SNPs and 12,517 InDels were identified, with average SNP and InDel densities of 2412.54 and 366.35, respectively.
3.8. Population Structure Analysis
3.8.1. Structure Analysis
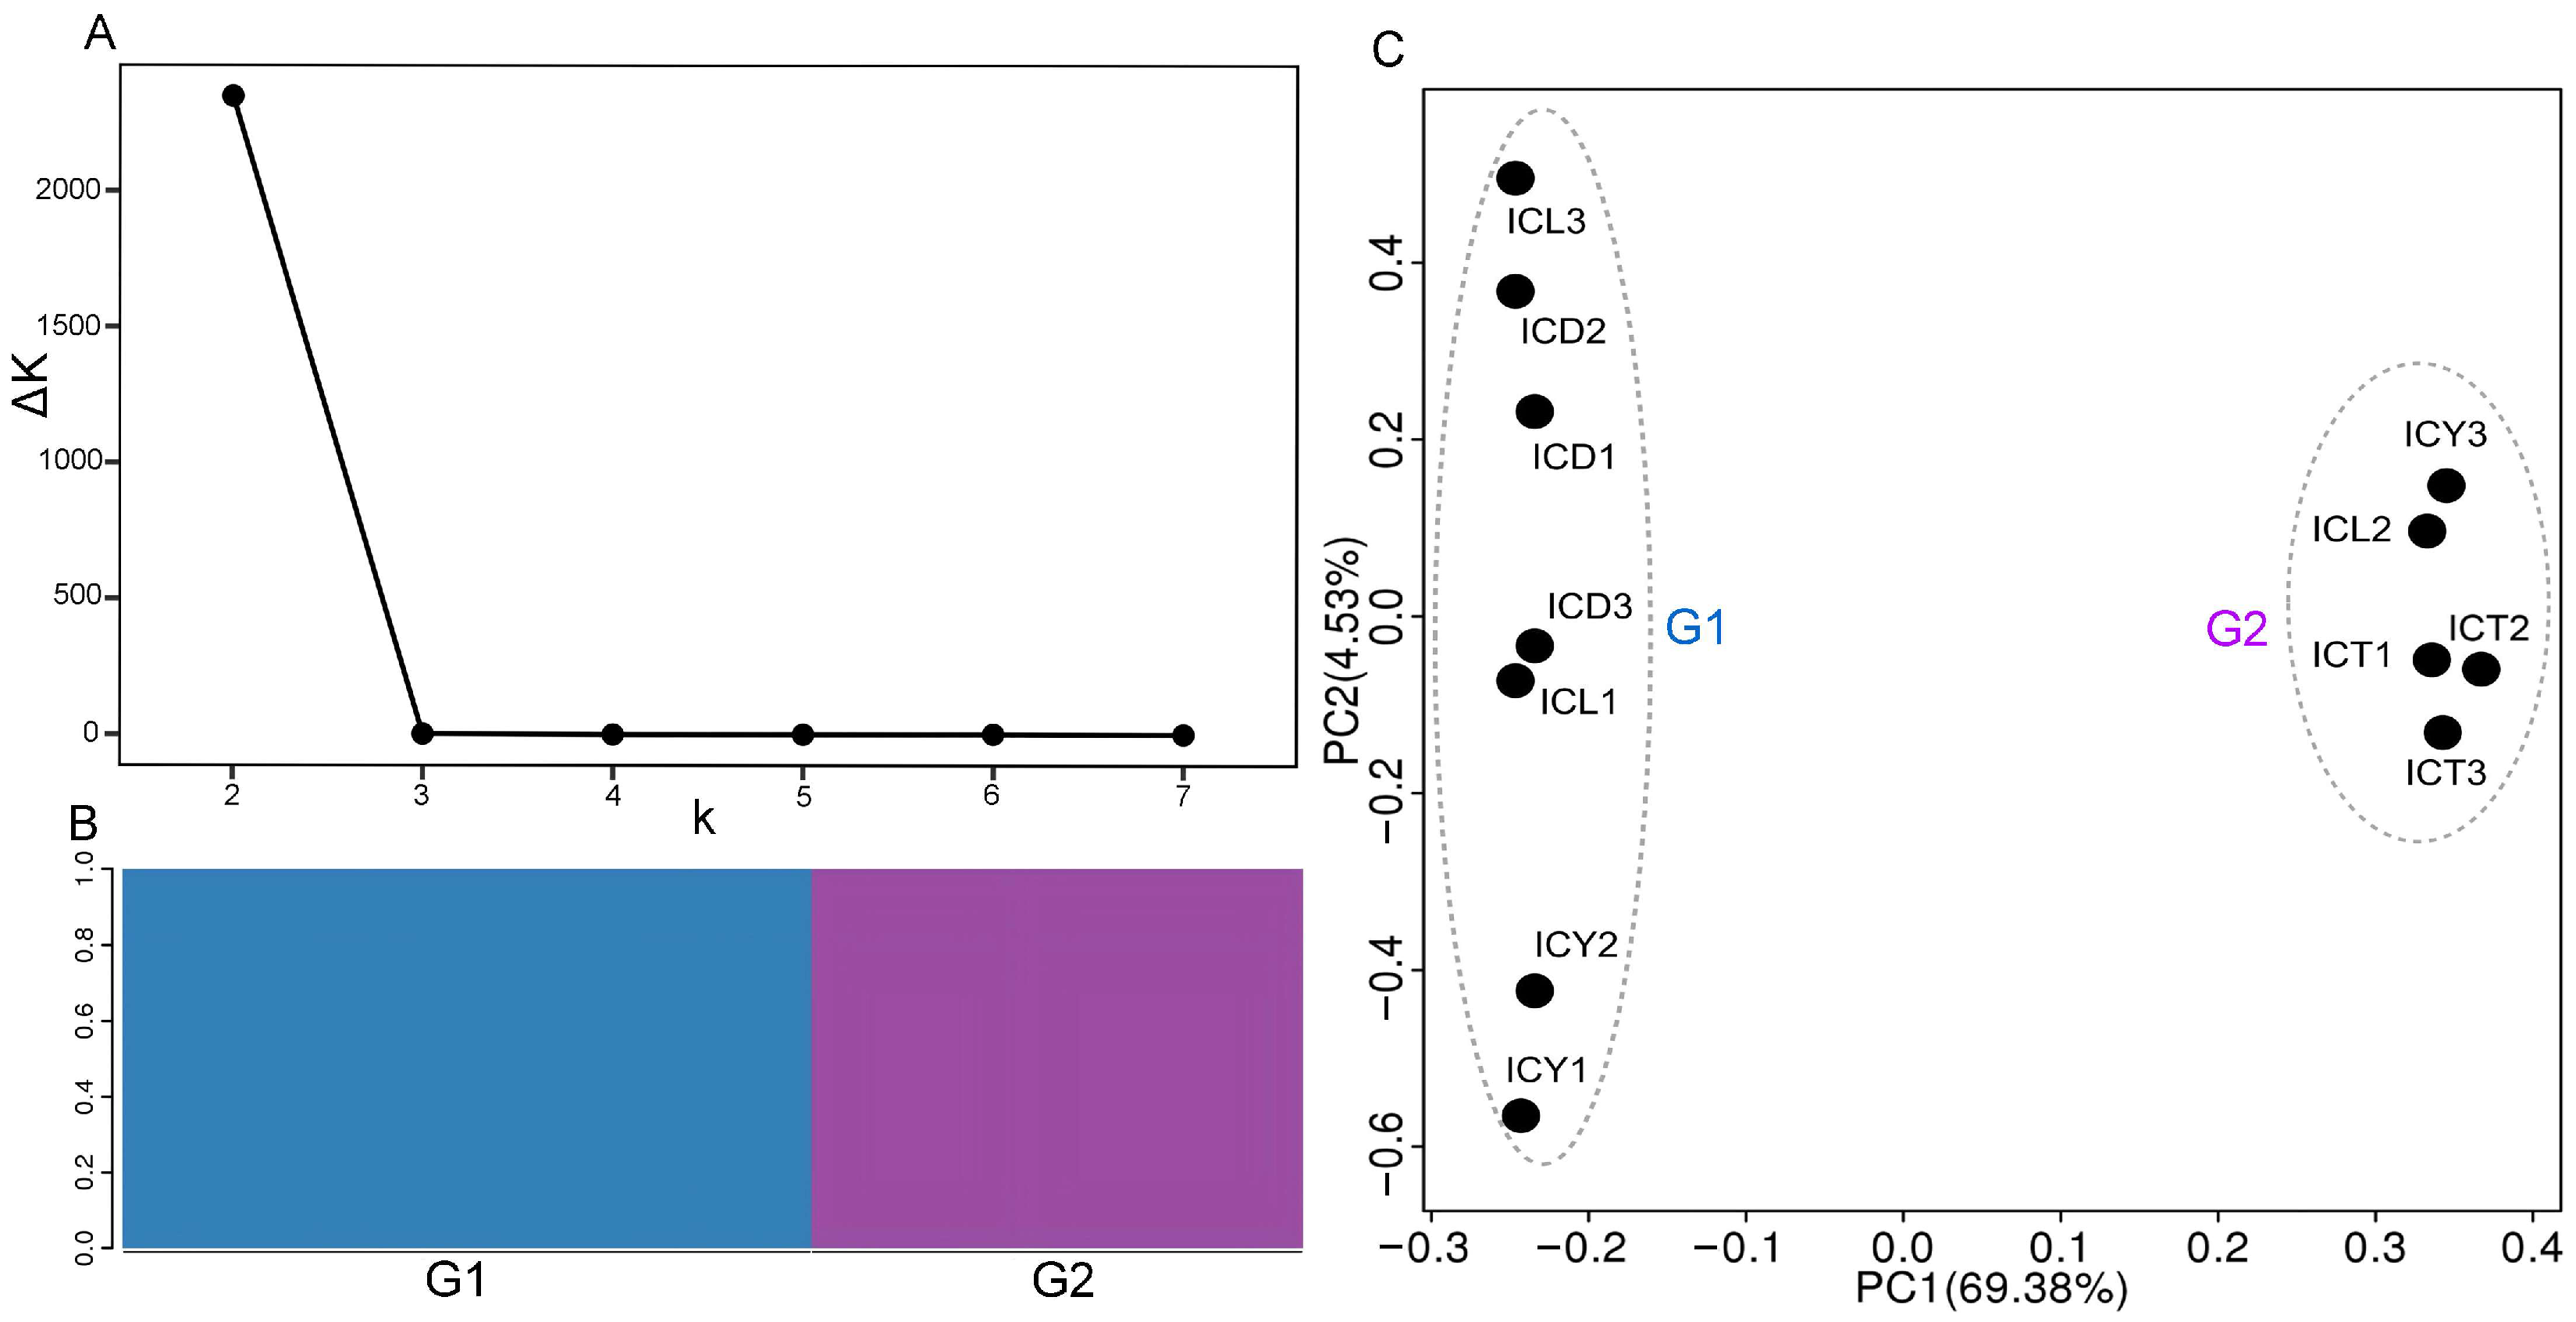
In the population structure analysis, the K value represents the number of hypothesized subgroups (or populations), and the ΔK value indicates the significance of the population differentiation. As shown in Figure 5A, the ΔK value is highest when K = 2, and then, it decreases rapidly and stabilizes as K increases, suggesting that K = 2 is the most suitable number of subgroups. This indicates that, when divided into two subgroups, the population structure shows the most significant differentiation. This significant differentiation is reflected in the clear genetic differences between individuals in the two subgroups, resulting in the optimal population structure. In the structure plot (Figure 5B), each color represents a subgroup, and the results align with the previous findings, showing that the samples can be divided into two subgroups.

Figure 5.
Population structure analysis. (A) The trend of ΔK. (B) The bar chart of Q values. (C) The PCA scatter plot.3.8.2. PCA.
3.8.2. PCA
Principal component analysis (PCA) was conducted using PLINK (version v1.90p). As shown in Figure 5C, the top two principal components, PC1 and PC2, explained 69.38% and 4.53% of the variance, respectively, with a cumulative contribution rate of 73.91%. The samples were grouped into two main clusters, corresponding to Group G1 and Group G2. Group G1 included samples ICD1, ICD2, ICD3, ICL1, ICL3, ICY1, and ICY2, which were primarily distributed in the negative PC1 region of the PCA plot. Group G2 comprised samples ICL2, ICT1, ICT2, ICT3, and ICY3, distributed in the positive PC1 region. PC1 accounted for the major genetic variation among the samples, effectively separating G1 and G2. PC2, on the other hand, reflected secondary genetic variation, showing some distribution differences within G1 and G2. Within Group G1, samples exhibited a broad distribution along PC2 (e.g., ICY1 and ICY2 in the negative PC2 region, while ICL3 was in the positive PC2 region). In contrast, Group G2 samples showed a more concentrated distribution along PC2, with minor differences. Most ICD and ICY samples clustered within G1, while ICT samples were concentrated in G2. The clustering characteristics of Group G2 highlight the genetic proximity of samples from Zhejiang Taizhou (ICT) and some samples from Jiangsu Yixing (ICY3).
3.9. Genetic Similarity Analysis
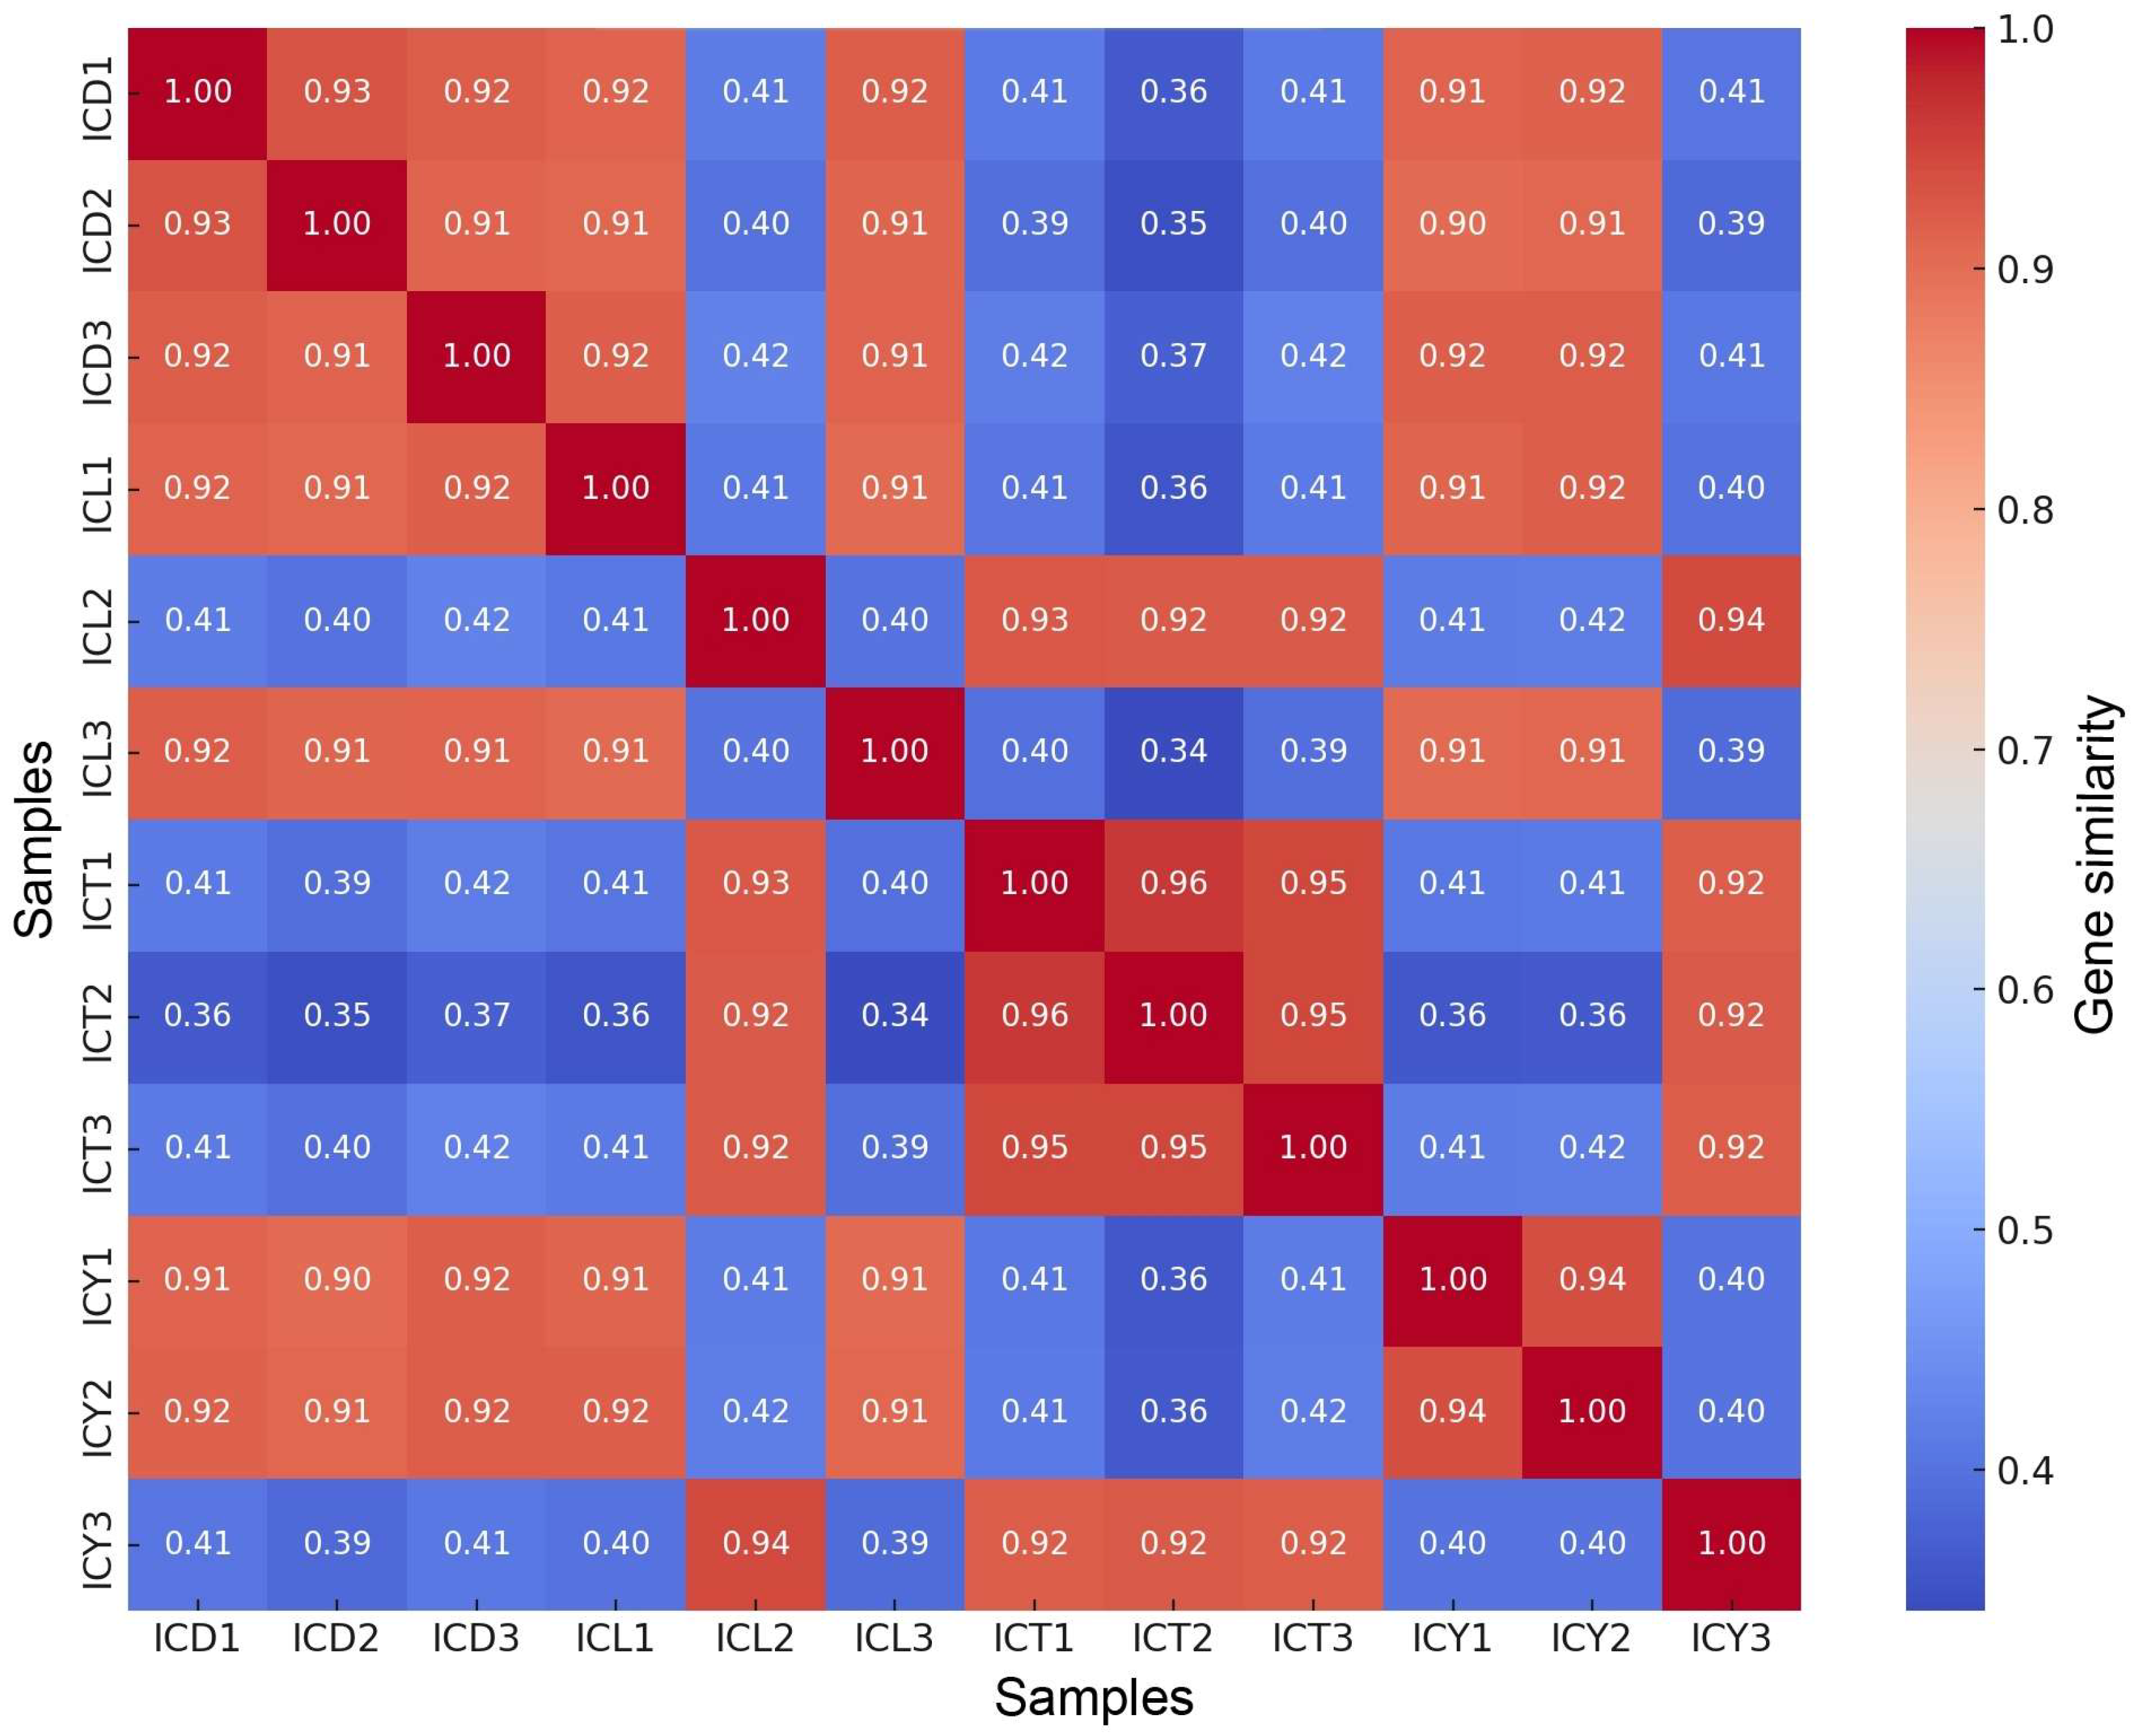
The genetic similarity analysis, as shown in Figure 6, revealed significant variations among the samples. Within the ICT sample group, the highest internal similarity was observed, with ICT1 and ICT2 showing a similarity of 0.96, ICT2 and ICT3 reaching 0.95, and ICT1 and ICT3 exhibiting a similarity of 0.95. The ICD sample group also displayed relatively high internal similarity, with ICD1 showing similarities of 0.93 with ICD2 and 0.92 with ICD3, while ICD2 and ICD3 had a similarity of 0.91. In contrast, the similarity between ICD and ICL samples was markedly lower, generally ranging from 0.4 to 0.5. The highest similarity between these groups was observed between ICD3 and ICL2, which reached 0.42. Moderate internal similarity was found within the ICL group, with ICL1 and ICL3 exhibiting a similarity of 0.91 and ICL2 and ICL3 reaching 0.94. The ICY sample group demonstrated limited genetic similarity with other groups. For instance, the similarity between ICY1 and ICT1 was only 0.41, and the similarity between ICY1 and ICL1 was 0.41, highlighting the genetic distinctiveness of the ICY group. However, relatively high internal similarity was observed within the ICY group, with ICY1 and ICY2 showing a similarity of 0.94, and ICY2 and ICY3 also reaching 0.94.

Figure 6.
Gene similarity heatmap.
4. Discussion
4.1. Relationship Between Geographical Origin and Genetic Differentiation
This study analyzed the genetic diversity of Cordyceps chanhua from different regions in China using molecular identification, phylogenetic analysis, and genomic variation. The results revealed a correlation between genetic background and geographic origin, though clustering was not strictly geographic. This aligns with findings by Chen Mingjun et al. [35], who observed genetic differentiation among Isaria cicadae populations without strict geographic clustering. Notably, the ICD samples from Dazhou, Sichuan, exhibited significant genetic differentiation, likely influenced by geographic isolation, local environmental adaptation, and evolutionary pressures [36,37].
Latitude, longitude, and climate analysis indicated distinct geographic distributions among the samples. ICT samples, located at the lowest latitude (28°48′ N) in a humid subtropical monsoon climate zone, showed unique genetic traits shaped by wetter conditions (average temperature: 17.1 °C; precipitation: 2029 mm). In contrast, ICY (16.6 °C, 1593.6 mm) and ICL (15.6 °C, 1145.7 mm) samples, despite similar latitudes, demonstrated genetic differentiation due to climate variability. ICD samples, situated further west (107°20′ E) in a moderate climate (16.6 °C, 1193.3 mm), exhibited genetic traits closer to western populations. These findings suggest that genetic differentiation is influenced by both geographic and environmental factors rather than distance alone.
Methodological differences may also contribute to variations in findings. While Chen et al. used ISSR-PCR markers, this study employed whole-genome resequencing, offering higher resolution. Additionally, Zeng et al. [27] reported no significant geographic correlation in micromorphological traits, supporting the conclusion that C. chanhua’s genetic characteristics result from a combination of genetic and environmental factors.
4.2. Significance of Population Structure Analysis
The observed genetic clustering underscores the influence of both geographic and environmental factors on the genetic structure of C. chanhua. Subgroup G1, encompassing samples from regions with moderate precipitation (Sichuan Dazhou: 1193.3 mm; Anhui Lu’an: 1145.7 mm), reflects potential adaptations to similar climatic conditions. Subgroup G2, with samples from Zhejiang Taizhou (2029 mm precipitation) and parts of Jiangsu Yixing, indicates the potential for genetic differentiation driven by wetter and warmer conditions.
These findings have practical implications for breeding programs. The distinct subgroups identified can serve as a genetic basis for hybridization efforts, enabling the development of germplasm with enhanced adaptability and yield. Moreover, regional conservation strategies can leverage these insights to protect and sustainably utilize C. chanhua genetic resources, particularly in areas under environmental stress [38,39].
4.3. Types and Distribution of Genetic Variations
The high Ts/Tv ratio observed in C. chanhua suggests that purine/pyrimidine exchanges dominate genomic variations, a pattern commonly associated with genome stability and adaptive mutation mechanisms [40]. The elevated SNP and InDel densities on chrU05 may indicate regions under strong selection pressures or with increased genetic diversity. These regions could harbor critical regulatory genes or adaptive traits, highlighting chrU05 as a potential target for future genetic and functional studies.
Additionally, the relatively high SNP density on chrU04 suggests localized hotspots of variation that may reflect evolutionary pressures unique to specific populations or environmental conditions [41]. This differential distribution of genetic variations across chromosomes provides new insights into the genetic architecture of C. chanhua, which could guide further research into its adaptation and evolution under varying environmental conditions [42].
4.4. Significance of the Development of C. chanhua Germplasm Resources
This study’s genetic variation analysis provides essential insights into the adaptive and evolutionary mechanisms of C. chanhua, forming a foundation for its conservation, sustainable utilization, and industrial application.
Conservation Strategies: (1) In Situ Conservation: high-diversity regions, such as the ICT population in Zhejiang with unique climatic adaptations, should be designated as conservation hotspots to maintain ecological interactions and adaptive potential [43]. (2) Ex Situ Conservation: gene banks should preserve genetic materials from distinct populations, such as the ICD population from Sichuan, safeguarding unique traits against environmental or anthropogenic threats [44].
Sustainable Utilization Strategies: (1) Molecular Breeding: high-density SNP loci linked to stress tolerance and growth can support marker-assisted selection (MAS) to develop superior strains [45]. (2) Artificial Cultivation: insights into adaptive traits enable tailored cultivation systems, enhancing bioactive compound production, especially in stress-tolerant populations [46]. (3) Adaptive Gene Identification: SNP-dense regions (e.g., chrU05 and chrU04) can guide the identification of key genes for environmental adaptation, improving cultivation practices for diverse conditions [47].
Industrial Implications: (1) Standardized Cultivation: genomic insights facilitate the development of consistent cultivation protocols for pharmaceutical and nutraceutical applications [48]. (2) Biodiversity-Friendly Industries: combining conservation with sustainable utilization balances genetic resource protection and economic growth, particularly in ecologically sensitive regions [49].
By integrating genomic insights with conservation and utilization strategies, this study offers a comprehensive framework for the precise development of C. chanhua germplasm resources, ensuring its ecological and economic sustainability.
5. Conclusions
This study utilized molecular identification, phylogenetic analysis, genome coverage and depth assessment, and genetic variation analysis to elucidate the genetic diversity characteristics of Cordyceps chanhua from different geographic regions in China. The results revealed significant genetic differentiation among C. chanhua populations, driven by their geographic distribution and environmental adaptations. High-density regions of SNPs and InDels, particularly on specific chromosomes, were identified as potential hotspots of evolutionary selection and adaptive response. Phylogenetic and population structure analyses further demonstrated distinct genetic clustering patterns, reflecting the genetic relatedness and geographic differentiation of C. chanhua populations. These findings provide a valuable foundation for the conservation and sustainable utilization of C. chanhua germplasm resources and for promoting regionalized cultivation strategies.
Future research should focus on identifying adaptive genes and functional genomic regions associated with environmental resilience and economically important traits. Advancements in hybridization techniques and molecular marker-assisted breeding could expedite the development of superior C. chanhua germplasm, supporting its genetic improvement and fostering diverse industrial applications [50,51]. Moreover, genomic insights gained from this study offer a robust framework for the conservation, breeding, and industrial utilization of C. chanhua, contributing to its ecological sustainability and economic potential. These findings not only advance our understanding of the genetic mechanisms underlying C. chanhua’s adaptability and diversity but also provide a valuable reference for molecular breeding research in medicinal and functional plant species.
Author Contributions
Conceptualization, W.J., W.S. and Y.W.; data curation, W.J. and X.L.; software, W.J.; Validation, L.R., H.W., K.C. and W.J.; formal analysis, W.J., L.R. and H.W.; Writing—original draft, W.J.; writing—review and editing, W.J. and L.R. All authors have read and agreed to the published version of the manuscript.
Funding
This research was supported by the Jiangsu Modern Agricultural Industrial Technology System Project [JATS(2022)177], the Lianyungang Municipal Science and Technology Program Key R&D Project (SF2404), and the Financial Grant Support Program of Lianyungang City, Jiangsu Province, China (QNJJ2410).
Institutional Review Board Statement
Not applicable.
Informed Consent Statement
Not applicable.
Data Availability Statement
All data generated or analyzed during this study are included in this published article.
Acknowledgments
We would like to express our gratitude to Zhu Jingxian, Wu He, and others for their support and assistance during the collection of wild C. chanhua resources. We also extend our heartfelt thanks to Li Juanjuan from Wuhan GeneSeq Technology Co., Ltd. for her support and assistance in the molecular identification and gene sequencing of C. chanhua.
Conflicts of Interest
The authors have no conflicts of interest to declare.
References
- Li, Z.; Hywel-Jones, N.L.; Luan, F.; Zhang, S.; Sun, C.; Chen, Z.; Li, C.; Tan, Y.; Dong, J. Study on the biodiversity of cicada flowers I: Literature review. Mycosystema 2020, 39, 2191–2201. [Google Scholar] [CrossRef]
- Liu, A. Research and Application of Cicada Flower Resources in China; Guizhou Science and Technology Press: Guiyang, China, 2012. [Google Scholar]
- Xing, X. Classification of Cordyceps sobolifera and Cordyceps cicadae. Acta Microbiol. Sin. 1975, 15, 21–26. [Google Scholar] [CrossRef]
- Liang, Z. Fungorum Sinicorum Vol. 32: Cordyceps; Science Press: Beijing, China, 2007. [Google Scholar]
- Luangsa-Ard, J.J.; Hywel-Jones, N.L.; Manoch, L.; Samson, R.A. On the relationships of Paecilomyces ect. Isarioidea species. Mycol. Res. 2005, 109, 581–589. [Google Scholar] [CrossRef]
- Li, Z.; Luan, F.; Hywel-Jones, N.L.; Zhang, S.; Chen, M.; Huang, B.; Sun, C.; Chen, Z.; Li, C.; Tan, Y.; et al. Study on the biodiversity of cicada flowers II: Discovery and naming of the sexual form of Cordyceps cicadae. Mycosystema 2021, 40, 95–107. [Google Scholar] [CrossRef]
- Liang, S.; Wang, H. Research progress of Cordyceps cicadae. J. Zhejiang Agric. Sci. 2023, 35, 2013–2022. Available online: https://link.cnki.net/urlid/33.1151.S.20230620.1429.008 (accessed on 2 December 2024).
- Zhou, S.; Qiao, Y.; Liu, G.; Chen, W.; Wang, P.; Song, M.; Wang, C. Research status and analysis of Cordyceps cicadae. Food Ferment. Ind. 2024, 50, 341–350. [Google Scholar] [CrossRef]
- Li, H. Study on the Investigation and Utilization of Cordyceps Cicadae Resources in Sichuan Province. Ph.D. Dissertation, Northwest A&F University, Xianyang, China, 2022. [Google Scholar] [CrossRef]
- Li, Z.; Hywel-Jones, N.L.; Sun, C. Cultural and scientific history of Cordyceps. Mycosystema 2022, 41, 1731–1760. [Google Scholar] [CrossRef]
- Xie, H. Study on the Antitumor Mechanism of Active Components of Cordyceps Cicadae and Artificial Cultivation Technology Using Silkworm Pupae as an Alternative Host. Ph.D. Dissertation, Zhejiang University, Hangzhou, China, 2021. [Google Scholar] [CrossRef]
- Xie, X.; Guo, H.; Liu, J.; Wang, J.; Li, H.; Deng, Z. Edible and medicinal progress of Cryptotympana atrata (Fabricius) in China. Nutrients 2023, 15, 4266. [Google Scholar] [CrossRef]
- Chun, R.L.; Yu, Q.W.; Wen, M.C.; Zhu, A.C.; Hywel-Jones, N.; Zeng, Z.L. Review on research progress and prospects of Isaria cicadae (ascomycetes). Int. J. Med. Mushrooms 2021, 23, 81–91. [Google Scholar] [CrossRef]
- Zhang, Y.; Wu, Y.T.; Zheng, W.; Han, X.X.; Jiang, Y.H.; Hu, P.L.; Tang, Z.X.; Shi, L.E. Antibacterial activity and mechanism of a polysaccharide from Cordyceps cicadae. J. Funct. Foods 2017, 38, 273–279. [Google Scholar] [CrossRef]
- Zhao, J.C.; Shao, Y.; Ren, G.; Zhang, A.W.; Liu, H.; Li, W. Chemical components of spore powder and synnemata of Isaria cicadae and effect of the polysaccharides on Drosophila melanogaster. Food Sci. Technol. 2019, 44, 205–210+219. [Google Scholar]
- Olatunji, O.J.; Feng, Y.; Olatunji, O.O.; Tang, J.; Wei, Y.; Ouyang, Z.; Su, Z. Polysaccharides purified from Cordyceps cicadae protect PC12 cells against glutamate-induced oxidative damage. Carbohydr. Polym. 2016, 153, 187–195. [Google Scholar] [CrossRef] [PubMed]
- Wang, Y.; Zeng, T.; Li, H.; Wang, Y.; Wang, J.; Yuan, H. Structural characterization and hypoglycemic function of polysaccharides from Cordyceps cicadae. Molecules 2023, 28, 526. [Google Scholar] [CrossRef] [PubMed]
- Shi, C.; Song, W.; Gao, J.; Yan, S.; Guo, C.; Zhang, T. Enhanced production of cordycepic acid from Cordyceps cicadae isolated from a wild environment. Braz. J. Microbiol. 2022, 53, 673–688. [Google Scholar] [CrossRef]
- Ke, B.J.; Lee, C.L. Investigation on the fermentation for high adenosine and N6-(2-hydroxyethyl)-adenosine (HEA) productions of Cordyceps cicadae. New Biotechnol. 2016, 33 (Supplement), S206–S207. [Google Scholar] [CrossRef]
- Ji, W.; Su, W.; Wang, Y.; Liu, X.; Ren, L.; Yang, Z.; Zhou, Z.; Chen, K. Breeding of superior strains of Cordyceps cicadae. J. Anhui Agric. Univ. 2024, 51, 697–705. [Google Scholar] [CrossRef]
- Jin, J.; Sui, Z.; Qin, L.; Zhao, J.; Ding, Y. Optimization of alkaline-assisted pressurized extraction of polysaccharides from Isaria cicadae fruiting bodies and evaluation of their in vitro immunological activity. Food Saf. Qual. Detect. J. 2023, 14, 96–103. [Google Scholar] [CrossRef]
- Yu, S.; Ji, W.; Dong, J.; Chen, Q.; Fan, M. Nutritional value analysis of proteins from different products of Isaria cicadae. Amino Acids Biol. Res. 2014, 36, 35–39. [Google Scholar] [CrossRef]
- Zhang, Z.; Tan, J.; Li, X.; Cheng, G.; Liu, T.; He, D. Preliminary investigation of artificial cultivation conditions for Isaria cicadae. Chem. Biol. Eng. 2019, 36, 12–14+28. Available online: https://link.cnki.net/urlid/42.1710.TQ.20190716.1322.006 (accessed on 2 December 2024).
- El-Esawi, M.A. Genetic diversity and evolution of Brassica genetic resources: From morphology to novel genomic technologies—A review. Plant Genet. Resour. 2017, 15, 388–399. [Google Scholar] [CrossRef]
- Shah, R.A.; Bakshi, P.; Jasrotia, A.; Itoo, H.; Padder, B.A.; Gupta, R.; Kour, G.; Dolkar, D. Morphological to molecular markers: Plant genetic diversity studies in walnut (Juglans regia L.)—A review. Erwerbs-Obstbau. 2023, 65, 1499–1511. [Google Scholar] [CrossRef]
- Dar, J.A.; Wani, A.A.; Dhar, M.K. Assessment of the genetic diversity of apple (Malus × domestica Borkh.) cultivars grown in the Kashmir Valley using microsatellite markers. J. King Saud Univ.-Sci. 2019, 31, 194–201. [Google Scholar] [CrossRef]
- Zeng, W.B.; Chang, C.; Li, J.P.; Wang, Y.B.; Dai, Y.D.; Yu, H. Morphological variations of Isaria cicadae. Acta Microbiol. Sin. 2017, 57, 350–362. [Google Scholar] [CrossRef]
- Fan, W.W.; Zhang, S.; Zhang, Y.J. The complete mitochondrial genome of the Chan-hua fungus Isaria cicadae: A tale of intron evolution in Cordycipitaceae. Environ. Microbiol. 2019, 21, 864–879. [Google Scholar] [CrossRef] [PubMed]
- Tao, Y.; Han, R.; Qiao, L.; Gao, X.; Xing, J.; Wang, R.; Zhu, D. Growth characteristics of an alkalophilic bacterium ZB109 and optimization of tetrahydropyrimidine fermentation conditions. Microbiol. Bull. 2024, 51, 3939–3953. [Google Scholar] [CrossRef]
- Ji, W.; Su, W.; Liu, X.; Ren, L.; Hu, S.; Sun, X.; Chen, K. Analysis of biological characteristics and genomic features of wild Ganoderma in Lianyungang. Jiangsu Agric. J. 2024, 40, 223–232. [Google Scholar]
- McKenna, A.; Hanna, M.; Banks, E.; Sivachenko, A.; Cibulskis, K.; Kernytsky, A.; Garimella, K.; Altshuler, D.; Gabriel, S.; Daly, M.; et al. The Genome Analysis Toolkit: A MapReduce framework for analyzing next-generation DNA sequencing data. Genome Res. 2010, 20, 1297–1303. [Google Scholar] [CrossRef] [PubMed]
- Pritchard, J.K.; Stephens, M.; Donnelly, P. Inference of population structure using multilocus genotype data. Genetics 2000, 155, 945–959. [Google Scholar] [CrossRef]
- Purcell, S.; Neale, B.; Todd-Brown, K.; Thomas, L.; Ferreira, M.; Bender, D.; Maller, J.; Sklar, P.; de Bakker, P.; Daly, M.J.; et al. PLINK: A Tool Set for Whole-Genome and Population-Based Linkage Analyses. Am. J. Hum. Genet. 2007, 81, 559–575. [Google Scholar] [CrossRef] [PubMed]
- Evanno, G.; Regnaut, S.; Goudet, J. Detecting the number of clusters of individuals using the software structure: A simulation study. Mol. Ecol. 2005, 14, 2611–2620. [Google Scholar] [CrossRef]
- Chen, M.; Lu, L.; Lin, Y.; Liu, Y.; Xie, J. Study on genetic heterogeneity of different origins of Isaria cicadae. J. Anhui Agric. Univ. 2021, 48, 452–457. [Google Scholar] [CrossRef]
- Bradburd, G.S.; Ralph, P.L.; Coop, G.M. Disentangling the effects of geographic and ecological isolation on genetic differentiation. Evolution 2013, 67, 3258–3273. [Google Scholar] [CrossRef]
- Liu, Y.; Dietrich, C.H.; Wei, C. The impact of geographic isolation and host shifts on population divergence of the rare cicada Subpsaltria yangi. Mol. Phylogenet. Evol. 2024, 199, 108146. [Google Scholar] [CrossRef]
- Feng, E.Y.; Xiao, X.O.; Lin, W.Q.; Mo, D.M.; Feng, X.G.; Ma, F.J. Analysis of genetic diversity in eggplant germplasm resources using SALF-seq simplified genome sequencing. Mol. Plant Breed. 2022, 20, 7940–7949. [Google Scholar] [CrossRef]
- Cao, L.; Yang, D.; Zhang, Q.; Ni, Y.; Li, W.; Feng, R.; Mu, W.; Zhao, X. Population genetic structure of Hymenopellis radicata germplasm resources based on genome re-sequencing. Front. Microbiol. 2024, 15, 1287641. [Google Scholar] [CrossRef]
- Pfenninger, M.; Foucault, Q. Genomic processes underlying rapid adaptation of a natural Chironomus riparius population to unintendedly applied experimental selection pressures. Mol. Ecol. 2020, 29, 2512. [Google Scholar] [CrossRef]
- Zhang, X.; Zhang, H.; Li, L.; Lan, H.; Ren, Z.; Liu, D.; Wu, L.; Liu, H.; Jaqueth, J.; Li, B.; et al. Characterizing the population structure and genetic diversity of maize breeding germplasm in Southwest China using genome-wide SNP markers. BMC Genom. 2016, 17, 697. [Google Scholar] [CrossRef] [PubMed]
- Rizzo, M.; Soisangwan, N.; Vega-Estevez, S.; Price, R.J.; Uyl, C.; Iracane, E.; Shaw, M.; Soetaert, J.; Selmecki, A.; Buscaino, A. Stress combined with loss of the Candida albicans SUMO protease Ulp2 triggers selection of aneuploidy via a two-step process. PLoS Genet. 2022, 18, e1010576. [Google Scholar] [CrossRef] [PubMed]
- Pacicco, L.; Bodesmo, M.; Torricelli, R.; Negri, V. A methodological approach to identify agro-biodiversity hotspots for priority in situ conservation of plant genetic resources. PLoS ONE 2018, 13, e0197709. [Google Scholar] [CrossRef]
- Abeli, T.; Dalrymple, S.; Godefroid, S.; Mondoni, A.; Müller, J.V.; Rossi, G.; Orsenigo, S. Ex situ collections and their potential for the restoration of extinct plants. Conserv. Biol. 2020, 34, 303–313. [Google Scholar] [CrossRef]
- Tu, W.; Li, J.; Dong, J.; Wu, J.; Wang, H.; Zuo, Y.; Cai, X.; Song, B. Molecular Marker-Assisted Selection for Frost Tolerance in a Diallel Population of Potato. Cells 2023, 12, 1226. [Google Scholar] [CrossRef]
- Krishna, K.V.; Balasubramanian, B.; Park, S.; Bhattacharya, S.; Sebastian, J.K.; Liu, W.C.; Pappuswamy, M.; Meyyazhagan, A.; Kamyab, H.; Chelliapan, S.; et al. Conservation of Endangered Cordyceps sinensis through artificial cultivation strategies of C. militaris, an alternate. Mol. Biotechnol. 2024. [Google Scholar] [CrossRef]
- Grimberg, Å.; Saripella, G.V.; Repo-Carrasco Valencia, R.A.-M.; Bengtsson, T.; Alandia, G.; Carlsson, A.S. Transcriptional regulation of quinoa seed quality: Identification of novel candidate genetic markers for increased protein content. Front. Plant Sci. 2022, 13, 816425. [Google Scholar] [CrossRef]
- Li, J.; Li, Z.; Duan, Y.; Liu, C.; Yan, M. Secondary Metabolites of Fomitopsis betulina: Chemical Structures, Biological Activity, and Application Prospects. J. Fungi 2024, 10, 616. [Google Scholar] [CrossRef]
- Ryan, M.J.; McCluskey, K.; Verkleij, G.; Robert, V.; Smith, D. Fungal biological resources to support international development: Challenges and opportunities. World J. Microbiol. Biotechnol. 2019, 35, 139. [Google Scholar] [CrossRef]
- Yang, N.N.; Jiang, N.; Ma, Q.Y.; Kong, F.D.; Xie, Q.Y.; Zhou, L.M.; Yu, Z.F.; Zhao, Y.X. Chemical study of the strain Cordyceps spp. from cell fusion between Cordyceps militaris and Cordyceps cicadae. J. Asian Nat. Prod. Res. 2019, 21, 449–455. [Google Scholar] [CrossRef]
- Li, J.; Zhang, T.; Zeng, W. Research progress on the classification status and genetic diversity of Isaria cicadae. China Edible Fungi 2019, 38, 1–5+16. [Google Scholar] [CrossRef]
Disclaimer/Publisher’s Note: The statements, opinions and data contained in all publications are solely those of the individual author(s) and contributor(s) and not of MDPI and/or the editor(s). MDPI and/or the editor(s) disclaim responsibility for any injury to people or property resulting from any ideas, methods, instructions or products referred to in the content. |
© 2025 by the authors. Licensee MDPI, Basel, Switzerland. This article is an open access article distributed under the terms and conditions of the Creative Commons Attribution (CC BY) license (https://creativecommons.org/licenses/by/4.0/).