Article

Variations in Impacts of Climate Change on Giant Lobelia Species in East Africa

1
State Key Laboratory of Plant Diversity and Specialty Crops, Wuhan Botanical Garden, Chinese Academy of Sciences, Wuhan 430074, China
2
Sino-Africa Joint Research Centre, Chinese Academy of Sciences, Wuhan 430074, China
3
University of Chinese Academy of Sciences, Beijing 100049, China
4
Faculty of Agriculture, Minya University, Minya 61511, Egypt
5
Botany and Microbiology Department, Faculty of Science, Helwan University, Cairo 11795, Egypt
*
Authors to whom correspondence should be addressed.
Diversity 2025, 17(4), 274; https://doi.org/10.3390/d17040274
Submission received: 5 March 2025 / Revised: 7 April 2025 / Accepted: 10 April 2025 / Published: 12 April 2025

Abstract

:
Climate change presents major challenges to global biodiversity and ecosystems. Related species distributed in the same region may exhibit differential response patterns to global climate change, resulting in divergent conservation strategies. East Africa is a critical hub for the diversity and distribution of giant Lobelia. In this study, we examined the potential distribution of seven giant Lobelia species (Lobelia aberdarica, L. telekii, L. gibberoa, L. bambuseti, L. deckenii, L. gregoriana, and L. rhynchopetalum) across six East African countries (Kenya, Ethiopia, Tanzania, Rwanda, Uganda, and Burundi) under projected climate change scenarios both RCP4.5 and RCP8.5. Species distribution models yielded high predictive accuracy (TSS > 0.8), with the mean temperature of the driest quarter (bio9) emerging as the most influential climatic variable determining future species distribution. The study found considerable variation in the species’ climatic niches, identifying distinct regions of climatically suitable habitats for each. Lobelia species at lower altitudes, such as L. giberroa and L. bambuseti, showed greater stability and expansion. In comparison, species at higher altitudes, such as L. telekii, L. deckenii, and L. rhynchopetalum, faced significant contraction in suitable habitats. These high-altitude species are particularly vulnerable and require urgent conservation interventions. This research highlights the importance of climate change considerations in the conservation of Lobelia species and provides a basis for developing targeted sustainable conservation.

1. Introduction

Climate change is impacting environmental conditions globally, influencing species’ survival and performance [1,2]. These changes are expected to affect demographic rates, ultimately altering biodiversity distribution [3]. Consequently, understanding the climatic niche of plant and animal species is crucial for predicting their responses to ongoing climate change. Due to the challenges of obtaining accurate species distribution data, for species that cannot be adequately surveyed, modeling approaches may offer a more reliable alternative [4,5]. Species distribution modeling (SDM) is one of the most reliable methods for predicting species distribution based on occurrences and environmental factors [6]. These models are important for understanding the ecological niches for different species, for both flora and fauna; they also assess the biodiversity patterns which helps in developing and planning conservation measures for the current and future climatic scenarios. They use correlative relationships between species occurrence or presence and abiotic factors, for example, elevation, precipitation, and temperature, to predict their possible distribution regions. The results obtained from these models are essential for forecasting how the species respond to climate change and environmental factors like habitat degradation [7,8].
The alpine environment is characterized by unique ecological conditions, including cold temperatures, high altitude, and specialized flora adapted to extreme climates [9]. As elevation increases, temperature generally decreases, leading to distinct climate zones and ecosystems. Climate change significantly impacts alpine environments, causing shifts in temperature, precipitation, and vegetation distribution, with elevation playing a crucial role in determining the extent of these effects [9,10,11]. Consequently, changes in alpine plant distribution may exhibit significant variation across species and geographic regions [12]. For instance, in the Himalayas, climatic, edaphic, and topographic factors have been identified as the key drivers of plant diversity and composition in high-altitude alpine regions. This illustrates how local environmental conditions influence the distribution of plant species [13]. Similarly, in the Rwenzori Mountains and Mount Elgon, elevation influences diversity patterns, with vascular plants declining and non-vascular plants dominating at higher altitudes [14]. Moreover, even closely related species may respond to climate change in different ways because of the ecological variations and intrinsic features that influence their survival in their habitat to tolerate climatic changes [15,16]. As a result, some species may expand their range, but others may contract and even become extinct [17]. Therefore, elucidating potential response variation among specific species to climate change proves crucial.
Giant lobelias (Lobeliaceae) in East African mountains are one of the keystone species in the tropical alpine ecosystem, containing outstanding adaptations to extreme temperature changes and sunlight [18], which are good models for studying alpine plant adaption [19]. A study has confirmed that the morphological features of giant lobelias, e.g., the leaf rosettes, provide insulation against extreme temperatures, making them more adaptable to the regions that indicate extraordinary evolutionary processes and ecological interactions [18,20]. There are approximately 20 species of giant lobelias distributed across the alpine zones of East Africa, with significant trait variations in size and growth form, leaf morphology, and thermal adaptations [19,21]. Moreover, they occupy different altitude levels or different mountains, with a few observed sympatric distributions in some areas [22]. Despite their ecological significance, very little information is available about the environmental variables that contribute to their distribution and how different species within the genus respond to climatic variations in their ecological habitats; although, in East Africa, SDMs have been widely used to predict the impact of climate change on regional biodiversity [23,24] and species distribution in both flora and fauna. For example, some studies have been conducted on rare endemic plants found in the region, e.g., for water lilies [25], genus Aloe [26], holoparasitic plants in Africa [27], and African armyworm [28]. However, few studies have tried to understand the distribution pattern of Lobelia in East Africa [29]. One study on L. kalmii predicted its suitable habitat [30], and another study on L. giberroa identified temperature and water vapor as key environmental factors limiting its disruption [31]. No comparative study has been conducted on the distribution pattern of giant Lobelia species occupying different habitats. Furthermore, there is no conservation outline, and strategies including SDM results have been put in place to guide the threatened species of Lobelia in East Africa.
To better understand the potential impacts of climate change on the distribution of giant Lobelia species in East Africa, we employed species distribution modeling (SDM) techniques. We apply five algorithms to assess the current and future distribution of giant lobelias in East Africa under different climate scenarios. The habitat changes in different species were compared, which will contribute to scientific conservation strategies.

2. Materials and Methods

2.1. Study Area and Model Species

East Africa is composed of high tropical mountains in different countries, which exhibit a distinctive array of environmental conditions: Kenya—Mount Kenya, Mount Elgon, and the Aberdare Range; Tanzania—Mount Meru and Mount Kilimanjaro; Uganda—the Ruwenzori Mountains; Ethiopia—the Bale Mountains and Simien Mountains; and Rwanda—Virunga Volcanoes. These conditions, characterized by altitudinal gradients, climatic variability, and diverse microhabitats, necessitate the development of specialized adaptive strategies by plant species to ensure survival and persistence in such dynamic ecosystems. Intense solar radiation during the day can directly affect exposed plant tissues and elevate surface temperatures, while freezing conditions may occur at night. The key characteristic of tropical alpine habitats is the absence of significant seasonal temperature variation [32]. Instead, temperature fluctuates dramatically on a daily basis, with warm days followed by very cold nights, where temperatures can drop well below 0 °C [33].
The giant lobelias are one of the plant species that are highly favored by the alpine zone of East Africa’s mountains. This study focused on seven giant Lobelia species: L. aberdarica R.E.Fr. & T.C.E.Fr., L. telekii Schweinf., L. giberroa Hemsl., L. bambuseti R.E.Fr. & T.C.E.Fr. L. deckenii (Asch.) Hemsl., L. gregoriana Baker f., and L. rhynchopetalum Hemsl., which are distributed across these six East African countries. The seven giant Lobelia species were selected for their ecological importance and adaptability to extreme environmental conditions in East Africa’s tropical alpine ecosystems. These species show significant trait variations and occupy different altitude levels, making them ideal for studying responses to climate change. Furthermore, these giant Lobelia species possess the most comprehensively documented distribution records across their respective biogeographic ranges [29].

2.2. Distribution and Environmental Data

The list of plant taxa and taxonomic information used in this study was based on the East Africa Flora and the National Museum of Kenya, East African Herbarium. Occurrence data for the giant Lobelia species were collected from the Global Biodiversity Information Facility (GBIF) (https://www.gbif.org/, accessed on 1 October 2023) for six countries: Ethiopia, Tanzania, Kenya, Rwanda, Burundi, and Uganda (Tables S1 and S3 and Figure 1). Additional occurrence data were personally collected from Mt. Kenya on 3 August 2023. A total of 1852 occurrence points of the seven Lobelia species were obtained. The data were verified manually after compilation regions that had no occurrence points were removed in R to remove the Nas. Finally, we projected the occurrence points to see the distribution on the map. Coordinates, regions projected to water bodies, and those where species are unlikely to be found were discarded. A total of 1852 occurrence points of the seven Lobelia species were obtained after removing NAs. After that, we removed duplicates for each species’ data, and 21 points of L. aberdarica, 63 points of L. bambuseti, 111 points of L. deckenii, 148 points of L. giberroa, 67 points of L. telekii, 93 points of L. rhynchopetalum, and 54 points of L. gregoriana remained. In total, 522 occurrence points were used for modeling our species after ensuring that all the coordinates were above the 10 minimum required points for species modeling. Most of the occurrence points were recorded from the years 1974–2009. To ensure our model was able to predict well the exact extent of species distribution where they are likely and unlikely to be found, we incorporated the presence data and 1000 pseudo-absence data points (background data) [34] utilizing ‘raster ‘and ‘dismo’ package in the R environment. The number of pseudo-absence points is due to the data size of this research, which shows few points of species restricted to specific regions.

2.3. Environmental Variables

We downloaded the 19 bioclimatic variables WorldClim version 2.1 (1970–2000) as the historical climate data [35] at a spatial resolution of 30 arc-seconds. The Aridity and Potential Evapotranspiration data were sourced from the CGIAR-CSI Global Aridity and PET Database [36]. Land cover data were retrieved from the Data User Element (DUE) platform [37] (Table S2). We used ArcGIS to determine the extent of our study area before we utilized all the merged environmental and bioclimatic variables. Furthermore, prior to the selection of variables favoring the species distribution, land cover was considered as a categorical factor and not as a continuous variable in the R environment. To avoid model overfitting, we performed multicollinearity analysis using the occurrence records to extract values from all the environmental layers. This analysis was conducted with the ‘usdm’ package [38] to apply the variance inflation factor (VIF) and exclude highly correlated variables with a VIF greater than 9 and a correlation threshold of 0.8. This led to the selection of 12 important variables that are likely to impact the Lobelia species distributions: water vapor (vapr), solar radiation (srad), land cover (lc), mean temperature of driest quarter (bio9), Mean Diurnal Range (mean of monthly (max temp − min temp)) (bio2), Isothermality (bio3), Temperature Seasonality (bio4), Precipitation of Wettest Month (bio13), Precipitation of Driest Month (bio14), Precipitation Seasonality (bio15), Precipitation of Warmest Quarter (bio18), and Precipitation of Coldest Quarter (bio19) (Table 1). These variables were used for the subsequent analysis.
To obtain the topographic index from MERIT DEM, we utilized the ‘terrain’ function using the ‘‘raster’’ package version 4.3.1 in the R environment [39,40] which served as a representation of ecological variability. As aforementioned, all the variables were resampled to a resolution of 0.5 km × 0.5 km representing 30 s resolution, which is important for assessing extinction risk and calculating species’ area of occupancy (AOO). AOO is the most appropriate method to estimate potential habitat suitability. Moreover, AOO is a commonly applied method for species with limited geographic ranges, such as some giant Lobelia species, where detailed environmental data and more complex modeling approaches may not be feasible. Furthermore, the International Union for Conservation (IUCN) recommends it because it attains suitable stability between accuracy and appropriateness [41]. For the future climatic variables, two representative concentration pathway scenarios (RCPs), RCP4.5 and RCP8.5, were considered for two periods: 2050 (average for 2041–2060) and 2070 (average for 2061–2080). The Coupled Model Intercomparison Project 5 (CMIP5) was used to make predictions. The Australian Community Climate and Earth System Simulator version 1, (ACCESS) a method for prescribing the land surface temperatures within a global climate model (GCM), was selected for future climate conditions [42]. We integrated our data to CMIP5 for future projections, which is specifically bias-corrected to the WorldClim 1970–2000 baseline. All the data obtained were further separated using SDMTools in ArcGIS 10.8.2 to obtain the 19 bioclimatic variables. Then, we selected the 12 important variables to predict the future scenario of the seven Lobelia species. All the environmental layers of climate and roughness index were cropped to the shapefile of East Africa using ArcGIS 10.8.2. Then, all the raster layers were resampled into the required or recommended spatial resolution (0.5 km × 0.5 km).

2.4. Species Distribution Modeling and Evaluation

We used the ‘sdm’ package in R 4.2.0 [43] to perform the ensemble modeling of the seven species distribution models (SDMs): generalized linear model (glm), Boosting Regression Trees (brt), and random forest (rf), Maximum Likelihood (Maxlike), and Recursive Partitioning and Regression Trees (rpart) [44]. Model-specific parameters were tuned to optimize habitat suitability predictions for giant Lobelia: for glm, we specified a binomial family with a logit link function for presence/absence data; for brt, we set the learning rate to 0.01, tree depth to 6, and used 1000 trees; for rf, we set the number of trees to 500, max depth to 12, and minimum samples per leaf to 5; for maxlike, we used a Bernoulli distribution for binary presence/absence data; and for rpart, we set the maximum tree depth to 8 and the minimum samples per leaf to 5 [34]. To weigh the performance of the ensemble models, we utilized True Skill Statistics (TSS). However, the receiver operating characteristic curve (AUC) was implemented in this study to evaluate the accuracy of the model. AUC values range from 0 to 1, with values between 0.5 and 0.7 indicating poor model performance, 0.7 to 0.9 reflecting good performance, and values greater than 0.9 signifying excellent performance [45]. Likewise, the TSS measure ranges from −1 to +1, where values below 0.40 suggest poor performance, between 0.40 and 0.75 indicate good performance, and values above 0.75 demonstrate excellent performance [46]. These metrics are commonly used for model calibration and to determine key model requirements in various studies [47,48], providing valuable insights. Each modeling technique was repeated four times using 70% of the data for training and 30% for testing. In this analysis, areas predicted to have high potential suitability were considered those with a threshold above 0.8 (>0.8), while areas with low suitability were defined by a threshold of (≤0.5) as shown in Table 1. All the maps were converted to binary for the current and future using SDM tools in ArcGIS 10.8.2 considering the sensitivity plus specificity thresholds. This was performed to ensure that we obtain future changes. We utilized a threshold of 10% training presence which has been reported to be the most accurate and conservative for characterizing the unsuitable and suitable areas for species [49]. The obtained binary maps were used to account for range changes where the two RCPs were subtracted from the binary baseline maps for us to obtain the changes for the future and the present in terms of gain, stability, and loss.

2.5. Conservation Status in the Changing Climatic Scenarios

According to the IUCN recommendations, it is very important when determining species distribution change scenarios under climate change to consider merging them with the IUCN criteria for species conservation according to the area of occupancy to evaluate extinction risks [41]. To ensure that our study does not overlook this situation, we applied the suggested recommendations in our projections, whereby the percentage loss in AOO for the changes was calculated in both RCP4.5 and RCP8.5 for the estimated years using the criteria as follows: species with loss of above 30%—loss, above than 50%—endangered, above than 80%—critically endangered, and 90–100%—extinct [50].

3. Results

3.1. The Distribution Pattern of Giant Lobelia

The geographic distribution of seven giant Lobelia species across East Africa, derived from data obtained from the Global Biodiversity Information Facility (GBIF), exhibits spatial heterogeneity and varying degrees of discontinuity. Four of the seven species predominantly occupy alpine habitats at high altitudes (above 3300 m). Lobelia telekii, found in the Afro-alpine zone of Mount Kenya, has an altitudinal range spanning from 3400 m to 4640 m, making it the highest-elevating species of giant Lobelia in Africa. L. rhynchopetalum is predominantly located in the Afro-alpine regions of the Bale and Simien Mountains, occurring between 3600 m and 4500 m, where it serves as a notable tourist attraction. L. deckenii is distributed across the Afro-alpine belt, extending from the lower reaches of the ericaceous zone to the lower boundary of the upper alpine zone, with an altitudinal range of 3300 m to 4380 m. L. gregoriana is confined primarily to the upper alpine zone, with a distribution range between 3200 m and 4500 m. In contrast, the remaining three species prefer low-altitude environments (below 3300 m). L. aberdarica is commonly found in moorlands, highland areas near streams, marshy regions, mountain bogs, and montane forest edges, with an altitudinal range from 2360 m to 3300 m. L. gibberoa and L. bambuseti are both present within the montane forest belt, with their altitudinal distributions ranging from 1200 m to 3050 m and from 1800 m to 3300 m, respectively (Figure 1).

3.2. Model Performance of Giant Lobelia

The species distribution models for each species (L. giberroa, L. bambuseti, L. aberdarica, L. deckenii, L. gregoriana, L. rhynchopetalum, and L. telekii) are presented across five modeling approaches: glm, brt, maxlike, rf, and rpart. The habitat suitability predictions for the seven species show variability across models. L. giberroa has high suitability in the northern region, with maxlike and brt predicting the largest areas. L. bambuseti is most suitable in the central and southern regions according to maxlike and brt. L. aberdarica shows extensive suitability with maxlike and rf, while glm and rpart predict more restricted habitats. L. deckenii has high suitability in the center, but the south is unsuitable across all the models. L. gregoriana shows widespread suitability in the northeast, while glm and brt show moderate suitability in other areas. L. rhynchopetalum has high suitability in the central and eastern regions, with more fragmented areas in rpart. L. telekii shows consistent suitability in the center, with a decrease in the south (Figure 2).
The results obtained for both the AUC and TSS for all the SDM methods indicated high predictive accuracy (Figure S1). The resulting mean AUC values of almost all the models were between 0.91 and 1, indicating an excellent prediction of the current distribution of giant Lobelia in the alpine zone. The model performance was evaluated by AUC. On the other hand, the mean value of TSS ranged from 0.80 to 0.99, except for two species L. giberroa and L. deckenii which obtained a poor TSS score with 0.76 (rpart) and 0.78 (maxlike), respectively. glm and rf achieved the highest performance out of all five algorithms based on mean AUC and TSS values, while maxlike had the poorest performance in TSS value. The total number of species with model performances is classified as excellent from their AUC values. There is a highly significant correlation between AUC and TSS across methods (Table 2).

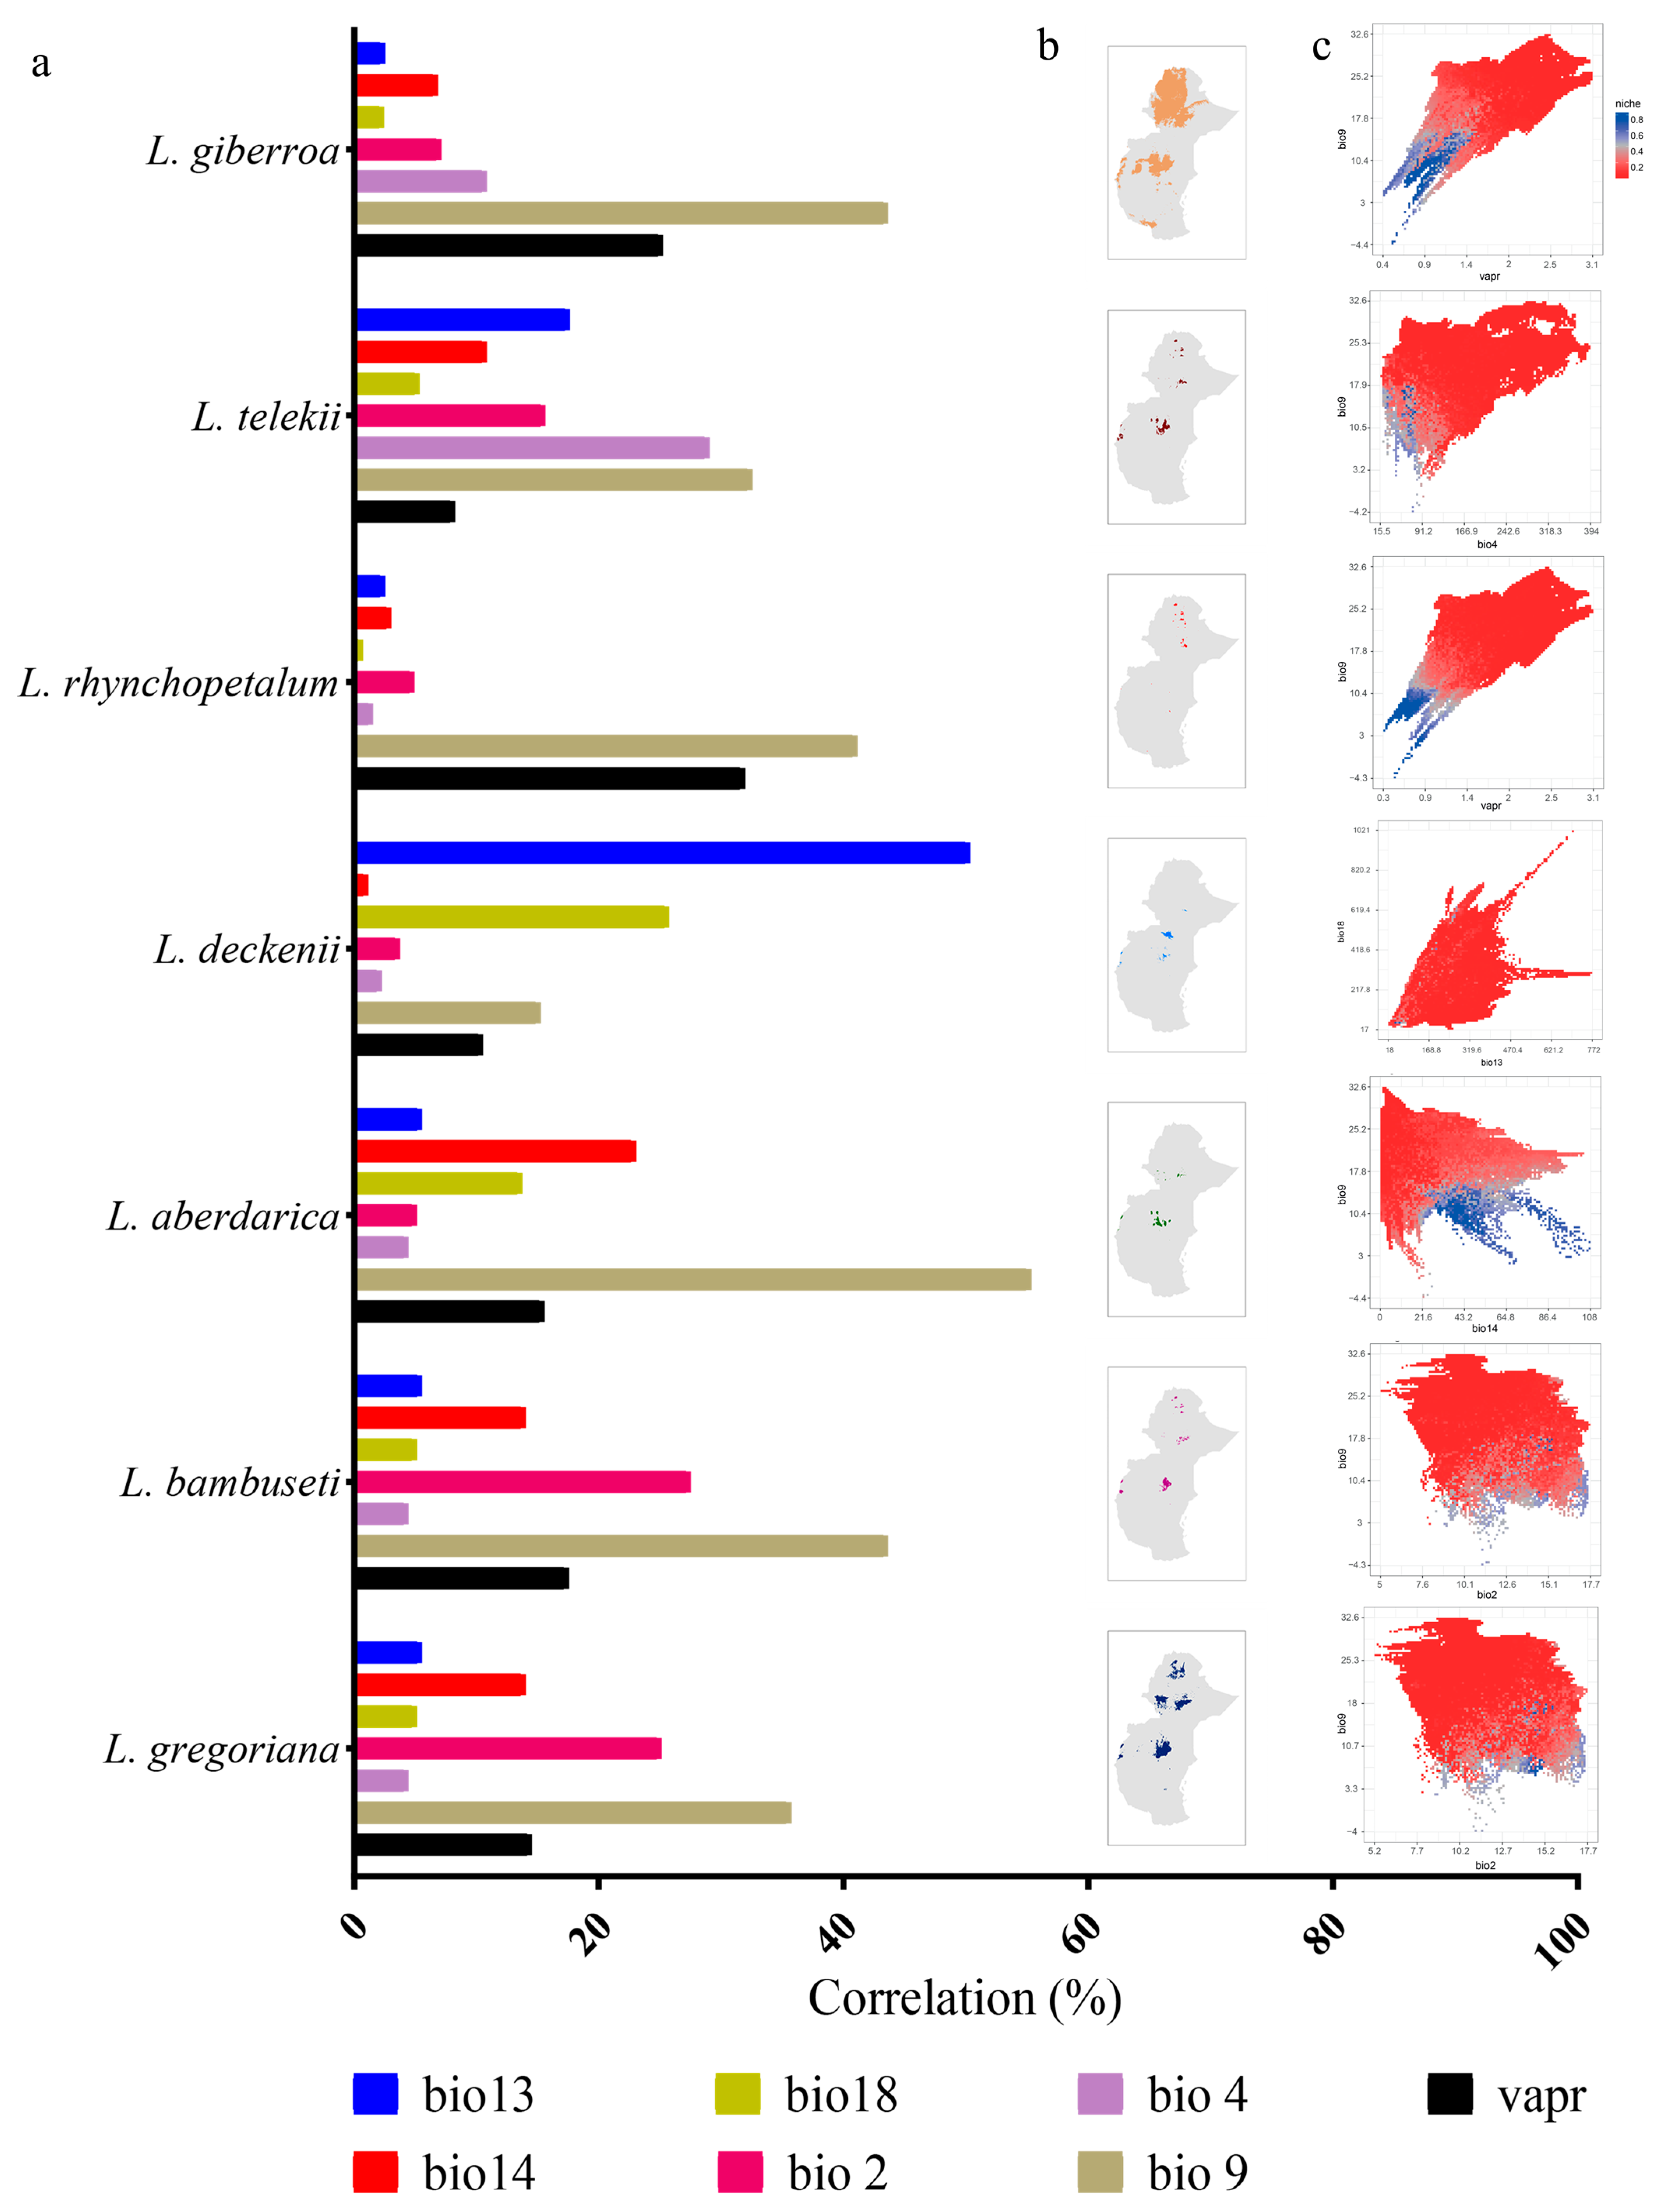
3.3. Contribution of Bioclimatic Variables

The distribution of lobelias in East Africa is highly influenced by the 12 selected environmental and bioclimatic factors (Table 1). However, the selected variables influence the Lobelia species distribution in this region differently due to their habitat locality, which is shaded by the geospatial occurrence and the different ecoregions they occupy. As a result, each individual species responded differently to each variable, resulting in the different contribution of each variable to the individual species (Figure 3a). The most important factors determining the potential distribution of L. giberroa and L. rhynchopetalum were found to be bio9 and vapr, with contributions 43.60% and 25.20% for L. giberroa, and 41.10% and 31.90% for L. rhynchopetalum, respectively. The significance of these variables is likely due to the large leaf surface area of these species, which makes them particularly sensitive to temperature and humidity conditions. The most important factors determining the potential distribution of L. bambuseti and L. gregoriana were found to be bio9 and bio2, with contributions of 43.60% and 27.50% for L. bambuseti, and 35.70% and 25.10% for L. gregoriana, respectively.
The most important variables limiting the L. aberdarica distribution were bio9, with contributions of 55.30%, and bio14, with contributions of 23%. The most important variables limiting the L. deckenii distribution were bio13, with contributions of 50.30%, and bio18, with contributions of 25.70%. For L. telekii, it was bio9 with contributions of 32.50, and bio4 with contributions of 29% limiting the distribution of L. telekii. In summary, bio9 was identified as the most significant variable limiting the distribution of most Lobelia species, except for L. deckenii (Figure 3c and Figure S2).

3.4. The Current Suitable Habitat

Our current model projection shows that the Upland Forest edges, bamboo zone, and Upland swamp are highly favorable suitable habitats for Lobelia species in East Africa, while Wet moorland and Alpine zone are less favored by most species. Furthermore, the projections show that there is likely suitable habitat for the Lobelia species along the coastline. Species distributed in low to mid-elevation ranges were L. giberroa and L. bambuseti (1200 m to 3300 m), while species found in higher-elevation ranges were L. aberdarica, L. telekii, L. deckenii, L. gregoriana, and L. rhynchopetalum (3200 m to 4640 m). Great habitat suitability was projected for L. giberroa and L. bambuseti, while L. telekii, L. deckenii, and L. rhynchopetalum are restricted to some hilltops with high altitudes (Figure 3b and Figure S3).

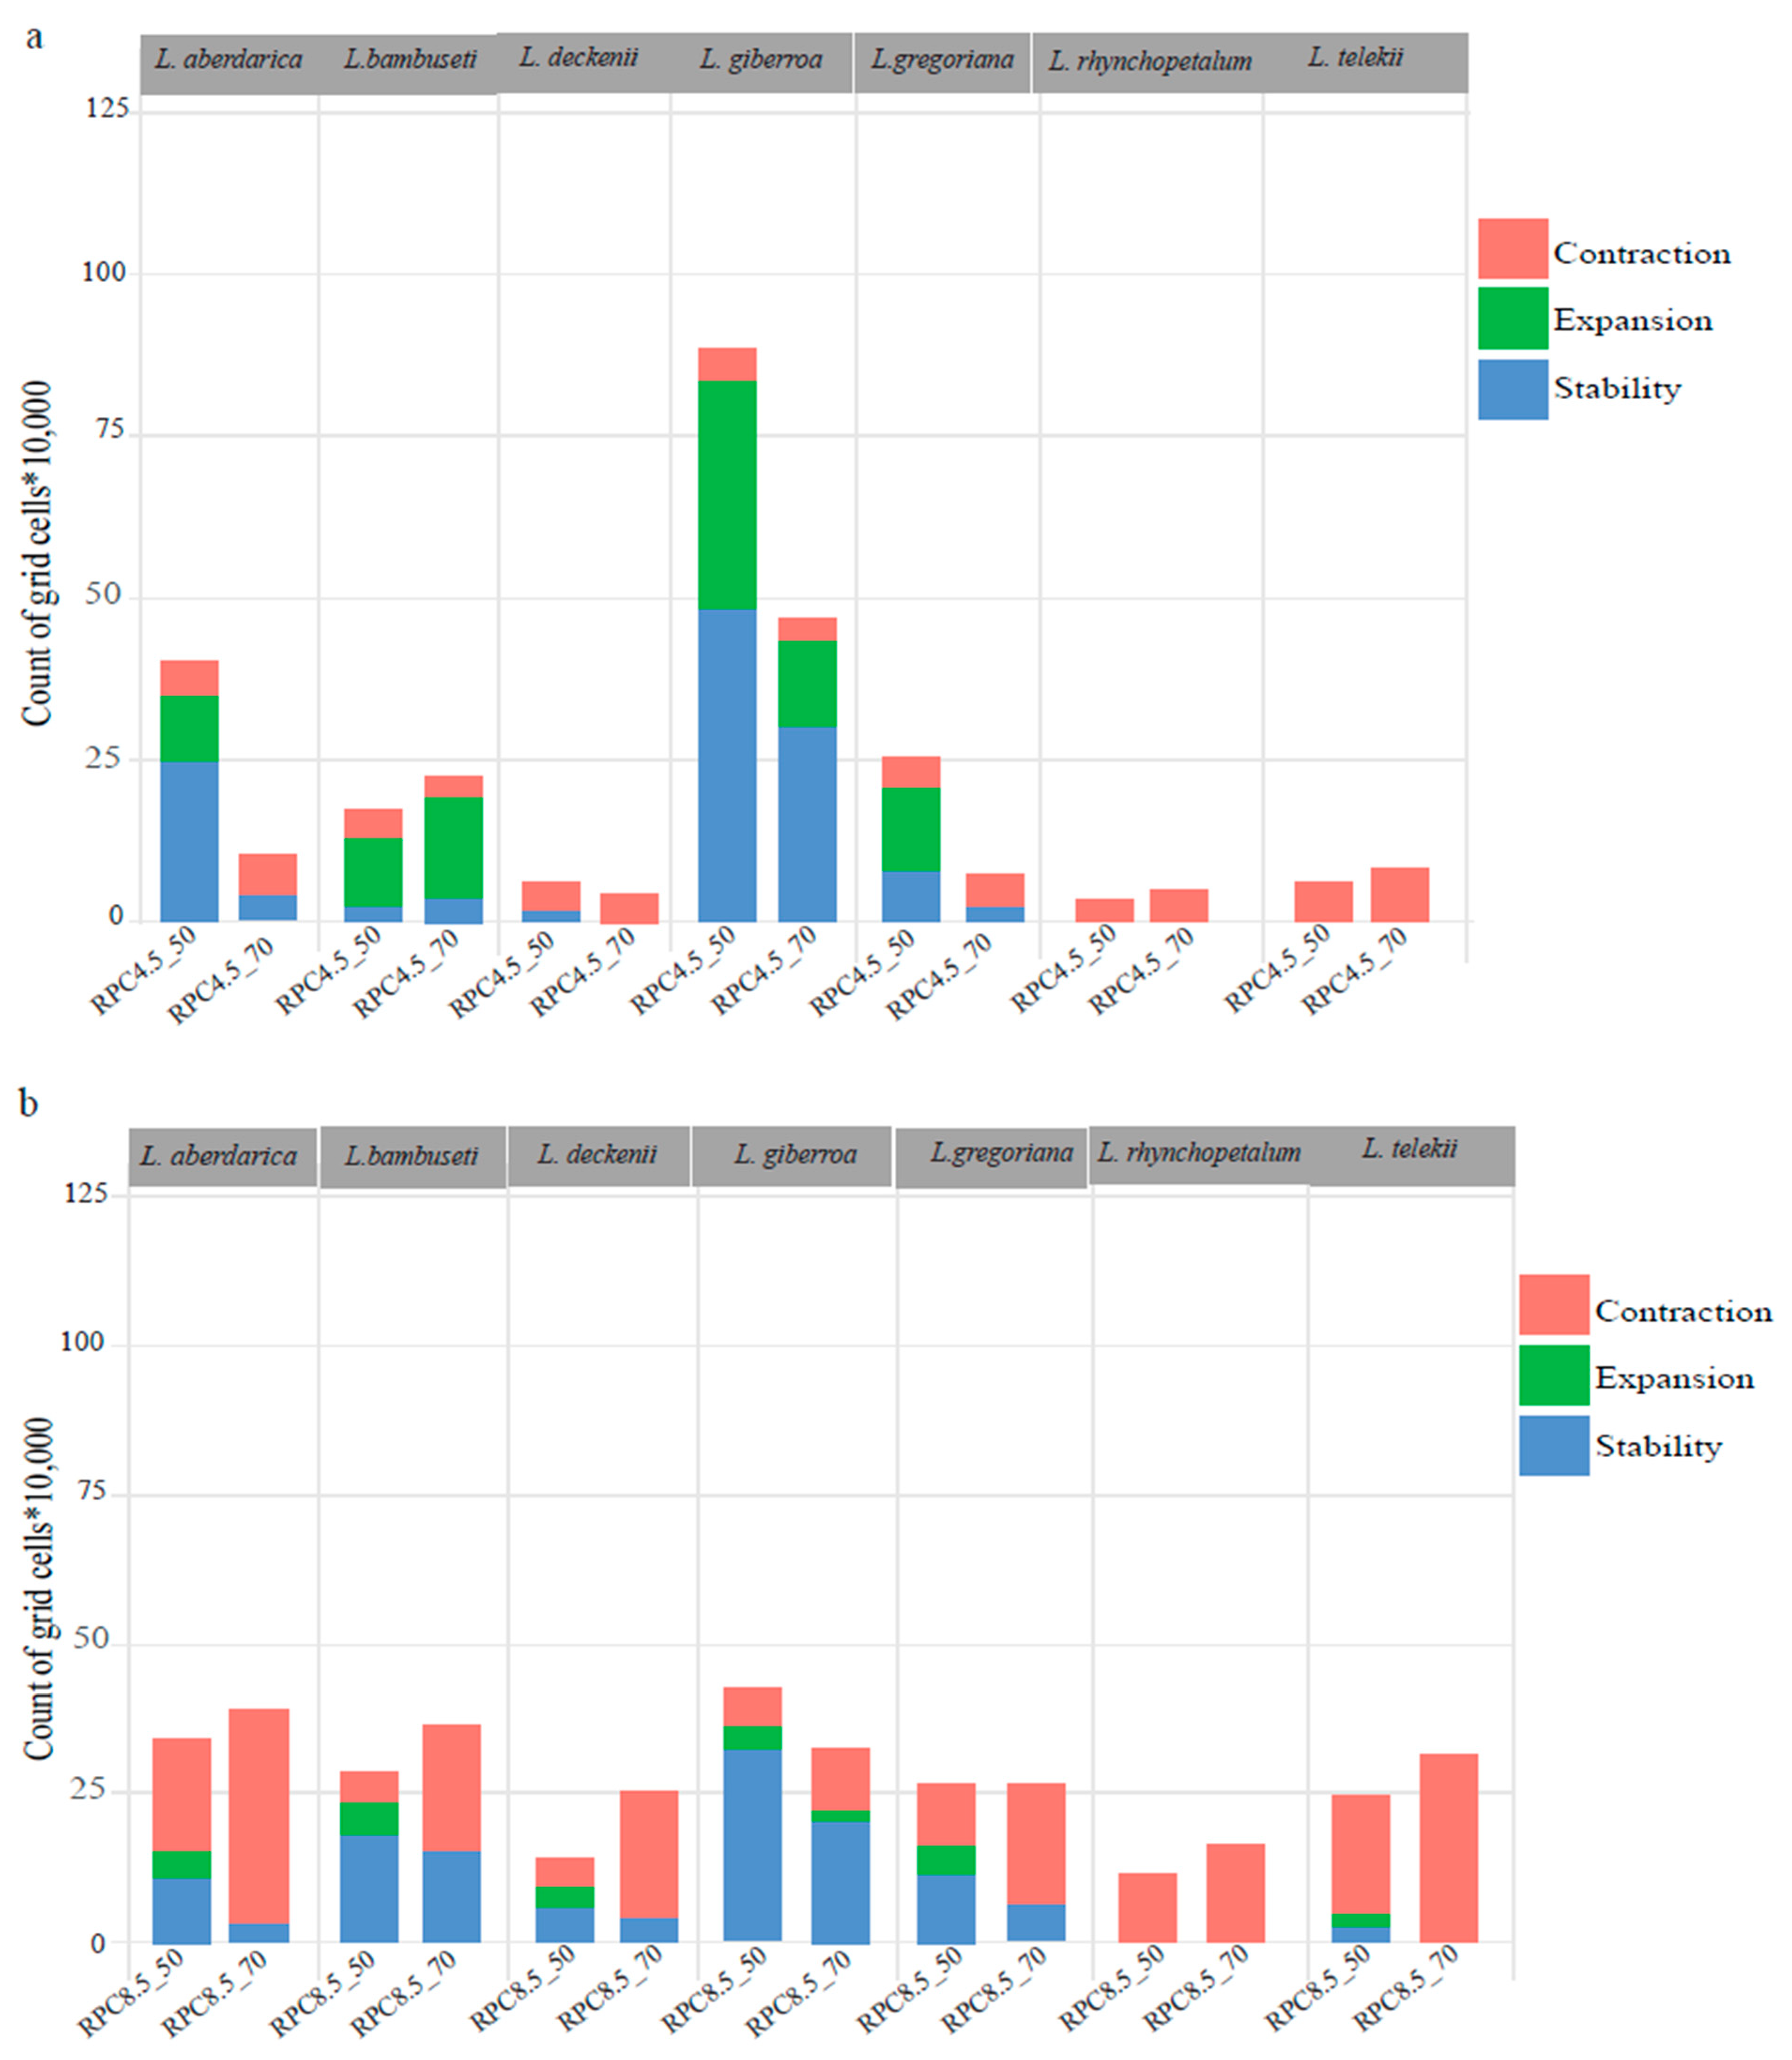
3.5. The Dynamics of Future Distribution

The changes in suitable habitat range for the giant Lobelia species varied from species to species. Habitat expansions were projected for L. giberroa and L. bambuseti, but the other five species will face a great reduction in suitable habitat ranges after the global land cover map adjustment to exclude inaccessible regions. We have presented the projected changes in temperature, precipitation, and other climatic variables for 2050 and 2070 under both the RCP-4.5 and RCP-8.5 scenarios (Figures S3 and S4). The results observed high distribution expansion and a significant increase in high stability areas for L. giberroa in both future scenarios RCP-4.5 and RCP-8.5 with 37.6% and 14.6%, respectively. Similarly, L. bambuseti observed a high distribution expansion and a significant increase in high stability areas in both the RCP-4.5 and RCP-8.5 scenarios with 56.7% and 71.5%, respectively. Interestingly, L. gregoriana has a high distribution expansion under RCP-4.5 with 42%; however, under the RCP-8.5 scenario, it shows a very low population expansion of 2.7%. The high-altitude species such as L. aberdarica, L. telekii, L. deckenii, and L. rhynchopetalum show the highest contraction in the future scenarios with no expansion in the second scenario RCP-8.5. The contraction percentage of L. aberdarica under RCP-4.5 and RCP-8.5 was 26.6% and 82.9%, respectively. Similarly, L. deckenii shows high contraction under the scenario RCP-8.5 (91.6%). L. telekii and L. rhynchopetalum show no expansion under both scenarios with the highest percentage of contraction > 95% (Figure 4, Figures S4 and S5).

4. Discussion

4.1. Models Performance

Based on our findings, we conclude that the species distribution models (SDMs) employed are effective tools for identifying suitable habitats for Lobelia species with limited ranges in East Africa. However, the performance of these models varied across the species. The models revealed distinct patterns of habitat suitability predictions for each species, with variability observed across the five approaches (glm, brt, maxlike, rf, and rpart). The models demonstrated high predictive accuracy, with the AUC values ranging from 0.91 to 1 and TSS values from 0.80 to 0.99. There is a highly significant correlation between AUC and TSS across the methods (Table 2), suggesting that both metrics provide complementary insights into model performance. The glm performed the best overall, while L. giberroa and L. deckenii showed lower TSS scores, particularly with maxlike, likely due to their more complex habitat requirements and ecological traits. For rf, the AUC was equal to 1, which indicates a scenario of overfitting, because the data we used was too small for such a complex model. This variability in model performance suggests that simpler models like maxlike and more complex methods like rf may not perform equally well if the input data are not enough, especially for restricted plant species for which information is rarely available. This highlights the complexity of predicting suitable habitats, emphasizing the need for tailored modeling approaches based on the ecological traits of each species [51,52]. Based on these results, glm, brt, maxlike, and rpart are recommended as the most reliable models for future studies of giant Lobelia species. On the other hand, maxlike may require further optimization, particularly for species with complex habitat requirements.
Recent studies have highlighted that SDMs are reliable tools for predicting the geographic ranges of rare species, even under potential climate change impacts [53,54]. However, the effectiveness of these models depends heavily on data quality [50,55]. Particularly, the inclusion of factors like human activity and species interactions are often unavailable in most regions. To enhance model precision, we incorporated a broader set of environmental variables beyond the standard bioclimatic factors.

4.2. Giant Lobelia Distribution Change and Environmental Variables

Species located in the tropical alpine ecosystems mostly above the trees are highly isolated and specialized to adapt to those regions, but they are always very sensitive to climate change [9,32,33]. Climate modeling of tree distribution suggests that future global climate change will have substantial impacts on forest ecosystems [56]. East Africa is a key center for the distribution and diversity of giant Lobelia. However, giant Lobelia habitats in the region are facing significant fragmentation and loss, posing a major threat to biodiversity. Evolutionary history has played a crucial role in shaping the local adaptation and trait variation in these species, leading to distinct current distribution patterns and influencing future distribution dynamics. The evolutionary history of giant lobelias has led to local adaptation and trait variation, which in turn has influenced their current distribution patterns and future distribution dynamics [18]. Over time, these species have adapted to specific environmental conditions, resulting in distinct genetic and phenotypic traits. These adaptations have allowed giant lobelias to thrive in particular habitats, shaping their current distribution. For example, the adaptive strategies of Afro-alpine flora, including L. telekii and L. deckenii, have been extensively studied. These rosette plants exhibit specialized morphological traits that provide effective temperature insulation. During the day, their leaves unfold to facilitate photosynthesis, while at night, they tightly close, forming a compact, cabbage-like head that helps maintain temperatures above freezing [19]. Such adaptive features are absent in species found in mountain forests, such as L. giberroa. In terms of life-form and general morphology, the giant rosette plant L. giberroa has a larger leaf area compared to its Afro-alpine counterparts. This suggests that L. giberroa likely requires a higher water supply, with eco-physiological traits playing a significant role in the niche occupation of giant rosette species within the Lobelia valleys, such as L. giberroa [31]. Our findings support this hypothesis, highlighting that temperature and water vapor availability are key factors limiting the distribution of L. giberroa. Moreover, ongoing habitat changes, such as climate change and human activities, may disrupt these established patterns, potentially affecting their future distribution and survival [19]. The divergent responses of low- and high-altitude lobelias to climate change are shaped by their distinct ecological niches and physiological adaptations. Low-altitude species, such as L. giberroa, thrive in warmer, more stable environments with higher humidity and water availability. These species benefit from rising global temperatures, which extend growing seasons and reduce frost events, facilitating their expansion to higher elevations or latitudes. Increased atmospheric CO₂ further enhances photosynthetic efficiency and growth, promoting their spread into new habitats, especially in areas with stable or increased precipitation [31]. In contrast, high-altitude species like L. telekii and L. deckenii are adapted to cold, alpine environments with intense UV radiation, low nutrients, and short growing seasons. Climate change threatens these species by shrinking their suitable habitats, forcing them to migrate upward, a shift limited by the narrowness of mountain peaks. Their rosette structures, which provide thermal insulation, may become less effective under warmer conditions, while altered precipitation patterns disrupt their water balance, further endangering their survival in arid alpine zones [18,19].
Tropical alpine and montane ecosystems, along with their rich biodiversity, are vulnerable to climate change-induced warming [9,32]. The findings of this study’s bioclimatic factors analysis revealed that the mean temperature of the driest quarter (bio9) was the most important variable indicating the potential geographic distribution of giant Lobelia. Temperature is considered the most significant environmental variable that influences the distribution of giant Lobelia in EA [18,19,29]. These giant plants have large leaf rosettes which fold up during the night to protect the buds, and they retain old leaves for insulation, accumulate large amounts of water to counteract temperature shocks, and grow taller with increasing altitude to escape the low temperatures close to the ground [57,58,59]. Current projections suggest that temperature regimes in the Afro-alpine mountains may shift upward by 140 to 800 m [32]. A 1.0 °C rise in mean annual temperature corresponds to an altitude shift of approximately 167 m or a latitudinal shift of around 145 km (based on a temperature lapse rate of −6.0 °C per km altitude and −6.9 °C per 1000 km latitude) [33,60]. This also explains why the distribution ranges of some giant Lobelia species are restricted to high-altitude summit regions.

4.3. Extinction Risks of Giant Lobelia Species

In general, climate change significantly affects biodiversity, species distributions, and ecosystem services globally [61,62]. Currently, if the international policy target of reducing post-industrial temperature increase to 2.0 °C (RCP-4.5) is reached, the risk of world-wide extinction is expected to rise from 2.8% in the present to 5.2% in the future. The projected Lobelia expansion in the future to the Afro-alpine habitat in response to climate change is of particular concern. Under both future climate change scenarios (RCP-4.5 and RCP-8.5), Lobelia species are going to reduce in number and also face local extinctions, particularly for the five species that are inhibiting the high-altitude areas. A previous study in the Bale Mountains approximated that a 2.0 °C increase in temperature could lead to an 8.7% local extinction of all endemic species, while a rise in temperature from 3.0 °C to 4.0 °C (under RCP-8.5) will lead to about 36% (of 41 endemic species) of the local endemic species becoming extinct. Some of the plants reported to be threatened with extinction include Senecio inornatus Dc, Geranium arabicum Forssk. Supspp., Carex simensis Hochst. Ex A. Rich., Sedum mooneyi M.G. Gilbert, and Lobelia rhynchoprtalum Hemsl. [63].
Understanding the possible impact of climate change on the species distribution in the future is very important. The current suitable habitat is essential for determining the survival and persistence of these species as they adapt to new ranges or environments [64]. The IUCN Red List of Threatened Species serves as a critical tool for evaluating the global extinction risk of species across taxa. Currently, species such as L. giberroa, L. bambuseti, L. deckenii, L. gregoriana, L. rhynchopetalum, and L. telekii remain not evaluated, signifying a substantial gap in the assessment of their conservation status. In contrast, L. aberdarica is categorized as ‘Least Concern’, indicating that it does not face immediate extinction risk [41]. The projected changes in suitable habitat ranges for the giant Lobelia species vary significantly across species due to differing climatic requirements and vulnerabilities to climate change. Species like L. giberroa and L. bambuseti are expected to benefit from habitat expansion, with increases in both distribution and high stability areas under future climate scenarios (RCP-4.5 and 8.5). In contrast, species adapted to high-altitude habitats, such as L. aberdarica, L. telekii, L. deckenii, and L. rhynchopetalum, are projected to experience severe contractions in their suitable habitats, with some facing losses greater than 90% under the extreme RCP-8.5 scenario. These trends reflect the species’ different adaptability to climate change, with lower-altitude species having the potential to expand their ranges, while high-altitude species face significant habitat loss. Regional hotspots like Kenya, Tanzania, Ethiopia, Rwanda, Uganda, and Burundi will remain important for conservation. Based on the projected loss of AOOs under future climate scenarios, high-altitude species including L. telekii, L. deckenii, and L. rhynchopetalum, are suggested to be classified as critically endangered under the criteria A1c of the IUCN Red List. This underscores the urgent need for targeted conservation efforts to protect these species, particularly in high-altitude areas where their habitats are rapidly diminishing. Such revisions of the IUCN Red List will allow for a more precise understanding of their conservation status and will inform evidence-based management strategies to mitigate threats and enhance species survival.

4.4. Limitations of the Study

While our study provides valuable insights into the potential impacts of climate change on the distribution of giant lobelias, there remain several limitations. Initially, the study focused on only seven species, which may not fully represent the diversity of species within the genus. Expanding the study to include additional species would provide a more comprehensive understanding of the genus’ response to climate change. Secondly, AOO is the most suitable method for estimating habitat suitability in species with restricted ranges, such as certain giant Lobelia species, where detailed environmental data and complex models may not be feasible. However, while AOO is widely used, it may not fully capture species’ habitat complexity, introducing some uncertainty in predicting future distributions. Finally, the study used CMIP5 because it is a future projection specifically bias-corrected to the WorldClim 1970–2000 baseline. However, projections with enhanced models, better resolution, new experiments, and a more integrated approach for addressing societal impacts of climate change, such as CMIP6, would contribute to more accurate predictions.

5. Conclusions

Long-term climate shifts can influence where species’ habitats are located. The results of our study indicate that the distribution of giant Lobelia species in East Africa may experience contraction, expansion, and shift due to climate change, which can significantly impact their populations. Consequently, it is imperative to develop a comprehensive conservation action plan that addresses the underlying causes of habitat loss to ensure the long-term persistence of these species. The findings of this research can contribute to the development of broader biodiversity conservation strategies and management measures, potentially leading to the formulation of novel approaches. These strategies aim to preserve species diversity within natural ecosystems and enhance their adaptability to changing climate conditions. The spatial maps generated in this study can assist in identifying high-risk areas, thereby facilitating the prioritization of conservation efforts in these regions. Additionally, the information obtained will be instrumental in future monitoring and survey activities and in shaping the design of effective conservation strategies and management plans. Finally, these conservation actions should be complemented by increased public awareness and the implementation of policy interventions to mitigate the impacts of anthropogenic activities.

Supplementary Materials

The following supporting information can be downloaded at: https://www.mdpi.com/article/10.3390/d17040274/s1: Table S1: The occurrence data of the seven giant Lobelia species across six East African countries; Table S2: Predictor variables influencing the potential distribution of seven giant Lobelia species; Table S3: Species information with year range of observation in the reference; Figure S1: Evaluation of algorithm performance based on mean Area Under the Curve (AUC) and True Skill Statistics (TSS); Figure S2: The ecological niche of bioclimatic predictors in explaining seven giant Lobelia’s potential distribution; Figure S3: The current distribution of the seven giant Lobelia species in East Africa; Figure S4: Change in habitat suitability for the future projection of giant Lobelia species in East Africa under RPC 4.5 scenario; Figure S5: Change in habitat suitability for the future projection of giant Lobelia species in East Africa under RPC8.5 scenario.

Author Contributions

T.W. and J.-N.W. designed the research; R.S. and J.-N.W. performed the analysis; R.S. analyzed the data and wrote the first draft; R.S., M.E., M.A.D. and E.M.M. performed the visualization; and T.W. and J.-N.W. revised the manuscript. All authors have read and agreed to the published version of the manuscript.

Funding

The project was supported by the Scientific Research Program of the Sino-Africa Joint Research Center (SAJC202101) and the Hubei Provincial Natural Science Foundation of China (2023AFA055).

Institutional Review Board Statement

Not applicable.

Data Availability Statement

The data presented in this study are available upon request from the corresponding author.

Acknowledgments

The authors are thankful to the China–Africa Center for Research and Education and the Chinese Academy of Sciences for their help and support.

Conflicts of Interest

The authors declare that they have no conflicts of interest.

References

  1. Lloyd, A.H.; Bunn, A.G. Responses of the circumpolar boreal forest to 20th century climate variability. Environ. Res. Lett. 2007, 2, 045013. [Google Scholar] [CrossRef]
  2. Sinervo, B.; Méndez-De-La-Cruz, F.; Miles, D.B.; Heulin, B.; Bastiaans, E.; Villagrán-Santa Cruz, M.; Lara-Resendiz, R.; Martínez-Méndez, N.; Calderón-Espinosa, M.L.; Meza-Lázaro, R.N.; et al. Erosion of lizard diversity by climate change and altered thermal niches. Science 2010, 328, 894–899. [Google Scholar] [CrossRef] [PubMed]
  3. Chen, I.C.; Hill, J.K.; Ohlemüller, R.; Roy, D.B.; Thomas, C.D. Rapid range shifts of species associated with high levels of climate warming. Science 2011, 333, 1024–1026. [Google Scholar] [CrossRef]
  4. Elith, J.; Leathwick, J.R. Species distribution models: Ecological explanation and prediction across space and time. Annu. Rev. Ecol. Evol. Syst. 2009, 40, 677–697. [Google Scholar] [CrossRef]
  5. Abdelaal, M.; Fois, M.; Fenu, G.; Bacchetta, G. Using MaxEnt modeling to predict the potential distribution of the endemic plant Rosa arabica Crép. in Egypt. Ecol. Inform. 2019, 50, 68–75. [Google Scholar] [CrossRef]
  6. Li, R.; Xu, M.; Wong, M.H.G.; Qiu, S.; Sheng, Q.; Li, X.; Song, Z. Climate change-induced decline in bamboo habitats and species diversity: Implications for giant panda conservation. Divers. Distrib. 2015, 21, 379–391. [Google Scholar] [CrossRef]
  7. Booth, T.H.; Nix, H.A.; Busby, J.R.; Hutchinson, M.F. BIOCLIM: The first species distribution modelling package, its early applications and relevance to most current MAXENT studies. Divers. Distrib. 2014, 20, 1–9. [Google Scholar] [CrossRef]
  8. Guisan, A.; Thuiller, W.; Zimmermann, N.E. Habitat Suitability and Distribution Models: With Applications in R; Cambridge University Press: Cambridge, UK, 2017. [Google Scholar]
  9. Grabherr, G.; Gottfried, M.; Pauli, H. Climate change impacts in alpine environments. Geogr. Compass 2010, 4, 1133–1153. [Google Scholar] [CrossRef]
  10. Hussein, M.A. Climate Change Impacts on East Africa. Econ. Soc. Political Elem. Clim. Change 2010, 1, 589–601. [Google Scholar]
  11. Fort, M. Impact of Climate Change on Mountain Environment Dynamics. An Introduction. J. Alp. Res.|Rev. Géographie Alp. 2015, 103-2. [Google Scholar] [CrossRef]
  12. Testolin, R.; Attorre, F.; Borchardt, P.; Brand, R.F.; Bruelheide, H.; Chytrý, M.; De Sanctis, M.; Dolezal, J.; Finckh, M.; Haider, S.; et al. Global Patterns and Drivers of Alpine Plant Species Richness. Glob. Ecol. Biogeogr. 2021, 30, 1218–1231. [Google Scholar] [CrossRef]
  13. Thapliyal, N.; Bhojak, P.; Sekar, K.C.; Bisht, K.; Mehta, P.; Arya, D.; Joshi, S. Potential Drivers of Plant Diversity and Composition in High-Altitude Alpine Regions of Himalaya. Community Ecol. 2024, 26, 1–19. [Google Scholar] [CrossRef]
  14. Ssali, F.; Mugerwa, B.; Van Heist, M.; Sheil, D.; Kirunda, B.; Musicante, M.; Seimon, A.; Halloy, S. Plant Diversity and Composition Vary with Elevation on Two Equatorial High Mountains in Uganda: Baselines for Assessing the Influence of Climate Change. Alp. Bot. 2023, 133, 49–61. [Google Scholar] [CrossRef]
  15. Foden, W.B.; Young, B.E.; Akçakaya, H.R.; Garcia, R.A.; Hoffmann, A.A.; Stein, B.A.; Thomas, C.D.; Wheatley, C.J.; Bickford, D.; Carr, J.A. Climate change vulnerability assessment of species. Wiley Interdiscip. Rev. Clim. Change 2019, 10, e551. [Google Scholar] [CrossRef]
  16. Lenoir, J.; Svenning, J.C. Climate-related range shifts—A global multidimensional synthesis and new research directions. Ecography 2015, 38, 15–28. [Google Scholar] [CrossRef]
  17. Salariato, D.L.; Delfini, C.F.; Zuloaga, F.O. Climate change impact assessments on the Andean genus Menonvillea (Brassicaceae) reveal uneven vulnerability among major phylogenetic and biogeographic groups. Flora 2024, 315, 152511. [Google Scholar] [CrossRef]
  18. Antonelli, A. Have giant lobelias evolved several times independently? Life form shifts and historical biogeography of the cosmopolitan and highly diverse subfamily Lobelioideae (Campanulaceae). BMC Biol. 2009, 7, 1–21. [Google Scholar] [CrossRef]
  19. Zhao, S.-Y.; Chen, L.-Y.; Muchuku, J.K.; Hu, G.-W.; Wang, Q.-F. Genetic adaptation of giant lobelias (Lobelia aberdarica and Lobelia telekii) to different altitudes in East African Mountains. Front. Plant Sci. 2016, 7, 488. [Google Scholar] [CrossRef] [PubMed]
  20. Gehrke, B.; Linder, H.P. Species Richness, Endemism and Species Composition in the Tropical Afroalpine Flora. Alp. Bot. 2014, 124, 165–177. [Google Scholar] [CrossRef]
  21. Knox, E.B.; Jeffrey, D.P. Chloroplast DNA Evidence on the Origin and Radiation of the Giant Lobelias in Eastern Africa. Syst. Bot. 1998, 32, 109–149. [Google Scholar] [CrossRef]
  22. Coe, M. Biogeographic Affinities of the High Mountains of Tropical Africa. In Quaternary and Environmental Research on East African Mountains; CRC Press: Boca Raton, FL, USA, 2021; pp. 257–278. [Google Scholar]
  23. Manes, S.; Costello, M.J.; Beckett, H.; Debnath, A.; Devenish-Nelson, E.; Grey, K.-A.; Jenkins, R.; Khan, T.M.; Kiessling, W.; Krause, C.; et al. Endemism Increases Species’ Climate Change Risk in Areas of Global Biodiversity Importance. Biol. Conserv. 2021, 257, 109070. [Google Scholar] [CrossRef]
  24. Vale, M.M.; Arias, P.A.; Ortega, G.; Cardoso, M.; Oliveira, B.F.; Loyola, R.; Scarano, F.R. Climate Change and Biodiversity in the Atlantic Forest: Best Climatic Models, Predicted Changes and Impacts, and Adaptation Options. In The Atlantic Forest: History, Biodiversity, Threats and Opportunities of the Mega-Diverse Forest; Springer: Cham, Switzerland, 2021; pp. 253–267. [Google Scholar]
  25. Nzei, J.M.; Ngarega, B.K.; Mwanzia, V.M.; Musili, P.M.; Wang, Q.F.; Chen, J.M. The Past, Current, and Future Distribution Modeling of Four Water Lilies (Nymphaea) in Africa Indicates Varying Suitable Habitats and Distribution in Climate Change. Aquat. Bot. 2021, 173, 103416. [Google Scholar] [CrossRef]
  26. Mkala, E.M.; Mutinda, E.S.; Wanga, V.O.; Oulo, M.A.; Oluoch, W.A.; Waswa, E.N.; Odago, W.; Nanjala, C.; Mwachala, G.; Hu, G.W.; et al. Modeling Impacts of Climate Change on the Potential Distribution of Three Endemic Aloe Species Critically Endangered in East Africa. Ecol. Inform. 2022, 71, 101765. [Google Scholar] [CrossRef]
  27. Mkala, E.M.; Jost, M.; Wanke, S.; Ngarega, B.K.; Hughes, A.; Mutinda, E.S.; Waswa, E.N.; Mwanzia, V.M.; Oulo, M.A.; Wanga, V.O.; et al. How Vulnerable Are Holoparasitic Plants with Obligate Hosts to Negative Climate Change Impacts? Ecol. Inform. 2022, 69, 101636. [Google Scholar] [CrossRef]
  28. Gómez-Undiano, I.; Francis, M.; Wilfred, L.M.; Grace, M.D.; Roger, D.; Regan, E.; Kenneth, W. Predicting Potential Global and Future Distributions of the African Armyworm (Spodoptera Exempta) Using Species Distribution Models. Sci. Rep. 2022, 12, 16234. [Google Scholar]
  29. Muchuku, J.K.; Gichira, A.W.; Zhao, S.-Y.; Chen, J.-M.; Chen, L.-Y.; Wang, Q.-F. Distribution pattern and habitat preference for Lobelia species (Campanulaceae) in five countries of East Africa. PhytoKeys 2020, 159, 45. [Google Scholar] [CrossRef]
  30. Perkins, T.D. Haeitat and Population Ecology of Lobelia kalmii on Presoue Isle, Pa Correlated with Changes in Lake Erie Water Levels. J. Pennsyljzania Acad. Sci. 1992, 4, 123. [Google Scholar]
  31. Beck, E. Ecophysiology of Niche Occupation by Two Giant Rosette Plants, Lobelia gibberoa Hemsl and Solanecio gigas (Vatke) C. Jeffrey, in an Afromontane Forest Valley. Ann. Bot. 2001, 88, 267–278. [Google Scholar]
  32. Buytaert, W.; Cuesta-Camacho, F.; Tobón, C. Potential impacts of climate change on the environmental services of humid tropical alpine regions. Glob. Ecol. Biogeogr. 2011, 20, 19–33. [Google Scholar] [CrossRef]
  33. Nagy, L.; Grabherr, G. The Biology of Alpine Habitats; Oxford University Press: Cary, NC, USA, 2009. [Google Scholar]
  34. Barbet, M.M.; Jiguet, F.; Albert, C.H. Thuiller W Selecting pseudo absences for species distribution models: How, where and how many? Methods Ecol. Evol. 2012, 3, 327–338. [Google Scholar] [CrossRef]
  35. Fick, S.E.; Hijmans, R.J. WorldClim 2: New 1-km spatial resolution climate surfaces for global land areas. Int. J. Climatol. 2017, 37, 4302–4315. [Google Scholar] [CrossRef]
  36. Zomer, R.J.; Xu, J.; Trabucco, A. Version 3 of the global aridity index and potential evapotranspiration database. Sci. Data 2022, 9, 409. [Google Scholar] [CrossRef]
  37. Mehra, N.; Swain, J.B. Assessment of land use land cover change and its effects using artificial neural network-based cellular automation. J. Eng. Appl. Sci. 2024, 71, 70. [Google Scholar] [CrossRef]
  38. Naimi, B. usdm: Uncertainty Analysis for Species Distribution Models. –R Package Ver. 1.1-15. R Package; CRAN: Vienna, Austria, 2015. [Google Scholar]
  39. Hijmans, R.; Van Etten, J.; Cheng, J.; Mattiuzzi, M.; Sumner, M.; Greenberg, J.; Lamigueiro, O.; Bevan, A.; Racine, E.; Shortridge, A. Package ‘Raster’. R Package; CRAN: Vienna, Austria, 2015; 734, 473. [Google Scholar] [CrossRef]
  40. Yamazaki, D.; Ikeshima, D.; Tawatari, R.; Yamaguchi, T.; O’Loughlin, F.; Neal, J.C.; Sampson, C.C.; Kanae, S.; Bates, P.D. A high-accuracy map of global terrain elevations. Geophys. Res. Lett. 2017, 44, 5844–5853. [Google Scholar] [CrossRef]
  41. The IUCN Red List of Threatened Species. Version 2025-1. Available online: https://www.iucnredlist.org (accessed on 2 February 2025).
  42. Ackerley, D.; Dietmar, D. Atmosphere-Only Gcm (Access1. 0) Simulations with Prescribed Land Surface Temperatures. Geosci. Model Dev. 2016, 9, 2077–2098. [Google Scholar] [CrossRef]
  43. Naimi, B.; Miguel, B.A. Sdm: A Reproducible and Extensible R Platform for Species Distribution Modelling. Ecography 2016, 39, 368–375. [Google Scholar] [CrossRef]
  44. Thuiller, W.; Guéguen, M.; Renaud, J.; Karger, D.N.; Zimmermann, N.E. Uncertainty in ensembles of global biodiversity scenarios. Nat. Commun. 2019, 10, 1446. [Google Scholar] [CrossRef]
  45. Peterson, A.T.; Soberón, J.; Pearson, R.G.; Anderson, R.P.; Martínez-Meyer, E.; Nakamura, M.; Araújo, M.B. Ecological Niches and Geographic Distributions. In Ecological Niches and Geographic Distributions; Princeton University Press: Princeton, NJ, USA, 2011. [Google Scholar]
  46. Beaumont, L.J.; Graham, E.; Duursma, D.E.; Wilson, P.D.; Cabrelli, A.; Baumgartner, J.B.; Hallgren, W.; Esperón-Rodríguez, M.; Nipperess, D.A.; Warren, D.L.; et al. Which Species Distribution Models Are More (or Less) Likely to Project Broad-Scale, Climate-Induced Shifts in Species Ranges? Ecol. Model. 2016, 342, 135–146. [Google Scholar] [CrossRef]
  47. Lei, Y.; Yiming, Y. Stochastic Proximal Auc Maximization. J. Mach. Learn. Res. 2021, 22, 1–45. [Google Scholar]
  48. Smeraldo, S.; Bosso, L.; Salinas-Ramos, V.B.; Ancillotto, L.; Sánchez-Cordero, V.; Gazaryan, S.; Russo, D. Generalists yet Different: Distributional Responses to Climate Change May Vary in Opportunistic Bat Species Sharing Similar Ecological Traits. Mammal Rev. 2021, 51, 571–584. [Google Scholar] [CrossRef]
  49. Hughes, T.P.; James, T.K.; Álvarez-Noriega, M.; Álvarez-Romero, G.J.; Kristen, D.A.; Andrew, H.B.; Russell, C.B.; Maria, B.; David, R.B.; Ray, B. Global Warming and Recurrent Mass Bleaching of Corals. Nature 2017, 543, 373–377. [Google Scholar] [CrossRef]
  50. Kaky, E.; Gilbert, F. Assessment of the extinction risks of medicinal plants in Egypt under climate change by integrating species distribution models and IUCN Red List criteria. J. Arid Environ. 2019, 170, 103988. [Google Scholar]
  51. Mahmoodi, S.; Heydari, M.; Ahmadi, K.; Khwarahm, N.R.; Karami, O.; Almasieh, K.; Naderi, B.; Bernard, P.; Mosavi, A. The Current and Future Potential Geographical Distribution of Nepeta Crispa Willd., an Endemic, Rare and Threatened Aromatic Plant of Iran: Implications for Ecological Conservation and Restoration. Ecol. Indic. 2022, 137, 108752. [Google Scholar] [CrossRef]
  52. Qazi, A.W.; Saqib, Z.; Zaman-ul-Haq, M. Trends in Species Distribution Modelling in Context of Rare and Endemic Plants: A Systematic Review. Ecol. Process. 2022, 11, 1–11. [Google Scholar] [CrossRef]
  53. Guillera-Arroita, G.; Lahoz-Monfort, J.J.; Elith, J.; Gordon, A.; Kujala, H.; Lentini, P.E.; McCarthy, M.A.; Tingley, R.; Wintle, B.A. Is My Species Distribution Model Fit for Purpose? Matching Data and Models to Applications. Glob. Ecol. Biogeogr. 2015, 24, 276–292. [Google Scholar] [CrossRef]
  54. Wiens, J.A.; Stralberg, D.; Jongsomjit, D.; Howell, C.A.; Snyder, M.A. Niches, Models, and Climate Change: Assessing the Assumptions and Uncertainties. Proc. Natl. Acad. Sci. USA 2009, 106, 19729–19736. [Google Scholar] [CrossRef]
  55. Wu, Y.M.; Shen, X.L.; Tong, L.; Lei, F.W.; Mu, X.Y.; Zhang, Z.X. Impact of Past and Future Climate Change on the Potential Distribution of an Endangered Montane Shrub Lonicera Oblata and Its Conservation Implications. Forests 2021, 12, 125. [Google Scholar] [CrossRef]
  56. Varol, T.; Ugur, C.; Mehmet, C.; Halil, B.O.; Hakan, S. Impacts of Climate Change Scenarios on European Ash Tree (Fraxinus excelsior L.) in Turkey. For. Ecol. Manag. 2021, 491, 119199. [Google Scholar] [CrossRef]
  57. Hedberg, O. Features of afroalpine plant ecology. In Sv. Växtgeografiska Sällsk; Almqvist & Wiksells: Stockholm, Sweden, 1964. [Google Scholar]
  58. Smith, A.P.; Young, T.P. Tropical alpine plant ecology. Annu. Rev. Ecol. Syst. 1987, 18, 137–158. [Google Scholar] [CrossRef]
  59. Fetene, M.; Gashaw, M.; Nauke, P.; Beck, E. Microclimate and ecophysiological significance of the tree-like life-form of Lobelia rhynchopetalum in a tropical alpine environment. Oecologia 1998, 113, 332–340. [Google Scholar] [CrossRef]
  60. Jump, A.S.; Mátyás, C.; Peñuelas, J. The altitude-for-latitude disparity in the range retractions of woody species. Trends Ecol. Evol. 2009, 24, 694–701. [Google Scholar] [CrossRef] [PubMed]
  61. Agudelo-Hz, W.J.; Urbina-Cardona, N.; Armenteras-Pascual, D. Critical shifts on spatial traits and the risk of extinction of Andean anurans: An assessment of the combined effects of climate and land-use change in Colombia. Perspect. Ecol. Conserv. 2019, 17, 206–219. [Google Scholar] [CrossRef]
  62. Díaz, S.M.; Settele, J.; Brondízio, E.; Ngo, H.; Guèze, M.; Agard, J.; Arneth, A.; Balvanera, P.; Brauman, K.; Butchart, S. The Global Assessment Report on Biodiversity and Ecosystem Services: Summary for Policy Makers; CONICET: Buenos Aires, Argentina, 2019.
  63. Kidane, Y.O.; Steinbauer, M.J.; Beierkuhnlein, C. Dead end for endemic plant species? A biodiversity hotspot under pressure. Glob. Ecol. Conserv. 2019, 19, e00670. [Google Scholar] [CrossRef]
  64. Årevall, J.; Early, R.; Estrada, A.; Wennergren, U.; Eklöf, A.C. Conditions for successful range shifts under climate change: The role of species dispersal and landscape configuration. Divers. Distrib. 2018, 24, 1598–1611. [Google Scholar] [CrossRef]
Figure 1. Distribution and phenotypic differentiation of giant Lobelia. Generalized distribution across six countries in East Africa, depicting the regions where giant Lobelia species are found. The giant Lobelia species used in this study are as follows: L. aberdarica, L. telekii, L. gibberroa, L. bambuseti, L. deckenii, L. gregoriana, and L. rhynchopetalum.
Diversity 17 00274 g001
Figure 2. The model’s performance. It shows the current predicted distribution regions of the seven Lobelia species (L. giberroa, L. bambuseti, L. aberdarica, L. deckenii, L. gregoriana, L. rhynchopetalum, and L. telekii) using five different modeling techniques: glm (generalized linear model), brt (Boosted Regression Trees), maxlike (Maximum Likelihood Estimation), rf (random forest), and rpart (Recursive Partitioning). The color scale indicates the predicted suitability of each species’ habitat, with blue representing low suitability and yellow indicating high suitability, ranging from 0 to 1. These models provide insights into the species’ potential distribution across the landscape, offering valuable information for ecological studies and conservation efforts.
Diversity 17 00274 g002
Figure 3. The important variables, which were highly significant. Relative significant variables (a) in predicting the potential distribution of the seven Lobelia species (b) and the ecological niche (c) in East Africa.
Diversity 17 00274 g003
Figure 4. The current and future forecast of the changes in the suitable habitat of Lobelia in East Africa for the years 2050 and 2070 under both the (a) RCP-4.5 and (b) RCP-8.5 scenarios. Orange indicates the range contraction, green indicates the range expansion, and blue indicates the stability range.
Diversity 17 00274 g004
Table 1. Summary of the selected predictor variables explaining the potential distribution of seven giant Lobelia species: correlated variables with variance inflation factor (VIF) values.
CodeDescriptionVIF
bio13Precipitation of Wettest Month (mm)3.90
bio14Precipitation of Driest Month (mm)2.88
bio15Precipitation Seasonality (Coefficient of Variation) (mm)2.45
bio18Precipitation of Warmest Quarter (mm)2.52
bio19Precipitation of Coldest Quarter (mm)3.63
bio2Mean Diurnal Range (°C)3.26
bio3Isothermality7.39
bio4Temperature Seasonality (°C)5.77
bio9Mean temperature of the driest quarter (°C)6.30
lcLand cover1.35
sradSolar radiation2.58
vaprWater vapor8.80
The mean average of VIF was calculated from all the species: L. aberdarica, L. telekii, L. giberroa, L. bambuseti, L. deckenii, L. gregoriana, and L. rhynchopetalum.
Table 2. Performance metrics for species distribution models (glm, brt, maxlike, rf, and rpart). Metrics include AUC (model discrimination), COR (correlation strength), TSS (predictive power), and Deviance (model fit). The maxlike method performed the worst, while rf achieved the best results.
Method AUC COR TSS Deviance
glm0.980.90.950.15
brt0.990.890.960.15
maxlike0.920.470.862.59
rf10.940.980.05
rpart0.970.90.930.09
Disclaimer/Publisher’s Note: The statements, opinions and data contained in all publications are solely those of the individual author(s) and contributor(s) and not of MDPI and/or the editor(s). MDPI and/or the editor(s) disclaim responsibility for any injury to people or property resulting from any ideas, methods, instructions or products referred to in the content.

