Article

The Genetic Diversity and Phylogeography of the Iberian Endemic Steppe Plant Moricandia moricandioides (Boiss.) Heywood, Inferred from ISSR, Plastid DNA, and ITS Sequences

by
Juan F. Jiménez
1,*,
Esteban Salmerón-Sánchez
2,
Juan F. Mota
2 and
Pedro Sánchez-Gómez
3
1
Botany Department, Faculty of Pharmacy, University of Granada, Campus de Cartuja s/n, E-18071 Granada, Spain
2
Biology and Geology Department, CITE II–B, CECOUAL, University of Almería, Ctra. Sacramento s/n, La Cañada de San Urbano, E-04120 Almería, Spain
3
Vegetal Biology Department, Faculty of Biology, University of Murcia, Campus de Espinardo s/n, E-30100 Murcia, Spain
*
Author to whom correspondence should be addressed.
Diversity 2025, 17(5), 310; https://doi.org/10.3390/d17050310
Submission received: 28 March 2025 / Revised: 21 April 2025 / Accepted: 23 April 2025 / Published: 25 April 2025

Abstract

:
Moricandia moricandiodes is an endemic species found in the south and east of the Iberian Peninsula. Five subspecies have been recognized, and all exist as fragmented populations on limestones and marls with salt and gypsum intrusions under a continental Mediterranean climate, except for one of the subspecies, which inhabits semi-arid and hotter environments. In this study, we sampled populations covering the distribution area of the species and performed a population and phylogeographic study to assess the evolutionary history of populations and the taxonomic relationships of subspecies. ISSR markers, nrITS, and plastid sequences were used in the analyses. The results revealed that, in general, southern populations showed higher genetic diversity than northern populations, suggesting that the former are located in glacial refugia. Furthermore, we did not find clear differences between subspecies, except for M. moricandioides subsp. pseudofoetida, which showed exclusive haplotypes and an exclusive ribotype. Isolation and rapid divergence are discussed as the probable causes of differentiation, whereas bottlenecks and secondary contact between populations would explain the absence of differentiation among the other subspecies. Finally, we propose a few guidelines for the conservation of M. moricandioides.

1. Introduction

Moricandia DC (Brassicaceae) is a genus that comprises seven or eight species, depending on the taxonomic treatment [1,2,3], including annual or perennial herbs with a woody base, alternate full or crenate leaves, and inflorescences without bracts. It is distributed through the Mediterranean, Irano-Turanian, and Saharo-Sindian regions, and well adapted to arid and semi-arid environments [4]. The taxonomic identification of many populations has been historically controversial due to the lack of morphological characters required to establish a clear separation of taxa, leading to the description of numerous species, subspecies, or even varieties [1,5,6,7].
Although the phylogenetic relationships among Moricandia species seem to have been resolved recently [2], those with the rest of the Brassiceae species have failed to depict a clear phylogenetic framework. Several authors have included Moricandia in the subtribe Moricandiinae [1,8,9]. However, the existence of this subtribe was not supported by molecular studies since Moricandia was placed in the Rapa/Oleracea subtribe together with genera such as Brassica, Diplotaxis, Enartrocarpus, Eruca, Erucastrum, Morisia, Raphanus, Rapistrum, and Rytidocarpus [10,11]. Although several phylogenetic studies have included a fraction of the Moricandia species [11,12,13,14,15], as commented before, a complete phylogeny of the genus was only recently performed [2]. In this study, it was corroborated that Moricandia is closely related to the genus Rytidocarpus, contrasting with the views of previous authors [10,11,13,16], who suggested that Moricandia was related to Eruca. Recently, M. foleyi was excluded from Moricandia and placed in Eruca, and M. rytidocarpoides was described as a new species among Iberian populations, after previously being considered as Rytidocarpus moricandioides [2].
Four Moricandia species are found in the Iberian Peninsula: Moricandia arvensis (L.) DC., a circum-Mediterranean species, mainly found in agricultural fields and ditchers; Moricandia rytidocarpoides, as outlined by Lorite, Perfectti, Gómez, González-Megías, and Abdelaziz, which is only known in Jaen province (Eastern Andalusia, Spain), growing in marly slopes over badlands; Moricandia foetida Bourg. ex Coss., endemic to southeast Andalusia (Spain), where it grows on soils composed of calcarenites and marls with gypsum intrusions in areas with severe drought and high temperatures; and Moricandia moricandioides (Boiss.) Heywood, an annual plant found in fragmented and isolated populations of the eastern half of the Iberian Peninsula. Specifically, this species grows in dry and semi-arid environments, and in marshes and gypsiferous Iberian steppes, designated as priority habitats by the European Council Directive 42/93/EEC, and several of its subspecies present great affinity for gypsum [17].
The five currently recognized subspecies of Moricandia moricandioides, M. moricandioides subsp. moricandioides, M. moricandioides subsp. baetica (Boiss. & Reut.) Sobr.-Vesp., M. moricandioides subsp. cavanillesiana, (Font Quer & A. Bolòs) Greuter & Burdet, M. moricandioides subsp. pseudofoetida Sanchez Gómez, M.A. Carrión, A. Hern. & J.Guerra and M. moricandioides subsp. giennensis Valdés Berm, can be difficult to differentiate based on morphology. In many cases, morphological differentiation is challenging, with numerous transitional populations. Furthermore, it has been observed in this taxon, and generally in in the different subspecies of M. moricandioides, that individuals that grow in more favorable substrates can reach sizes larger than those given in the description of each subspecies (pers. observ.). From a legal perspective, both the subspecies pseudofoetida and cavanillesiana are regionally protected within the Autonomous Communities where they occur.
Many studies have concentrated on edaphically restricted species that thrive in unusual soil environments, including dolomite [18] and gypsum [19,20,21,22], to gain insights into their distribution, genetic diversity, and evolutionary processes. From such studies, some predictions regarding the distribution of genetic diversity and the evolutionary history of the populations are drawn: (i) climatic and geological changes since the Pleistocene have greatly influenced the phylogeographic patterns of these species; (ii) although it is not a general rule, the populations of the southern Iberian peninsula show higher levels of genetic diversity than the more northerly ones, suggesting that they could be located in glacial refuges and could currently be considered as biodiversity hotspots. These findings align with the hypotheses proposed by [23,24] and references therein, which suggested that the number of biodiversity hotspots proposed by [25] would be underestimated. Although these studies have provided information relative to the geographical structure of plants with this particular distribution, unfortunately, all have focused on perennial plants, and little information can be found about annual species, such as Moricandia.
In this study, we used a technique based on DNA fingerprinting, the Inter Simple Sequence Repeat (ISSR) method [26], to assess the genetic diversity of Moricandia moricandioides. This technique is relatively fast and cost-efficient. As with the Random Amplified Polymorphic DNA method (RAPD; [27]), it does not require prior knowledge of the genome. However, ISSR markers are detected with longer primers and high-stringency polymerase chain reaction (PCR) conditions, so they are more reproducible and more polymorphic than RAPDs [28]. This technique has been successfully used to discriminate hybrid species [29,30], for the differentiation of subspecies (Caparis spinosa L. [31]), for the construction of genetic maps, and for the determination of intra- and interspecies genetic diversity and relationships in closely related taxa [17,32,33].
Plastid sequences were also used (specifically, the region trnT-F) widely in phylogenetic and phylogeographical studies [19,21,34]. In addition, the sequences of the internal transcribed spacer (ITS) of nuclear ribosomal DNA (nrDNA) were employed, as they are commonly used to infer phylogeographic patterns [19,21], or to resolve phylogenetic relationships between taxa [35]. Furthermore, ITS sequences can also be used to estimate the maximum age of diversification [19,21,35] by means of molecular clock analyses [36].
Thus, the main objective of the present study is to investigate M. moricandioides, a model annual species present in loamy and chalky soils, which form discontinuous habitats in the Iberian Peninsula. We will use this information to (i) investigate the intra- and interpopulation genetic diversity of M. moricandioides, establish the geographic distribution of genotypes, and compare them with the phylogeographic patterns of similarly distributed Iberian steppe species; (ii) test the role that paleoenvironmental events have in the current distribution of the species; and (iii) evaluate the extent to which genetic variation and structure support the taxonomic recognition of the five subspecies currently accepted in M. moricandioides.

2. Materials and Methods

2.1. Sampling Strategy

A total of 304 individuals belonging to 16 populations of Moricandia moricandioides (Table 1) were sampled. This sampling covered its distribution area and included all the subspecies described (Figure 1). We used up to 20 individuals per population for the ISSR analysis and 5 individuals per population in the case of plastid sequences, employing 1 individual per population in the case of nuclear ribosomal ITSs.
Plant material was dried in silica gel and stored at room temperature. On the basis of the results obtained in [2], sequences of species related to Moricandia moricandioides (Rytidocarpus moricandioides, Moricandia foetida among others) were used in the analyses of sequences. Sequences of Eruca spp., Brassica rapa, and Raphanus sativus were used as outgroups. Name, voucher information, and GenBank accession numbers for all the samples analyzed are shown in Supporting Information, Table S1.

2.2. DNA Isolation and ISSR Amplification

A Qiagen DNeasy Plant Mini Kit (Qiagen, Hilden, Germany) was used to extract DNA. The quality of the extracted DNA was checked on 1% TAE–agarose gels and then stored for further analyses. ISSR reactions were performed in 25 mL solutions containing 10 mM Tris-HCl (pH 8.8, 25 °C), 50 mM KCl, 2.5 mM MgCl2, 200 mM of dATP, dCTP, dGTP, and dTTP, 15 ng of primer, approximately 25 ng of genomic DNA, and one unit of Taq polymerase. A control, containing all the components except genomic DNA, was included in each set of reactions to confirm that no contamination had occurred. Amplifications were carried out in an Eppendorf Thermocycler under the following conditions: an initial cycle at 94 °C for 2 min; 35 cycles of 30 s at 94 °C, 30 s at 48 °C, 1 min at 72 °C; a final cycle at 72 °C for 10 min. The resulting reactions were analyzed by electrophoresis on 1.5% agarose gel stained with ethidium bromide.
A total of 20 primers were initially examined for variability. Four of these primers showed sufficient polymorphism at intra- and interspecies levels; so, they were used to analyze the 304 individuals (Table S2). Duplicate amplifications were conducted for each sample to ensure reproducible results and to minimize errors. Bands that could not be reproduced in the two assays were not considered for further analysis.

2.3. Nuclear and Plastid DNA Amplification and Sequencing

The nuclear ribosomal internal transcribed spacer (ITS1-5.8S-ITS2) was amplified from one individual per population to check the variability of this marker, which is present in this species. The primers used were ITS5/ITS4 [37]. PCR conditions were 5 min at 95 °C, followed by 35 cycles of 1 min at 95 °C, 1 min at 54 °C, and 1 min at 72 °C. This was followed by a 10 min incubation at 72 °C. In addition, the plastid DNA region trnL-trnF was amplified from five individuals per population. The primers used for the amplification of this fragment were primers a and f [38]. The PCR conditions were 5 min at 95 °C, followed by 35 cycles of 1 min at 95 °C, 1 min at 52 °C, and 1 min at 72 °C. This was followed by a 10 min incubation at 72 °C.
PCR amplification products were purified using a Genelute PCR cleanup kit (Sigma-Aldrich, Madrid, Spain). Sequencing reactions were performed using the BigDye Terminator V3.1 (Applied Biosystems Foster City, CA, USA) sequencing kit and electrophoresed in an ABI 3100 Avant (Applied Biosystems) automated sequencer. Forward and reverse sequences of each amplified region were obtained for each sample. The sequencing process was performed by the Molecular Biology service of the University of Murcia.

2.4. ISSR Analysis

Gel images were captured using a Kodak Gel Logic System, and fragment sizes were determined by comparison with Hyperladder 50 bp (Bioline, Gregory Hills, Australia) using the Kodak 1D 3.6 software. The presence or absence of each ISSR fragment was treated as a binary character (coded 1 and 0, respectively) and used to construct the original data matrix. Bands showing the same gel mobilities were assumed to be homologous. Following the suggestion of [39], no attempt was made to code for band intensity. DNA bands showing quantitative variation in brightness were scored as present, regardless of their intensity, and bands were scored as absent if they were undetectable.
As ISSR markers are dominant, we assumed that null bands were homologous and populations were in Hardy–Weinberg equilibrium [40] in order to compute diversity indices, the percentage of polymorphic (PLP) markers, Nei’s unbiased expected heterozygosity (He) [41], and genetic distance among populations (Fst). These parameters were inferred using AFLP-surv 1.0. The significance of Fst values was determined using 1000 bootstrapped datasets. To test the influence of geography on genetic diversity, pairwise correlations between Nei’s heterozygosity (He) and geographic parameters (latitude, longitude) were performed for Mediterranean populations using Kendall’s Ԏ estimate. The significance of the correlation was tested using a permutation procedure (10,000 permutations) with Past [42]. We calculated the frequency-downweighted marker (DW) [43], a standardized measure of divergence that estimates the genetic rarity of a population as equivalent to range downweighted species values in historical biogeographical research [44]. For each population, the number of occurrences of each ISSR marker in that population was divided by the number of occurrences of that particular marker in the total dataset. Finally, these values were summed up. DW values are expected to be high in long-term isolated populations where rare markers should accumulate due to mutations, whereas newly established populations are expected to exhibit low values, thus helping in distinguishing old vicariance from recent dispersal. DW parameters (frequency-downweighted marker values) were calculated using the R package AFLPdat [45]. Genetic structure analysis was performed using analysis of molecular variance (AMOVA) to estimate components of variance, partitioned within and among populations [46]. The program Genalex 6.5 was used to perform this test, with significance tested via 10,000 permutations.
Principal coordinate analysis (PCoA) was performed to illustrate the overall similarity among individuals using Genalex 6.5. PCoA was inferred from the pairwise Nei’s genetic distance [41] between all pairs of ISSR phenotypes.
Bayesian model-based analysis was performed to infer the population structure using STRUCTURE version 2.3 [47,48]. The F model, based on an admixture ancestry model with correlated allele frequencies, was imposed to estimate the posterior probabilities [LnP(D)] of K groups [49] and the individual percentages of membership assigned to them according to their molecular multilocus profiles [48,50]. The probabilities for a range of K were examined. We started from one and went up to the number of sampled populations plus one (K = 1–17), using a burn-in period and a run length of the Markow chain Monte Carlo (MCMC) of 105 and 106 iterations, respectively. This was replicated 20 times. Results were uploaded into Structure Harvester [51], which estimates the most likely K value (ΔK) [52]. We used CLUMP 1.1.2 [53] to reach a consensus on the results of the independent runs for the optimal K. For consensus, we used the Greedy option with a random input order and 10,000 repeats. The consensus was visualized in Distruct 1.1 [54].

2.5. Sequence Alignment and Analysis

Ribosomal and plastid sequences were assembled separately, edited, and aligned using Geneious v.5.4.7. In the case of nrDNA, because of the low variability detected, we only analyzed the sequence with one individual per locality. However, this low variability was sufficient to distinguish a polymorphism associated with the subspecies M. moricandioides subsp. moricandioides. We performed the nrITS analysis with 45 sequences, and 110 sequences were used for the plastid analysis (Table S1), including the new sequences generated in this study and those obtained from GenBank database.
As an approach to infer the genealogical relationships among haplotypes and ribotypes, an unrooted haplotype and a ribotype network were constructed using the statistical parsimony algorithm [55], as implemented in TCS 1.21 [56]. Here, the sequences of other related species were included as outgroups (see Table S1). Specifically, we used M. foetida as outgroup for the ribotype network, whereas M. rytidocarpoides was used as an outgroup for the haplotype network. In both analyses, gaps were treated as missing data. Nei’s haplotype and nucleotide diversity [57] (hd and π, respectively) were calculated using DnaSP v. 5 [58] at the species level. Nei’s haplotype and nucleotide diversity [57] (hd and π, respectively), segregating sites (S), and number of haplotypes (h) were calculated for each individual and geographical group using DnaSP v. 5. Hudson’s haplotype-based average haplotype diversity and total diversity (HS, HT) were also calculated.
The phylogenetic analyses of nrDNA and plastid DNA sequences were performed using the criterion of maximum likelihood (ML), as implemented in RAxML 7.2.0 [59], and Bayesian inference (BI), as implemented in Mrbayes 3.1.2 [60]. In both analyses, gaps were treated as missing data. The selection of the best-fit model of nucleotide substitution was carried out according to Bayesian information criteria (BIC) as implemented in Jmodeltest 0.01 [61]. ML analysis was computed using the GTRCAT option and a complete random starting tree for the 1000 bootstrap replicates [62]. The best-known likelihood tree search was performed under GTRMIX conditions with a completely random starting tree. The final tree topology was evaluated under GTRGAMMA conditions to yield stable likelihood values.
For the phylogenetic analysis based on BI, 5 × 10⁶ generations were produced with four Markov chains and sampling every 100th generation. The first 20% of the sampled trees were discarded as burn-in. With the remaining trees, a consensus tree was generated using the majority rule algorithm (50%) and subsequent probability was used as an estimation of the support of the clade [63].
To determine the substitution model that best fits the data sequences composing ribosomal dataset, the BIC, as implemented in Jmodeltest 0.01 [61], was considered. Molecular dating analyses were performed with BEAST v1.8 [64], a program designed to estimate divergence times by means of the Bayesian MCMC approach. The BEAUti tool [65] was used to edit the input file for BEAST. Thus, a constant molecular clock was implemented using a constant rate of 1.2 × 10⁻⁹ substitutions/site/year [2]. All the analyses were performed on the assumption of a YULE diversification process, with node age estimation performed in years. Four runs were performed in the dating analysis. For each run, 25 × 106 generations were produced, with four Markov chains and sampling every 10,000th generation. The results of the BEAST analyses were checked in Tracer 1.7 [66] for the model of likelihood and parameter convergence between each run and also to ascertain whether each run had become stationary. Both chains were combined using LogCombiner 1.8 after discarding the first 10% of the sampled trees. The results were considered reliable once the effective sample size (ESS) values of all parameters were >200 [65]. Finally, a maximum clade credibility tree was generated using Tree Annotator v.1.8.4 [65]. FigTree 1.4.4 [67] was used to display the resulting tree, including confidence intervals. A secondary calibration point of 6.81 Mya [SD: 0.5; 95% highest posterior density (HPD): 5.33–5.99 Mya] was used in the crown of the tree with separation between Moricandia and Rytidocarpus [2].

3. Results

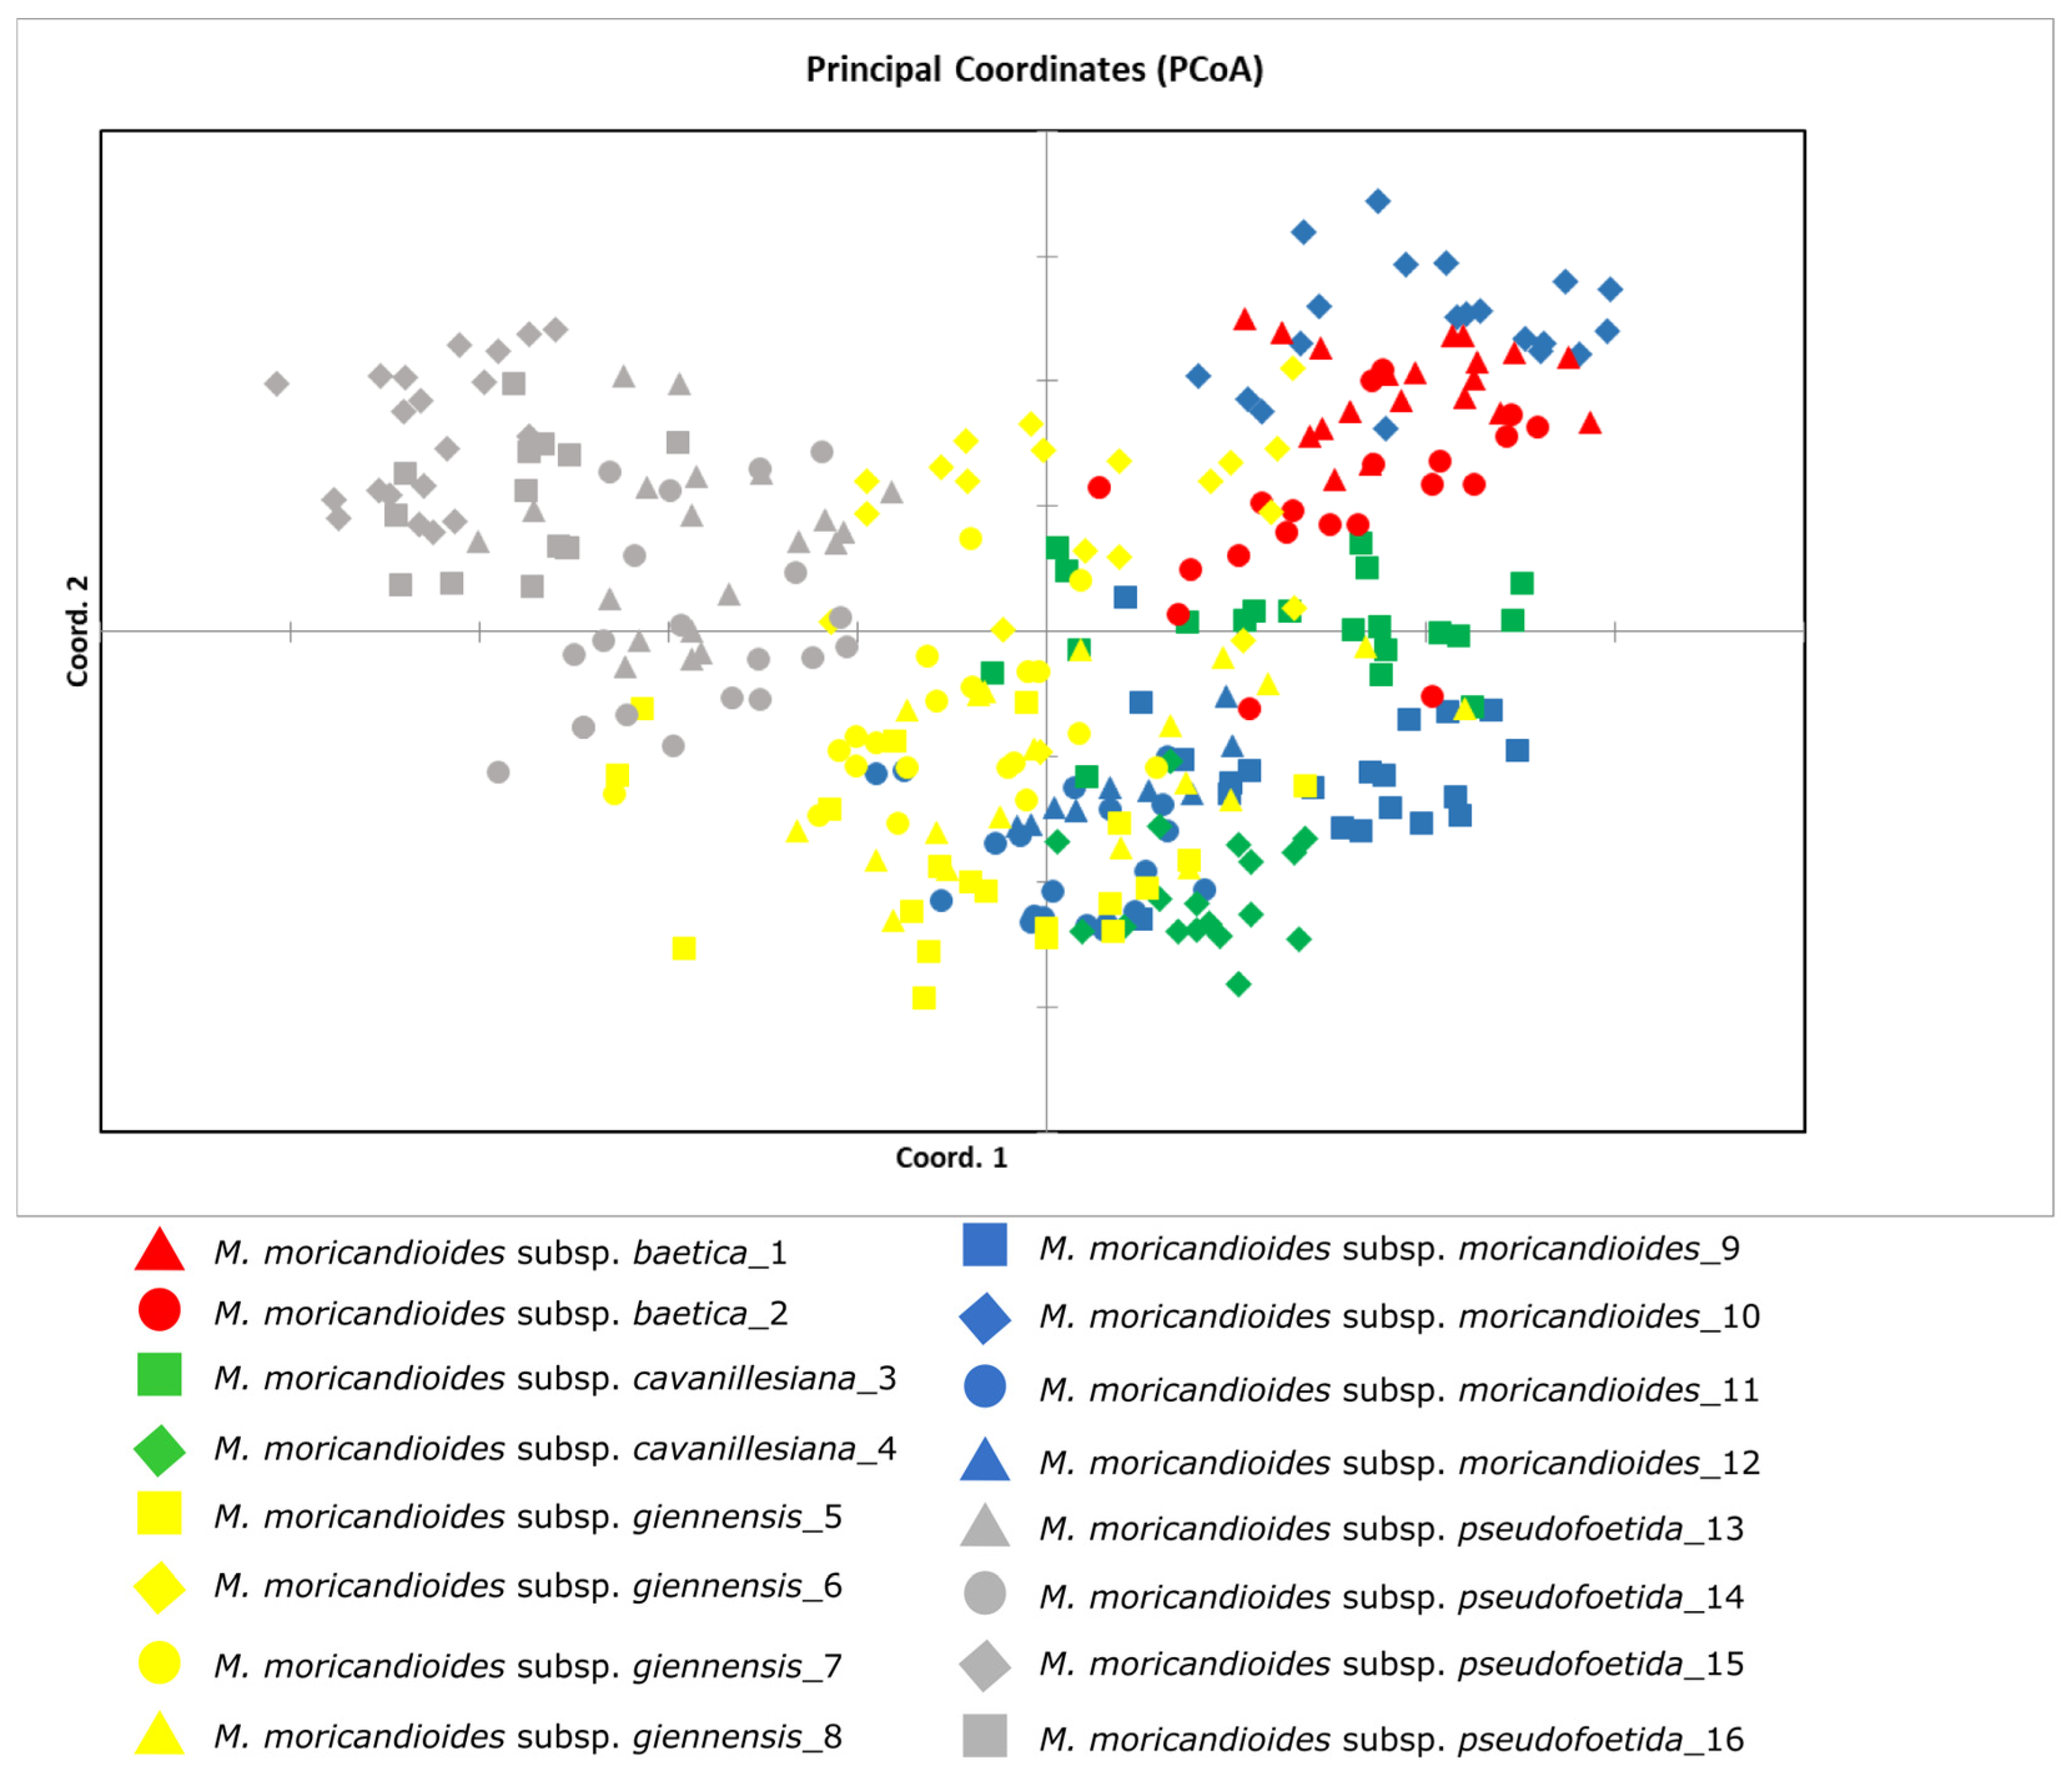
3.1. ISSR Genetic Diversity in Moricandia moricandioides

The four ISSR primers selected yielded 70 scorable bands, ranging in size from 240 to 2370 base pairs. In total, 97.1% of the bands were polymorphic and only 6 individuals shared ISSR phenotypes. The percentage of polymorphic loci (PLP) for a single population ranged from 44.3% in population 4 (subsp. cavanillesiana) to 80.0% in population 14 (subsp. pseudofoetida). Expected heterozygosity values (He) showed that population 14 was the most diverse (He = 0.277), whereas population 4 showed the lowest within-population diversity (He = 0.103). The average gene diversity within populations (Hs) was 0.195, whereas the total diversity value (Ht) was 0.2943 (Table 1). The fixation index obtained through AFLPsurv showed moderate to high differentiation among populations (Fst = 0.337). There was no correlation between the genetic diversity and the latitude (Ԏ = −0.276, p = 0.136), nor between genetic diversity and longitude (Ԏ = 0.058, p = 0.752). Population 15 (M. moricandioides subsp. pseudofoetida) showed the highest value of frequency-down-weighted (DW) marker values, while population 3 (M. moricandioides subsp. cavanillesiana) exhibited the lowest value. In general, the populations of the southeastern Iberian Peninsula exhibited the highest DW values (Table S4).
The Bayesian analysis of the genetic structure of M. moricandioides conducted with STRUCTURE using ΔK [52] revealed the most suitable number of clusters for K = 2. The first clusters included M. moricandioides subsp. pseudofoetida, and the second cluster included the rest of the populations. PCoA analysis gave similar results (Figure 2). PCoA plots revealed that M. moricandioides subsp. pseudofoetida samples were grouped in the negative part of the PCoA1 axis, whereas all the remaining samples were intermingled along the plot. The first three axes accounted for 24.3% of the variation (9.55, 7.58, and 6.90%, respectively). Partitioning of the overall ISSR variation using AMOVA showed that most of the variation was found among individuals within populations (54%), whereas the remaining diversity was distributed among populations (37%) and among subspecies (9%).

3.2. Nuclear DNA Variation, Geographical Distribution and Phylogenetic Analysis

An initial check indicated the low variability present in the nuclear sequences; we amplified only one sample per locality. The final alignment, composed of 45 sequences (35 from Moricandia, and 10 from outgroup species), yielded 447 bp and included 11 variable sites with 82 parsimony-informative positions. In Bayesian analysis, the GTR + G model was the best-fitting model of substitution. The tree obtained showed a harmonic mean of log-likelihood = −1531.31. The ML tree was topologically identical to the BI tree; thus, we only show the Bayesian tree (Figure S1) with PP values for each branch. In the resulting tree, all the Moricandia species were well differentiated, showing their own ribotypes. The clustering of species is nearly identical to the previous phylogeny with ITS [2]. Regarding the ribotypes of M. moricandioides, they were different from those of the other species (1/100%), with M. rytidocarpoides being the most related species. The populations of M. moricandioides with ribotypes I, III, and IV were clustered together, offering great PP support. They were separated from M. moricandioides subsp. pseudofoetida, which exhibited ribotype II. Consequently, for the analysis of ribotypes, we used 17 individuals (16 from M. moricandioides plus one from M. foetida). This alignment comprised 431 bp (excluding the 5.8S ribosomal region from the alignment), including 15 variable characters. A total of four ribotypes were found (geographical distribution of ribotypes is shown in Table 1). Ribotype I was present in M. moricandioides subsp. cavanillesiana and M. moricandioides subsp. baetica, M. moricandioides subsp. moricandiodes and M. moricandioides subsp. giennensis, being exclusive in subsp. baetica and cavanillesiana, whereas ribotype III was present in population 9 (M. moricandioides subsp. moricandioides), and ribotype IV was present in one locality in M. moricandioides subsp. giennensis. Moreover, ribotype II was exclusively present in M. moricandioides subsp. pseudofoetida. TCS analyses revealed a difference of 21 steps between M. foetida and the nearest iteration of M. moricandioides in ribotype II. Ribotype I occupied a central position among M. moricandioides ribotypes, with a separation of one step with respect to the other ribotypes (Figure 3).

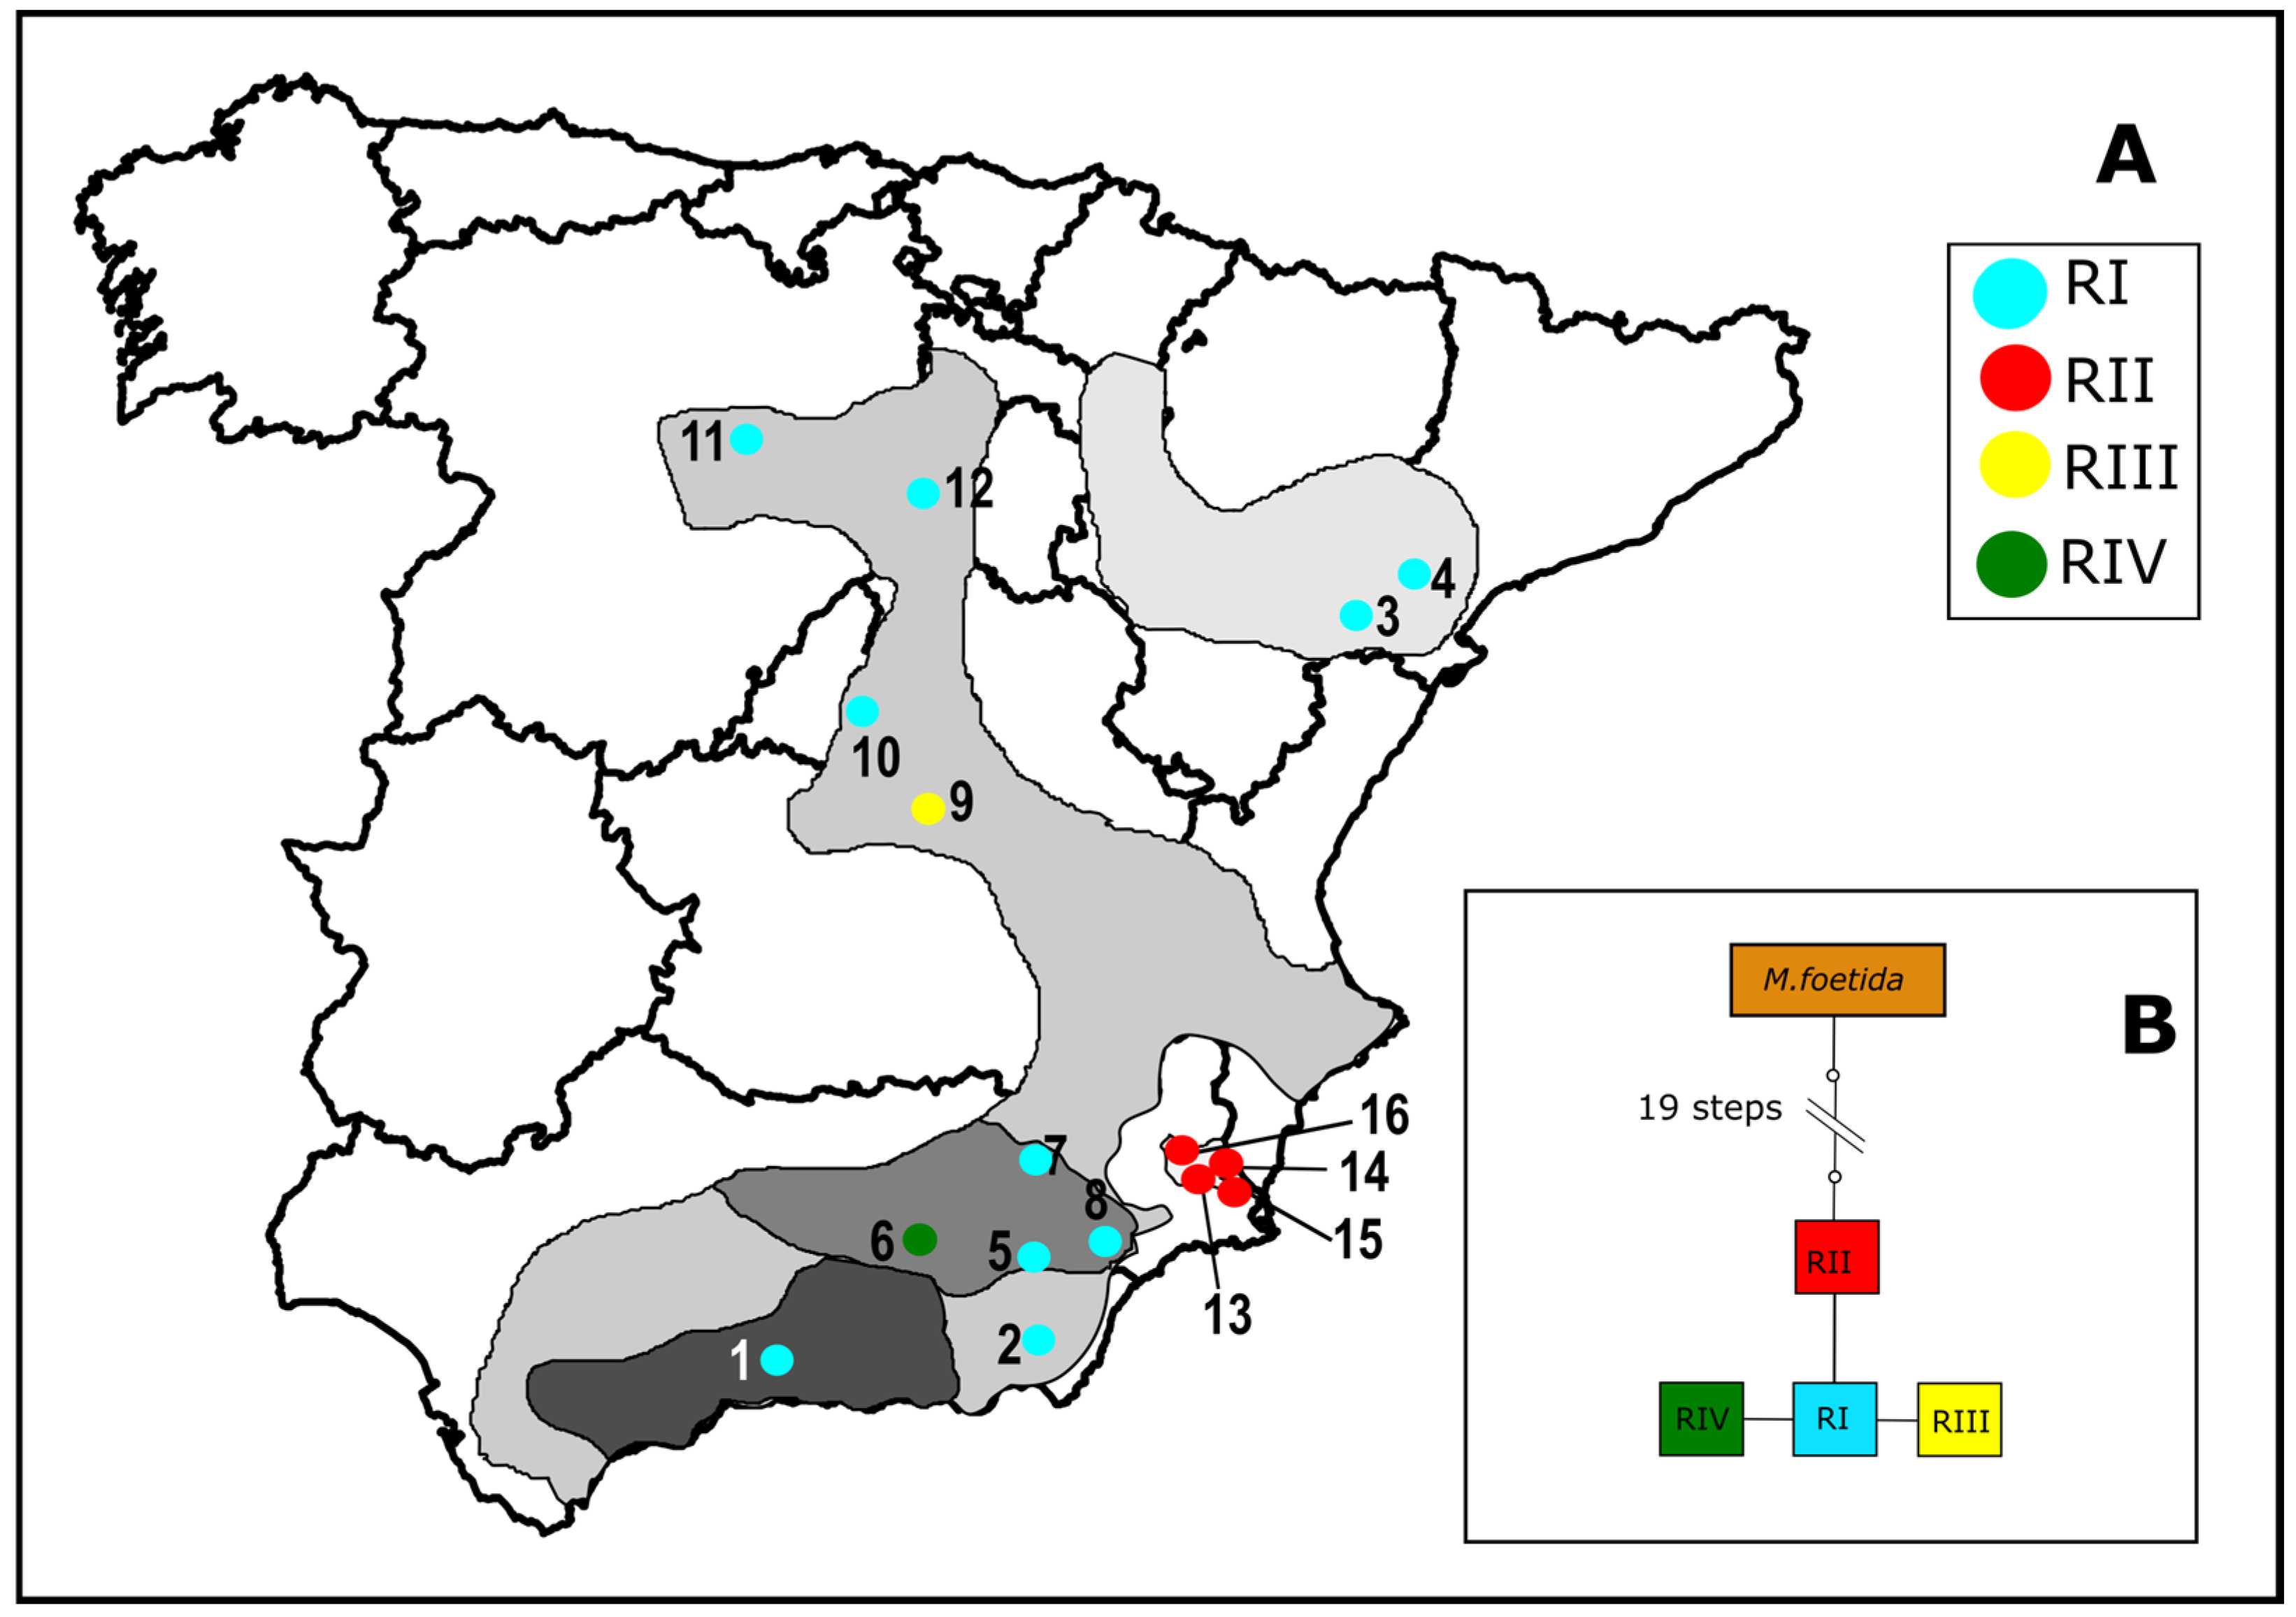
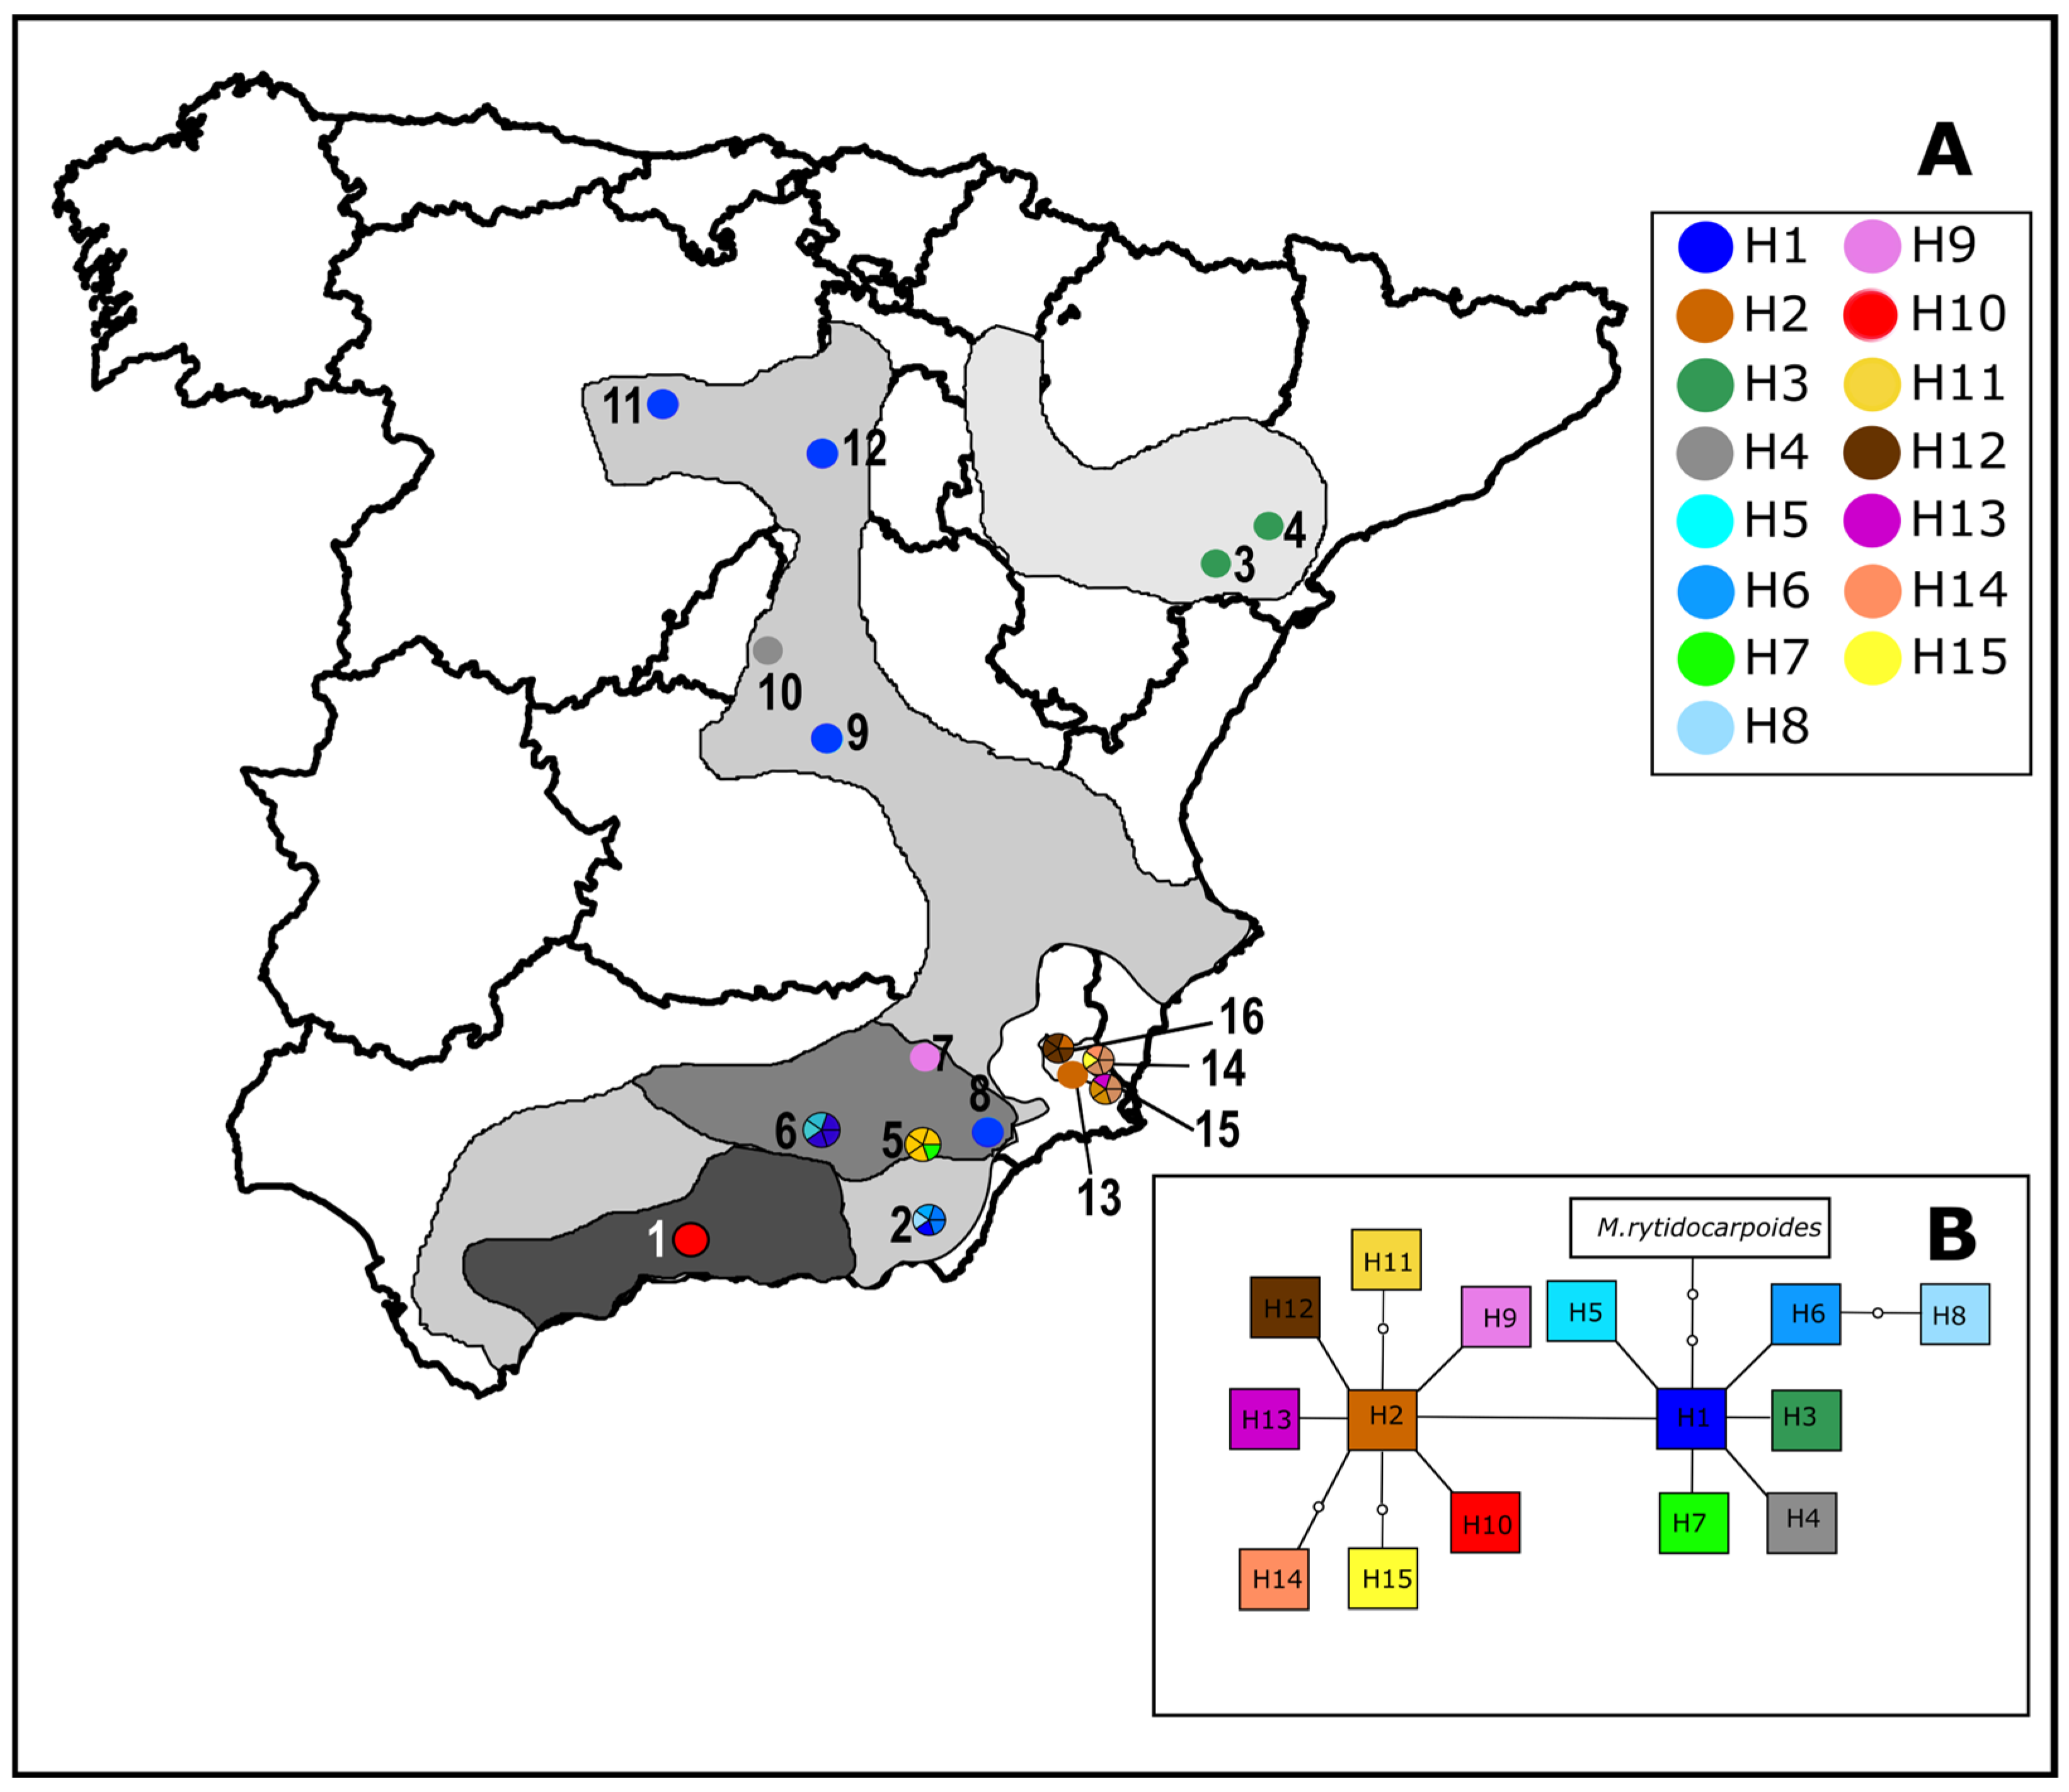
3.3. Plastid DNA Variation, Geographical Distribution and Phylogenetic Analysis

The aligned sequences of 81 individuals presented 798 bp, including 21 indels and 19 polymorphic sites, of which 12 were potentially informative regarding parsimony. In this manner, we identified 16 different haplotypes, which are listed in Table 1. Overall, ten populations only contained one haplotype, but populations 16 (subsp. pseudofoetida), 5, and 6 (subsp. giennensis), showed two, and populations 14, 15 (subsp. pseudofoetida), 2 (subsp. baetica) showed three. H1 was the most frequent of the 16 haplotypes detected (41.7% of all the samples), present in M. moricandioides subsp. moricandioides, M. moricandioides subsp. baetica, and M. moricandioides subsp. giennensis, but absent in M. moricandioides subsp. cavanillesiana and M. moricandioides subsp. pseudofoetida, the most isolated subspecies (Figure 4). This haplotype is closest to that of M. rytidocarpoides. In contrast, H2 was the most frequent and was exclusive to M. moricandioides subsp. pseudofoetida (55%). These two main haplotypes differ by only one nucleotide. The rest of haplotypes seem to be derived from H1 or H2. For instance, the third most frequent haplotype, H3 (the only present in M. moricandioides subsp. Cavanillesiana, being exclusive to this subspecies), is derived directly from H1 (as shown in TCS analysis).
According to the observed differences, two different haplogroups can be differentiated: haplogroup I (composed of H1 and the closest haplotypes) and haplogroup II (composed of H2 and related haplotypes). Table 1 displays more information. Considering this, the haplogroup distribution among subspecies was unequal (Figure 4). Haplogroup I was exclusive to central and northern Iberian subspecies (M. moricandioides subsp. cavanillesiana and M. moricandioides subsp. moricandioides). On the other hand, haplogroup II was also found in the southern subspecies (M. moricandioides subsp. giennensis and M. moricandioides subsp. baetica), being exclusive to M. moricandioides subsp. pseudofoetida.
As shown in Table 1, the populations of M. moricandioides subsp. baetica, M. moricandioides subsp. giennensis, and M. moricandioides subsp. pseudofoetida had higher average levels of haplotype (H) and nucleotide diversity (Π × 10−3) than M. moricandioides subsp. moricandioides and M. moricandioides subsp. cavanillesiana, which only showed two and one haplotype, respectively. Clearly, the number of haplotypes present to the south of the distribution of the species was higher (M. moricandioides subsp. baetica, M. moricandioides subsp. giennensis and M. moricandioides subsp. pseudofoetida, with 14) than that presented by the central and northern populations (M. moricandioides subsp. cavanillesiana and M. moricandioides subsp. moricandioides with 3). All haplotypes except H1 (which was shared between several populations) were present in one of the geographical areas. Consequently, the differences between these diversity parameters were significant.
Using the criterion of 95% parsimony, the haplotype network generated by the program TCS (Figure 4) revealed that the haplotypes in haplogroup I differ by up to five mutational steps, whereas haplotypes in haplogroup II differed by three (if we exclude deletions present). The most frequent haplotypes of each haplogroup were separated by a single change of occurrence. Concerning the outgroup, M. rytidocarpoides showed a difference of four mutational steps, with the closest haplotype, haplotype H1, belonging to M. moricandioides subsp. moricandioides.
Likelihood analysis produced an ML tree with bootstrap values for support of branches. As for Bayesian analysis, general time reversed (GTR + G) was the most suitable model of nucleotide substitution available in MRBAYES. In this manner, we generated a tree (harmonic mean of log-likelihood was −1838.88). As the generated trees are identical, Figure S2 shows the topology of this tree with the posterior probabilities obtained for each branch, which is nearly identical to the previous plastid phylogeny obtained [2]. In the resulting tree, haplogroup II haplotypes are present in a separate group with high posterior probability (96.9%), whereas haplogroup I haplotypes show hardly any clustering.

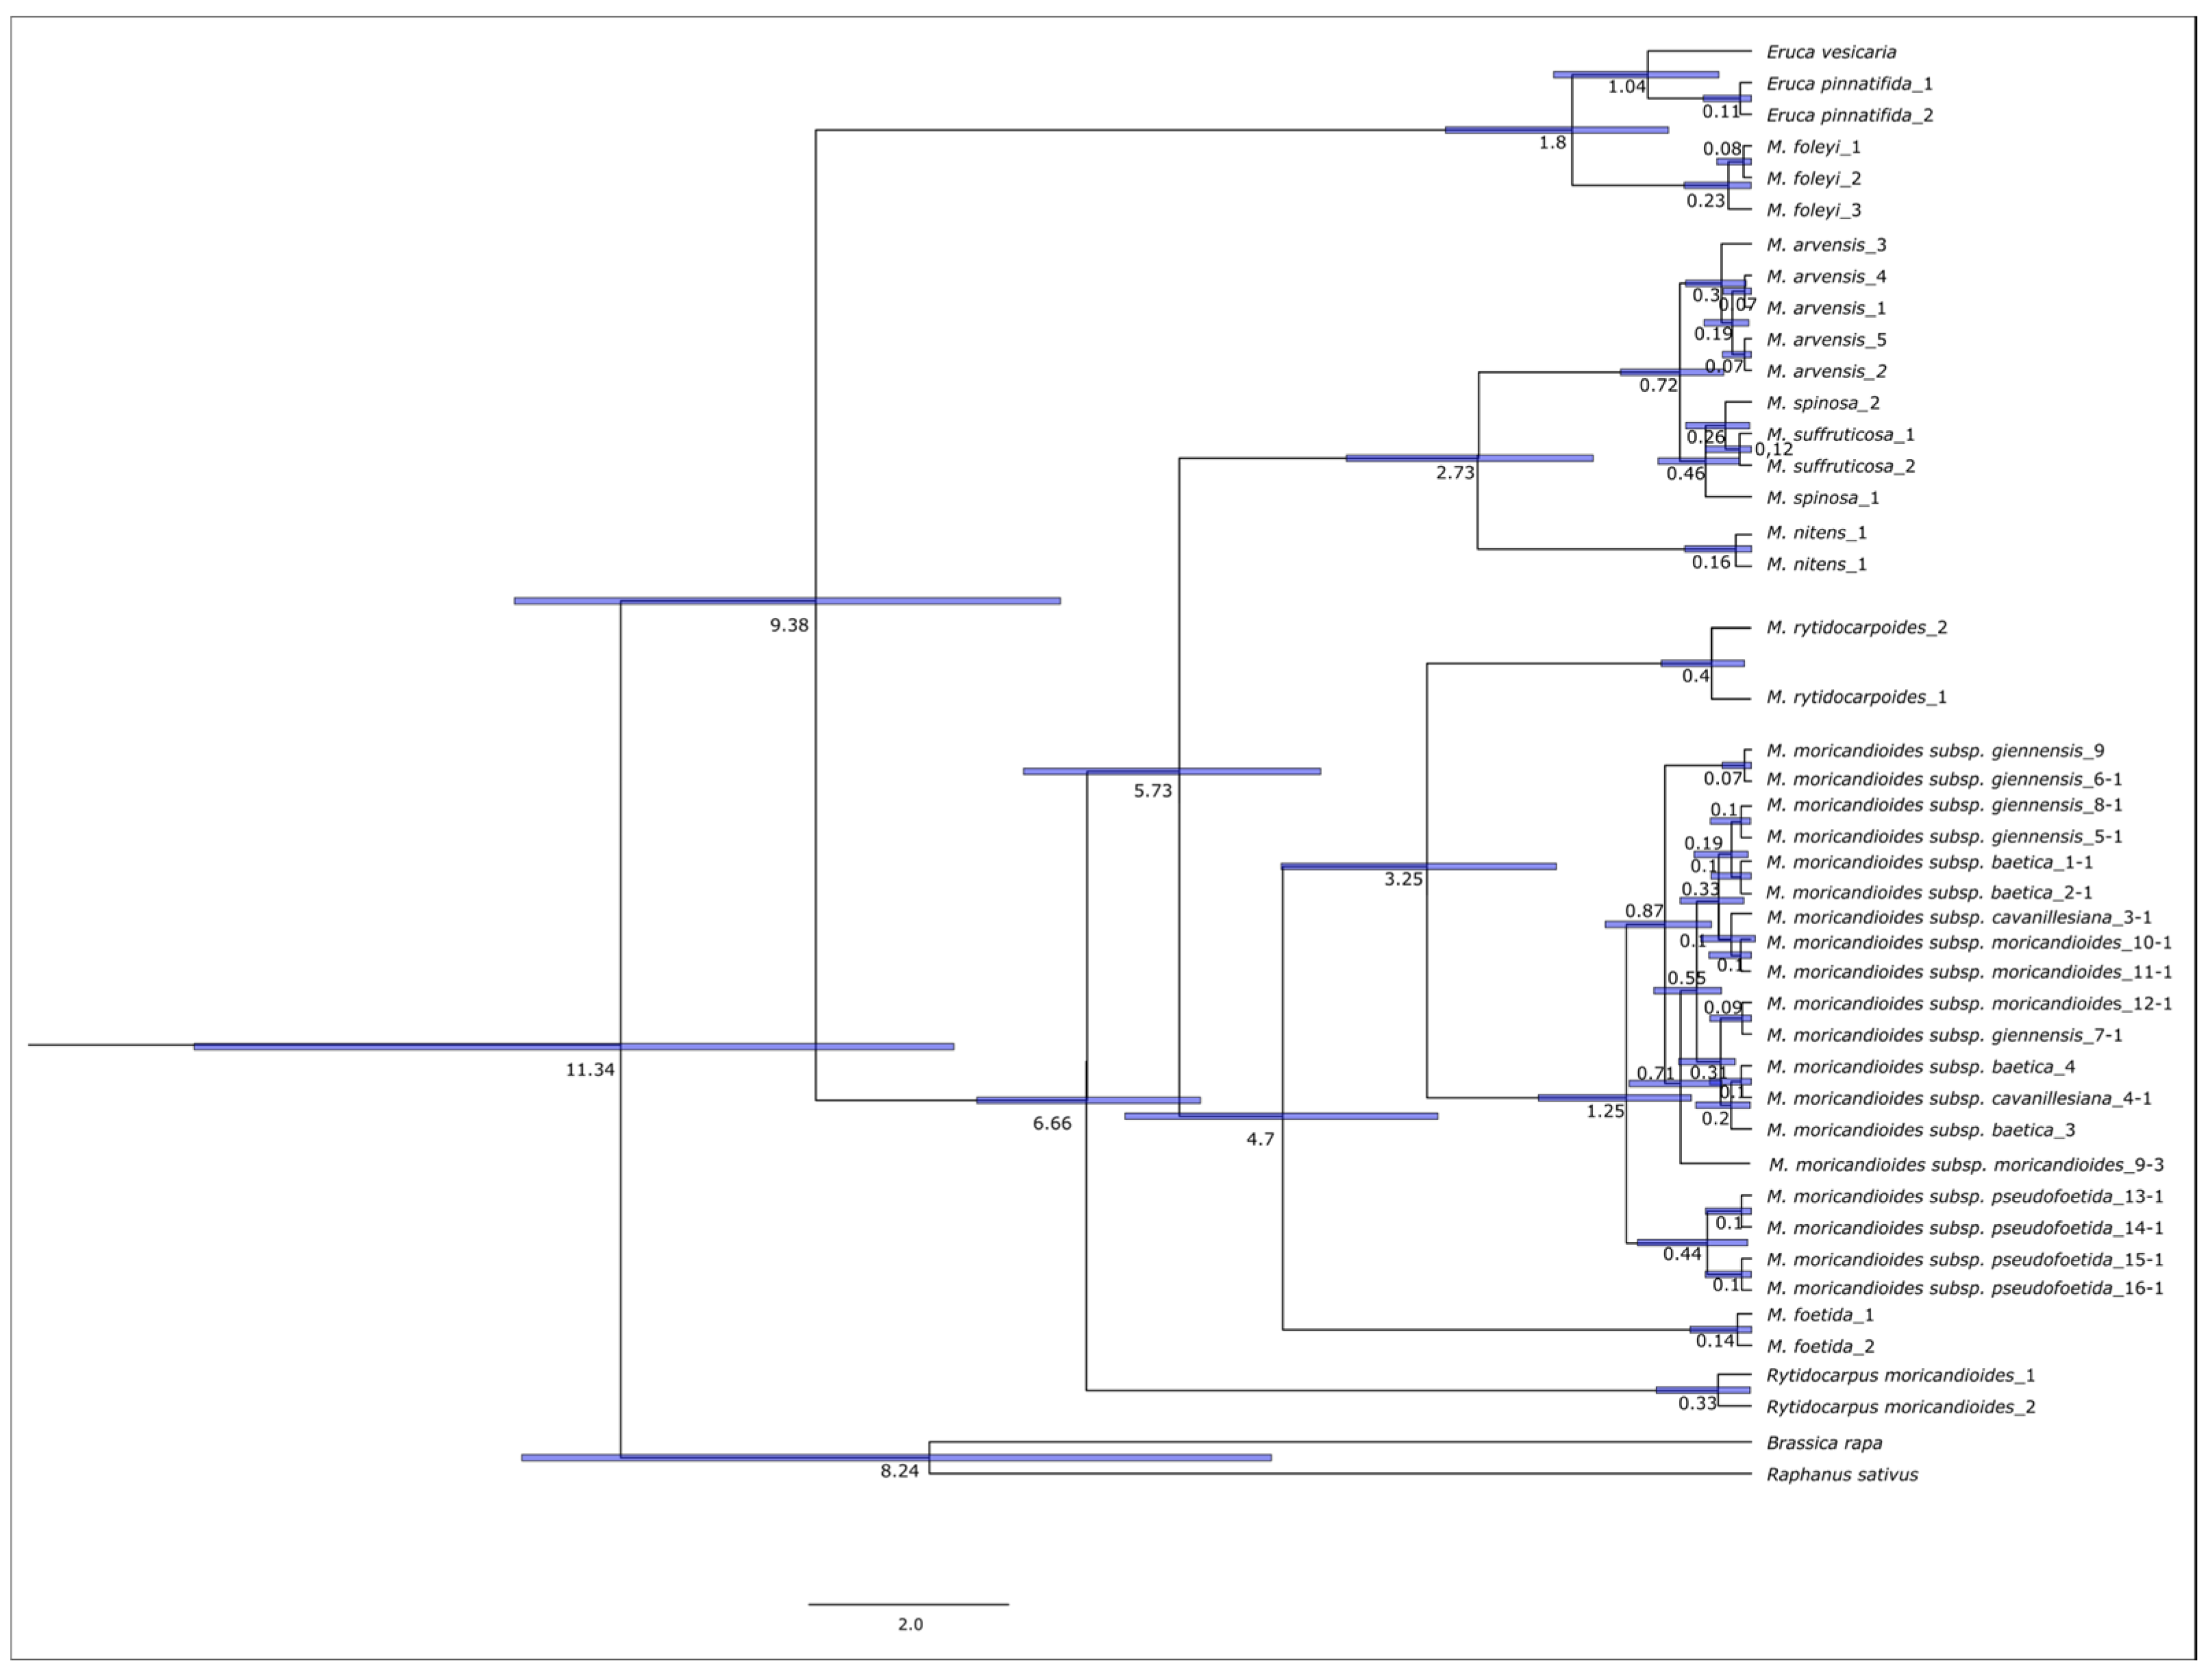
3.4. Estimation of Divergence Times

As a result of the parametric analysis of the nrITS sequences, the split between Moricandia moricandioides and its most related group composed of species from the Moricandia genus (M. rytidocarpoides) indicated a mean age of 3.25 Ma (1.95–4.71 Ma 95% HPD), falling during the Mediterranean climate onset in the Pliocene, whereas the MRCA of the species M. moricandioides showed a mean age of 1.25 Ma (0.60–2.13 Ma 95% HPD), occurring in the Calabrian Age of the Pleistocene (Figure 5). This separation also represents the separation between ribotype II, which is exclusive to M. moricandioides subsp. pseudofoetida, and the remaining subspecies.

4. Discussion

4.1. Genetic Diversity and Rarity Patterns of Moricandia moricandioides

Although phylogeny and partial studies of genetic diversity have already been performed in Moricandia [2,17] and some other populations for the characterization of microsatellite markers of Moricandia moricandioides [68], this is the first study in which the genetic structure and phylogeography of Moricandia moricadioides has been assessed. Regarding genetic diversity, comparison among studies is often difficult, especially when dominant and codominant markers are involved, because the statistical methods employed in each case are quite different. However, intrapopulation genetic markers may be used to establish comparisons between species [69]. According to Nybom [69], annual species—such as M. moricandioides—show high levels of genetic differentiation among populations and lower levels of intrapopulation genetic diversity (Table 1 and Table S3). The Fst values depicted by AFLPsurv (0.337) and AMOVA (0.46) fall within the range of the values reported by Nybom [69]. This is consistent with our results, which are typical of other annual species from the southeastern Iberian Peninsula, such as Scrophularia arguta [70]. Regarding intrapopulation genetic diversity, M. moricandioides exhibits moderate He values in southern populations, whereas northern populations exhibit lower levels of genetic diversity. Plastid sequences were highly congruent with ISSR markers, indicating that the southermost populations had higher haplotype richness than the northern populations (Table 1). In fact, populations from central and northern Spain exhibit very low or no haplotype differences at either an intrapopulation or interpopulation level (Figure 4). Higher levels of genetic diversity are expected in relict populations than in other populations as a consequence of the accumulation of both ancestral polymorphisms and rare alleles [43,71,72]. Thus, the results obtained for M. moricandioides suggest that the southeastern populations of the Iberian Peninsula are older than the rest. Furthermore, DW values suggest that the northern populations were more recent than the southernmost ones (Table S4). These results are congruent with species with similar distribution areas that are restricted to special substrates, such as Ferula loscosii [72], Erodium foetidum (L.) L’Hér. [73], Lepidium subulatum [22], Cheirolophus intybaceus (Lam.) Dostál s.l. [74], Gypsophila struthium [19], or J. pinnata [20].

4.2. The Origin of the Present Phylogeographic Patterns of Moricandia moricandioides

According to the tree of estimation divergence times obtained, the diversification of the genus Moricandia occurred at a time of 5.73 Ma (Figure 5). During this period, there was the separation of a clade composed of endemic species of the Iberian Peninsula (M. moricandioides, M. rytidocarpoides and M. foetida) and others that, for the most part, have a wide distribution but are always present in North Africa. Considering that the distribution of species of the genus (and endemisms) mainly involves populations from the Western Mediterranean of North African, they probably could have spread throughout the Mediterranean Basin during the Messinian salinity crisis (c. 5 Ma.) toward the east (where we exclusively find M. sinaica). The progressive aridification of the Mediterranean Basin before and during the Messinian salinity crisis (6–5 Ma) could have acted as an evolutionary force, promoting the evolution of the Moricandia genus under new climatic conditions [75].
With respect to species with an eminently Iberian distribution, taking into account the position of the Iberian endemic Moricandia foetida in the phylogenetic tree, according to our data, Moricandia would have arrived in the south-southeastern Iberian Peninsula 4.7 my ago thanks to the climate changes that occurred at the MSC. On the other hand, the split between M. moricandioides and M. rytidocarpoides (3.25 Ma) occurred during the Mediterranean climate onset in the Pliocene. During this period, the establishment of rainy temperate seasons and drought in summer implied significant environmental change. This was a period during which there was an increase in the rates of diversification in different eminently Mediterranean genera, such as. Dianthus L. [76] and Cistus L. [77].
The distribution pattern of the identified haplotypes differs in part from that seen in the data obtained using the ISSR markers and the identified ribotypes. The haplogroups were different in the subspecies M. moricandioides subsp. moricandiodes, M. moricandioides subsp. cavanillesiana (with haplotypes assigned to haplogroup I), and M. moricandioides subsp. pseudofoetida (with haplotypes assigned to haplogroup II), whereas in the case of the southernmost subspecies (M. moricandioides subsp. giennensis and M. moricandioides subsp. baetica), the presence of haplotypes belonging to both haplogroups was observed.
The southernmost area could host the original distribution of the species; consequently, posterior diversification toward the north and east may have occurred. This scenario is plausible, given the high diversity the southernmost populations exhibit. As previously noted, the distribution patterns of genetic diversity are similar to those of other steppe Iberian species. The more consensual explanation is that southern populations are located in glacial refugia, where genetic diversity is higher and more structured than seen in northern populations. These populations were likely affected by bottlenecks during the Pleistocene climatic oscillations. The distribution pattern of haplotypes could be a consequence of the existence of secondary contacts among the northernmost and southern populations. As the diversification of Moricandia moricandioides (mean age of 1.25 Ma) occurred during the Pleistocene, it is possible that this was linked to genetic differentiation processes followed by secondary contacts between populations. Such a pattern coincides with the expansion and contraction of species distribution, reflecting the climatic fluctuations of the Quaternary period [78,79], which could have influenced the climatic regimes present in lowlands, with an increase in aridity and a significant extension of potential habitat available for this and other species adapted to xeric environments [80]. Climatic oscillations would have also favored connectivity among populations during the glacial periods, whereas they would have promoted natural range fragmentation during interglacial periods [19]. Consequently, glacial/interglacial cycles in the Iberian Peninsula would be responsible for the present distribution of nuclear and plastidial lineages [81,82,83].
Additionally, the case of M. moricandioides subsp. pseudofoetida deserves attention. Populations of this subspecies are clearly genetically isolated. Its exclusive ribotype II, haplotypes, and ISSR markers indicate that secondary contacts between this subspecies and the rest of the populations were limited or absent (Figure 3 and Figure 4). Furthermore, this is the only subspecies adapted to a warm semi-arid Mediterranean climate area that substantially differs from the continental Mediterranean climate, in which the rest of the subspecies are found. Consequently, this subspecies could suffer to a lesser extent the impact of the Pleistocene climatic oscillations. The rapid differentiation of subsp. pseudofoetida could be related to the adaptation to ecological and climatic pressures different to the other subspecies, such as subsaline soils and drier and hotter habitats, a phenomenon that has been observed in species adapted to special edaphic environments [84]. It may also be related to processes of rapid speciation in new habitats, which are relatively common in Mediterranean species [75,76,85,86]. Nevertheless, this hypothesis needs to be validated via further studies.
Another reason for the great differentiation observed between M. moricandioides subsp. pseudofoetida and the other subspecies might be the hybridization of this subspecies and other Moricandia species. Its populations are located near M. arvensis populations. In fact, the distribution area of this latter species covers the entire area of M. moricandioides subsp. pseudofoetida. As such, it may be the main suspect involved in the introgression with M. moricandioides subsp. pseudofetida. Some of the authors of this study searched for traces of introgression in M. moricandiodes subsp. pseudofoetida [14], including M. foetida and M. arvensis populations from southeastern Spain. This study refuted the hypothesis that introgression occurred between M. foetida and M. moricandiodes, and the traces of hybridization with the nearest population of M. arvensis were less evident. In fact, the reproductive barriers seen between M. moricandioides and the rest of Moricandia species were strong enough to prevent introgression [87]. Moreover, the phylogeny of Moricandia did not support the hypothesis of past hybridization [2].
In the rest of the subspecies, this differentiation is not as clear according to both genetic and morphological data. In many cases, this morphological differentiation is diffuse, with numerous populations having a transitional character [17]; it has been possible to observe marked clinal variations in certain characters considered for differentiation into subspecies [88].

4.3. Taxonomic Conclusions

As mentioned above, the usefulness of the ISSR marker in the differentiation of taxonomic units, including subspecies, has been demonstrated on other occasions [31]. Likewise, the analysis of sequences (both nuclear and plastidial) allows the differentiation of genetic lineages that have been isolated for a relatively long time. According to the different types of molecular markers used in this study, not all subspecies described here would be supported. In fact, PCoA, STRUCTURE and AMOVA analyses only demonstrated clear differentiation between M. moricandioides subsp. pseudofoetida and the remaining subspecies. However, they failed to detect differences among the remaining subspecies because they appeared intermingled in the multivariate analysis and were grouped in a single cluster in the STRUCTURE analysis. Considering these findings, we can conclude that, with the available data, it is not possible to recognize all the infraspecific taxa proposed for M. moricandioides. Our analyses point in two directions.
First, according to the genetic data presented here and the morphological data, there is clear differentiation in genetic lineages present in M. moricandioides subsp. pseudofoetida, demonstrating the clear differentiation of this subspecies with respect to the rest from morphological, genetic, and ecological points of view. Therefore, this subspecies is well supported. These facts seem to be signs that a speciation process is occurring. However, further studies are needed to clarify this point. Second, according to the nuclear and plastidial markers used here, almost all the other subspecies did not exhibit differentiation. In addition, their morphological traits exhibited strong clinal variation [88]. On the latter point, only subsp. cavanillesiana exhibits unique morphological traits (longer and wider fruits and seeds) and exclusive haplotypes, suggesting that it might be a taxonomically valid subspecies.

4.4. Implications for Conservation

The use of molecular markers in conservation is powerful because it allows for the determination of genetic diversity values, which are directly related to the ability of a species to respond to different selective pressures. Although Moricandia moricandioides is an endemic species of the Iberian Peninsula with a fragmented distribution, it is not legally protected at the national level. Only two subspecies are protected at a regional level. This includes the subspecies pseudofoetida in the Region of Murcia, which is in the vulnerable category, and the populations of M. moricandiodes subsp. cavanillesiana in Catalonia, which are “strictly protected”. However, it should be noted that M. moricandioides is protected under the specific epithet of M. ramburii, which is nowadays considered a synonym. Nevertheless, the results obtained could be useful, allowing us to propose conservation measures for the species as a whole. The molecular markers used indicate that the southernmost populations of the species show moderate values of genetic diversity, while some of the northernmost populations show low values of diversity (both nuclear and haplotypic), which could be a disadvantage in adapting to changing abiotic conditions, especially in the context of global warming.
In fact, populations that are protected under regional legislation present exclusive haplotypes, which could be considered ESUs and would therefore be very interesting from a conservation perspective. This circumstance, combined with the values and distribution of the genetic diversity of the populations, would make it possible to establish ex situ conservation measures, such as the collection of germplasm from a good number of individuals in populations that present exclusive haplotypes, with the aim of sampling as much genetic variability as possible. In addition, some subspecies or populations that are not protected also present exclusive haplotypes, as is the case in some of the populations of subsp. baetica or giennensis. As such, the preventive collection of germplasm in these populations would serve to maintain the genetic pool of the species.

Supplementary Materials

The following supporting information can be downloaded at: https://www.mdpi.com/article/10.3390/d17050310/s1, Figure S1: Majority rule consensus tree of the Bayesian analysis of nrTIS; numbers at branches are Bayesian posterior probabilities; scale bar is substitutions per site; Figure S2: Majority rule consensus tree of the Bayesian analysis of cpDNA; numbers at branches are Bayesian posterior probabilities; scale bar is substitutions per site; Table S1: Taxa used in phylogenetic analyses, GenBank accessions, and localities of new sequences samples; Table S2: Number of ISSR loci, primer sequence and amplified polymorphic fragment generated by four primers; Table S3: Pairwise Fst values among populations of M. moricandioides from ISSR markers; Table S4: DW values of M. moricandioides populations from ISSR data.

Author Contributions

Conceptualization, J.F.J., J.F.M. and P.S.-G.; methodology, J.F.J., E.S.-S., J.F.M. and P.S.-G.; field sampling, J.F.J., J.F.M. and P.S.-G.; funding acquisition, P.S.-G.; laboratory analysis, J.F.J.; statistical analysis, J.F.J. and E.S.-S.; writing—original draft preparation, J.F.J., P.S.-G., E.S.-S. and J.F.M.; writing—review and editing, J.F.J., P.S.-G., E.S.-S. and J.F.M. All authors have read and agreed to the published version of the manuscript.

Funding

This work was supported by grants from the Spanish Ministry of Education and Science (CGL2008-00423/BOS). E. Salmerón-Sánchez was supported by the University of Almería, through the projects sponsored by the companies EXPLOTACIONES RÍO DE AGUAS S.L. (TORRALBA GROUP) and SAINT GOBAIN PLACO IBERICA.

Institutional Review Board Statement

Not applicable.

Data Availability Statement

All the new sequences used in this study have been submitted to Genbank database, where will be available. Alignments for phylogenetic analyses will be available on request.

Conflicts of Interest

The authors declare no conflicts of interest.

References

  1. Schulz, O.E. Cruciferae. In Die Natürlichen Pflanzenfamilien; Engler, A., Harms, H., Eds.; Verlag von Wilhelm Engelmann: Leizpig, Germany, 1936; pp. 227–658. [Google Scholar]
  2. Perfectti, F.; Gómez, J.M.; González-Megías, A.; Abdelaziz, M.; Lorite, J. Molecular phylogeny and evolutionary history of Moricandia DC (Brassicaceae). PeerJ 2017, 5, e3964. [Google Scholar] [CrossRef] [PubMed]
  3. POWO. Plants of the World Online. Facilitated by the Royal Botanic Gardens, Kew. Available online: https://powo.science.kew.org/ (accessed on 23 October 2024).
  4. Tahir, M.; Watts, R. Moricandia. In Wild Crop Relatives Genomic and Breeding Resources; Kole, C., Ed.; Springer: Berlin, Germany, 2011. [Google Scholar]
  5. De Bolòs, A. El género Moricandia en la Península Ibérica. An. Jard. Bot. Madr. 1946, 6, 451–461. [Google Scholar]
  6. Heywood, V. Moricandia DC. In Flora Europaea, Vol. I; Vaughan, J.G., MacLeod, A.J., Jones, B.M.G., Eds.; Academic Press: London, UK, 1964. [Google Scholar]
  7. Maire, R. Flore de L’Afrique du Nord, Vol. XIII; Editions Paul Lechevalier: Paris, France, 1967. [Google Scholar]
  8. Schulz, O.E. Cruciferae-Brassicaceae. Part II. Subtribes Cakilinae, Zillinae, Vellinae, Savignyinae and Moricandiinae. Pflanzer 1923, 82–85, 1–100. [Google Scholar]
  9. Gómez-Campo, C. Morphology and morphotaxonomy of the tribe Brassiceae. In Brassica Crops and Wild Allies: Biology and Breeding; Tsunoda, S., Hinata, K., Gómez-Campo, C., Eds.; Japan Scientific Soc. Press: Tokio, Japan, 1980; pp. 3–31. [Google Scholar]
  10. Warwick, S.I.; Black, L.D. Evaluation of the subtribes Moricandiinae, Savignyinae, Vellinae, and Zillinae (Brassicaceae, tribe Brassiceae) using chloroplast DNA restriction site variation. Canad. J. Bot. 1994, 72, 1692–1701. [Google Scholar] [CrossRef]
  11. Warwick, S.I.; Sauder, C.A. Phylogeny of tribe Brassiceae (Brassicaceae) based on chloroplast restriction site polymorphisms and nuclear ribosomal internal transcribed spacer and chloroplast trn L intron sequences. Canad. J. Bot. 2005, 83, 467–483. [Google Scholar] [CrossRef]
  12. Warwick, S.I.; Black, L.D. Phylogenetic implications of chloroplast DNA restriction site variation in subtribes Raphaninae and Cakilinae (Brassicaceae, tribe Brassiceae). Canad. J. Bot. 1997, 75, 960–973. [Google Scholar] [CrossRef]
  13. Bailey, C.D.; Koch, M.A.; Mayer, M.; Mummenhoff, K.; O’Kane, S.L.; Warwick, S.I.; Windham, M.D.; Al-Shehbaz, I.A. Toward a global phylogeny of the Brassicaceae. Mol. Biol. Evol. 2006, 23, 2142–2160. [Google Scholar] [CrossRef]
  14. Jiménez, J.F.; Sánchez-Gómez, P. Molecular taxonomy and genetic diversity of Moricandia moricandioides subsp. pseudofoetida compared to wild relatives. Plant Biosyst. 2012, 146, 99–105. [Google Scholar] [CrossRef]
  15. Schlüter, U.; Bräutigam, A.; Gowik, U.; Melzer, M.; Christin, P.-A.; Kurz, S.; Mettler-Altmann, T.; Weber, A.P.M. Photosynthesis in C3-C4 intermediate Moricandia species. J. Exp. Bot. 2016, 68, 191–206. [Google Scholar] [CrossRef]
  16. Couvreur, T.L.; Franzke, A.; Al-Shehbaz, I.A.; Bakker, F.T.; Koch, M.A.; Mummenhoff, K. Molecular phylogenetics, temporal diversification, and principles of evolution in the mustard family (Brassicaceae). Mol. Biol. Evol. 2010, 27, 55–71. [Google Scholar] [CrossRef]
  17. Sánchez-Gómez, P.; Vera, J.B.; Jiménez, J.F.; López, D.; Mota, J.F. Moricandia moricandioides subsp. cavanillesiana (Font Quer & A. Bolòs) Greuter & Burdet. In Diversidad Vegetal de las Yeseras Ibéricas. El Reto de los Archipiélagos Edáficos Para la Biología de la Conservación; Mota, J.F., Sánchez-Gómez, P., Guirado, J.S., Eds.; ADIF—Mediterráneo Asesores Consultores: Almería, Spain, 2011; pp. 245–247. [Google Scholar]
  18. Salmerón-Sánchez, E.; Merlo, M.E.; Medina-Cazorla, J.M.; Pérez-García, F.J.; Martínez-Hernández, F.; Garrido-Becerra, J.A.; Mendoza-Fernández, A.J.; Valle, F.; Mota, J.F. Variability, genetic structure and phylogeography of the dolomitophilous species Convolvulus boissieri (Convolvulaceae) in the Baetic ranges, inferred from AFLPs, plastid DNA and ITS sequences. Bot. J. Linn. Soc. 2014, 176, 506–523. [Google Scholar] [CrossRef]
  19. Martínez-Nieto, M.I.; Segarra-Moragues, J.G.; Merlo, E.; Martínez-Hernández, F.; Mota, J.F. Genetic diversity, genetic structure and phylogeography of the Iberian endemic Gypsophila struthium (Caryophyllaceae) as revealed by AFLP and plastid DNA sequences: Connecting habitat fragmentation and diversification. Bot. J. Linn. Soc. 2013, 173, 654–675. [Google Scholar] [CrossRef]
  20. Salmerón-Sánchez, E.; Martínez-Nieto, M.I.; Martínez-Hernández, F.; Garrido-Becerra, J.A.; Mendoza-Fernández, A.J.; de Carrasco, C.G.; Ramos-Miras, J.J.; Lozano, R.; Merlo, M.E. Ecology, genetic diversity and phylogeography of the Iberian endemic plant Jurinea pinnata (Lag.) DC.(Compositae) on two special edaphic substrates: Dolomite and gypsum. Plant Soil 2014, 374, 233–250. [Google Scholar] [CrossRef]
  21. Salmerón-Sánchez, E.; Martínez-Ortega, M.M.; Mota, J.F.; Peñas, J. A complex history of edaphic habitat islands on the Iberian Peninsula: Phylogeography of the halo-gypsophyte Jacobaea auricula (Asteraceae). Bot. J. Linn. Soc. 2017, 185, 376–392. [Google Scholar] [CrossRef]
  22. Blanco-Sánchez, M.; Moore, M.J.; Ramos-Muñoz, M.; Pías, B.; García-Fernández, A.; Prieto, M.; Plaza, L.; Isabel, I.; Escudero, A.; Matesanz, S. Phylogeography of a gypsum endemic plant across its entire distribution range in the western Mediterranean. Am. J. Bot. 2021, 108, 443–460. [Google Scholar] [CrossRef]
  23. Nieto Feliner, G. Patterns and processes in plant phylogeography in the Mediterranean Basin. A review. Perspect. Plant Ecol. Evol. Syst. 2014, 16, 265–278. [Google Scholar] [CrossRef]
  24. Vitales, D.; García-Fernández, A.; Garnatje, T.; Vallès, J.; Cowan, R.S.; Fay, M.F.; Pellicer, J. Conservation genetics of the rare Iberian endemic Cheirolophus uliginosus (Asteraceae). Bot. J. Linn. Soc. 2015, 179, 151–171. [Google Scholar] [CrossRef]
  25. Médail, F.; Diadema, K. Glacial refugia influence plant diversity patterns in the Mediterranean Basin. J. Biogeogr. 2009, 36, 1333–1345. [Google Scholar] [CrossRef]
  26. Zietkiewicz, E.; Rafalski, A.; Labuda, D. Genome fingerprinting by simple sequence repeat (SSR)-anchored polymerase chain reaction amplification. Genomics 1994, 20, 176–183. [Google Scholar] [CrossRef]
  27. Williams, J.G.; Kubelik, A.R.; Livak, K.J.; Rafalski, J.A.; Tingey, S.V. DNA polymorphisms amplified by arbitrary primers are useful as genetic markers. Nucleic Acids Res. 1990, 18, 6531–6535. [Google Scholar] [CrossRef]
  28. Rafalski, J.A.; Vogel, J.M.; Morgante, M.; Powell, W.; Andre, C.; Tingey, S.V. Generating and using DNA markers in plants. In Nonmammalian Genomic Analysis: A Practical Guide; Brain, B., Lai, E., Eds.; Academic Press: San Diego, CA, USA, 1998; pp. 75–134. [Google Scholar] [CrossRef]
  29. Wolfe, A.D.; Xiang, Q.Y.; Kephart, S.R. Assessing hybridization in natural populations of Penstemon (Scrophulariaceae) using hypervariable intersimple sequence repeat (ISSR) bands. Mol. Ecol. 1998, 7, 1107–1125. [Google Scholar] [CrossRef] [PubMed]
  30. Wolfe, A.D.; Randle, C.P. Relationships within and among species of the holoparasitic genus Hyobanche (Orobanchaceae) inferred from ISSR banding patterns and nucleotide sequences. Syst. Bot. 2001, 26, 120–130. [Google Scholar]
  31. Grimalt, M.; García-Martínez, S.; Carbonell, P.; Hernández, F.; Legua, P.; Almansa, M.S.; Amorós, A. Relationships between chemical composition, antioxidant activity and genetic analysis with ISSR markers in flower buds of caper plants (Capparis spinosa L.) of two subspecies spinosa and rupestris of Spanish cultivars. Genet. Resour. Crop Evol. 2022, 69, 1451–1469. [Google Scholar] [CrossRef]
  32. Bodo Slotta, T.A.; Porter, D.M. Genetic variation within and between Iliamna corei and I. remota (Malvaceae): Implications for species delimitation. Bot. J. Linn. Soc. 2006, 151, 345–354. [Google Scholar] [CrossRef]
  33. Galván, M.Z.; Lanteri, A.A.; Menendez Sevillano, M.D.C.; Balatti, P.A. Molecular characterisation of wild populations and landraces of common bean from northwestern Argentina. Plant Biosyst. 2010, 144, 365–372. [Google Scholar] [CrossRef]
  34. Ramírez-Rodriguez, R.; Jiménez, J.F.; Amich, F.; Sánchez-Gómez, P. Plastid phylogeography of Delphinium fissum subsp. sordidum and the series Fissa (Ranunculaceae) in the Iberian Peninsula: Implications for conservation. Bot. Lett. 2019, 166, 345–355. [Google Scholar] [CrossRef]
  35. Salmerón-Sánchez, E.; Fuertes-Aguilar, J.; Španiel, S.; Pérez-García, F.J.; Merlo, E.; Garrido-Becerra, J.A.; Mota, J.F. Plant evolution in alkaline magnesium-rich soils: A phylogenetic study of the Mediterranean genus Hormathophylla (Cruciferae: Alysseae) based on nuclear and plastid sequences. PLoS ONE 2018, 13, e0208307. [Google Scholar] [CrossRef]
  36. Richardson, J.E.; Pennington, R.T.; Pennington, T.D.; Hollingsworth, P.M. Rapid diversification of a species-rich genus of neotropical rain forest trees. Science 2001, 293, 2242–2245. [Google Scholar] [CrossRef]
  37. White, T.J.; Bruns, T.D.; Lee, S.B.; Taylor, J.W. Amplification and direct sequencing of fungal ribosomal RNA genes for phylogenetics. In PCR Protocols: A Guide to Methods and Applications; Innis, M.A., Gelfand, D.H., Sninsky, J.J., White, T.J., Eds.; Academic Press: New York, NY, USA, 1990; pp. 315–321. [Google Scholar] [CrossRef]
  38. Taberlet, P.; Gielly, L.; Pautou, G.; Bouvet, J. Universal primers for amplification of three non-coding regions of chloroplast DNA. Plant Mol. Biol. 1991, 17, 1105–1109. [Google Scholar] [CrossRef]
  39. Grosberg, R.K.; Levitan, D.R.; Cameron, B.B. Characterization of genetic structure and genealogies using RAPD-PCR markers: A random primer for the novice and nervous. In Molecular Zoology. Advances, Strategies, and Protocols; Ferraris, J.D., Palumbi, S.R., Eds.; Wiley-Liss: New York, NY, USA, 1996; pp. 67–100. [Google Scholar]
  40. Lynch, M.M.; Milligan, B.G. Analysis of population genetic structure with RAPD markers. Mol. Ecol. 1994, 3, 91–99. [Google Scholar] [CrossRef]
  41. Nei, M. Estimation of average heterozygosity and genetic distance from a small number of individuals. Genetics 1978, 89, 583–590. [Google Scholar] [CrossRef] [PubMed]
  42. Hammer, Ø.; Harper, D.A.; Ryan, P.D. PAST: Paleontological statistics software package for education and data analysis. Palaeontol. Electron. 2001, 4, 9. [Google Scholar]
  43. Schönswetter, P.; Tribsch, A. Vicariance and dispersal in the alpine perennial Bupleurum stellatum L. (Apiaceae). Taxon 2005, 54, 725–732. [Google Scholar] [CrossRef]
  44. Crisp, M.D.; Laffan, S.; Linder, H.P.; Monro, A. Endemism in the Australian flora. J. Biogeogr. 2001, 28, 183–198. [Google Scholar] [CrossRef]
  45. Ehrich, D. AFLPdat: A collection of R functions for convenient handling of AFLP data. Mol. Ecol. Notes 2006, 6, 603–604. [Google Scholar] [CrossRef]
  46. Excoffier, L.; Smouse, P.E.; Quattro, J.M. Analysis of molecular variance inferred from metric distances among DNA haplotypes: Application to human mitochondrial DNA restriction data. Genetics 1992, 131, 479–491. [Google Scholar] [CrossRef]
  47. Pritchard, J.K.; Stephens, M.; Rosenberg, N.A.; Donnelly, P. Association mapping in structured populations. Am. J. Hum. Genet. 2000, 67, 170–181. [Google Scholar] [CrossRef]
  48. Falush, D.; Stephens, M.; Pritchard, J.K. Inference of population structure using multilocus genotype data: Dominant markers and null alleles. Mol. Ecol. Notes 2007, 7, 574–578. [Google Scholar] [CrossRef]
  49. Pritchard, J.K.; Wen, W. Documentation for Structure Software: Version 2; University of Chicago: Chicago, IL, USA, 2004. [Google Scholar]
  50. Falush, D.; Stephens, M.; Pritchard, J.K. Inference of population structure using multilocus genotype data: Linked loci and correlated allele frequencies. Genetics 2003, 164, 1567–1587. [Google Scholar] [CrossRef]
  51. Earl, D.A.; VonHoldt, B.M. STRUCTURE HARVESTER: A website and program for visualizing STRUCTURE output and implementing the Evanno method. Conserv. Genet. Resour. 2012, 4, 359–361. [Google Scholar] [CrossRef]
  52. Evanno, G.; Regnaut, S.; Goudet, J. Detecting the number of clusters of individuals using the software STRUCTURE: A simulation study. Mol. Ecol. 2005, 14, 2611–2620. [Google Scholar] [CrossRef] [PubMed]
  53. Jakobsson, M.; Rosenberg, N.A. CLUMPP: A cluster matching and permutation program for dealing with label switching and multimodality in analysis of population structure. Bioinformatics 2007, 23, 1801–1806. [Google Scholar] [CrossRef] [PubMed]
  54. Rosenberg, N.A. DISTRUCT: A program for the graphical display of population structure. Mol. Ecol. Notes 2004, 4, 137–138. [Google Scholar] [CrossRef]
  55. Templeton, A.R.; Crandall, K.A.; Sing, C.F. A cladistic analysis of phenotypic associations with haplotypes inferred from restriction endonuclease mapping and DNA sequence data. III. Cladogram estimation. Genetics 1992, 132, 619–633. [Google Scholar] [CrossRef]
  56. Clement, M.; Posada, D.; Crandall, K.A. TCS: A computer program to estimate gene genealogies. Mol. Ecol. 2000, 9, 1657–1659. [Google Scholar] [CrossRef]
  57. Nei, M. Molecular Evolutionary Genetics; Columbia University Press: New York, NY, USA, 1987. [Google Scholar] [CrossRef]
  58. Librado, P.; Rozas, J. DnaSP v5: A software for comprehensive analysis of DNA polymorphism data. Bioinformatics 2009, 25, 1451–1452. [Google Scholar] [CrossRef]
  59. Stamatakis, A. RAxML-VI-HPC: Maximum likelihood-based phylogenetic analyses with thousands of taxa and mixed models. Bioinformatics 2006, 22, 2688–2690. [Google Scholar] [CrossRef]
  60. Ronquist, F.; Huelsenbeck, J.P. MrBayes 3: Bayesian phylogenetic inference under mixed models. Bioinformatics 2003, 19, 1572–1574. [Google Scholar] [CrossRef]
  61. Posada, D. jModelTest: Phylogenetic model averaging. Mol. Biol. Evol. 2008, 25, 1253–1256. [Google Scholar] [CrossRef]
  62. Pattengale, N.D.; Alipour, M.; Bininda-Emonds, O.R.; Moret, B.M.; Stamatakis, A. How many bootstrap replicates are necessary? In Annual International Conference on Research in Computational Molecular Biology; Batzoglou, S., Ed.; Springer: Berlin/Heidelberg, Germany, 2009; pp. 184–200. [Google Scholar] [CrossRef]
  63. Alfaro, M.E.; Zoller, S.; Lutzoni, F. Bayes or bootstrap? A simulation study comparing the performance of Bayesian Markov chain Monte Carlo sampling and bootstrapping in assessing phylogenetic confidence. Mol. Biol. Evol. 2003, 20, 255–266. [Google Scholar] [CrossRef]
  64. Drummond, A.J.; Ho, S.Y.W.; Phillips, M.J.; Rambaut, A. Relaxed phylogenetics and dating with confidence. PLoS Biol. 2006, 4, e88. [Google Scholar] [CrossRef] [PubMed]
  65. Drummond, A.J.; Rambaut, A. BEAST: Bayesian evolutionary analysis by sampling trees. BMC Evol. Biol. 2007, 7, 214. [Google Scholar] [CrossRef] [PubMed]
  66. Rambaut, A.; Drummond, A.J.; Xie, D.; Baele, G.; Suchard, M.A. Posterior summarization in Bayesian phylogenetics using Tracer 1.7. Syst. Biol. 2018, 67, 901. [Google Scholar] [CrossRef] [PubMed]
  67. Rambaut, A. Figtree ver 1.4.4; Institute of Evolutionary Biology, University of Edinburgh: Edinburgh, UK, 2018. [Google Scholar]
  68. Cuenot, Y.; Gómez, J.M.; González-Megias, A.; Pannell, J.R.; Torices, R. Characterization of microsatellite markers for Moricandia moricandioides (Brassicaceae) and related species. Appl. Plant Sci. 2018, 6, e01172. [Google Scholar] [CrossRef]
  69. Nybom, H. Comparison of different nuclear DNA markers for estimating intraspecific genetic diversity in plants. Mol. Ecol. 2004, 13, 1143–1155. [Google Scholar] [CrossRef]
  70. Valtueña, F.J.; Fernández-Mazuecos, M.; Rodríguez-Riaño, T.; López, J.; Ortega-Olivencia, A. Repeated jumps from Northwest Africa to the European continent: The case of peripheral populations of an annual plant. J. Syst. Evol. 2020, 58, 487–503. [Google Scholar] [CrossRef]
  71. Díaz-Pérez, A.; Sequeira, M.; Santos-Guerra, A.; Catalán, P. Multiple colonizations, in situ speciation, and volcanism-associated stepping-stone dispersals shaped the phylogeography of the Macaronesian red fescues (Festuca L., Gramineae). Syst. Biol. 2008, 57, 732–749. [Google Scholar] [CrossRef]
  72. Pérez-Collazos, E.; Sanchez-Gómez, P.; Jiménez, J.F.; Catalán, P. The phylogeographical history of the Iberian steppe plant Ferula loscosii (Apiaceae): A test of the abundant-centre hypothesis. Mol. Ecol. 2009, 18, 848–861. [Google Scholar] [CrossRef]
  73. Alarcón, M.; Vargas, P.; Sáez, L.; Molero, J.; Aldasoro, J.J. Genetic diversity of mountain plants: Two migration episodes of Mediterranean Erodium (Geraniaceae). Mol. Phylogenet. Evol. 2012, 63, 866–876. [Google Scholar] [CrossRef]
  74. Garnatje, T.; Pérez-Collazos, E.; Pellicer, J.; Catalán, P. Balearic insular isolation and large continental spread framed the phylogeography of the western Mediterranean Cheirolophus intybaceus sl (Asteraceae). Plant Biol. 2013, 15, 166–175. [Google Scholar] [CrossRef]
  75. Thompson, J.D. Plant Evolution in the Mediterranean; Oxford University Press: Oxford, UK, 2005. [Google Scholar] [CrossRef]
  76. Valente, L.M.; Savolainen, V.; Vargas, P. Unparalleled rates of species diversification in Europe. Proc. Biol. Sci. 2010, 277, 1489–1496. [Google Scholar] [CrossRef] [PubMed]
  77. Guzmán, B.; Vargas, P. Historical biogeography and character evolution of Cistaceae (Malvales) based on analysis of plastid rbcL and trnL-trnF sequences. Org. Divers. Evol. 2009, 9, 83–99. [Google Scholar] [CrossRef]
  78. Fauquette, S.; Suc, J.P.; Guiot, J.; Diniz, F.; Feddi, N.; Zheng, Z.; Bessais, E.; Drivaliari, A. Climate and biomes in the West Mediterranean area during the Pliocene. Palaeogeogr. Palaeoclimatol. Palaeoecol. 1999, 152, 15–36. [Google Scholar] [CrossRef]
  79. Hewitt, G. The genetic legacy of the Quaternary ice ages. Nature 2000, 405, 907–913. [Google Scholar] [CrossRef]
  80. Jiménez-Moreno, G.; Fauquette, S.; Suc, J.P. Miocene to Pliocene vegetation reconstruction and climate estimates in the Iberian Peninsula from pollen data. Rev. Palaeobot. Palynol. 2010, 162, 403–415. [Google Scholar] [CrossRef]
  81. Gutiérrez Larena, B.; Fuertes Aguilar, J.; Nieto Feliner, G. Glacial-induced altitudinal migrations in Armeria (Plumbaginaceae) inferred from patterns of chloroplast DNA haplotype sharing. Mol. Ecol. 2002, 11, 1965–1974. [Google Scholar] [CrossRef] [PubMed]
  82. Nieto Feliner, G.; Gutiérrez Larena, B.; Fuertes Aguilar, J. Fine scale geographical structure, intra-individual polymorphism and recombination in nuclear ribosomal internal transcribed spacers in Armeria (Plumbaginaceae). Ann Bot. 2004, 93, 189–200. [Google Scholar] [CrossRef]
  83. Fuertes-Aguilar, J.; Gutiérrez Larena, B.; Nieto Feliner, G. Genetic and morphological diversity in Armeria (Plumbaginaceae) is shaped by glacial cycles in Mediterranean refugia. An. Jard. Bot. Madr. 2011, 68, 175–197. [Google Scholar] [CrossRef]
  84. Rajakaruna, N. Lessons on evolution from the study of edaphic specialization. Bot. Rev. 2018, 84, 39–78. [Google Scholar] [CrossRef]
  85. Cowling, R.M.; Rundel, P.W.; Lamont, B.B.; Arroyo, M.K.; Arianoutsou, M. Plant diversity in mediterranean-climate regions. Tree 1996, 11, 362–366. [Google Scholar] [CrossRef]
  86. Givnish, T.J. Ecology of plant speciation. Taxon 2010, 59, 1326–1366. [Google Scholar] [CrossRef]
  87. Sobrino-Vesperinas, E. Interfertility in the genus Moricandia DC. Lagascalia 1997, 19, 839–844. [Google Scholar]
  88. Sobrino-Vesperinas, E. Moricandia DC. In Flora Iberica. Vol. 4; Castroviejo, S., Aedo, C., Laínz, M., Muñoz Garmendia, F., Nieto Feliner, G., Paiva, J., Benedí, C., Eds.; Real Jardín Botánico, CSIC: Madrid, Spain, 1993; pp. 338–344. [Google Scholar]
Figure 1. Distribution area of Moricandia moricandioides subspecies. Numbers indicate location of populations sampled. Information about each population is listed in Table 1.
Diversity 17 00310 g001
Figure 2. The principal coordinate analysis of the 304 individuals from 16 sampled populations of Moricandia moricandioides based on pairwise Nei’s genetic distances. The symbols belonging to each subspecies are colored equally. Numbers of each population are listed in Table 1.
Diversity 17 00310 g002
Figure 3. (A) Geographical distribution of ribotypes found in Moricandia moricandioides using nrITS sequences. (B) Relationships of ITS ribotypes shown as ribotype network. Line connecting two squares means single mutational step (95% confidence level); missing ribotypes are represented by white dots. Number of populations are listed in Table 1.
Diversity 17 00310 g003
Figure 4. (A) Geographical distribution of haplotypes found in Moricandia moricandioides using plastid sequences. (B) Relationships between plastid DNA haplotypes shown as haplotype network. A line connecting two squares means single mutational step; missing haplotypes are represented by white dots. Number of populations are listed in Table 1.
Diversity 17 00310 g004
Figure 5. Phylogenetic tree generated in estimation of divergence times among Moricandia moricandioides samples from nrITS sequences using BEAST. Time scale is in millions of years. Blue error bars at each node show 95% highest posterior density for node age. Values to left of each node show Bayesian posterior probability.
Diversity 17 00310 g005
Table 1. Names and details of the sampling sites, ISSR, haplotype descriptors, and ribosomal sequences of M. moricandioides populations. Pop., population name; Pop. Code, number of population through the manuscript.; SUBSP., each subspecies of M. moricandioides; Long and Lat, geographic coordinates (longitude, latitude); PL, polymorphic loci; PLP, percentage of polymorphic loci in each population; He, expected heterozigosity; Hap, number of haplotypes per population; Hd, haplotypic diversity; Nd, nucleotide diversity; Hgroup, haplogroup.
Geogr. CoordISSR AnalysiscpDNA Analysis nrITS Analysis
Pop.Pop. CodeSUBSP.Long.Lat.ISSR SamplesPLPLPHecpDNA SamplesHapHdNdHgroupHaplotypeITS
Samples
Ribotype
Antequera, Málaga1baetica37.01−4.32042600.181995100210 (5)1I
Canjáyar, Almeria2baetica36.59−2.41203752.90.16115530.80.0017711 (2), 6 (2), 8 (2)1I
Σ 0.171571040.7330.00251.21, 6, 8, 10
Ascó, Tarragona3cavanillesiana41.10.33203651.40.143075100131
Granja Escarp, Lleida4cavanillesiana41.090.15203144.30.10265100131I
Σ 0.1228351010013
Galera, Granada5giennensis37.36−2.4204665.70.22134520.40.001521.27 (1), 11 (4)1I
Huelma, Jaén6giennensis37.39−3.27205172.90.2603520.60.0007611 (3), 5 (2)1IV
Moratalla, Murcia7giennensis38.1−2.12204462.90.23398510029 (5)1I
Lorca, Murcia8giennensis37.52−1.56204462.90.23799510011 (5)1I
Σ 0.23840252050.7630.002491.21, 5, 7, 9, 11
Valdemoro, Cuenca9moricandioides40.15−2.37203651.40.12841510011 (5)1III
Humosa, Madrid10moricandioides37.01−4.3204158.60.18451510014 (5)1I
Near Palencia11moricandioides41.56−4.25203955.70.15399510011 (5)1I
South of Almazan, Soria12moricandioides41.17−2.23103347.10.13725510011 (5)1I
Σ 0.151042020.3950.000511, 4
Emb. Rodeos, Murcia13pseudofoetida38.2−1.17204665.70.22377510022 (5)1II
Fortuna, Murcia14pseudofoetida38.12−1.042056800.2767530.70.0010122 (3), 15 (1), 16 (1)1II
El Garruchal, Murcia15pseudofoetida37.56−1.03204868.60.22371530.80.0024322 (2), 13 (2), 14 (1)1II
Ricote, Murcia16pseudofoetida38.08−1.221449700.24874520.40.0005122 (1), 12 (4)1II
Σ 0.243232060.6740.0014122, 12, 13, 14, 15, 16 I
Disclaimer/Publisher’s Note: The statements, opinions and data contained in all publications are solely those of the individual author(s) and contributor(s) and not of MDPI and/or the editor(s). MDPI and/or the editor(s) disclaim responsibility for any injury to people or property resulting from any ideas, methods, instructions or products referred to in the content.

