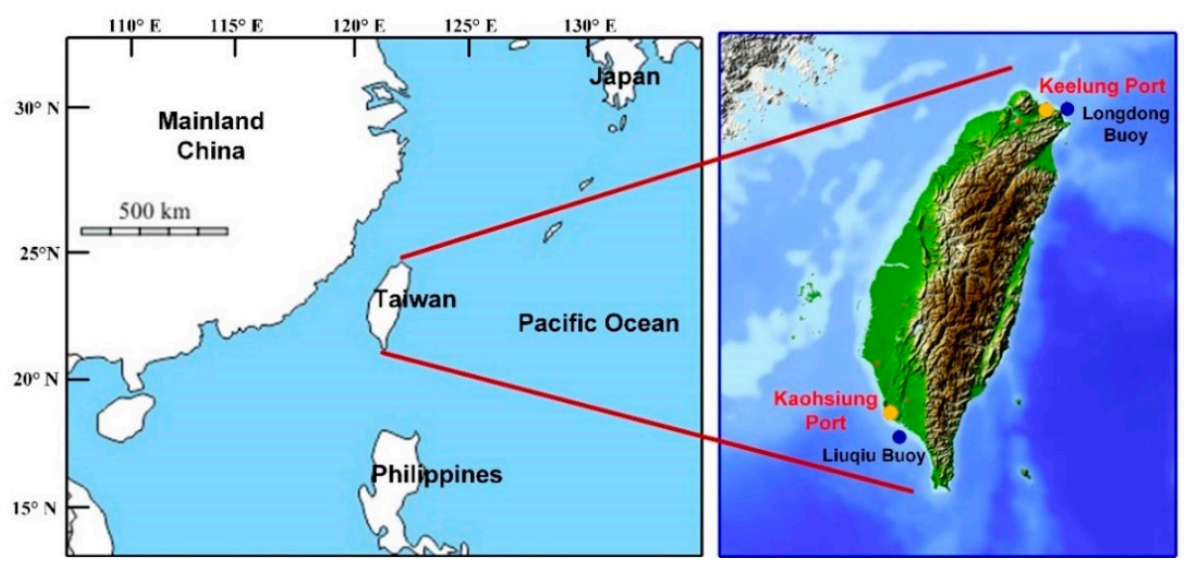
Figure 1.
Locations of Taiwan, Keelung Port, and Kaohsiung Port.
Figure 1.
Locations of Taiwan, Keelung Port, and Kaohsiung Port.
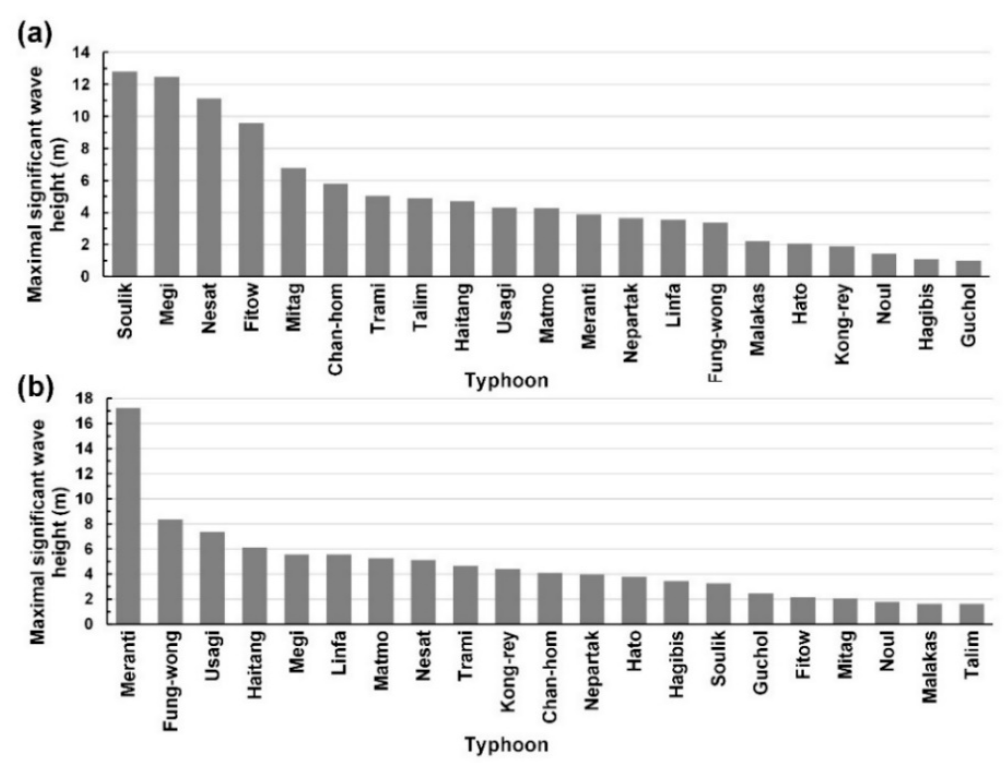
Figure 2.
Maximal significant wave height for the typhoons at (a) Longdong Buoy and (b) Liuqiu Buoy.
Figure 2.
Maximal significant wave height for the typhoons at (a) Longdong Buoy and (b) Liuqiu Buoy.
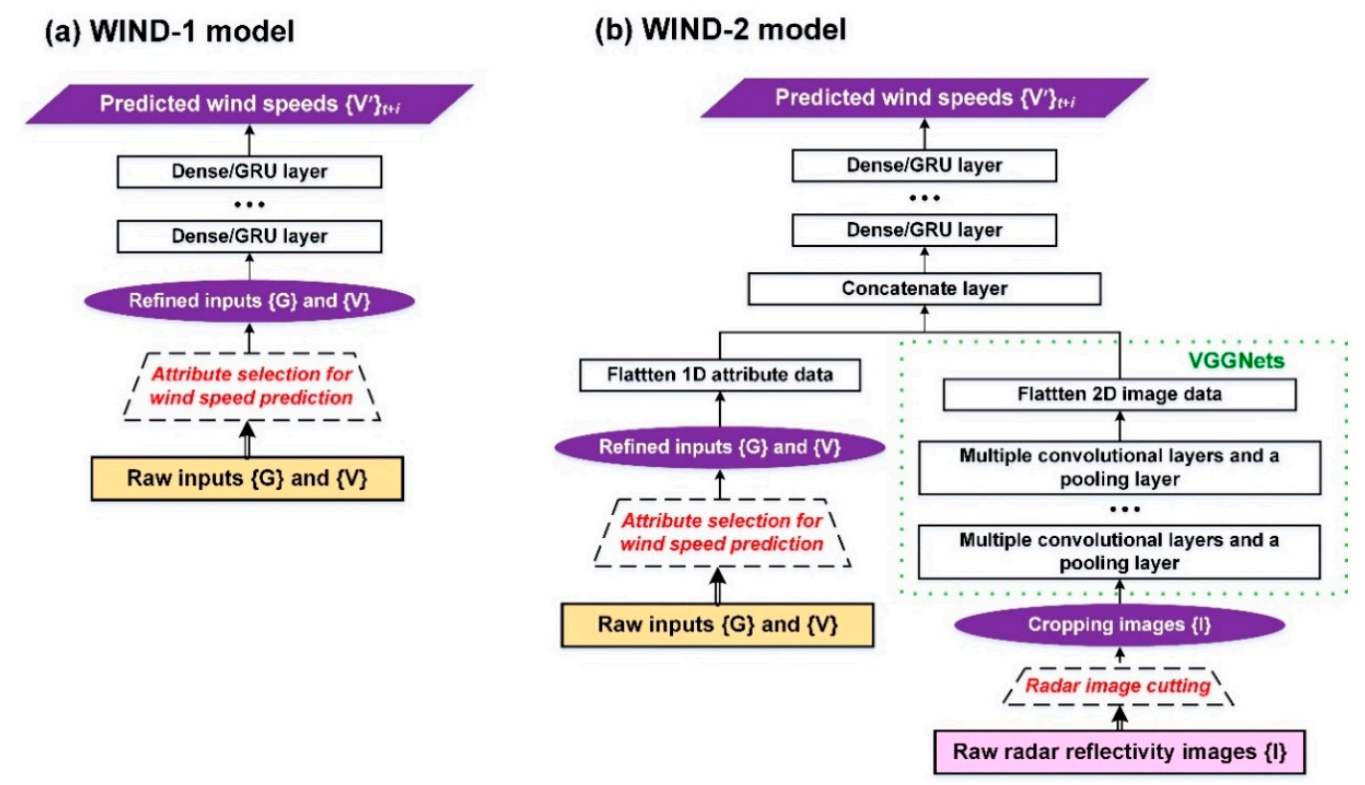
Figure 3.
Schematics of the wind prediction models: (a) WIND-1 and (b) WIND-2.
Figure 3.
Schematics of the wind prediction models: (a) WIND-1 and (b) WIND-2.
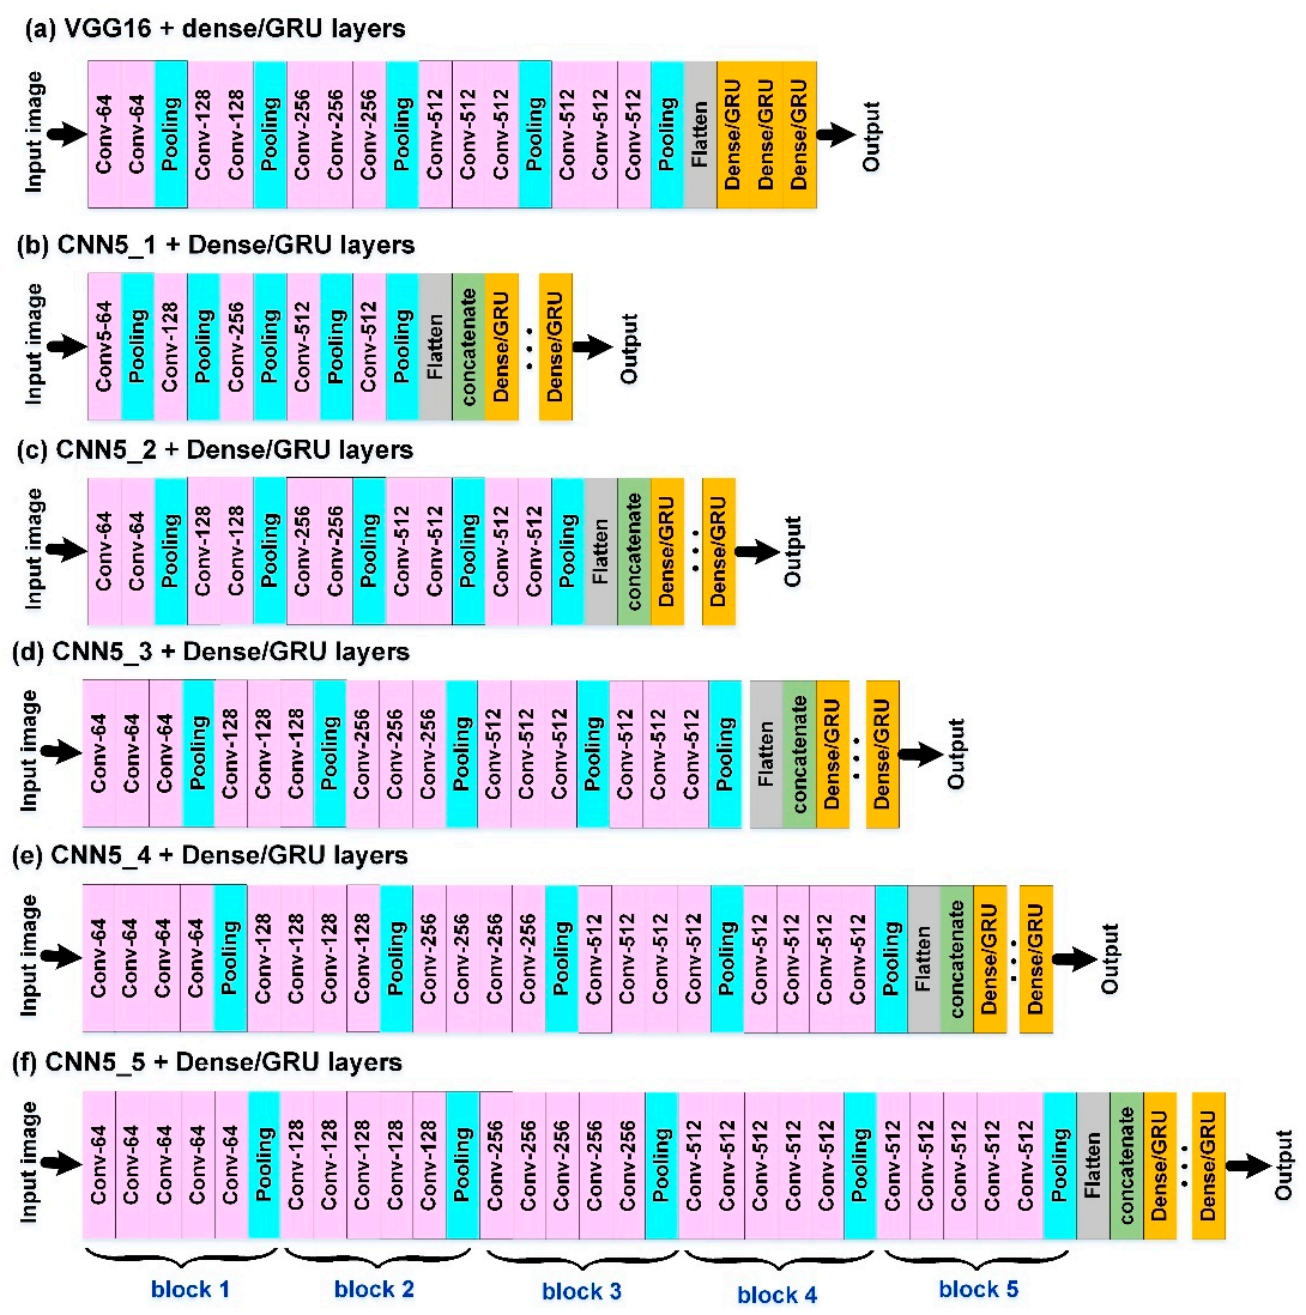
Figure 4.
Architectures of the VGGNets of (a) classical VGG16 and the variations of (b) CNN5_1, (c) CNN5_2, (d) CNN5_3, (e) CNN5_4, and (f) CNN5_5 (in the figure, the input image size is 64 × 64 pixels as an example).
Figure 4.
Architectures of the VGGNets of (a) classical VGG16 and the variations of (b) CNN5_1, (c) CNN5_2, (d) CNN5_3, (e) CNN5_4, and (f) CNN5_5 (in the figure, the input image size is 64 × 64 pixels as an example).
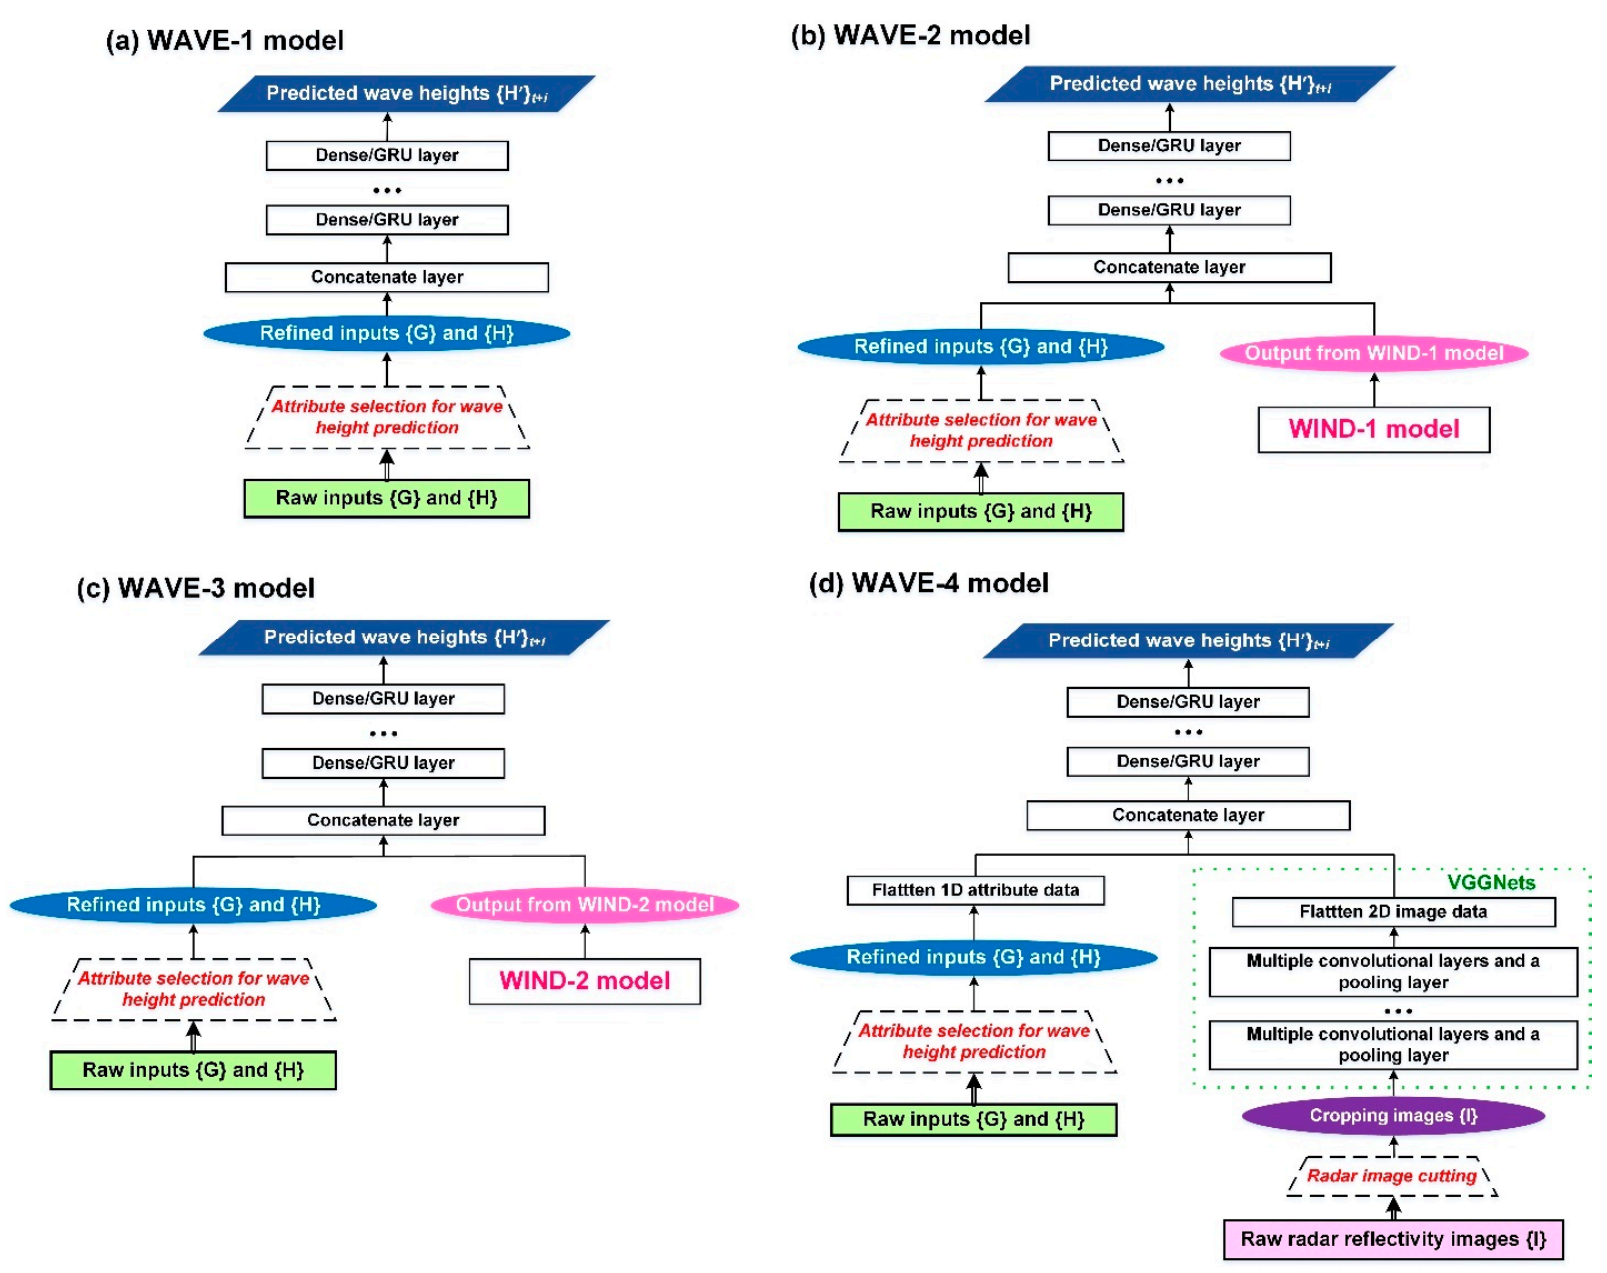
Figure 5.
Schematics of the wave height prediction models: (a) WAVE-1, (b) WAVE-2, (c) WAVE-3, and (d) WAVE-4.
Figure 5.
Schematics of the wave height prediction models: (a) WAVE-1, (b) WAVE-2, (c) WAVE-3, and (d) WAVE-4.
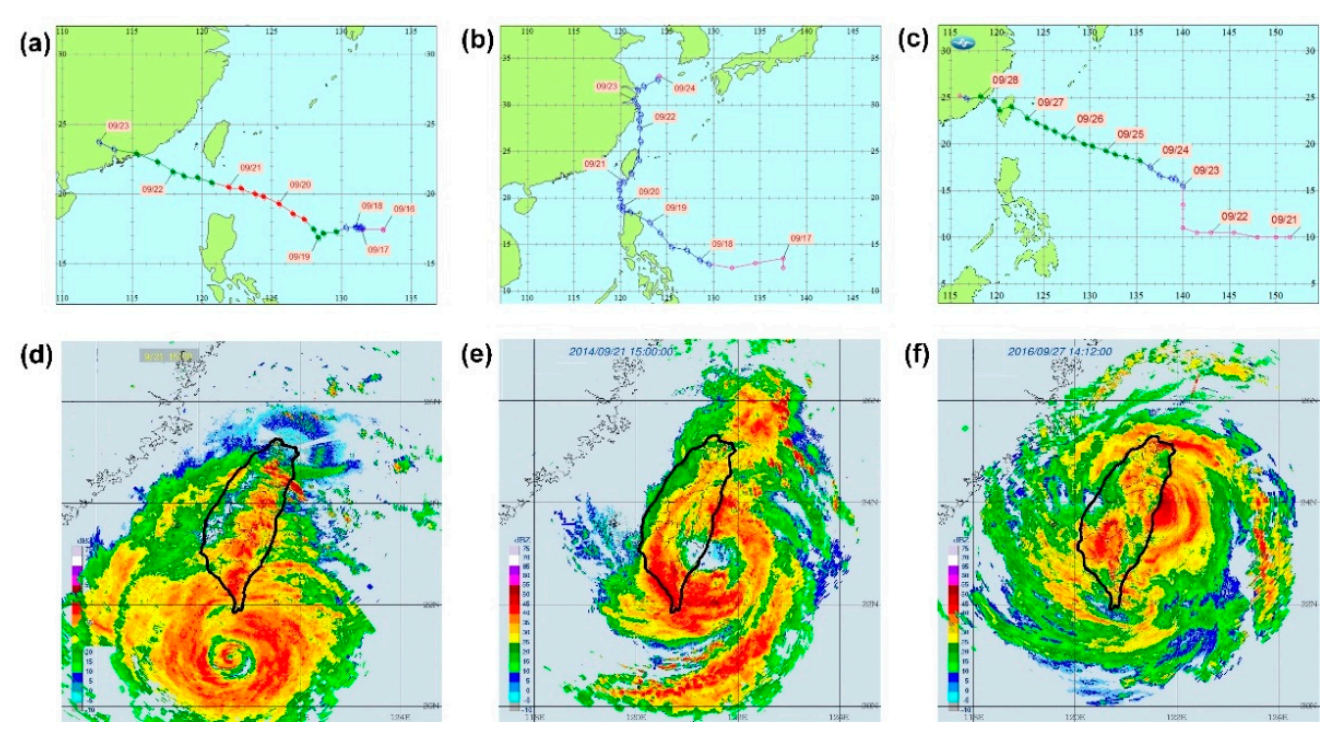
Figure 6.
Paths of (a) Typhoon Usagi in 2013, (b) Typhoon Fung-wong in 2014, and (c) Typhoon Megi in 2016, as well as the radar reflectivity imagery of (d) Typhoon Usagi at 15:00 local standard time (LST) on 21 September 2013, (e) Typhoon Fung-wong at 15:00 LST on 21 September 2014, and (f) Typhoon Megi at 14:00 LST on 27 September 2016.
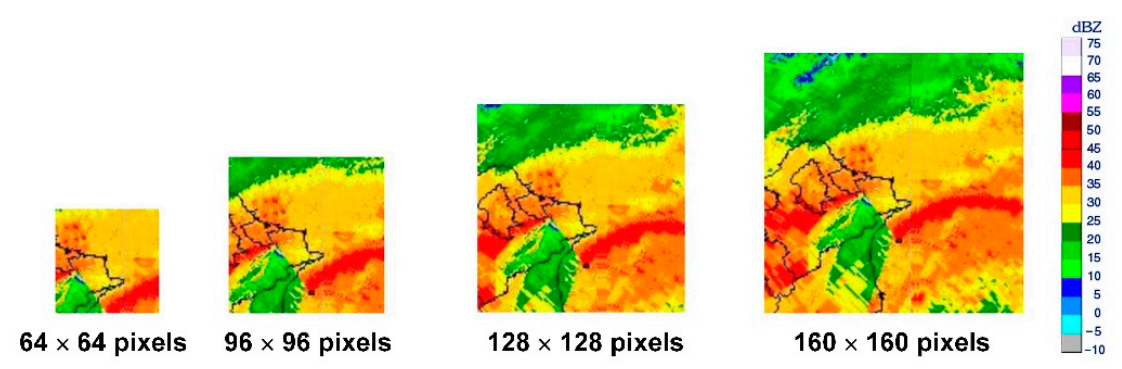
Figure 7.
Cropped radar reflectivity images for Typhoon Megi.
Figure 7.
Cropped radar reflectivity images for Typhoon Megi.
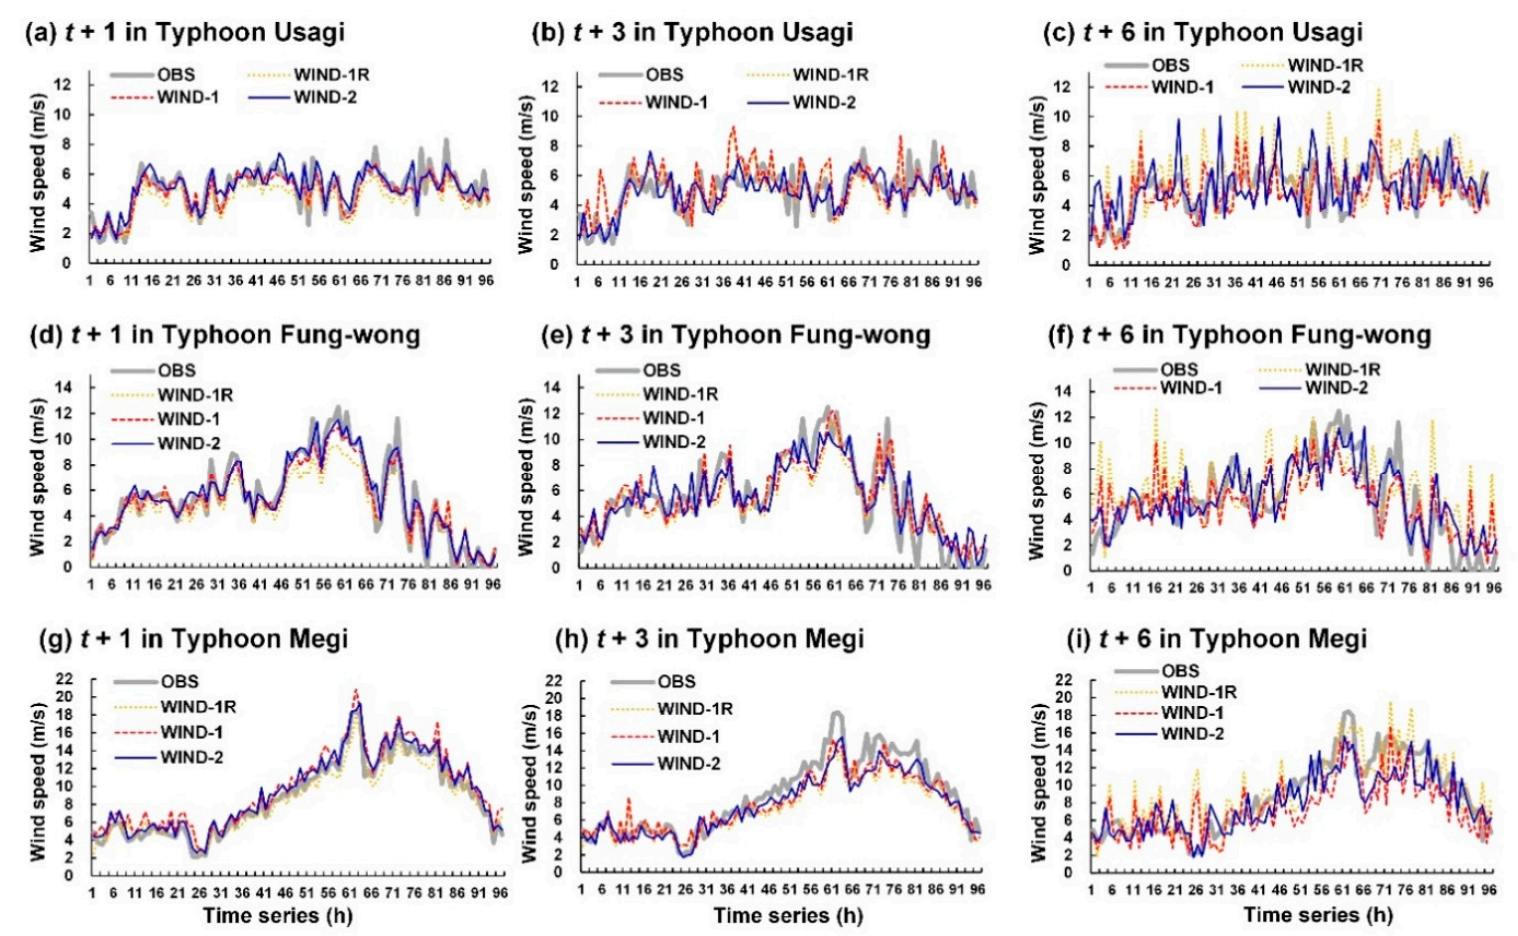
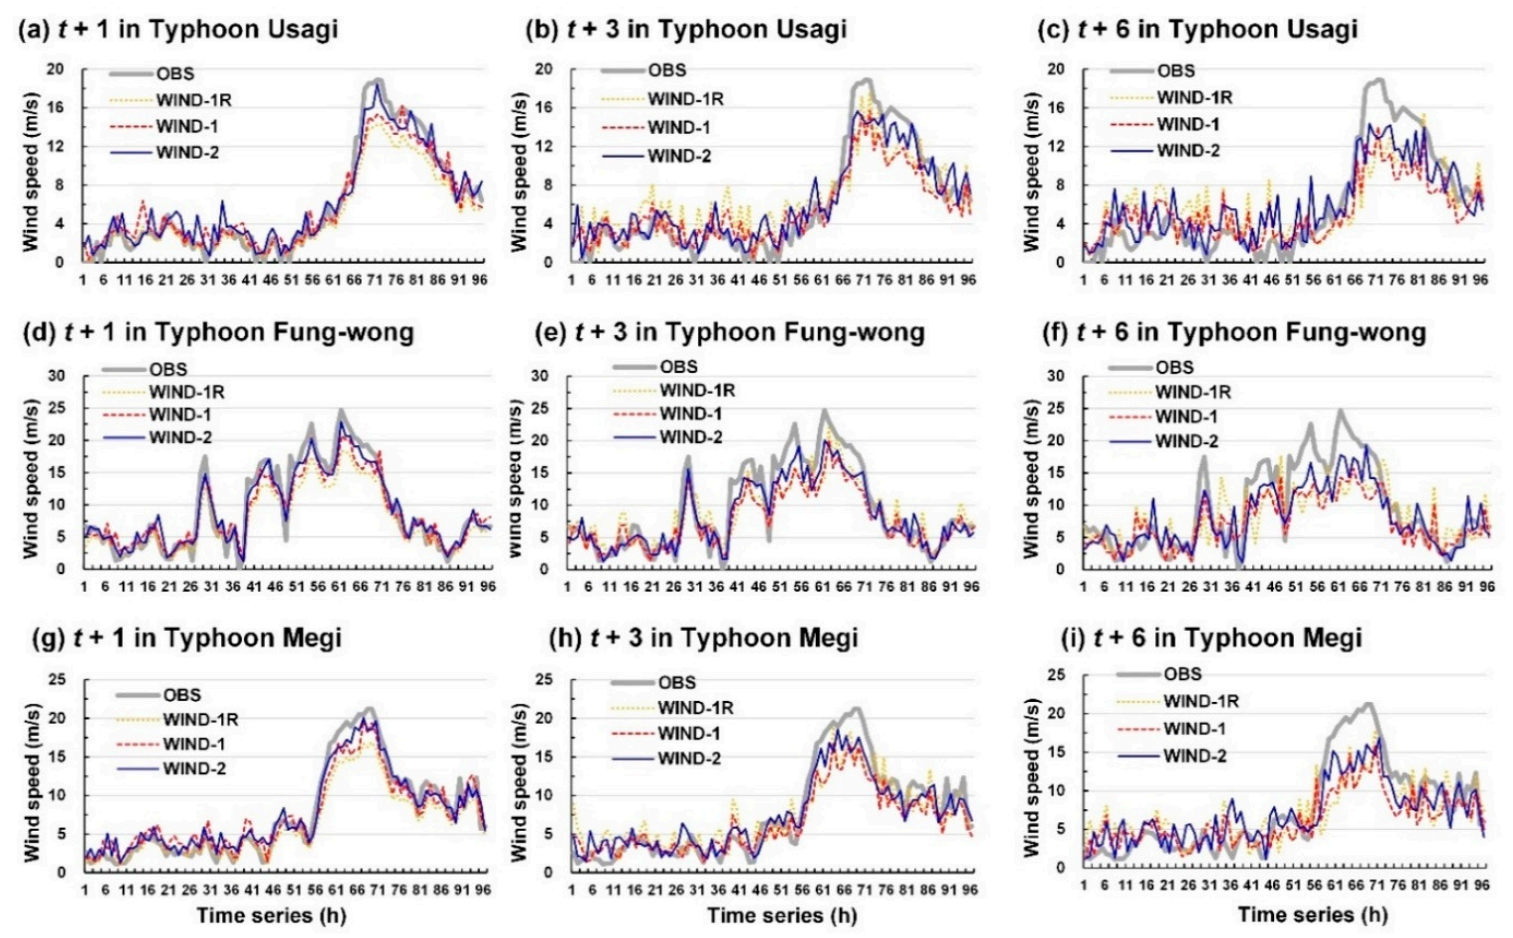
Figure 8.
Simulation results of WIND-1R, WIND-1, and WIND-2 for the Longdong Buoy: (a–c) lead times of 1, 3, and 6 h for Typhoon Usagi, respectively; (d–f) lead times of 1, 3, and 6 h for Typhoon Fung-wong, respectively; (g–i) lead times of 1, 3, and 6 h for Typhoon Megi, respectively.
Figure 8.
Simulation results of WIND-1R, WIND-1, and WIND-2 for the Longdong Buoy: (a–c) lead times of 1, 3, and 6 h for Typhoon Usagi, respectively; (d–f) lead times of 1, 3, and 6 h for Typhoon Fung-wong, respectively; (g–i) lead times of 1, 3, and 6 h for Typhoon Megi, respectively.
Figure 9.
Simulation results of WIND-1R, WIND-1, and WIND-2 for Liuqiu Buoy: (a–c) lead times of 1, 3, and 6 h for Typhoon Usagi, respectively; (d–f) lead times of 1, 3, and 6 h for Typhoon Fung-wong, respectively; and (g–i) lead times of 1, 3, and 6 h for Typhoon Megi, respectively.
Figure 9.
Simulation results of WIND-1R, WIND-1, and WIND-2 for Liuqiu Buoy: (a–c) lead times of 1, 3, and 6 h for Typhoon Usagi, respectively; (d–f) lead times of 1, 3, and 6 h for Typhoon Fung-wong, respectively; and (g–i) lead times of 1, 3, and 6 h for Typhoon Megi, respectively.
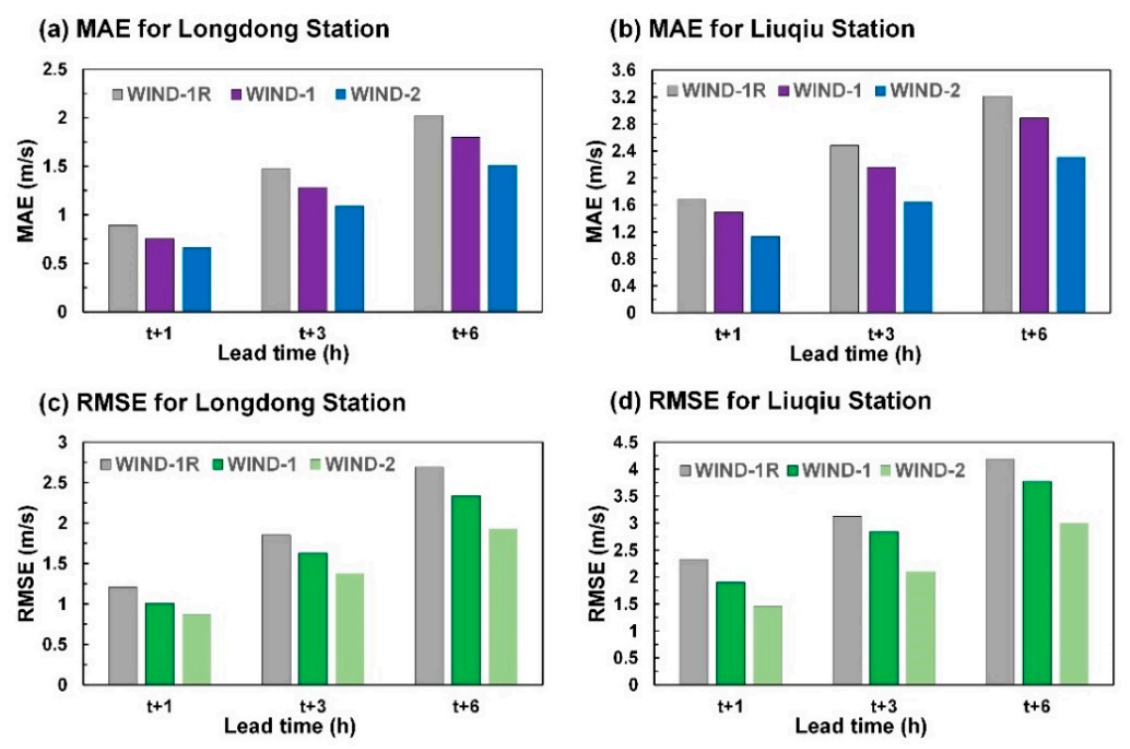
Figure 10.
MAE and RMSE values for the wind velocity predictions: (a) MAE for Longdong Buoy, (b) MAE for Liuqiu Buoy, (c) RMSE for Longdong Buoy, and (d) RMSE for Liuqiu Buoy.
Figure 10.
MAE and RMSE values for the wind velocity predictions: (a) MAE for Longdong Buoy, (b) MAE for Liuqiu Buoy, (c) RMSE for Longdong Buoy, and (d) RMSE for Liuqiu Buoy.
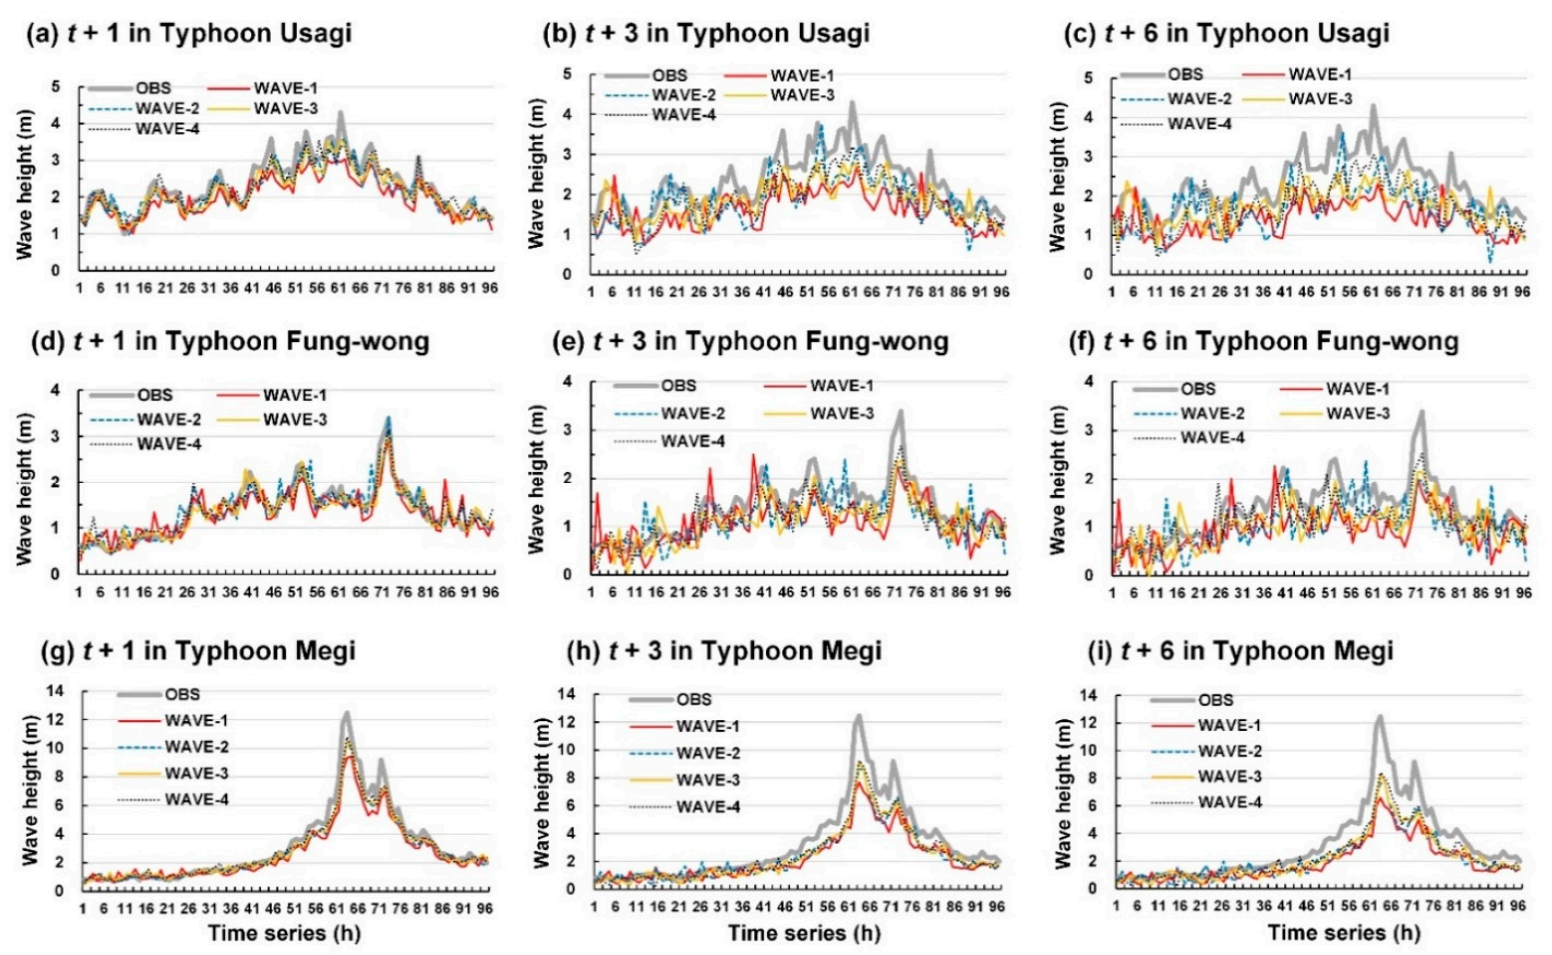
Figure 11.
Results of WAVE-1, WAVE-2, WAVE-3, and WAVE-4 for Longdong Buoy: (a–c) lead times of 1, 3, and 6 h for Typhoon Usagi, respectively; (d–f) lead times of 1, 3, and 6 h for Typhoon Fung-wong, respectively; and (g–i) lead times of 1, 3, and 6 h for Typhoon Megi, respectively.
Figure 11.
Results of WAVE-1, WAVE-2, WAVE-3, and WAVE-4 for Longdong Buoy: (a–c) lead times of 1, 3, and 6 h for Typhoon Usagi, respectively; (d–f) lead times of 1, 3, and 6 h for Typhoon Fung-wong, respectively; and (g–i) lead times of 1, 3, and 6 h for Typhoon Megi, respectively.
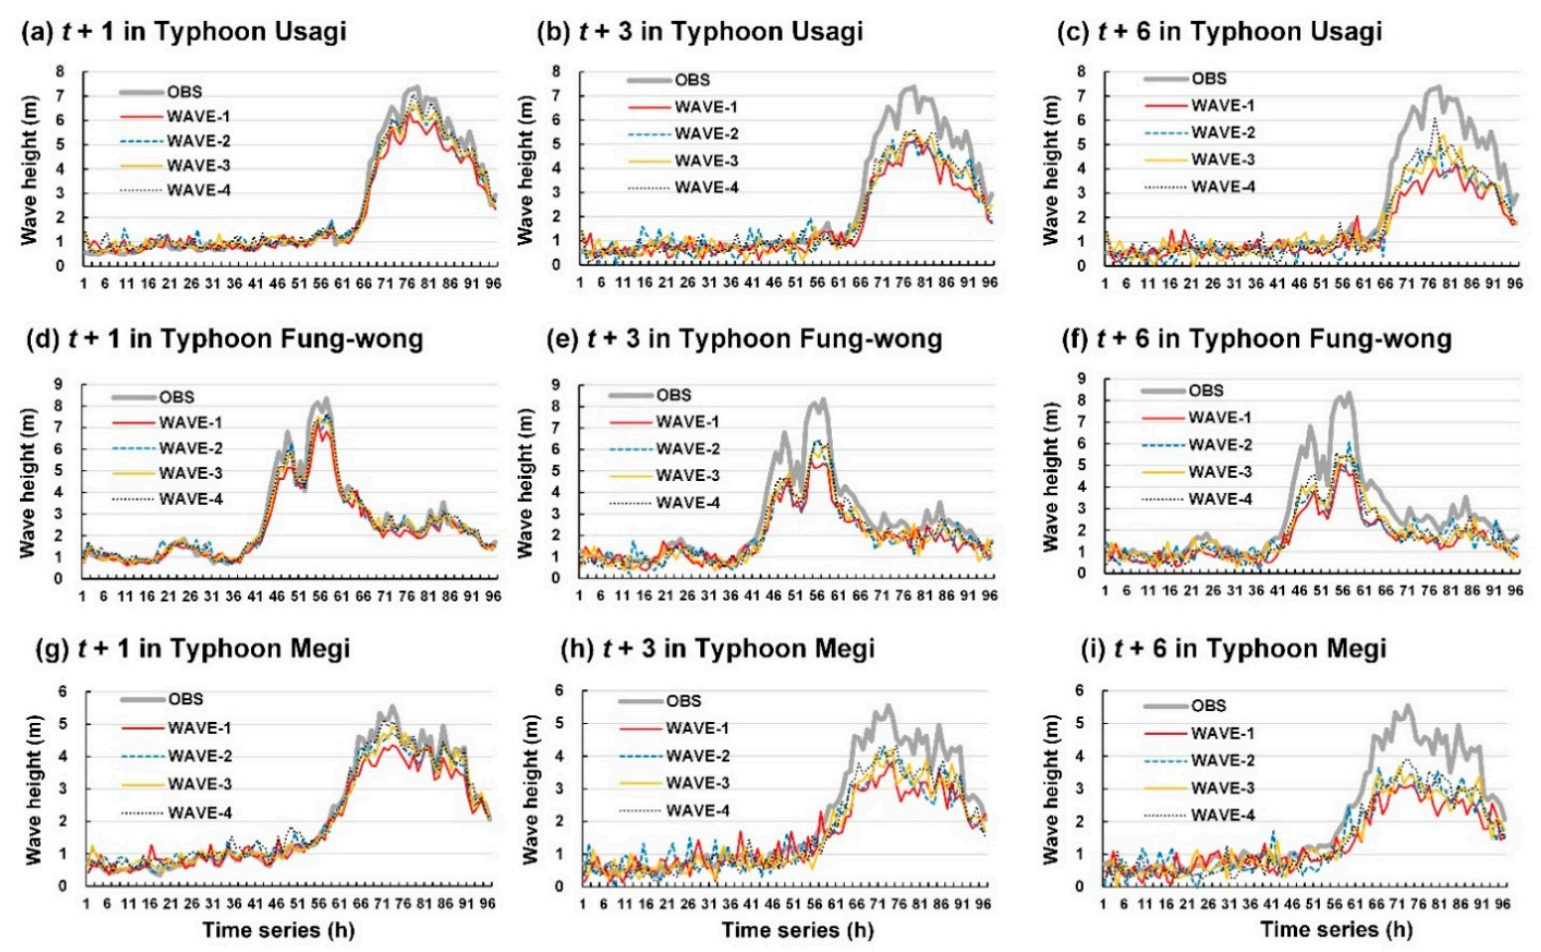
Figure 12.
Results of WAVE-1, WAVE-2, WAVE-3, and WAVE-4 for Liuqiu Buoy: (a–c) lead times of 1, 3, and 6 h for Typhoon Usagi, respectively; (d–f) lead times of 1, 3, and 6 h for Typhoon Fung-wong, respectively; and (g–i) lead times of 1, 3, and 6 h for Typhoon Megi, respectively.
Figure 12.
Results of WAVE-1, WAVE-2, WAVE-3, and WAVE-4 for Liuqiu Buoy: (a–c) lead times of 1, 3, and 6 h for Typhoon Usagi, respectively; (d–f) lead times of 1, 3, and 6 h for Typhoon Fung-wong, respectively; and (g–i) lead times of 1, 3, and 6 h for Typhoon Megi, respectively.
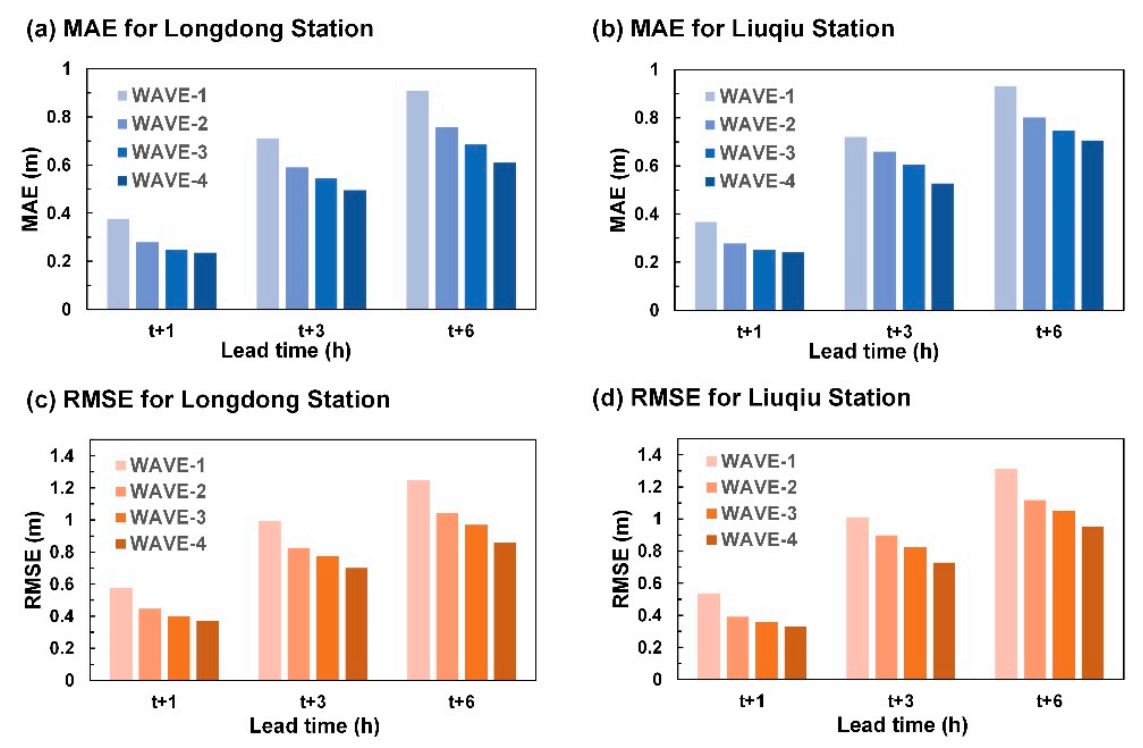
Figure 13.
MAE and RMSE values for the wave height predictions: (a) MAE for Longdong Buoy, (b) MAE for Liuqiu Buoy, (c) RMSE for Longdong Buoy, and (d) RMSE for Liuqiu Buoy.
Figure 13.
MAE and RMSE values for the wave height predictions: (a) MAE for Longdong Buoy, (b) MAE for Liuqiu Buoy, (c) RMSE for Longdong Buoy, and (d) RMSE for Liuqiu Buoy.
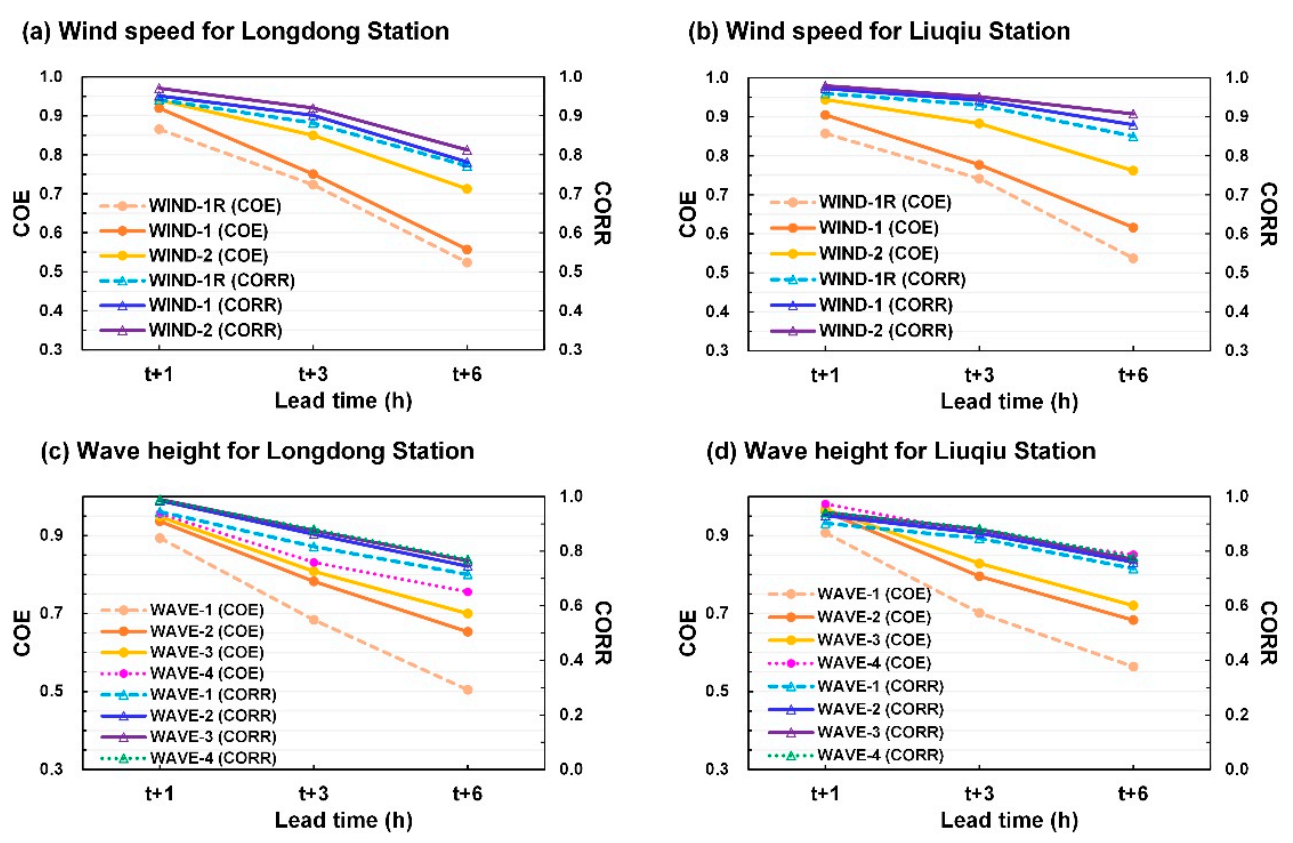
Figure 14.
COE and CORR values of the wind speed predictions at (a) Longdong Buoy and (b) Liuqiu Buoy and those of the wave height predictions at (c) Longdong Buoy and (d) Liuqiu Buoy.
Figure 14.
COE and CORR values of the wind speed predictions at (a) Longdong Buoy and (b) Liuqiu Buoy and those of the wave height predictions at (c) Longdong Buoy and (d) Liuqiu Buoy.
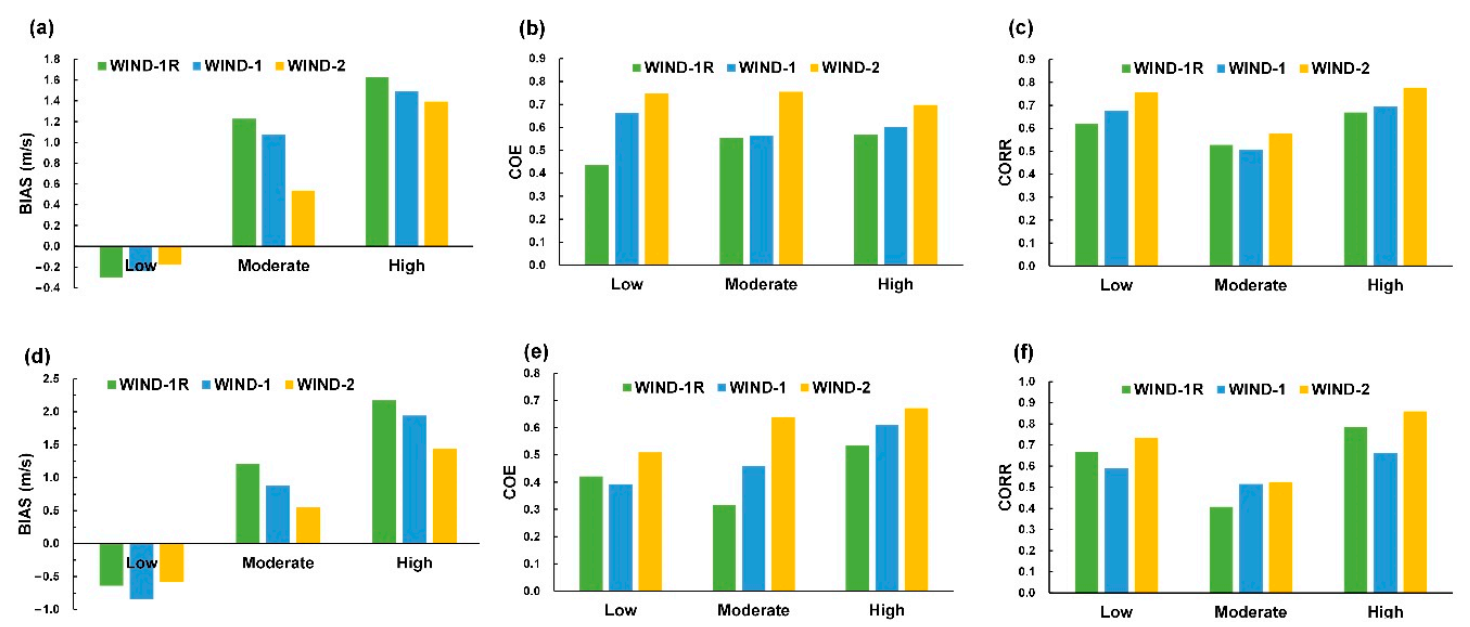
Figure 15.
Metrics of the wind speed classifications at Longdong Buoy: (a) BIAS, (b) COE, and (c) CORR and those at Liuqiu Buoy: (d) BIAS, (e) COE, and (f) CORR.
Figure 15.
Metrics of the wind speed classifications at Longdong Buoy: (a) BIAS, (b) COE, and (c) CORR and those at Liuqiu Buoy: (d) BIAS, (e) COE, and (f) CORR.
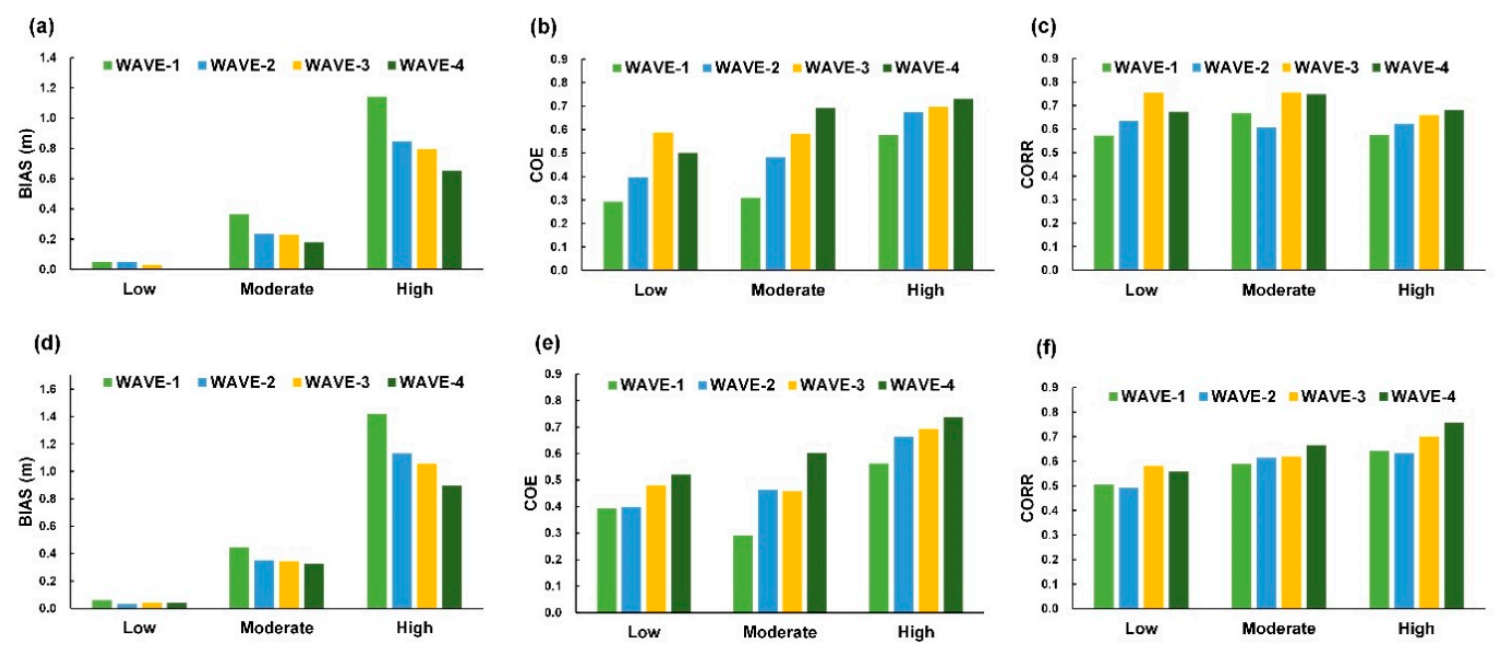
Figure 16.
Metrics of the wave height classifications at Longdong Buoy: (a) BIAS, (b) COE, and (c) CORR and those at Liuqiu Buoy: (d) BIAS, (e) COE, and (f) CORR.
Figure 16.
Metrics of the wave height classifications at Longdong Buoy: (a) BIAS, (b) COE, and (c) CORR and those at Liuqiu Buoy: (d) BIAS, (e) COE, and (f) CORR.
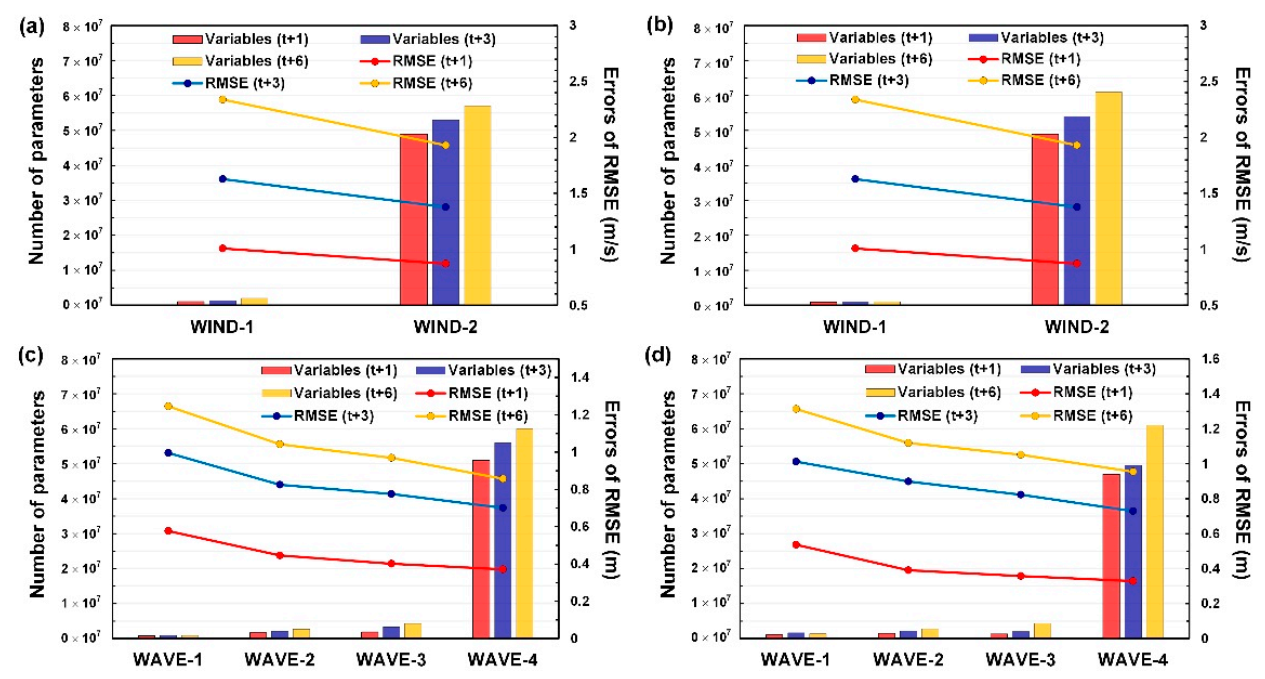
Figure 17.
Computation cost among the model cases for WIND-based models at (a) Longdong Buoy and (b) Liuqiu Buoy and WAVE-based models at (c) Longdong Buoy and (d) Liuqiu Buoy.
Figure 17.
Computation cost among the model cases for WIND-based models at (a) Longdong Buoy and (b) Liuqiu Buoy and WAVE-based models at (c) Longdong Buoy and (d) Liuqiu Buoy.
Table 1.
Typhoons that occurred in the study area.
Table 1.
Typhoons that occurred in the study area.
| Typhoon | Periods | Intensity | Typhoon | Periods | Intensity |
|---|
| Soulik | 11–13 July 2013 | Severe | Nepartak | 6–9 July 2016 | Severe |
| Trami | 20–22 August 2013 | Mild | Meranti | 12–15 September 2016 | Severe |
| Kong-rey | 27–29 August 2013 | Mild | Malakas | 15–18 September 2016 | Moderate |
| Usagi | 19–22 September 2013 | Severe | Megi | 25–28 September 2016 | Moderate |
| Fitow | 4–7 October 2013 | Moderate | Nesat | 28–30 July 2017 | Moderate |
| Hagibis | 14–15 June 2014 | Mild | Haitang | 30–31 July 2017 | Mild |
| Matmo | 21–23 July 2014 | Moderate | Hato | 20–22 August 2017 | Moderate |
| Fung-wong | 19–22 September 2014 | Mild | Guchol | 6–7 September 2017 | Mild |
| Noul | 10–11 May 2015 | Severe | Talim | 12–14 September 2017 | Moderate |
| Chan-hom | 9–11 July 2015 | Moderate | Mitag | 29 September–1 October 2019 | Moderate |
| Linfa | 6–9 July 2015 | Mild | | | |
Table 2.
Designed cases with their corresponding skills and data and related referred studies.
Table 2.
Designed cases with their corresponding skills and data and related referred studies.
| Model Case | Algorithm | Input Data | Referred Paper |
|---|
| WIND-1 | MLP/GRU | 1D in-situ {G,V} | [21,23,29] |
| WIND-2 | CNN + MLP/GRU | 1D in-situ {G,V} and 2D image {I} | Present |
| WAVE-1 | MLP/GRU | 1D in-situ {G,H} | [32] |
| WAVE-2 | MLP/GRU | 1D in-situ {G,H} and predicted {V’} from WIND-1 | [32] |
| WAVE-3 | MLP/GRU | 1D in-situ {G,H} and predicted {V’} from WIND-2 | Present |
| WAVE-4 | CNN + MLP/GRU | 1D in-situ {G,H} and 2D image {I} | Present |
Table 3.
Calibration results of the WIND-1 model for the number of dense/GRU layers and the number of neurons in a dense/GRU layer at Longdong Buoy and Liuqiu Buoy.
Table 3.
Calibration results of the WIND-1 model for the number of dense/GRU layers and the number of neurons in a dense/GRU layer at Longdong Buoy and Liuqiu Buoy.
| Model | Buoy | Lead Time (h) |
|---|
| t + 1 | t + 3 | t + 6 |
|---|
| Parameters with Metrics | Layers, Neurons | RMSE (m/s) | Layers, Neurons | RMSE (m/s) | Layers, Neurons | RMSE (m/s) |
|---|
| WIND-1_dense | Longdong | 1, 100 | 1.417 | 2, 130 | 2.018 | 2, 140 | 2.812 |
| Liuqiu | 1, 70 | 1.763 | 2, 80 | 2.735 | 2, 100 | 3.884 |
| WIND-1_GRU | Longdong | 1, 140 | 1.315 | 1, 150 | 1.803 | 2, 150 | 2.570 |
| Liuqiu | 1, 80 | 1.631 | 1, 90 | 2.576 | 1, 110 | 3.532 |
Table 4.
Calibration results of the WIND-2 model for the structure types of the VGGNets, cropped image sizes, the number of GRU layers, and the number of neurons in a dense/GRU layer at Longdong Buoy and Liuqiu Buoy.
Table 4.
Calibration results of the WIND-2 model for the structure types of the VGGNets, cropped image sizes, the number of GRU layers, and the number of neurons in a dense/GRU layer at Longdong Buoy and Liuqiu Buoy.
| Model | Buoy | Lead Time (h) |
|---|
| | t + 1 | | t + 3 | | t + 6 |
|---|
| Parameters with Metrics | Structure, Size | Layers, Neurons | RMSE (m/s) | Structure, Size | Layers, Neurons | RMSE (m/s) | Structure, Size | Layers, Neurons | RMSE (m/s) |
|---|
| WIND-2_dense | Longdong | VGG16, 96 | 3, 2300 | 1.312 | CNN5_3, 96 | 3, 2600 | 1.401 | CNN5_4, 128 | 4, 2500 | 2.473 |
| Liuqiu | VGG16, 128 | 3, 1800 | 1.327 | CNN5_3, 128 | 4, 2000 | 1.869 | CNN5_3, 128 | 4, 2400 | 3.013 |
| WIND-2_GRU | Longdong | CNN5_3, 96 | 3, 2600 | 1.103 | CNN5_3, 96 | 3, 2700 | 1.384 | CNN5_4, 128 | 3, 3000 | 2.112 |
| Liuqiu | CNN5_3, 128 | 3, 2400 | 1.292 | CNN5_3, 128 | 3, 2500 | 1.801 | CNN5_4, 128 | 4, 2100 | 2.786 |
Table 5.
Calibration results of the WAVE-1, WAVE-2, and WAVE-3 models for the number of dense/GRU layers and the number of neurons in a dense/GRU layer at Longdong Buoy and Liuqiu Buoy.
Table 5.
Calibration results of the WAVE-1, WAVE-2, and WAVE-3 models for the number of dense/GRU layers and the number of neurons in a dense/GRU layer at Longdong Buoy and Liuqiu Buoy.
| Model | Buoy | Lead Time (h) |
|---|
| t + 1 | t + 3 | t + 6 |
|---|
| Parameters with Metrics | Layers, Neurons | RMSE (m) | Layers, Neurons | RMSE (m) | Layers, Neurons | RMSE (m) |
|---|
| WAVE-1_dense | Longdong | 2, 80 | 0.594 | 3, 100 | 0.961 | 3, 80 | 1.301 |
| Liuqiu | 1, 60 | 0.481 | 3, 110 | 0.868 | 3, 110 | 1.418 |
| WAVE-1_GRU | Longdong | 1, 90 | 0.573 | 2, 130 | 0.903 | 2, 100 | 1.187 |
| Liuqiu | 1, 60 | 0.443 | 2, 90 | 0.842 | 2, 120 | 1.202 |
| WAVE-2_dense | Longdong | 2, 100 | 0.456 | 2, 120 | 0.831 | 4, 100 | 0.991 |
| Liuqiu | 2, 60 | 0.368 | 3, 110 | 0.887 | 3, 120 | 1.238 |
| WAVE-2_GRU | Longdong | 1, 110 | 0.447 | 2, 90 | 0.802 | 2, 100 | 0.902 |
| Liuqiu | 1, 70 | 0.350 | 2, 100 | 0.868 | 2, 110 | 1.021 |
| WAVE-3_dense | Longdong | 2, 120 | 0.433 | 3, 90 | 0.782 | 4, 120 | 0.955 |
| Liuqiu | 2, 100 | 0.372 | 3, 100 | 0.822 | 4, 110 | 0.979 |
| WAVE-3_GRU | Longdong | 2, 100 | 0.401 | 3, 100 | 0.748 | 3, 170 | 0.928 |
| Liuqiu | 1, 120 | 0.348 | 2, 110 | 0.786 | 3, 180 | 0.948 |
Table 6.
Calibration results of the WAVE-4 model for the structure types of the VGGNets, cropped image sizes, the number of dense/GRU layers, and the number of neurons in a dense/GRU layer at Longdong Buoy and Liuqiu Buoy.
Table 6.
Calibration results of the WAVE-4 model for the structure types of the VGGNets, cropped image sizes, the number of dense/GRU layers, and the number of neurons in a dense/GRU layer at Longdong Buoy and Liuqiu Buoy.
| Model | Buoy | Lead Time (h) |
|---|
| | t + 1 | | t + 3 | | t + 6 |
|---|
| Parameters with Metrics | Structure, Size | Layers, Neurons | RMSE (m) | Structure, Size | Layers, Neurons | RMSE (m) | Structure, Size | Layers, Neurons | RMSE (m) |
|---|
| WAVE-4_dense | Longdong | CNN5_3, 96 | 2, 2200 | 0.358 | CNN5_4, 96 | 4, 1500 | 0.746 | CNN5_4, 128 | 4, 1600 | 0.876 |
| Liuqiu | VGG16, 96 | 2, 1900 | 0.321 | CNN5_3, 128 | 3, 1900 | 0.723 | CNN5_4, 128 | 4, 1500 | 0.941 |
| WAVE-4_GRU | Longdong | CNN5_4, 96 | 3, 2100 | 0.347 | CNN5_3, 128 | 4, 1400 | 0.728 | CNN5_4, 128 | 4, 1700 | 0.844 |
| Liuqiu | CNN5_4, 128 | 2, 2300 | 0.309 | CNN5_3, 128 | 3, 2100 | 0.705 | CNN5_4, 128 | 4, 1800 | 0.919 |


