
Determination of Anthracene Derivatives in Baltic Amber Using SERS


Abstract
:1. Introduction
2. Materials and Methods
2.1. Spectrophotometry Experiment
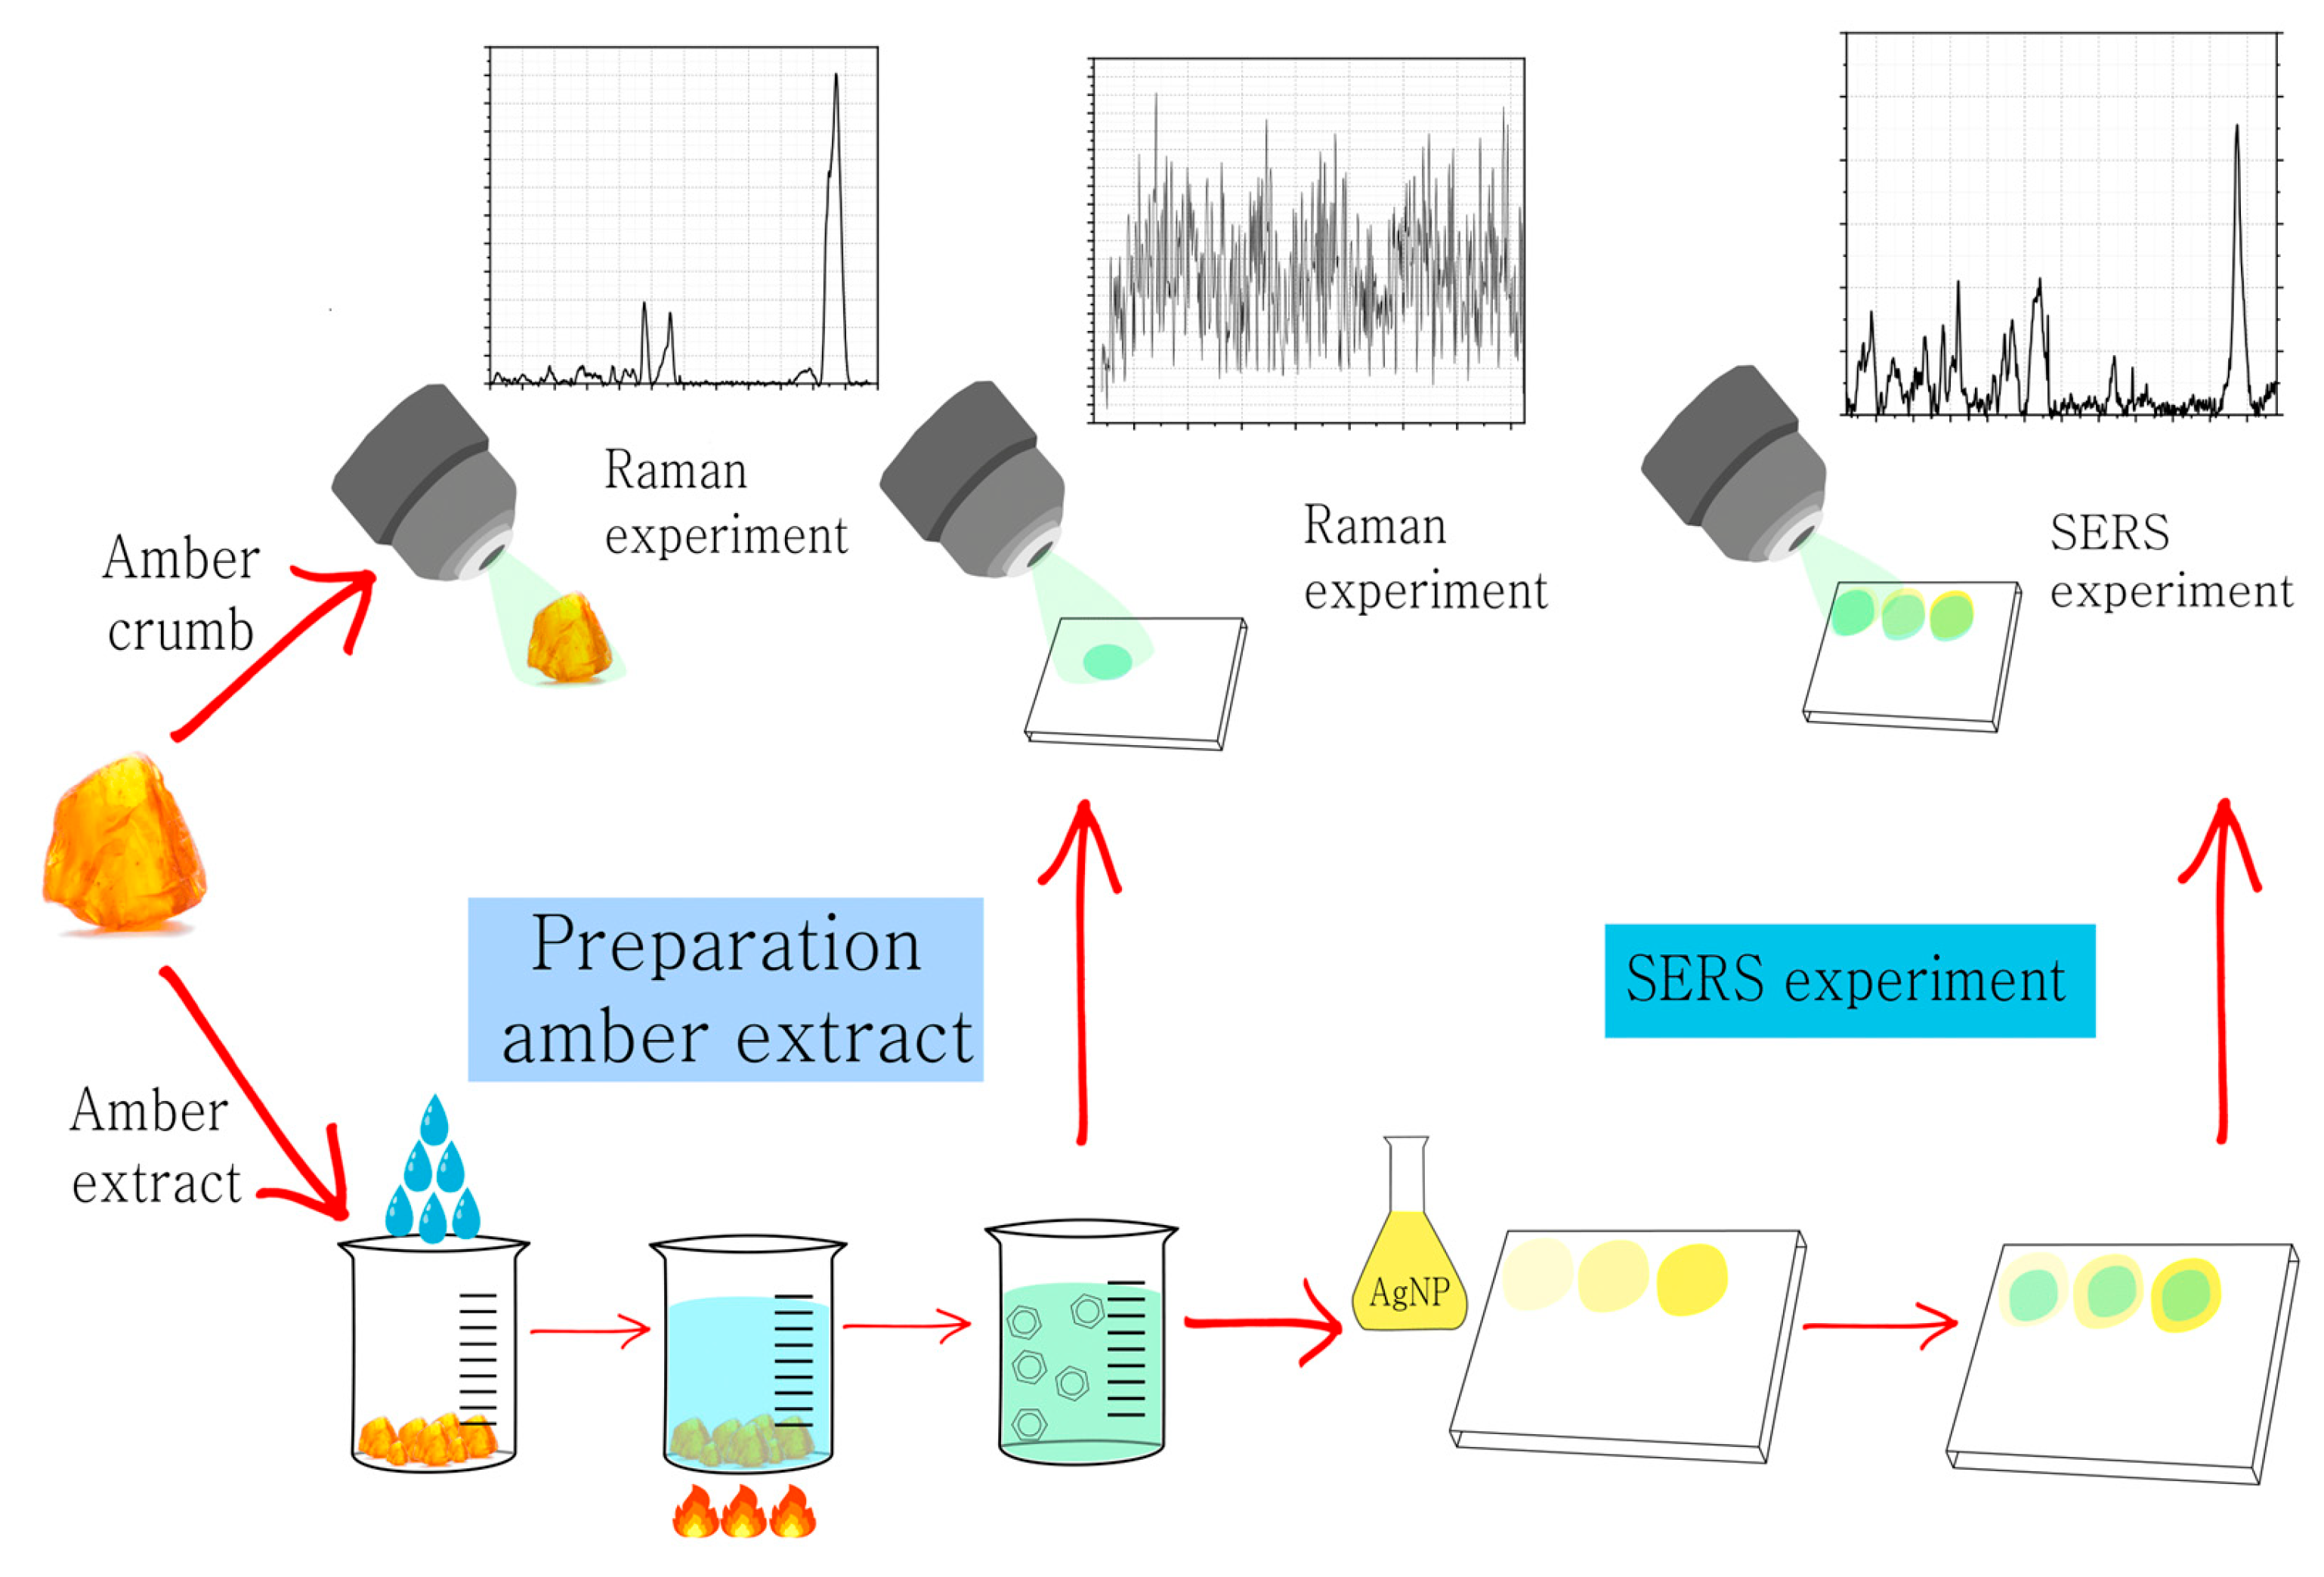
2.2. Raman Experiment
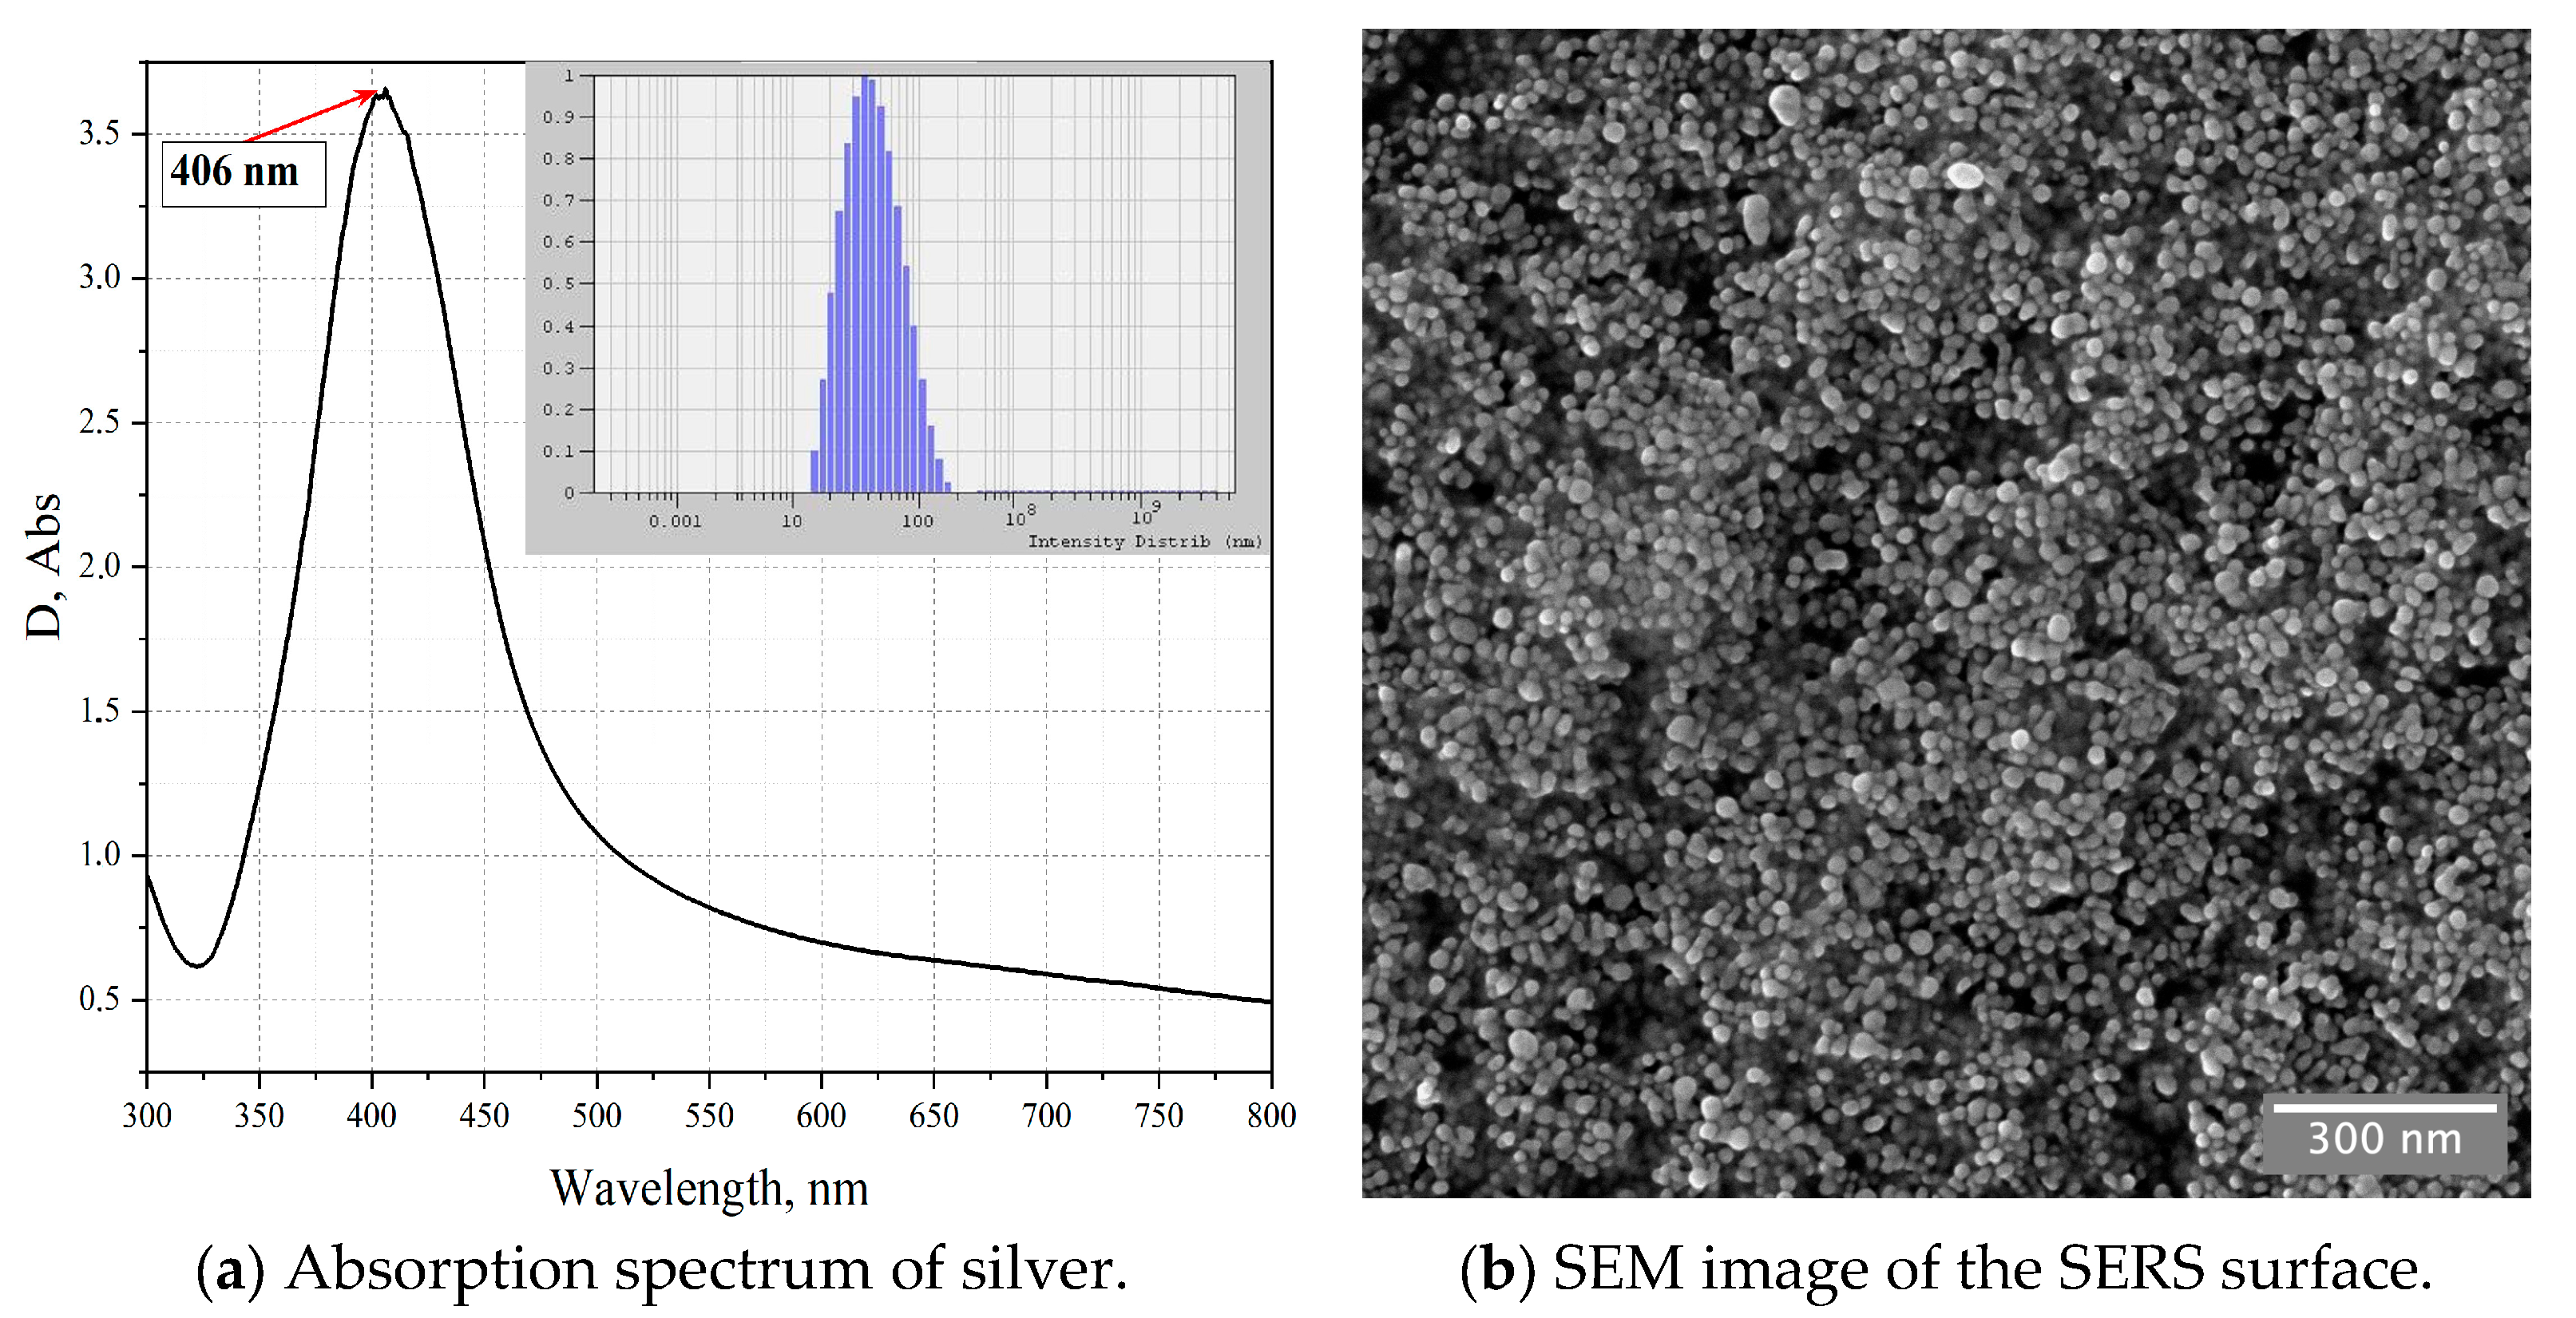
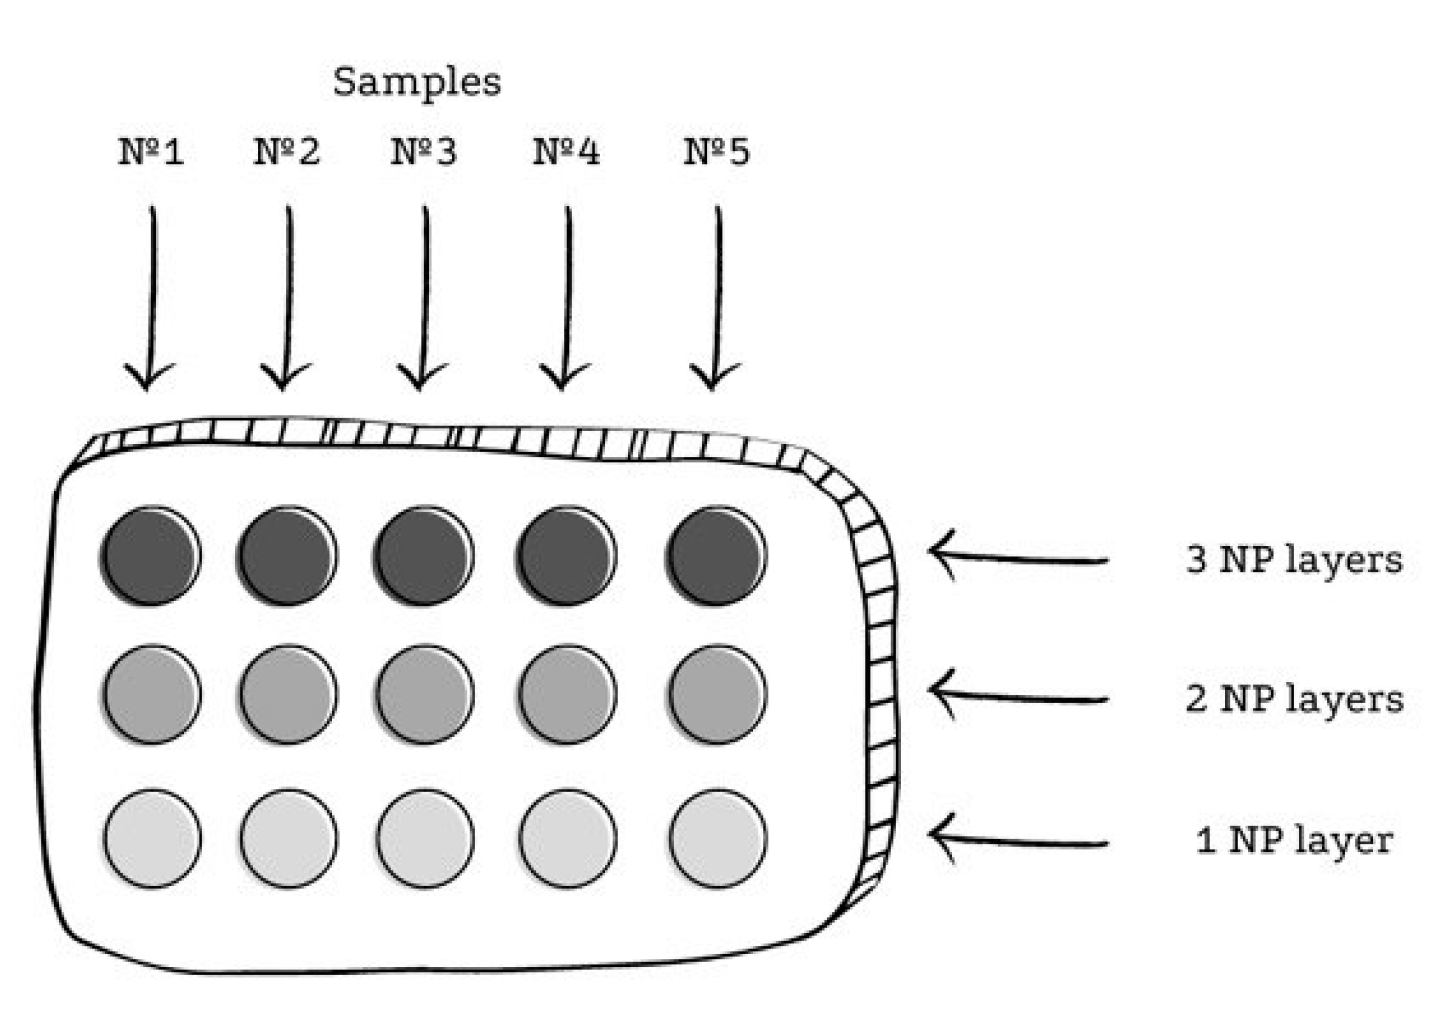
2.3. SERS Experiment
2.4. Simulation of Raman Spectra
2.5. FT-IR Experiment
3. Results and Discussion
3.1. Spectrophotometry of Amber
3.2. Amber Particles
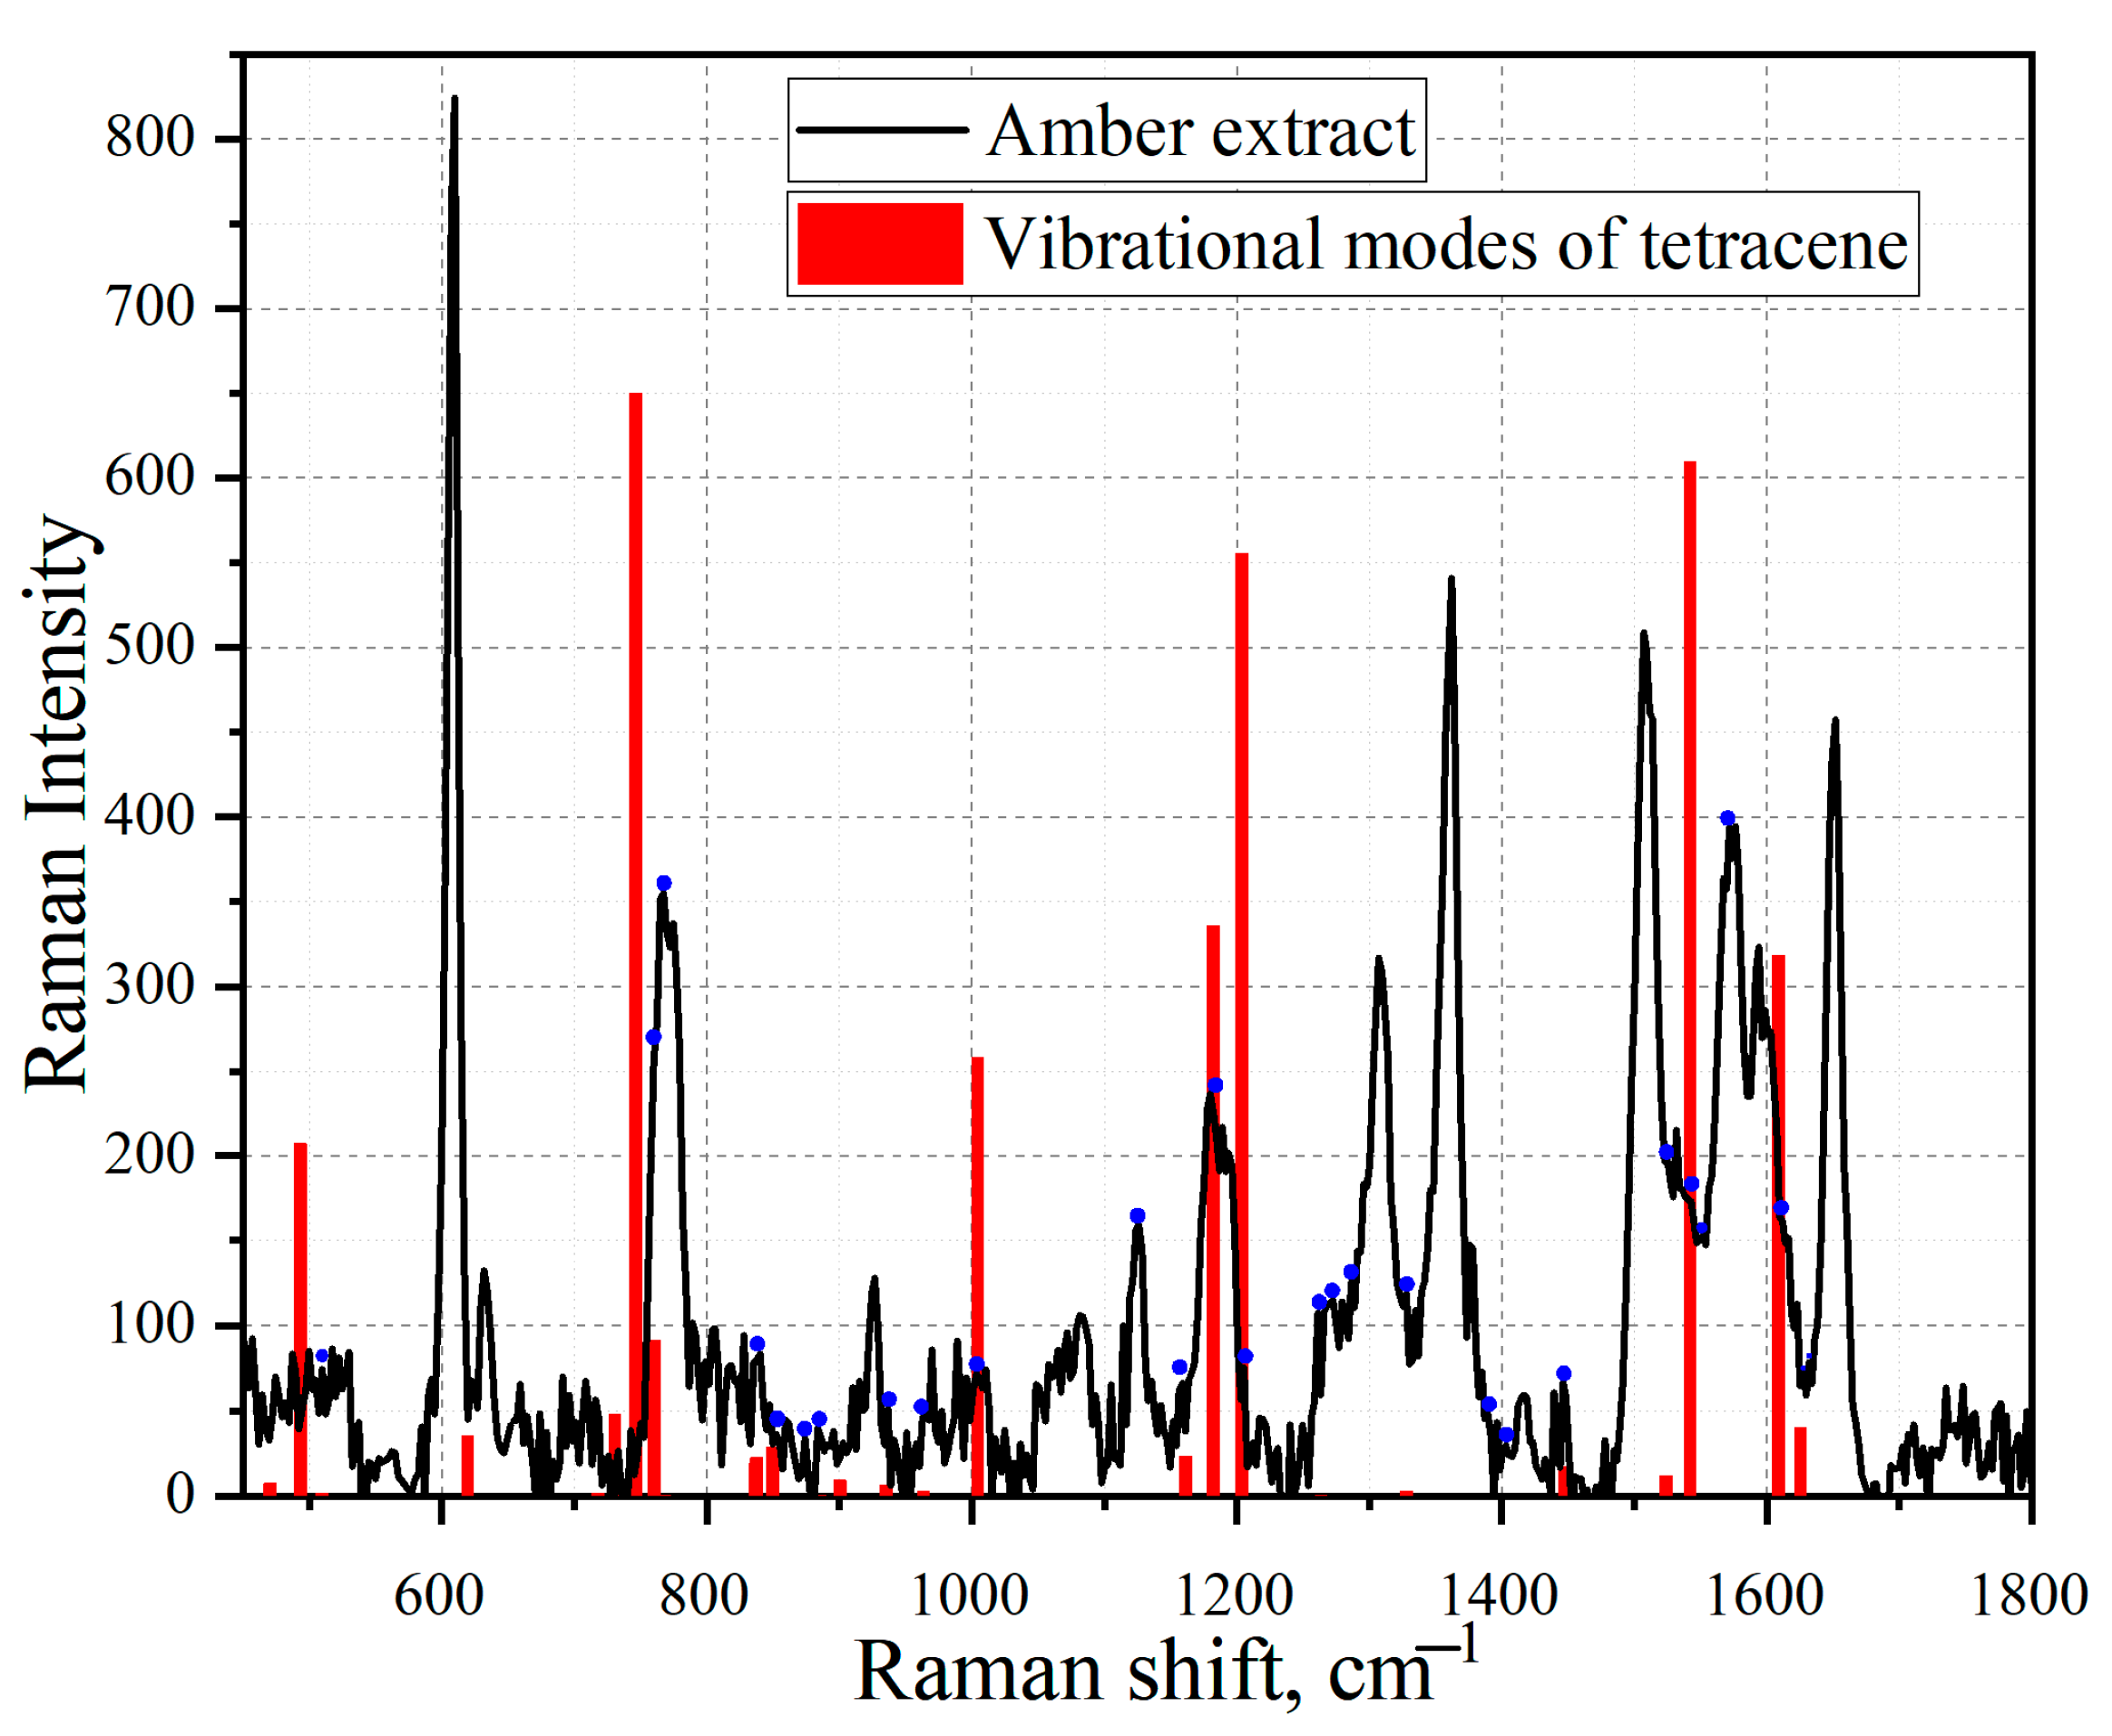
3.3. Amber Extracts
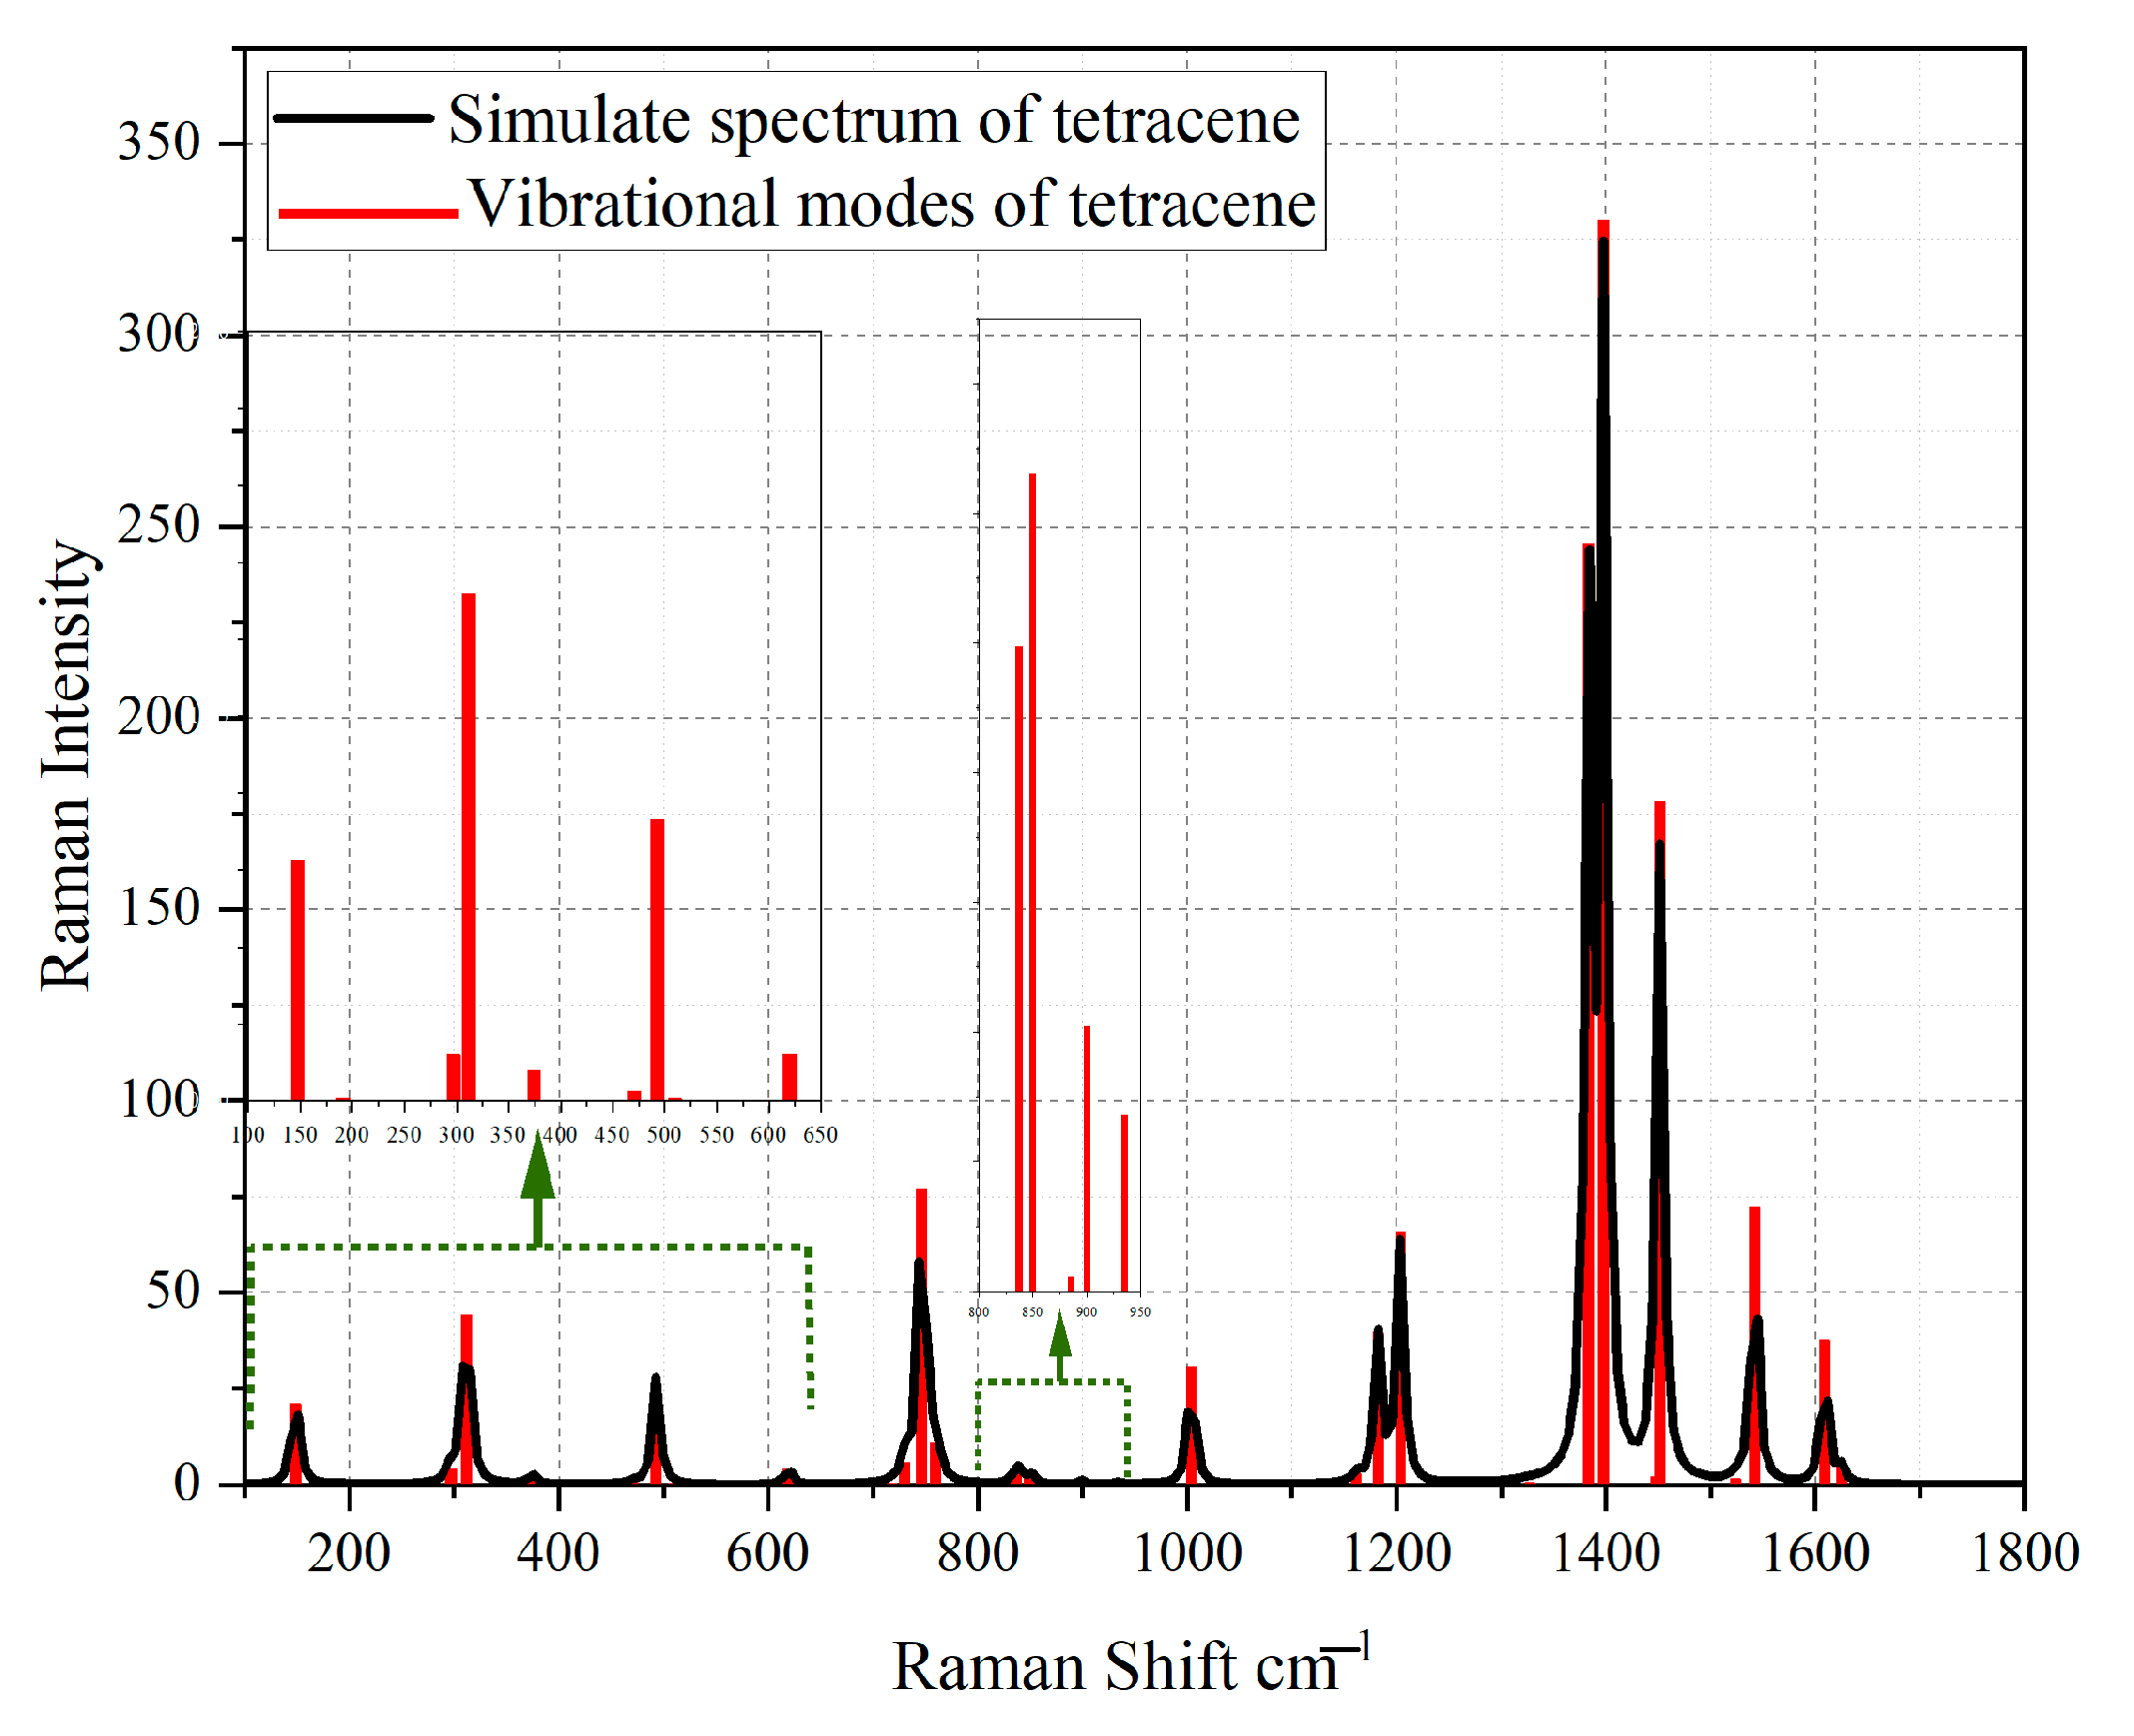
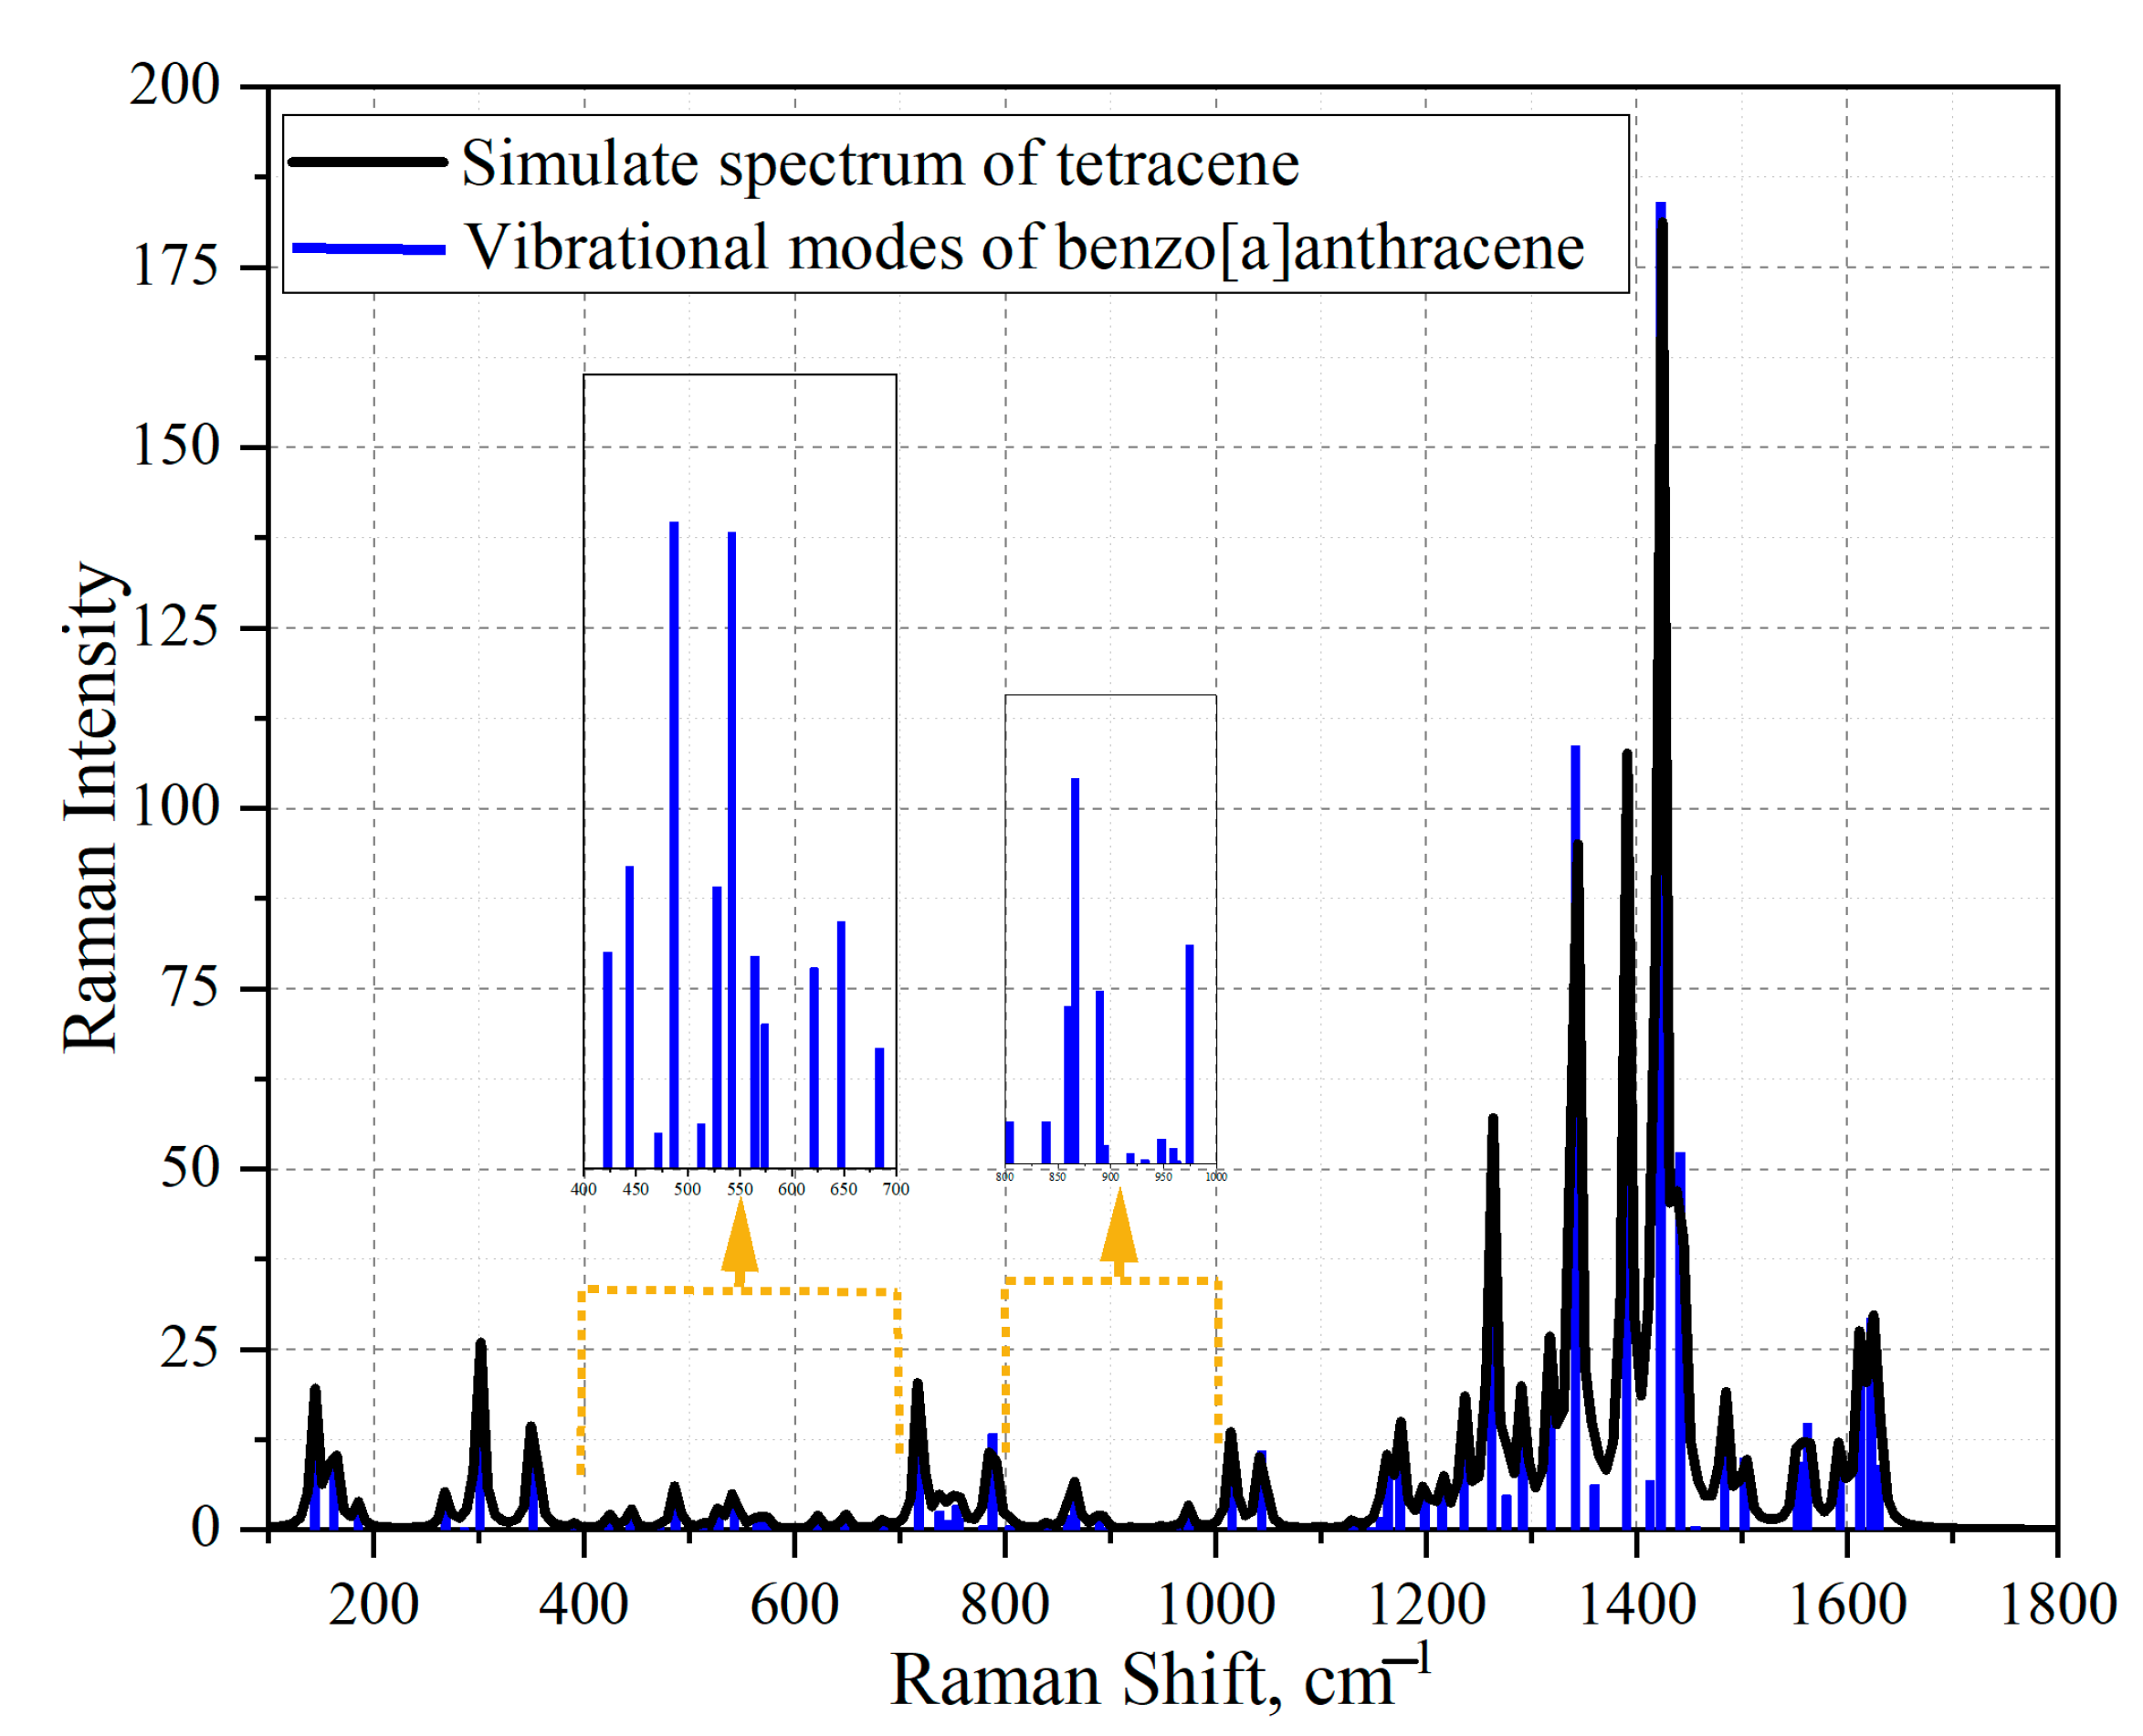
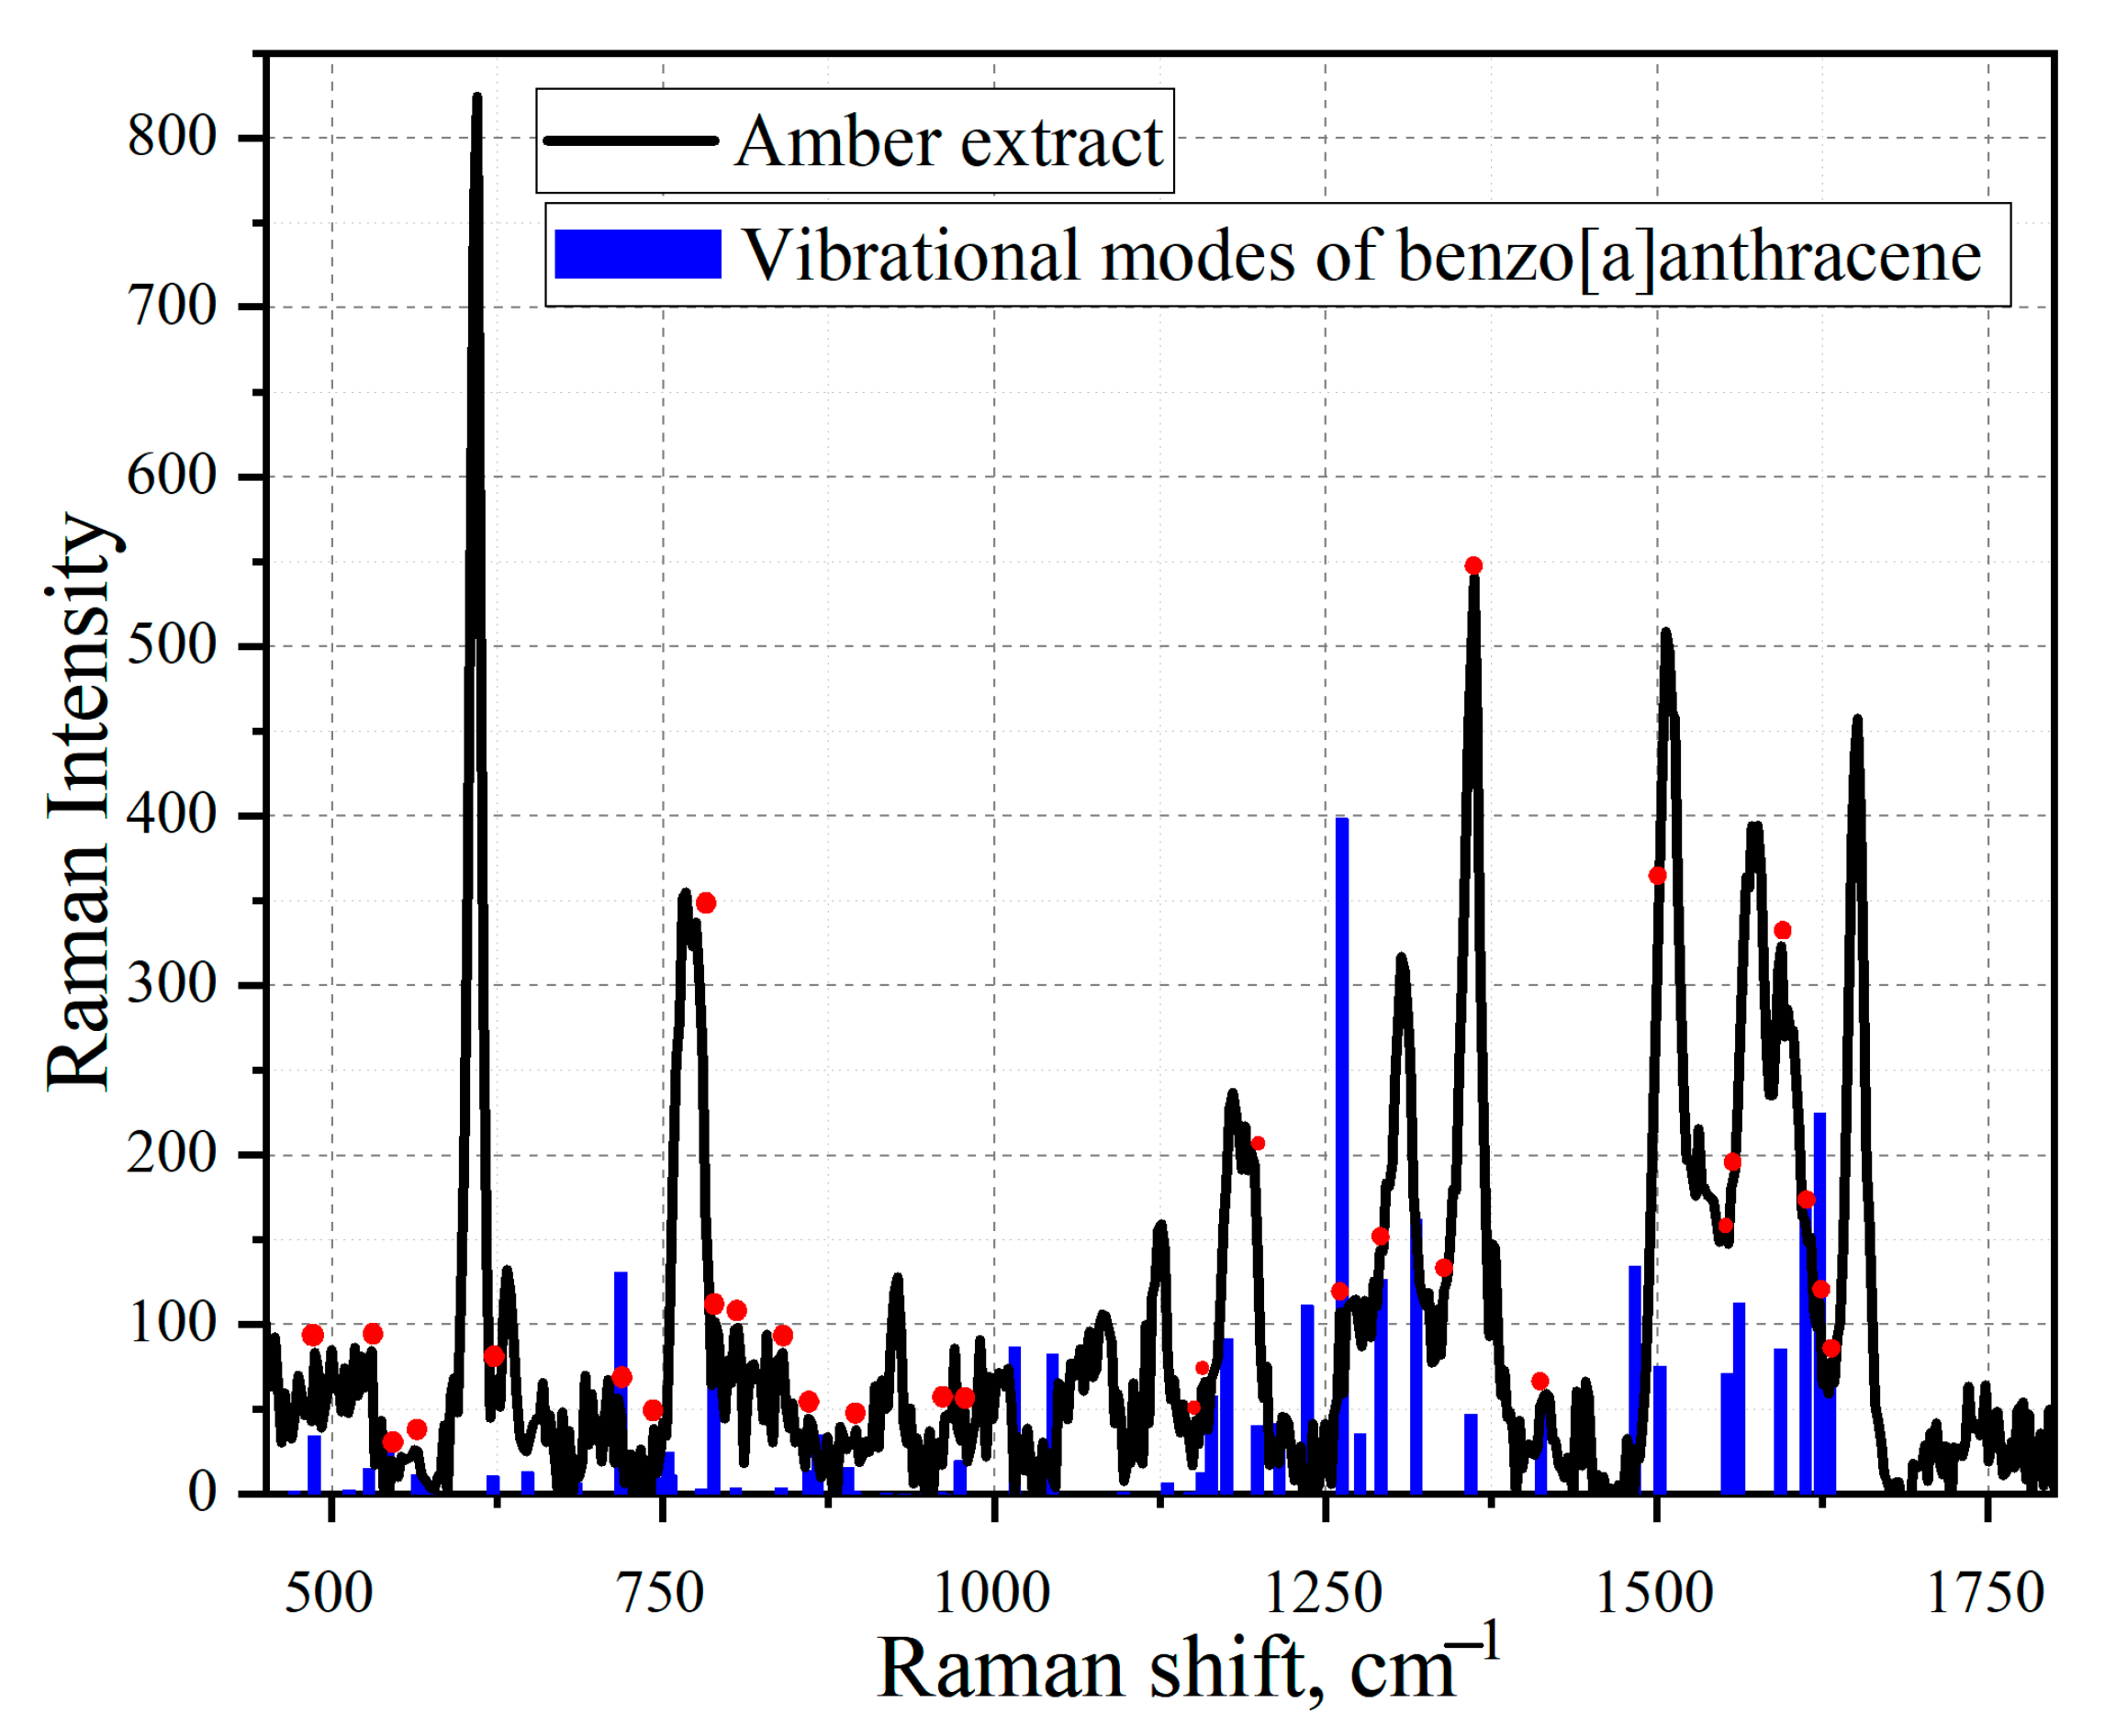
3.4. Simulation of Extract Spectra
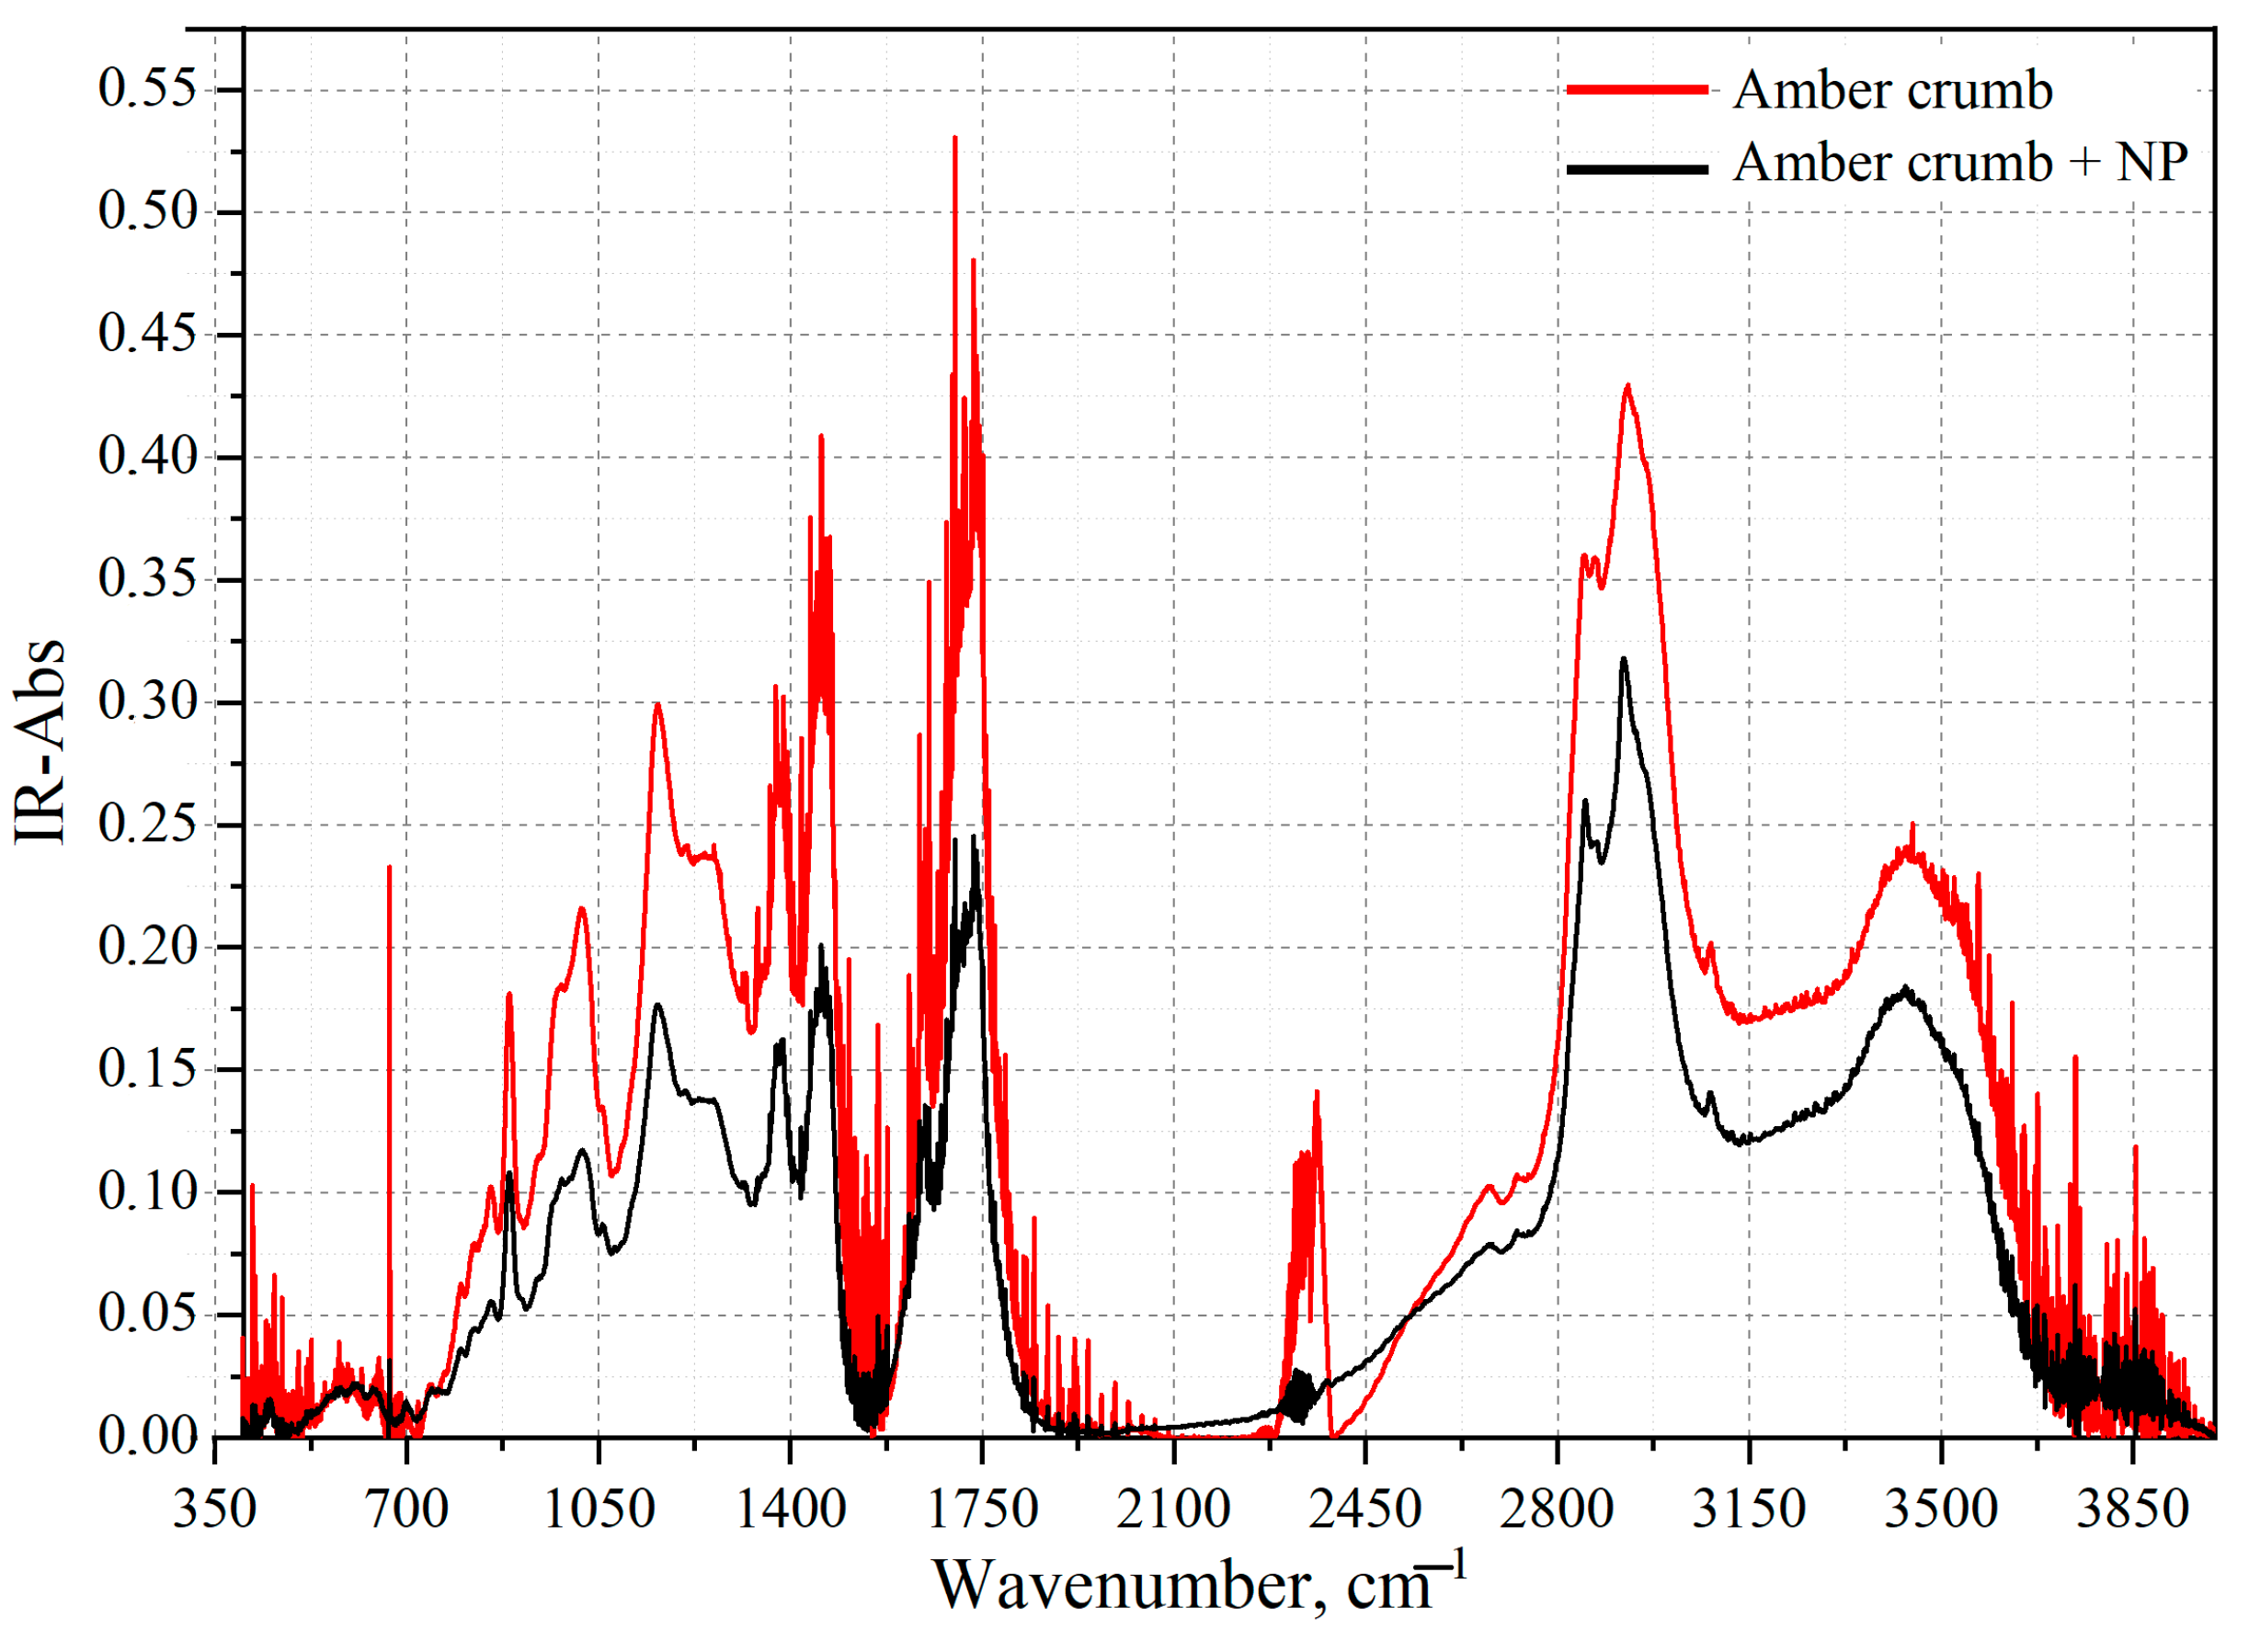
3.5. FT-IR Spectroscopy
4. Conclusions
Author Contributions
Funding
Institutional Review Board Statement
Informed Consent Statement
Data Availability Statement
Conflicts of Interest
References
- Jiang, H.; Tomaschek, F.; Muscente, A.D.; Niu, C.; Nyunt, T.T.; Fang, Y.; Schmidt, U.; Chen, J.; Lönartz, M.; Mähler, B.; et al. Widespread mineralization of soft-bodied insects in Cretaceous amber. Geobiology 2022, 20, 363–376. [Google Scholar] [CrossRef] [PubMed]
- Kowalewska, M.; Szwedo, J. Examination of the Baltic amber inclusion surface using SEM techniques and X-ray microanalysis. Palaeogeogr. Palaeoclimatol. Palaeoecol. 2009, 271, 287–291. [Google Scholar] [CrossRef]
- Liu, J.; Jian, Z.; Xuejun, Y.; Xuebing, H.; Jiang, X.; Xinran, J.; Jun, Y. Characteristics of Photoluminescence and Raman Spectra, and the Occurrence of Trace Elements of Blue Amber from Dominican Republic and Mexico. Rock Miner. Anal. 2022, 41, 272–280. [Google Scholar]
- Barden, P.; Sosiak, C.E.; Grajales, J.; Hawkins, J.; Rizzo, L.; Clark, A.; Gatley, S.; Gatley, I.; Federici, J. Non-destructive comparative evaluation of fossil amber using terahertz time-domain spectroscopy. PLoS ONE 2022, 17, e0262983. [Google Scholar] [CrossRef]
- Perkovsky, E.E.; Rasnitsyn, A.P.; Vlaskin, A.P.; Rasnitsyn, S.P. Contribution to the study of the structure of amber forest communities based on analysis of syninclusions in the Rovno Amber (Late Eocene of Ukraine). Paleontol. J. 2012, 46, 293–301. [Google Scholar] [CrossRef]
- Stach, P.; Natkaniec-Nowak, L.; Dumańska-Słowik, M.; Kosakowski, P.; Naglik, B.; Drzewicz, P.; Gomez, R.E.R. The Characteristics and Origin of Amber Deposits in the Dominican Republic. 2021. Available online: https://www.researchsquare.com/article/rs-564160/v1 (accessed on 24 January 2023).
- Teodor, E.D.; Liţescu, S.C.; Neacşu, A.; Truică, G.; Albu, C. Analytical methods to differentiate Romanian amber and Baltic amber for archaeological applications. Cent. Eur. J. Chem. 2009, 7, 560–568. [Google Scholar] [CrossRef]
- Truică, G.; Ditaranto, N.; Caggiani, M.; Mangone, A.; Liţescu, S.; Teodor, E.; Sabbatini, L.; Radu, G. A multi-analytical approach to amber characterisation. Chem. Pap. 2014, 68, 15–21. [Google Scholar] [CrossRef]
- Karolina, D.; Maja, M.-S.; Magdalena, D.-S.; Grażyna, Ż. Identification of treated Baltic amber by FTIR and FT-Raman—A feasibility study. Spectrochim. Acta Part A Mol. Biomol. Spectrosc. 2022, 279, 121404. [Google Scholar] [CrossRef]
- Park, J.; Yun, E.; Kang, H.; Ahn, J.; Kim, G. IR and py/GC/MS examination of amber relics excavated from 6th century royal tomb in Korean Peninsula. Spectrochim. Acta Part A Mol. Biomol. Spectrosc. 2016, 165, 114–119. [Google Scholar] [CrossRef]
- Wolfe, A.P.; McKellar, R.C.; Tappert, R.; Sodhi, R.N.S.; Muehlenbachs, K. Bitterfeld amber is not Baltic amber: Three geochemical tests and further constraints on the botanical affinities of succinite. Rev. Palaeobot. Palynol. 2016, 225, 21–32. [Google Scholar] [CrossRef]
- Havelcová, M.; Machovič, V.; Špaldoňová, A.; Lapčák, L.; Hendrych, J.; Adam, M. Characterization of Eocene fossil resin from Moravia, Czech Republic: Insights into macromolecular structure. Spectrochim. Acta Part A Mol. Biomol. Spectrosc. 2019, 215, 176–186. [Google Scholar] [CrossRef] [PubMed]
- Pastorelli, G.; Shashoua, Y.; Richter, J. Surface yellowing and fragmentation as warning signs of depolymerisation in Baltic amber. Polym. Degrad. Stab. 2013, 98, 2317–2322. [Google Scholar] [CrossRef]
- Jehlička, J.; Jorge Villar, S.E.; Edwards, H.G.M. Fourier transform Raman spectra of Czech and Moravian fossil resins from freshwater sediments. J. Raman Spectrosc. 2004, 35, 761–767. [Google Scholar] [CrossRef]
- Ragazzi, E.; Schmidt, A.R. Amber in Encyclopedia of Geobiology; Reitner, J., Thiel, V., Eds.; Springer: Berlin/Heidelberg, Germany, 2011; pp. 24–36. [Google Scholar]
- Bray, P.S.; Anderson, K.B. Identification of Carboniferous (320 Million Years Old) Class Ic Amber. Science 2009, 326, 132. [Google Scholar] [CrossRef]
- Kievlenko, E.Y.; Senkevich, N.N. Amber and other fossil resins. In The Book: Geology of Deposits of Ornamental Stones; Nedra Publishing House: Moscow, Russia, 1976. (In Russian) [Google Scholar]
- Vittorio, B.; Enrico, G.; Laura, L.; Donatella, S. Origin of the blue fluorescence in Dominican amber. J. Appl. Phys. 2005, 97, 016101. [Google Scholar]
- Arn, V. Photoluminescence of Baltic Amber; Tulane University: New Orleans, LA, USA, 2018. [Google Scholar]
- Mark, H.F.; McKelta, J.J.; Othmer, D.F. (Eds.) KirkOthmer’s “Encyclopedia of Chemical Technology”, 2nd ed.; Natural Resins, Wiley-lnterscience: New York, NY, USA, 1969. [Google Scholar]
- Lambert, J.; Frye, J. Carbon functionality in amber. Science 1982, 217, 55–57. [Google Scholar] [CrossRef]
- Chen, D.; Zeng, Q.; Yuan, Y.; Cui, B.; Luo, W. Baltic amber or Burmese amber: FTIR studies on amber artifacts of Eastern Han Dynasty unearthed from Nanyang. Spectrochim. Acta Part A Mol. Biomol. Spectrosc. 2019, 222, 117270. [Google Scholar] [CrossRef]
- Broughton, P. Conceptual frameworks for geographic-botanical affinities of fossil resins. Can. J. Earth Sci. 1974, 11, 583–594. [Google Scholar] [CrossRef]
- Cunningham, I.D.; Gay, A.C.; Oehlschlager, J.H. Langenheim, 13C NMR and IR analyses of structure aging and botanical origin of Dominican and Mexican ambers. Org. Geochem. 1983, 22, 965–968. [Google Scholar]
- Truică, G.; Teodor, E.; Litescu, S.; Radu, G. LC-MS and FT-IR characterization of amber artifacts. Open Chem. 2012, 10, 1882–1889. [Google Scholar] [CrossRef]
- Xing, Q.Y.; Yang, M.; Yang, H.X.; Zu, E.D. Study on the gemological characteristics of amber from Myanmar and Chinese Fushun. Key Eng. Mater. 2013, 544, 172–177. [Google Scholar] [CrossRef]
- Langenheim, J.H.; Beck, C.W. Infrared spectra as a means of determining botanical sources of amber. Science 1965, 149, 52–54. [Google Scholar] [CrossRef] [PubMed]
- López-Morales, G.; Espinosa-Luna, R.; Frausto-Reyes, C. Optical characterization of amber from Chiapas, Mexico. Polariz. Sci. Remote Sens. VI Int. Soc. Opt. Photonics 2013, 8873, 887311. [Google Scholar]
- Rao, Z.; Dong, K.; Yang, X.; Lin, J.; Cui, X.; Zhou, R.; Deng, Q. Natural amber, copal resin and colophony investigated by UV-VIS, infrared and Raman spectrum. Sci. China Phys. Mech. Astron. 2013, 56, 1598–1602. [Google Scholar] [CrossRef]
- Wang, Y.; Shi, G.; Shi, W.; Wu, R. Infrared spectral characteristics of ambers from three main sources (Baltic, Dominica and Burma). Guang Pu Xue Yu Guang Pu Fenxi Spectrosc. Spectr. Anal. 2015, 35, 2164, (In Chinese with English Abstract). [Google Scholar]
- Montoro, O.R.; Tortajada, J.; Lobato, Á.; Baonza, V.G.; Taravillo, M. Theoretical (DFT) and experimental (Raman and FTIR) spectroscopic study on communic acids, main components of fossil resins. Spectrochim. Acta Part A Mol. Biomol. Spectrosc. 2020, 224, 117405. [Google Scholar] [CrossRef]
- Colomban, P.; Simsek Franci, G.; Koleini, F. On-Site Raman Spectroscopic Study of Beads from the Necropolis of Vohemar, Northern Madagascar (>13th C.). Heritage 2021, 4, 524–540. [Google Scholar] [CrossRef]
- Rygula, A.; Klisińska-Kopacz, A.; Krupska, P.; Kuraś, E.; del Hoyo-Meléndez, J.M. The surface degradation of Baltic amber: The depth-profiling analysis and its application to historical object. J. Raman Spectrosc. 2021, 52, 123–129. [Google Scholar] [CrossRef]
- Dai, L.; Shi, G.; Yuan, Y.; Jiang, X.; Liu, W. Influences on Baltic Amber Spectral Characteristics under Thermal Optimization with Multiple Conditions. Spectrosc. Spectr. Anal. 2021, 41, 1300–1305. [Google Scholar]
- Jehlička, J.; Edwards, H.G.M.; Jorge Villar, S.E.; Frank, O. Raman spectroscopic study of the complex aromatic mineral idrialite. J. Raman Spectrosc. 2006, 37, 771–776. [Google Scholar] [CrossRef]
- Riquelme, F.; Ruvalcaba-Sil, J.; Alvarado-Ortega, J.; Estrada-Ruiz, E.; Galicia-Chávez, M.; Porras-Múzquiz, H.; Miller, L. Amber from México: Coahuilite, simojovelite and bacalite. MRS Online Proc. Libr. OPL 2014, 1618, 169–180. [Google Scholar] [CrossRef]
- Sonibare, O.O.; Agbaje, O.B.; Jacob, D.E.; Faithfull, J.; Hoffmann, T.; Foley, S.F. Terpenoid composition and origin of amber from the Cape York Peninsula, Australia. Aust. J. Earth Sci. 2014, 61, 979–985. [Google Scholar] [CrossRef]
- Chekryzhov, I.Y.; Nechaev, V.P.; Kononov, V.V. Blue-fluorescing amber from Cenozoic lignite, eastern Sikhote-Alin, Far East Russia: Preliminary results. Int. J. Coal Geol. 2014, 132, 6–12. [Google Scholar] [CrossRef]
- Poulin, J.; Helwig, K. Inside amber: New insights into the macromolecular structure of Class Ib resinite. Org. Geochem. 2015, 86, 94–106. [Google Scholar] [CrossRef]
- Xing, Y.Y. Application of Attenuated Total Reflectance Infrared Spectroscopy (ATR-FTIR) for Amber Identification and Research. Guang Pu Xue Yu Guang Pu Fen Xi Guang Pu 2016, 36, 2066–2070. [Google Scholar]
- Odriozola, C.P.; Garrido-Cordero, J.A.; Luján, J.D.; Sanz, M. Resin-coated beads in Iberian Late Prehistory (3rd–2nd millennia BCE). Mater. Manuf. Process. 2020, 35, 1420–1423. [Google Scholar] [CrossRef]
- Zhao, T.; Wang, Y.; Liu, L.; Li, Y. Gemological and Spectral Characteristics of Mexican Red Blue Amber. Spectrosc. Spectr. Anal. 2021, 41, 2618–2625. [Google Scholar]
- Cockx, P.; Tappert, R.; Muehlenbachs, K.; Somers, C.; McKellar, R.C. Amber from a Tyrannosaurus rex bonebed (Saskatchewan, Canada) with implications for paleoenvironment and paleoecology. Cretac. Res. 2021, 125, 104865. [Google Scholar] [CrossRef]
- Musa, M.; Kaye, T.G.; Bieri, W.; Peretti, A. Burmese amber compared using micro-attenuated total reflection infrared spectroscopy and ultraviolet imaging. Appl. Spectrosc. 2021, 75, 839–845. [Google Scholar] [CrossRef] [PubMed]
- Demirel, G.; Usta, H.; Yilmaz, M.; Celik, M.; Alidagibe, H.A.; Buyukserind, F. Surface-enhanced Raman spectroscopy (SERS): An adventure from plasmonic metals to organic semiconductors as SERS platforms. J. Mater. Chem. C 2018, 6, 5314–5335. [Google Scholar] [CrossRef]
- Leopold, N.; Lendl, B. A new method for fast preparation of highly surface-enhanced Raman scattering (SERS) active silver colloids at room temperature by reduction of silver nitrate with hydroxylamine hydrochloride. J. Phys. Chem. B 2003, 107, 5723–5727. [Google Scholar] [CrossRef]
- Moerl, L.; Pettinger, B. The role of Cu atoms on silver electrodes in surface enhanced Raman scattering from pyridine: Giant enhancement by a minority of adsorbed molecules. Solid State Commun. 1982, 43, 315–320. [Google Scholar] [CrossRef]
- Lv, L.; He, L.; Jiang, S.; Chen, J.; Zhou, C.; Qu, J.; Lu, Y.; Hong, P.; Sun, S.; Li, C. In situ surface-enhanced Raman spectroscopy for detecting microplastics and nanoplastics in aquatic environments. Sci. Total Environ. 2020, 728, 138449. [Google Scholar] [CrossRef]
- Shan, J.; Zhang, Y.; Wang, J.; Ren, T.; Jin, M.; Wang, X. Microextraction based on microplastic followed by SERS for on-site detection of hydrophobic organic contaminants, an indicator of seawater pollution. J. Hazard. Mater. 2020, 400, 123202. [Google Scholar] [CrossRef]
- Zhou, X.-X.; Liu, R.; Hao, L.-T.; Liu, J.-F. Identification of polystyrene nanoplastics using surface enhanced Raman spectroscopy. Talanta 2021, 221, 121552. [Google Scholar] [CrossRef]
- Yang, Q.; Zhang, S.; Su, J.; Li, S.; Lv, X.; Chen, J.; Lai, Y.; Zhan, J. Identification of Trace Polystyrene Nanoplastics Down to 50 nm by the Hyphenated Method of Filtration and Surface-Enhanced Raman Spectroscopy Based on Silver Nanowire Membranes. Environ. Sci. Technol. 2022, 56, 10818–10828. [Google Scholar] [CrossRef] [PubMed]
- Turkevich, J.; Stevenson, P.C.; Hillier, J. A study of the nucleation and growth processes in the synthesis of colloidal gold. Discuss. Faraday Soc. 1951, 11, 55–75. [Google Scholar] [CrossRef]
- Matuszewska, A.; Czaja, M. Aromatic compounds in molecular phase of Baltic ambe-synchronous luminescence analysis. Talanta 2002, 56, 1049–1059. [Google Scholar] [CrossRef] [PubMed]
- Baranov, A.V.; Bobovich, Y.S.; Ermolaev, V.L. Resonance Raman scattering (RS) spectra of triplet. JETP Lett. 1980, 32, 8. [Google Scholar]
- Kim, J.; Lee, N.; Min, Y.H.; Noh, S.; Kim, N.-K.; Jung, S.; Joo, M.; Yamada, Y. Distinguishing zigzag and armchair edges on graphene nanoribbons by X-ray photoelectron and Raman spectroscopies. ACS Omega 2018, 3, 17789–17796. [Google Scholar] [CrossRef]
- Zemlyakova, E.S.; Tcibulnikova, A.V.; Slezhkin, V.A.; Zubin, A.Y.; Samusev, I.G.; Bryukhanov, V.V. The infrared spectroscopy of chitosan films doped with silver and gold nanoparticles. J. Polym. Eng. 2019, 39, 415–421. [Google Scholar] [CrossRef]
- Silva, S.M.; Braga, C.R.; Fook, M.V.; Raposo, C.M.; Carvalho, L.H.; Canedo, E.L. Application of infrared spectroscopy to analysis of chitosan/clay nanocomposites. Infrared Spectrosc. Mater. Sci. Eng. Technol. 2012, 43–62. [Google Scholar]


| Mass of Amber before Evaporation, g | Volume of Water, mL | Boiling Time, min | Mass of Amber after Evaporation, g | Mass Difference of Amber before and after Evaporation, g |
|---|---|---|---|---|
| 0.5505 | 40 | 20 | 0.5503 | 0.0002 |
| 0.5694 | 40 | 40 | 0.5689 | 0.0005 |
| 0.5334 | 40 | 60 | 0.5318 | 0.0016 |
| 0.5450 | 40 | 80 | 0.5441 | 0.0009 |
| 0.5486 | 40 | 120 | 0.5467 | 0.0019 |
| Amber Mass, g | KBr Powder Mass KBr, g | Volume of Silver NPs, mkl | The Mass of the Mixture Taken for Pressing, g |
|---|---|---|---|
| 0.0375 | 0.4353 | - | 0.1576 |
| 0.0336 | 0.4200 | 3 | 0.1512 |
| 0.0343 | 0.4206 | 5 | 0.1527 |
| 0.0347 | 0.4232 | 10 | 0.1536 |
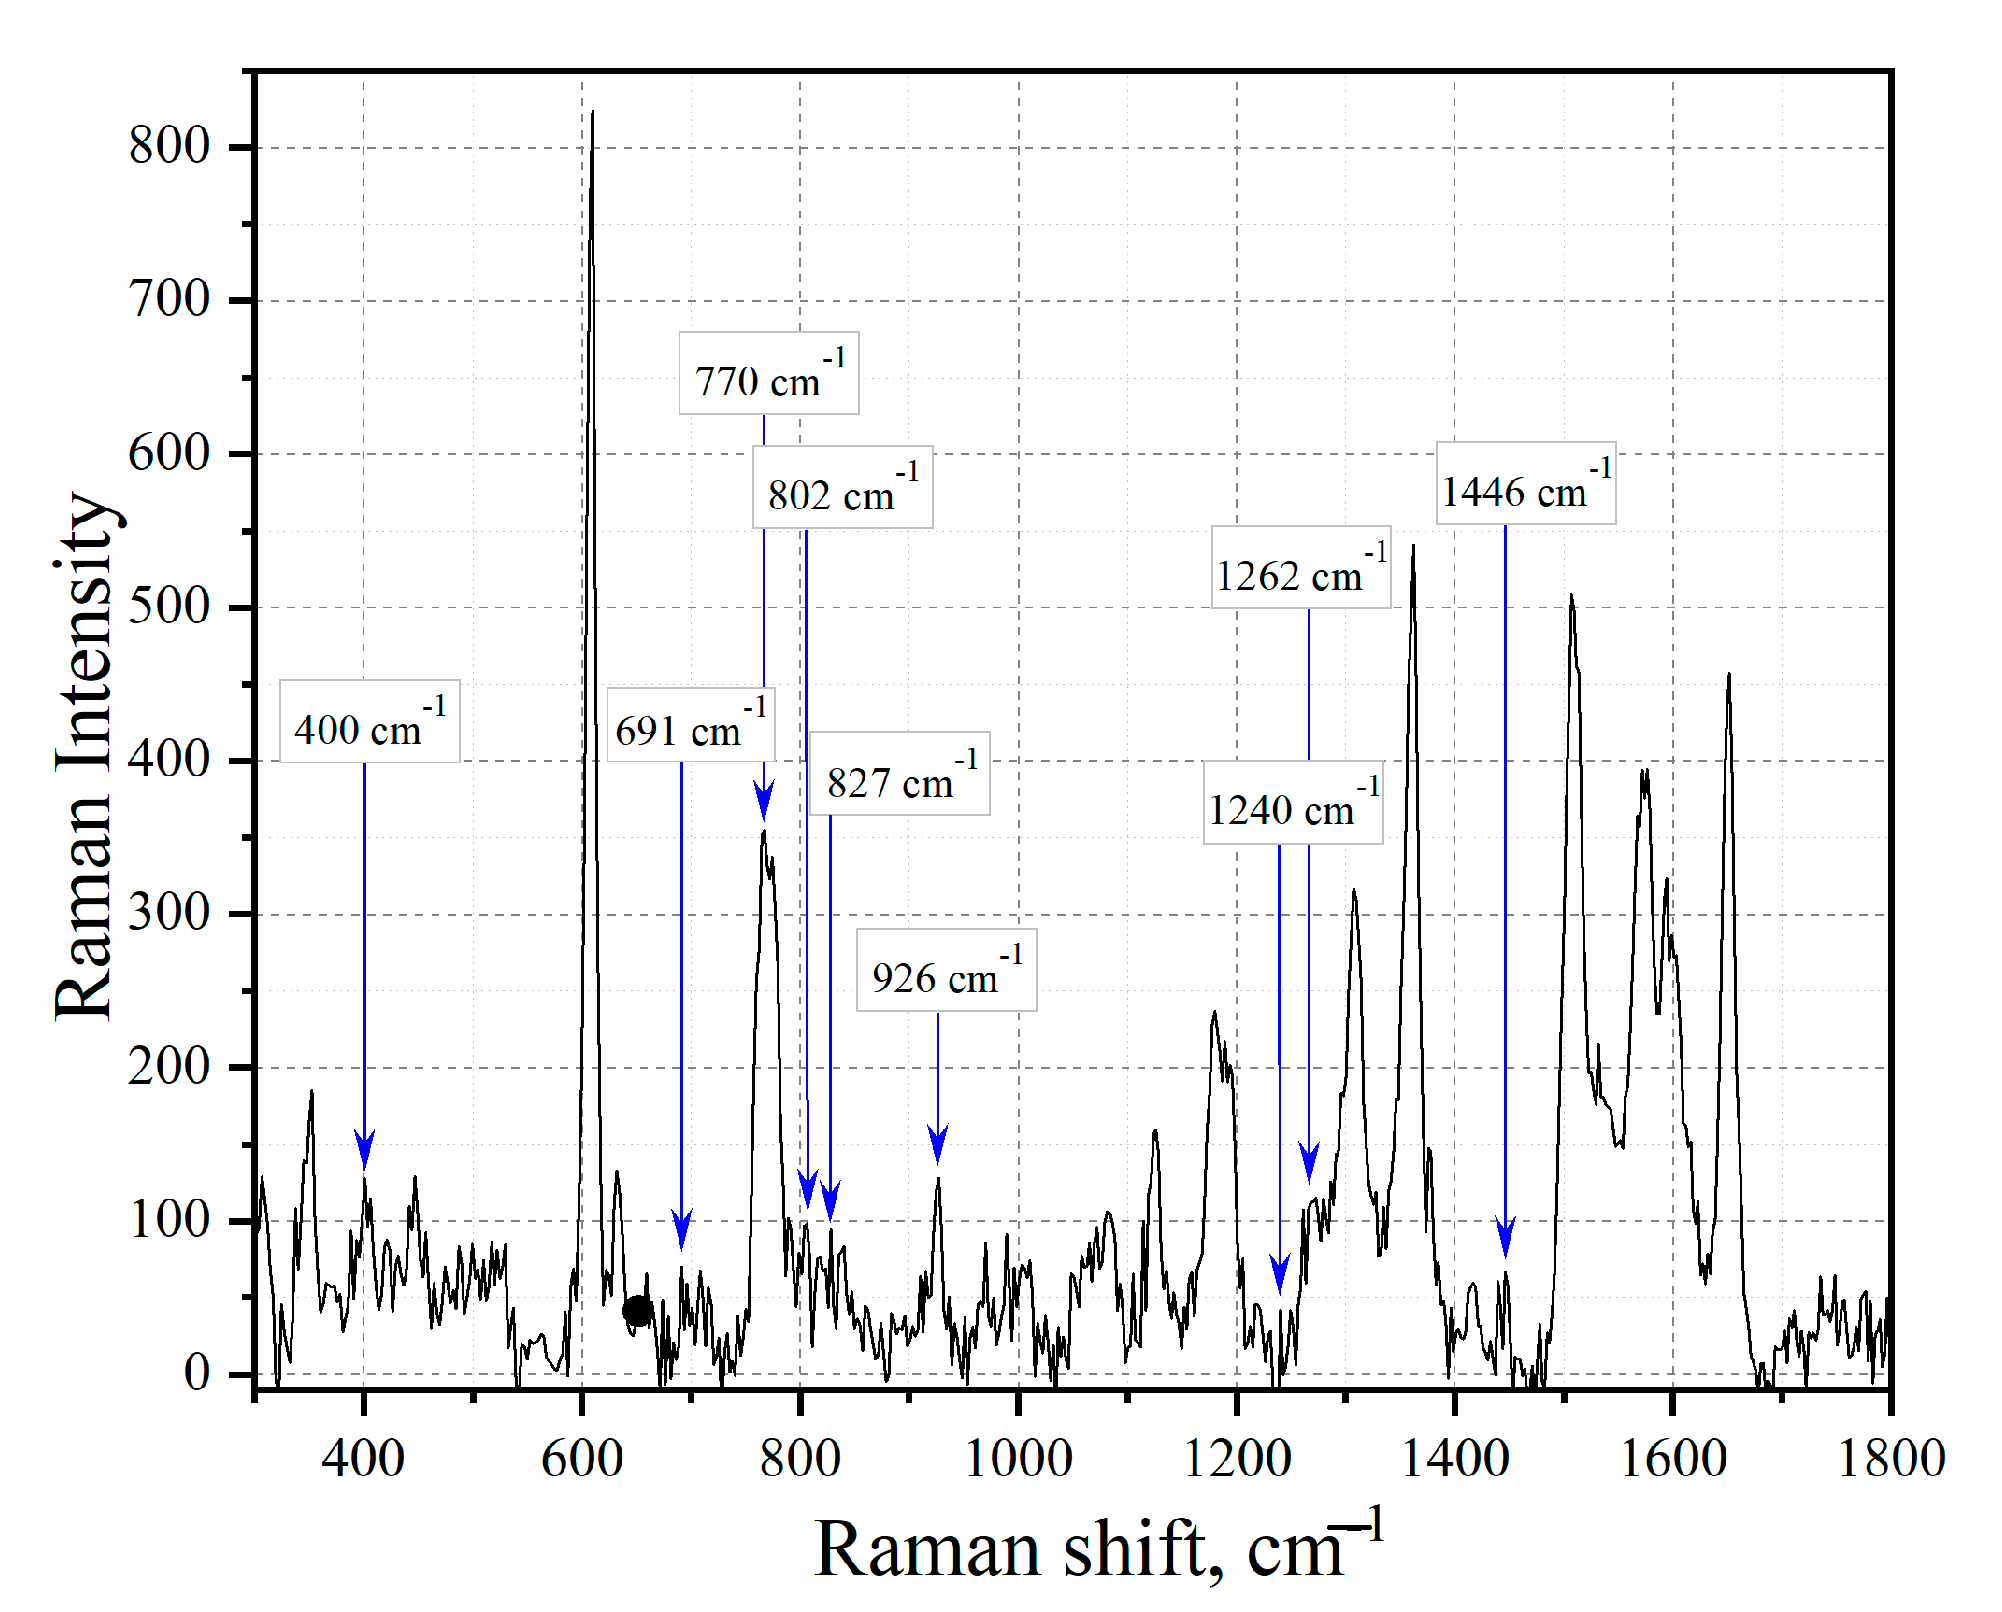
| Group (Aromatics) | Bond | Spectral Shift Position, cm−1 | Intensity | Mode |
|---|---|---|---|---|
| o-disubstituted ring | CH | 1262 | weak | bending in-plane H bend |
| CH | 1126 | weak | bending in-plane H bend | |
| CH | 926 | weak | four adjacent H out-of-plane deformations | |
| CH | 827 | weak | five adjacent H out-of-plane deformations | |
| p-disubstituted ring | Ring | 1446 | medium | stretching |
| CH | 1117 | weak | bending in-plane H bend | |
| 1,3,5-trisubstituted | Ring | 1446 | medium | stretching |
| CH | 1262 | weak | bending in-plane H bend | |
| Ring | 705 | strong | out-of-plane ring bending | |
| 1,2,3,4,5,6-substituted | Ring | 1446 | medium | stretching |
| Ring | 400 | medium–strong | deformation | |
| m-disubstituted ring | Ring | 1446 | medium | stretching |
| Ring | 691 | strong | out-of-plane ring bending | |
| 1,2,4,5-substituted | Ring | 1446 | medium | stretching |
| CH | 802 | weak | one adjacent H out-of-plane deformation | |
| 1,2,4-trisubstituted | CH | 770 | strong | two adjacent H out-of-plane deformations |
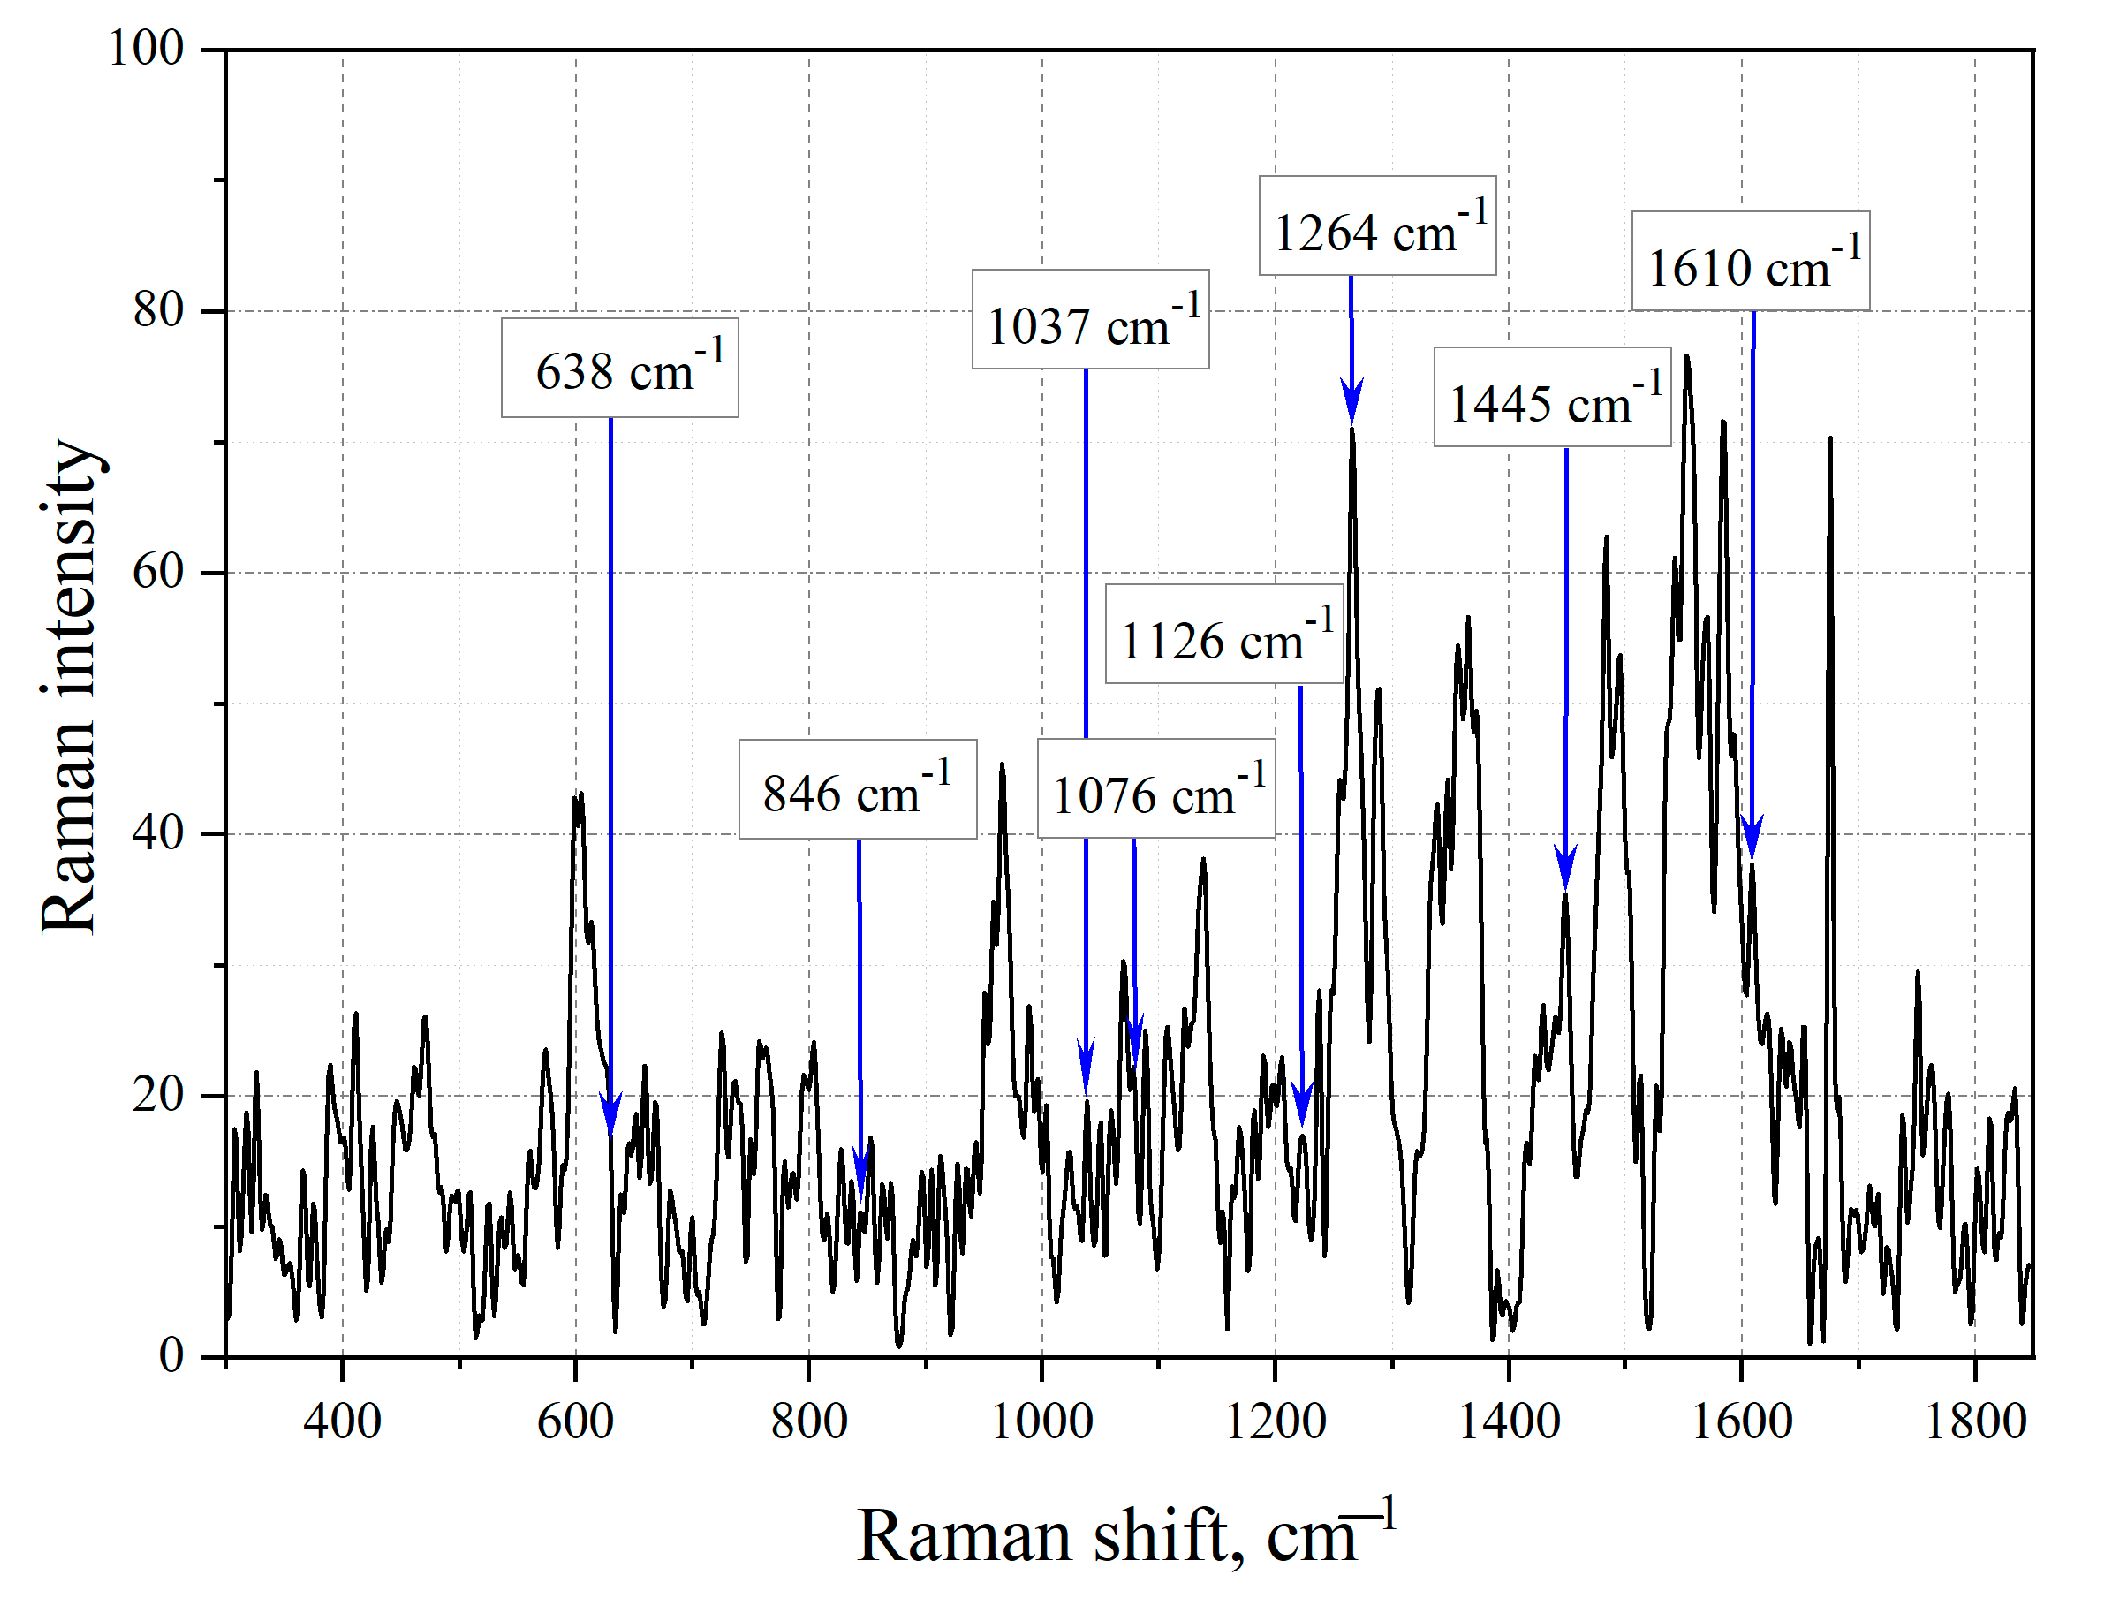
| Group (Aromatics) | Bond | Spectral Shift Position, cm−1 | Intensity | Mode |
|---|---|---|---|---|
| o-disubstituted ring | Ring | 1602 | Medium | bending–stretching |
| Ring | 1577 | Medium | bending–stretching | |
| Ring | 1445 | Medium | stretching | |
| CH | 1264 | Medium | bending in-plane H bend | |
| CH | 1126 | Weak | bending in-plane H bend | |
| CH | 1076 | Weak | bending in-plane H bend | |
| CH | 1037 | Weak | bending in-plane H bend | |
| p-disubstituted ring | Ring | 1610 | Medium | bending–stretching |
| Ring | 1503 | Weak | bending–stretching | |
| CH | 981 | Weak | bending in-plane H bend | |
| CH | 638 | Weak | bending in-plane H bend | |
| 1,3,5-trisubstituted | Ring | 1610 | Medium | stretching |
| Ring | 1498 | Medium | stretching | |
| Ring | 1265 | Weak | bending in-plane H bend | |
| Ring | 1015 | Strong | bending in-plane H bend | |
| 1,2,3,4,5,6-substituted | Ring | 1610 | medium–strong | stretching |
| 1,2,3,4,5-substituted | CH | 875 | Weak | one adjacent H out-of-plane deformation |
| 1,2,3,4-substituted | Ring | 1445 | Medium | stretching |
| CH | 846 | Weak | two adjacent H out-of-plane deformations | |
| 1,2,3,5-substituted | Ring | 1610 | Medium | stretching |
| Ring | 1498 | Weak | stretching | |
| Ring | 1445 | Medium | stretching | |
| CH | 846 | Weak | one adjacent H out-of-plane deformation | |
| 1,2,3-trisubstituted | Ring | 1610 | Medium | stretching |
| Ring | 1498 | Weak | stretching | |
| Ring | 1445 | Weak | stretching | |
| CH | 1155 | Weak | weak | |
| CH | 1076 | Weak | bending in-plane H bend | |
| CH | 1019 | medium–strong | bending in-plane H bend | |
| m-disubstituted ring | Ring | 1610 | medium–weak | bending–stretching |
| Ring | 1233 | medium–strong | bending in-plane H bend | |
| CH | 1159 | Weak | bending in-plane H bend | |
| 1,2,4,5-substituted | Ring | 1610 | Medium | stretching |
| Ring | 1498 | Weak | stretching | |
| CH | 1193 | Weak | bending | |
| CH | 886 | Weak | one adjacent H out-of-plane deformation | |
| 1,2,4-trisubstituted | Ring | 1610 | Medium | stretching |
| Ring | 1583 | Medium | stretching | |
| Ring | 1498 | Weak | stretching | |
| Ring | 1445 | Weak | stretching | |
| CH | 1209 | Weak | bending | |
| CH | 1167 | Weak | bending | |
| CH | 1027 | Weak | bending |
| Group (Aromatics) | Bond | Spectral Shift Position, cm−1 | Intensity | Mode |
|---|---|---|---|---|
| 1,2,3,4-substituted | CH | 846 | Weak | two adjacent H out-of-plane deformations |
| 1,2,3,5-substituted | CH | 846 | Weak | one adjacent H out-of-plane deformation |
| 1,2,3,4,5-substituted | CH | 875 | Weak | one adjacent H out-of-plane deformation |
| 1,2,4,5-substituted | CH | 886 | Weak | one adjacent H out-of-plane deformation |
| o-disubstituted ring | CH | 1125 | Weak | bending in-plane H bend |
| 1,2,4-trisubstituted | CH | 1165 | Weak | bending |
| 1,2,4,5-substituted | CH | 1183 | Weak | bending |
| 1,2,3,4-substituted | CH | 1204 | Weak | bending |
| 1,2,4-trisubstituted | CH | 1206 | Weak | bending |
| o-disubstituted | CH | 1260 | Medium | bending in-plane H bend |
| 1,3,5-trisubstituted | Ring | 1265 | Weak | bending in-plane H bend |
| 1,2,3-trisubstituted | Ring | 1445 | Weak | stretching |
| m-disubstituted ring | Ring | 1610 | medium–weak | bending–stretching |
| Group (Aromatics) | Bond | Spectral Shift Position, cm−1 | Intensity | Mode |
|---|---|---|---|---|
| 1,2,4-trisubstituted | CH | 770 | Strong | two adjacent H out-of-plane deformations |
| 1,2,4,5-substituted | CH | 805 | Weak | one adjacent H out-of-plane deformation |
| o-disubstituted ring | CH | 1262 | Weak | bending in-plane H bend |
Disclaimer/Publisher’s Note: The statements, opinions and data contained in all publications are solely those of the individual author(s) and contributor(s) and not of MDPI and/or the editor(s). MDPI and/or the editor(s) disclaim responsibility for any injury to people or property resulting from any ideas, methods, instructions or products referred to in the content. |
© 2023 by the authors. Licensee MDPI, Basel, Switzerland. This article is an open access article distributed under the terms and conditions of the Creative Commons Attribution (CC BY) license (https://creativecommons.org/licenses/by/4.0/).
Share and Cite
Kundalevich, A.; Zyubin, A.; Matveeva, K.; Samusev, I.; Lyatun, I. Determination of Anthracene Derivatives in Baltic Amber Using SERS. Sensors 2023, 23, 2161. https://doi.org/10.3390/s23042161
Kundalevich A, Zyubin A, Matveeva K, Samusev I, Lyatun I. Determination of Anthracene Derivatives in Baltic Amber Using SERS. Sensors. 2023; 23(4):2161. https://doi.org/10.3390/s23042161
Chicago/Turabian StyleKundalevich, Anna, Andrey Zyubin, Karina Matveeva, Ilia Samusev, and Ivan Lyatun. 2023. "Determination of Anthracene Derivatives in Baltic Amber Using SERS" Sensors 23, no. 4: 2161. https://doi.org/10.3390/s23042161
APA StyleKundalevich, A., Zyubin, A., Matveeva, K., Samusev, I., & Lyatun, I. (2023). Determination of Anthracene Derivatives in Baltic Amber Using SERS. Sensors, 23(4), 2161. https://doi.org/10.3390/s23042161