

An Electrochemical Nickel–Cobalt (Ni–Co)/Graphene Oxide-Polyvinyl Alcohol (GO-PVA) Sensor for Glucose Detection

Abstract
1. Introduction
2. Materials and Methods
2.1. Materials
- For sensor fabrication
- Bio-materials
2.2. Sensor Fabrication
2.3. Measurements
3. Results
3.1. Sensor Characteristics
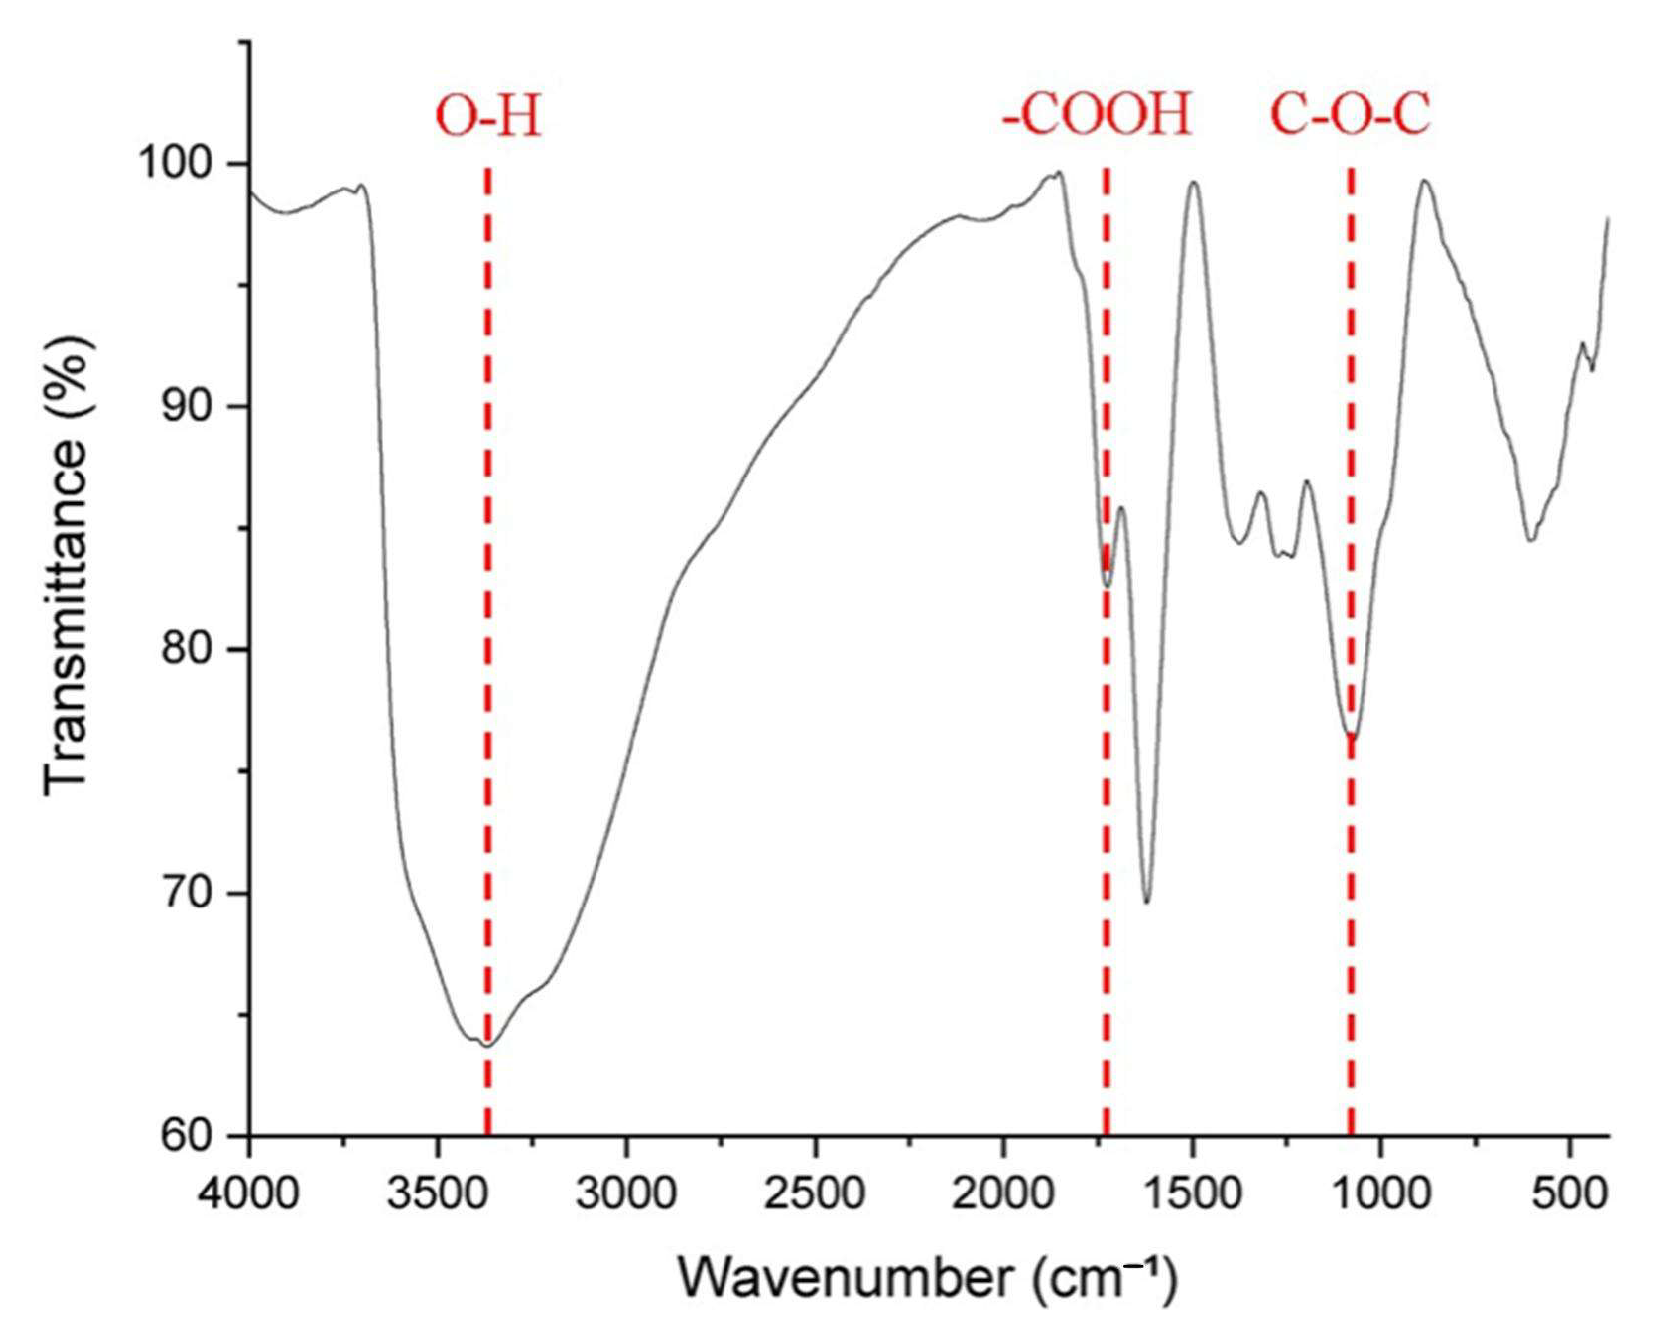
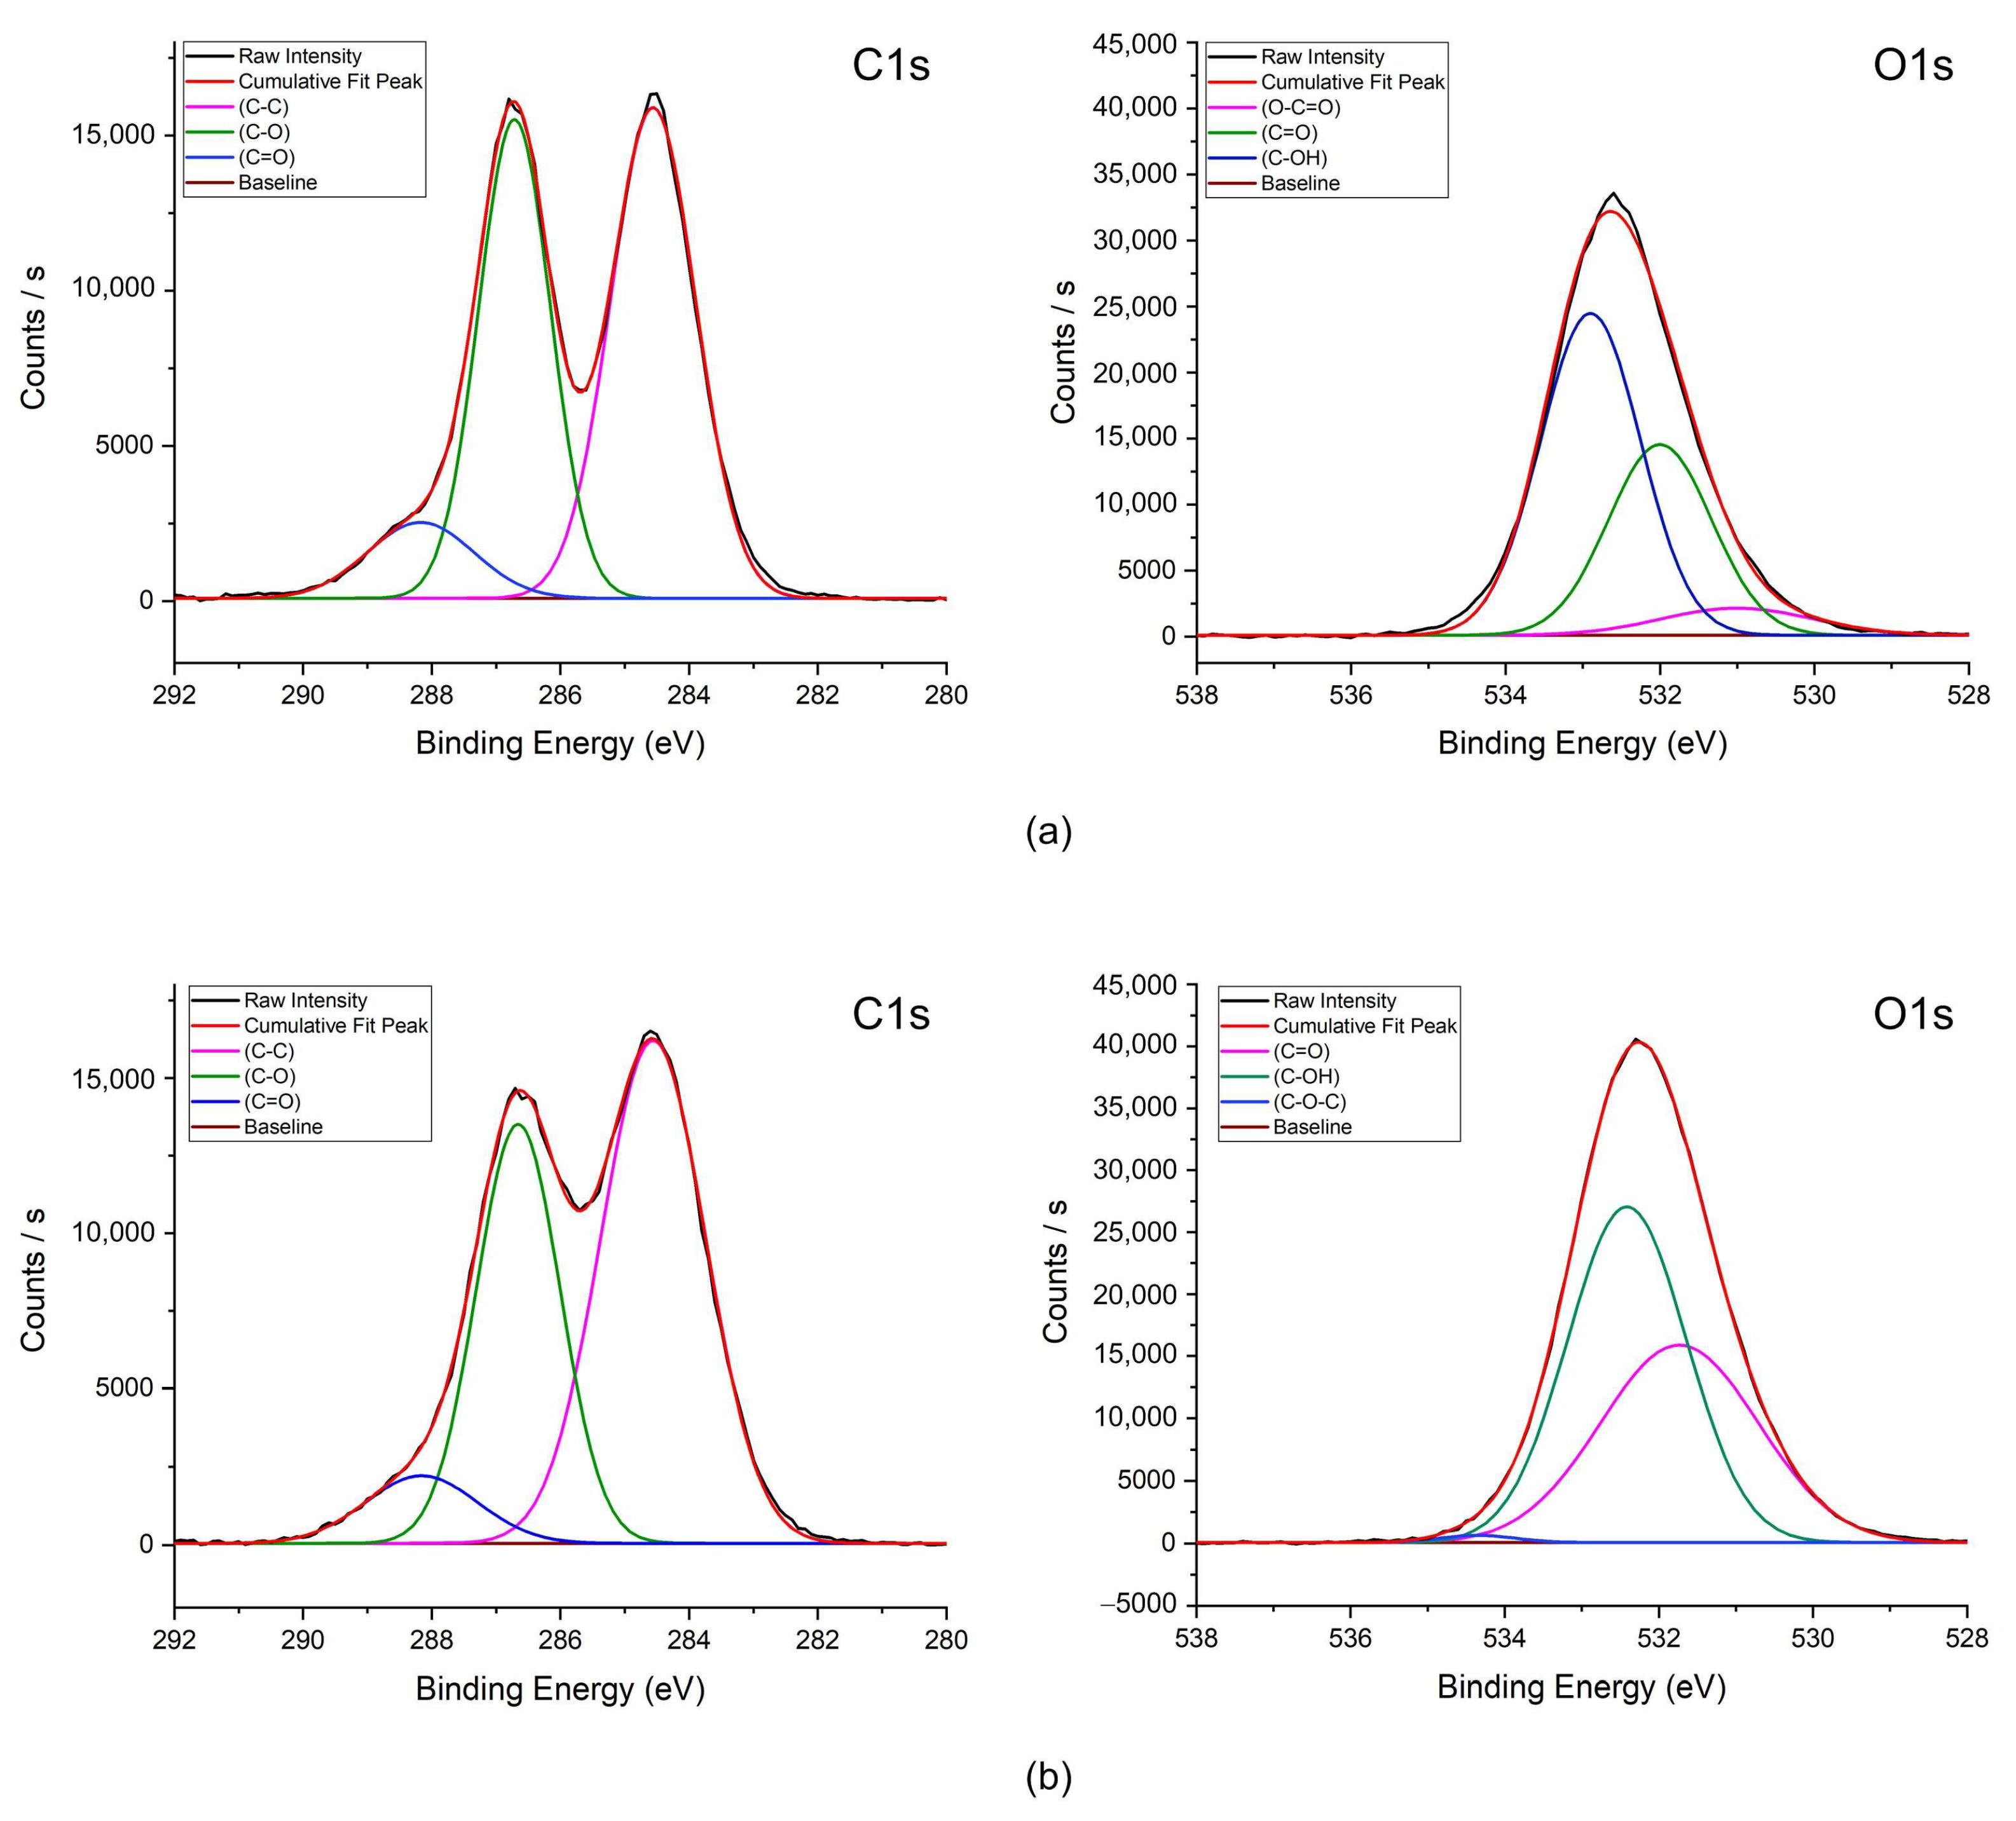
- Characteristics of GO
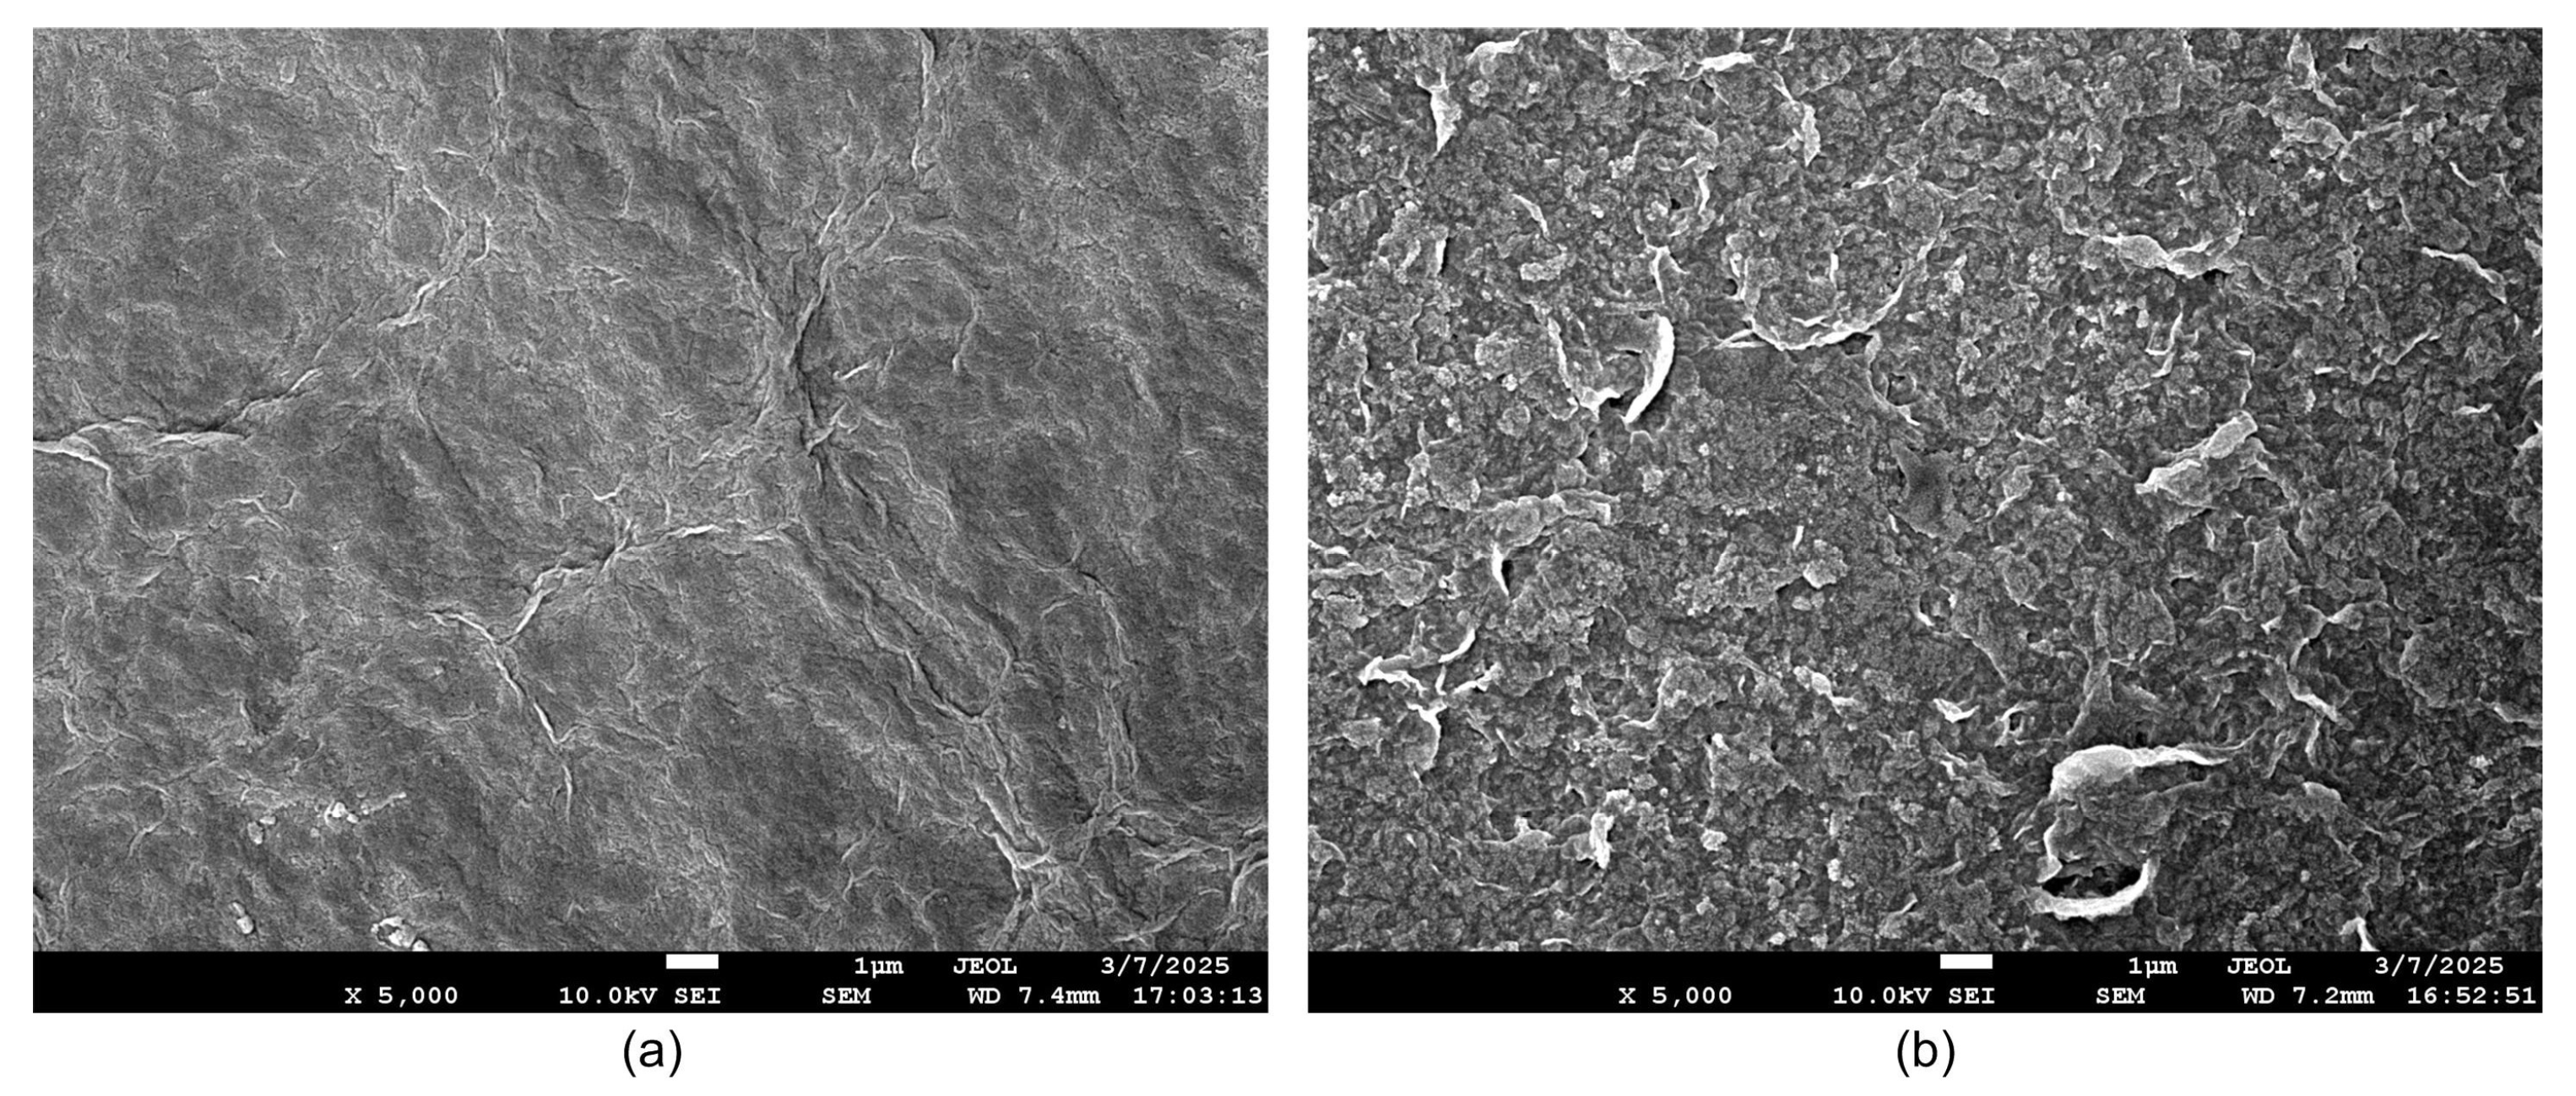
- Ni–Co electroplating
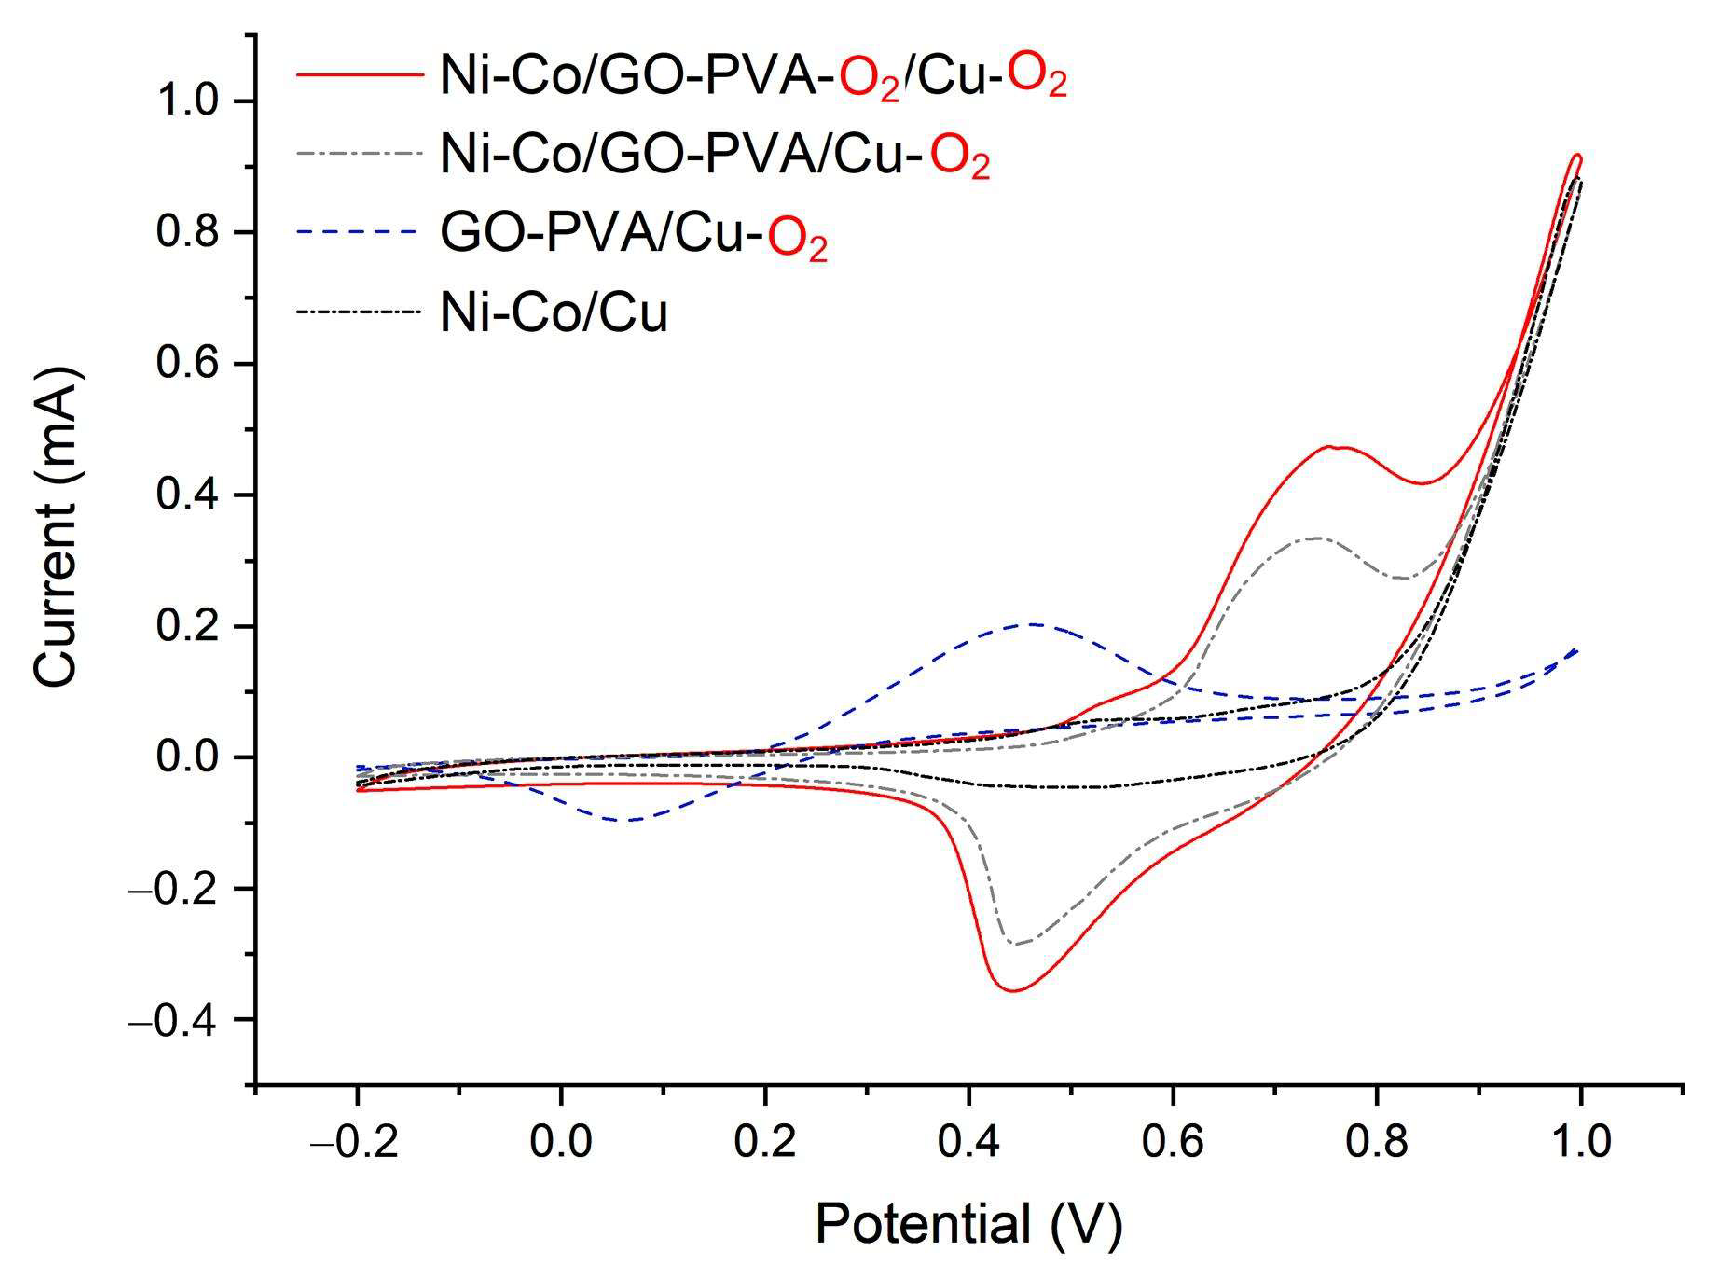
3.2. Detection of Glucose
3.3. Detection of Glucose with Insulin
4. Discussion
5. Conclusions
Supplementary Materials
Author Contributions
Funding
Institutional Review Board Statement
Informed Consent Statement
Data Availability Statement
Conflicts of Interest
References
- Diabetes. Available online: https://www.who.int/news-room/fact-sheets/detail/diabetes (accessed on 20 March 2025).
- Li, H.-Y.; Wu, Y.-L.; Tu, S.T.; Hwu, C.-M.; Liu, J.-S.; Chuang, L.-M. Trends of mortality in diabetic patients in Taiwan: A nationwide survey in 2005–2014. J. Formos. Med. Assoc. 2019, 118, S83–S89. [Google Scholar] [CrossRef] [PubMed]
- GBD 2021 Diabetes Collaborators. Global, regional, and national burden of diabetes from 1990 to 2021, with projections of prevalence to 2050: A systematic analysis for the Global Burden of Disease Study 2021. Lancet 2023, 402, 203–234. [Google Scholar] [CrossRef] [PubMed]
- Khadem, H.; Eissa, M.R.; Nemat, H.; Alrezj, O.; Benaissa, M. Classification before regression for improving the accuracy of glucose quantification using absorption spectroscopy. Talanta 2020, 211, 120740. [Google Scholar] [CrossRef] [PubMed]
- Attia, H.; Mahnashi, Y.; Qaid, A.; Mohamed, N.E.; Qureshi, K.K. Near-infrared spectroscopy for glucose detection in aqueous solution. Results Opt. 2024, 16, 100738. [Google Scholar] [CrossRef]
- Liu, J.; Chu, J.; Xu, J.; Zhang, Z.; Wang, S. In vivo Raman spectroscopy for non-invasive transcutaneous glucose monitoring on animal models and human subjects. Spectrochim. Acta Part A: Mol. Biomol. Spectrosc. 2025, 329, 125584. [Google Scholar]
- Calabria, D.; Lazzarini, E.; Pace, A.; Trozzi, I.; Zangheri, M.; Cinti, S.; Difonzo, M.; Valenti, G.; Guardigli, M.; Paolucci, F.; et al. Smartphone-based 3D-printed electrochemiluminescence enzyme biosensor for reagentless glucose quantification in real matrices. Biosens. Bioelectron. 2023, 227, 115146. [Google Scholar] [CrossRef]
- Huang, J.; Xu, S.; Yan, F.; Liu, J. Electrochemiluminescence enzyme biosensors for ultrasensitive determination of glucose using glucose dehydrogenase immobilized on vertical silica nanochannels. Sens. Actuators B Chem. 2024, 402, 135119. [Google Scholar] [CrossRef]
- Momeni, F.; Khoshfetrat, S.M.; Bagheri, H.; Zarei, K. Ti3C2 MXene-based nanozyme as coreaction accelerator for enhancing electrochemiluminescence of glucose biosensing. Biosens. Bioelectron. 2024, 250, 116078. [Google Scholar] [CrossRef]
- Bakay, M.S.; Elibol, E.; Çadırcı, M. CdSeTe quantum dot based fluorescence sensor systems for detection of vitamin C, folic acid and glucose. Microchem. J. 2024, 206, 111543. [Google Scholar] [CrossRef]
- Xu, Y.; Dai, C.; Xu, Z. Sensitive fluorescence turn-on sensing of hydroxyl radical and glucose based on the oxidative degradation of reductive organic cage. Talanta 2025, 286, 127518. [Google Scholar] [CrossRef]
- Zhang, H.; Ma, X.; Yu, L.; He, S.; Zhu, R.; Meng, Z. Constructing “off–on” luminescence biosensor based on fluorescence resonance energy transfer for autofluorescence-free detection of uric acid and glucose. Inorg. Chem. Commun. 2025, 174, 113889. [Google Scholar] [CrossRef]
- Zhang, D.; Chen, X.; Ma, W.; Yang, T.; Li, D.; Dai, B.; Zhang, Y. Direct electrochemistry of glucose oxidase based on one step electrodeposition of reduced graphene oxide incorporating polymerized L-lysine and its application in glucose sensing. Mater. Sci. Eng. C 2019, 104, 109880. [Google Scholar] [CrossRef] [PubMed]
- Gouyon, J.; Ehinger, C.; Helu, M.A.B.; Walcarius, A. Electrochemical pH modulator coupled with Ni-based electrode for glucose sensing. Talanta 2025, 287, 127596. [Google Scholar] [PubMed]
- Wang, Q.; Jiao, C.; Chen, W.; Li, L.; Zhang, X.; Guo, Z.; Hu, L.; Fan, Y. Reusable gallium-based electrochemical sensor for efficient glucose detection. Biosens. Bioelectron. 2025, 268, 116858. [Google Scholar]
- Yang, J.; Yin, J.; Xu, L. Electrochemical non-enzymatic glucose sensors based on CuO nanostructures. J. Alloys Compd. 2025, 1010, 177796. [Google Scholar] [CrossRef]
- Sehit, E.; Altintas, Z. Significance of nanomaterials in electrochemical glucose sensors: An updated review (2016–2020). Biosens. Bioelectron. 2020, 159, 112165. [Google Scholar] [CrossRef]
- Do, H.H.; Kim, S.Y.; Van Le, Q. Development of non-precious metal oxide-based electrodes for enzyme-free glucose detection: A review. Microchem. J. 2023, 193, 109202. [Google Scholar] [CrossRef]
- Updike, S.J.; Hicks, G.P. The enzyme electrode. Nature 1967, 214, 986–988. [Google Scholar]
- Nemati, S.S.; Dehghan, G.; Rashtbari, S.; Tan, T.N.; Khataee, A. Enzyme-based and enzyme-free metal-based glucose biosensors: Classification and recent advances. Microchem. J. 2023, 193, 109038. [Google Scholar]
- Ye, J.-S.; Chen, C.-W.; Lee, C.-L. Pd nanocube as non-enzymatic glucose sensor. Sens. Actuators B Chem. 2015, 208, 569–574. [Google Scholar]
- Jia, H.; Shang, N.; Feng, Y.; Ye, H.; Zhao, J.; Wang, H.; Wang, C.; Zhang, Y. Facile preparation of Ni nanoparticle embedded on mesoporous carbon nanorods for non-enzymatic glucose detection. J. Colloid Interface Sci. 2021, 583, 310–320. [Google Scholar] [CrossRef] [PubMed]
- An, S.; Shang, N.; Chen, B.; Kang, Y.; Su, M.; Wang, C.; Zhang, Y. Co-Ni layered double hydroxides wrapped on leaf-shaped copper oxide hybrids for non-enzymatic detection of glucose. J. Colloid Interface Sci. 2021, 592, 205–214. [Google Scholar] [CrossRef] [PubMed]
- Chang, Y.-J.; Dou, J.-M.; Yeh, S.-H. Effects of nickel–cobalt material properties on glucose catalysis. Microchem. J. 2022, 182, 107950. [Google Scholar]
- Jo, H.J.; Shit, A.; Jhon, H.S.; Park, S.Y. Highly sensitive non-enzymatic wireless glucose sensor based on Ni–Co oxide nanoneedle-anchored polymer dots. J. Ind. Eng. Chem. 2020, 89, 485–493. [Google Scholar] [CrossRef]
- Meng, T.; Jia, H.; Ye, H.; Zeng, T.; Yang, X.; Wang, H.; Zhang, Y. Facile preparation of CoMoO4 nanorods at macroporous carbon hybrid electrocatalyst for nonenzymatic glucose detection. J. Colloid Interface Sci. 2020, 560, 1–10. [Google Scholar]
- Dangi, S.B.; Hashmi, S.Z.; Kumar, U.; Choudhary, B.L.; Kuznetsov, A.E.; Dalela, S.; Kumar, S.; Dolia, S.N.; Kumar, S.; Sofi, B.F.; et al. Exploration of spectroscopic, surface morphological, structural, electrical, optical and mechanical properties of biocompatible PVA-GO PNCs. Diam. Relat. Mater. 2022, 127, 109158. [Google Scholar]
- Mruthyunjayappa, K.C.; Paramashivaiah, S.A.; Mallikarjunappa, E.K.; Padre, S.M.; Gurumurthy, S.C.; Surabhi, S.; Jeong, J.-R.; Morales Montecinos, D.V.; Murari, M.S. A combined experimental and computational study of flexible polyvinyl alcohol (PVA)/graphene oxide (GO) nanocomposite films for superior UV shielding with improved mechanical properties. Mater. Today Commun. 2023, 35, 105662. [Google Scholar]
- Fatema-Tuj-Zohra; Swarna, M.A.; Mobin, E. Performance evaluation of facile synthesized CA-PVA-GO composite for the mitigation of Cr(III) and C.I. acid violet 54 dye from tannery wastewater. Sustain. Chem. Environ. 2024, 6, 100092. [Google Scholar]
- Kanta, U.-A.; Thongpool, V.; Sangkhun, W.; Wongyao, N.; Wootthikanokkhan, J. Preparations, characterizations, and a comparative study on photovoltaic performance of two different types of graphene/TiO2 nanocomposites photoelectrodes. J. Nanomater. 2017, 2017, 2758294. [Google Scholar] [CrossRef]
- Yagati, A.K.; Choi, Y.; Park, J.; Choi, J.-W.; Jun, H.-S.; Cho, S. Silver nanoflower–reduced graphene oxide composite based micro-disk electrode for insulin detection in serum. Biosens. Bioelectron. 2016, 80, 307–314. [Google Scholar] [CrossRef]
- Tang, X.; Zhang, B.; Xiao, C.; Zhou, H.; Wang, X.; He, D. Carbon nanotube template synthesis of hierarchical NiCoO2 composite for non-enzyme glucose detection. Sens Actuators B Chem. 2016, 222, 232–239. [Google Scholar]
- Arikan, K.; Burhan, H.; Bayat, R.; Sen, F. Glucose nano biosensor with non-enzymatic excellent sensitivity prepared with nickel–cobalt nanocomposites on f-MWCNT. Chemosphere 2022, 291, 132720. [Google Scholar] [PubMed]
- Liaqat, F.; Ibtesam ul Haq, I.; Saira, F.; Qaisar, S. Development of glucose sensor based on cobalt and nickel doped ceria nanostructures. Mater. Sci. Eng. B 2023, 289, 116231. [Google Scholar] [CrossRef]
- Mohite, R.A.; Shaikh, S.B.; Jadhav, S.B.; Malavekar, D.B.; Pujari, S.S.; Kim, J.H.; Lokhande, C.D.; Pawaskar, P.N. A new approach to non-enzymatic glucose sensing with real blood sample analysis: Utilizing nickel-cobalt tungstate. Chem. Eng. J. 2025, 505, 158982. [Google Scholar]


| Factor | Level 1 | Level 2 | Level 3 |
|---|---|---|---|
| Electroplating temperature (°C) | 20 | 40 | 60 |
| Current density (A/dm2) | 5 | 6.5 | 8 |
| Electroplating time (min) | 15 | 18 | 21 |
| Sensor Types | Substrate | Fabrication | Linear Range (mM) | Sensibility (μA/mM·cm2) | Reference |
|---|---|---|---|---|---|
| NiCoO2@CNT | GCE | 0.01–1.55 | 1424.41 | [32] | |
| NiCo@f-MWCNT | Chemical reduction | Up to 1.6 | 10,015 | [33] | |
| Co/CeO2 nanostructures | GCE | Sol–gel method | 0.2–1.0 | 184 | [34] |
| Ni–Co tungstate | Stainless steel | Successive ionic layer adsorption and reaction | 0.05–0.9 | 18,100 | [35] |
| Ni–Co/GO-PVA | PCB | Electroplating | 2–10 | 763.52 | This work |
Disclaimer/Publisher’s Note: The statements, opinions and data contained in all publications are solely those of the individual author(s) and contributor(s) and not of MDPI and/or the editor(s). MDPI and/or the editor(s) disclaim responsibility for any injury to people or property resulting from any ideas, methods, instructions or products referred to in the content. |
© 2025 by the authors. Licensee MDPI, Basel, Switzerland. This article is an open access article distributed under the terms and conditions of the Creative Commons Attribution (CC BY) license (https://creativecommons.org/licenses/by/4.0/).
Share and Cite
Yeh, S.-H.; Chang, Y.-J.; Hsieh, C.-Y. An Electrochemical Nickel–Cobalt (Ni–Co)/Graphene Oxide-Polyvinyl Alcohol (GO-PVA) Sensor for Glucose Detection. Sensors 2025, 25, 2050. https://doi.org/10.3390/s25072050
Yeh S-H, Chang Y-J, Hsieh C-Y. An Electrochemical Nickel–Cobalt (Ni–Co)/Graphene Oxide-Polyvinyl Alcohol (GO-PVA) Sensor for Glucose Detection. Sensors. 2025; 25(7):2050. https://doi.org/10.3390/s25072050
Chicago/Turabian StyleYeh, Shu-Hui, Yaw-Jen Chang, and Chun-Yi Hsieh. 2025. "An Electrochemical Nickel–Cobalt (Ni–Co)/Graphene Oxide-Polyvinyl Alcohol (GO-PVA) Sensor for Glucose Detection" Sensors 25, no. 7: 2050. https://doi.org/10.3390/s25072050
APA StyleYeh, S.-H., Chang, Y.-J., & Hsieh, C.-Y. (2025). An Electrochemical Nickel–Cobalt (Ni–Co)/Graphene Oxide-Polyvinyl Alcohol (GO-PVA) Sensor for Glucose Detection. Sensors, 25(7), 2050. https://doi.org/10.3390/s25072050