Abstract
Head and neck cancer ranks as the sixth-most common malignancy worldwide, characterized by high mortality and recurrence rates. Research studies indicate that molecular diagnostics play a crucial role in the early detection and prognostic evaluation of these diseases. This study aimed to identify potential biomarkers for head and neck cancer and elucidate their interactions with miRNAs and possible therapeutic drugs. Four drivers, namely, FN1, IL1A, COL1A1, and MMP9, were identified using network biology and machine learning approaches. Gene set variation analysis (GSVA) showed that these genes were significantly involved in different biological processes and pathways, including coagulation, UV-response-down, apoptosis, NOTCH signaling, Wnt-beta catenin, and other signal pathways. The diagnostic value of these hub genes was validated using receiver operating characteristic (ROC) curves. The top interactive miRNAs, including miR-128-3p, miR-218-5p, miR-214-3p, miR-124-3p, miR-129-2-3p, and miR-1-3p, targeted the key genes. Furthermore, the interaction between the key genes and drugs was also identified. In summary, the key genes and miRNAs or drugs reported in this study might provide valuable information for potential biomarkers to increase the prognosis and diagnosis of head and neck cancer.
1. Introduction
Head and neck squamous cell carcinoma (HNSCC) comprises a group of tumors originating from the squamous epithelium in the oral cavity, oropharynx, larynx, and hypopharynx [1,2,3]. HNSCC is one of the most prevalent malignancies, ranking as the sixth-most common cancer worldwide [4,5]. The lungs are the most common site for distant metastasis in HNSCC, representing 70–85% of cases [6]. Over the past decades, several major pathogenic factors of HNSCC have been identified. The PI3K/Akt/mTOR pathway interacts with and plays a role in regulating several additional signaling molecules in HNSCC [7]. Additionally, the cyclooxygenase-2 (COX-2) signaling pathway is strongly linked to tumor angiogenesis in HNSCC, with COX-2 overexpression indicating a poorer prognosis for patients with head and neck cancer [8]. Among these, HPV has emerged as the most well-studied and frequently utilized biomarker in HNSCC [9,10,11]. While many factors have been identified as contributors to HNSCC, the precise pathogenic mechanisms of this disease are not yet fully understood. Clarifying these mechanisms is essential for identifying potential target genes for HNSCC treatment. Currently, the treatment options for managing head and neck cancer include radiation therapy, surgery, and chemotherapy. The appropriate combination of these modalities is selected based on the cancer’s location and stage [12,13]. Despite the availability of various treatments, patients with HNSCC still face limited survival benefits [14].
In recent years, bioinformatics analysis has gained significant prominence as a research hotspot due to its potential to revolutionize our understanding of complex biological systems. Among the various techniques in this field, the network biology approach stands out as a powerful method for analyzing differential gene expression [15,16]. This approach not only facilitates the study of molecular mechanisms underlying genome regulation but also helps in identifying key differences in gene expression between distinct biological states or conditions. By mapping the interactions and relationships between genes, network biology provides a comprehensive view of the biological networks that govern cellular functions. This holistic perspective is crucial for pinpointing key genes, also known as hub genes, which play central roles in these networks [17,18]. Identifying these hub genes is particularly valuable because they are often critical regulators of biological processes and can serve as potential biomarkers for various diseases.
In this study, the gene expression profile of head and neck cancer was downloaded from the TCGA database [19]. Differentially expressed genes (DEGs) were initially screened based on the dataset mentioned above. Subsequently, we used a comprehensive network biology approach to identify the key regulators for HNSCC. The interactions between key genes and miRNAs were then analyzed, followed by functional enrichment analysis to construct the regulatory networks of miRNAs and genes. Additionally, a gene–drug interaction analysis was also conducted to identify potential therapeutic drug candidates targeting the key regulators. In summary, the integration of network biology and differential gene expression analysis enhances our ability to identify crucial genes that may serve as potential biomarkers for HNSCC. This integrated approach not only deepens our understanding of the molecular mechanisms driving the disease but also opens new avenues for developing precision medicine strategies tailored to individual patients’ genetic profiles.
2. Results
A total of 1065 DEGs were differentially expressed between the HNSCC and normal samples based on the criterion of p < 0.05. Among these, 405 genes were upregulated, and 660 genes were downregulated. The volcano plot and clustering module of DEGs are shown in Figure 1. To further investigate the functions and pathways of the DEGs, enrichment analysis was used, revealing the roles of these candidate genes.
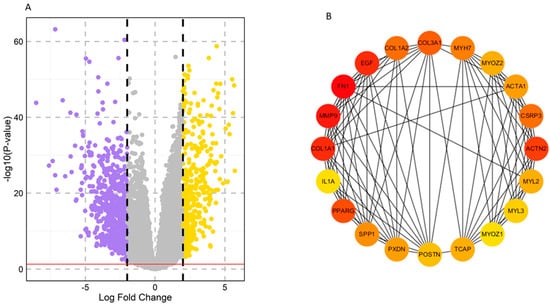
Figure 1.
Screening and identification of key genes in the TCGA–HNSCC dataset. (A) Volcano plots of DEGs based on the TCGA–HNSCC dataset. Yellow color: upregulated, Violet color: downregulated, Grey color: non–significant. (B) Top 20 hub genes selected based on degree using the CytoHubba app in Cytoscape. The color represents the degree of interaction. The higher the ranking, the more intense the red color used, whereas orange and yellow colors represent an intermediate degree of interaction and a lower degree of interaction, respectively.
2.1. Identification of Key Regulators or Hub Genes
Topological properties determine the structural characteristics of a complex biological network. Therefore, to understand the fundamental behavior of the PPI network, we analyzed its topological properties using the Network Analyzer and CytoHubba plugins in Cytoscape. In this context, the hubs of the network, which are the nodes with the highest degree, usually play a crucial role in the PPI network. Genes commonly predicted in the top 20 from the degree, betweenness centrality, and closeness centrality were identified as potential biomarkers. Ultimately, eight genes met our screening threshold consistently, including COL1A1, IL1A, MMP9, PPARG, FN1, EGF, POSTN, and PXDN (Figure 2A,B). Six out of the eight genes were found to be upregulated, with MMP9 exhibiting the maximum fold change of 4.01, followed by COL1A1 with a fold change of 3.62, while two genes were downregulated, with PPARG showing a fold change of −2.94 and EGF a fold change of −2.03 (Figure 2B). Furthermore, the expression of these four genes (COL1A1, IL1A, MMP9, and FN1) was significantly higher in HNSCC patients compared to normal samples (Figure 3A–D). Receiver operating characteristic (ROC) curve analyses were performed to assess the importance of key genes in HNSCC diagnosis and prognosis. The ROC analysis revealed that the mRNA expression levels of these four genes showed excellent diagnostic value for HNSCC cancer and adjacent tissues. The ROC curve analysis indicated that these four hub genes reasonably discriminated between HNSCC and normal samples (Figure 3E–H). Compared to normal samples, MMP9, with an AUC value of 0.95 (Figure 3F), had the largest area under the ROC curve, followed by FN1 (Figure 3G). The AUC values suggest that these genes can distinguish between HNSCC and normal samples.

Figure 2.
Identification of key regulators using three attributes of the PPI Network. (A) Intersections among top genes with the highest centrality values of closeness, betweenness, and degree. All up, 8 common genes were identified among the top 20 genes for each topological parameter. (B) Bar plot showing the fold change in expression of the 8 key regulators in individual healthy controls and HNSCC patients. The red bars represent the log2-fold change of upregulated genes, while the green bars represent the log2-fold change of downregulated genes. (C–E) The top 20 differentially expressed genes (DEGs) were assessed for their topological properties using centrality measurements, degree, betweenness, and closeness, in the network.
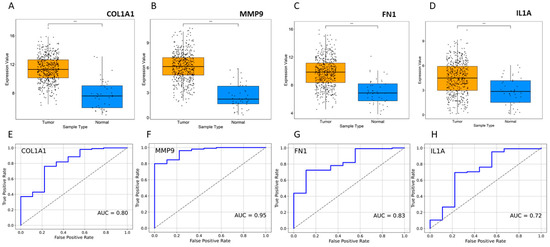
Figure 3.
Expression profile of HNSCC. (A–D) Expression of four selected genes in disease vs. normal samples. *** p ≤ 0.001. (E–H) ROC curve for significant gene expression data. The AUC values indicate that patient groups with differing diseases and controls may be distinguished by the expression analysis of the markers.
2.2. Functional Enrichment Analysis of DEGs
A total of 405 upregulated genes and 660 downregulated genes were analyzed using the DAVID software version v2023q4 [20]. Gene Ontology (GO) enrichment analysis showed that in the Biological Process (BP) category, the upregulated DEGs were involved in extracellular matrix organization, collagen fibril organization, cell adhesion, angiogenesis, cell–cell signaling, etc. (Figure 4), whereas the downregulated DEGs were significantly associated with cardiac muscle contraction and more (Figure 5). For the CC category, the upregulated DEGs were correlated with the extracellular region, extracellular space, extracellular matrix, chromatin, etc. (Figure 4), whereas the downregulated DEGs were associated with the extracellular exosome, extracellular region, extracellular space, myofibril, etc. In the MF category, the upregulated DEGs were enriched in extracellular matrix structural constituent, metalloendopeptidase activity, platelet-derived growth factor binding, collagen binding, cytokine activity, integrin binding, and CXCR chemokine receptor binding (Figure 4), whereas the downregulated DEGs were related to structural constituent of muscle, actin binding, tropomyosin binding, FATZ binding, actin filament binding, etc. For KEGG pathway enrichment analysis, the upregulated pathways included ECM–receptor interaction, focal adhesion, PI3K-Akt signaling pathway, cytokine–cytokine receptor interaction, and relaxin signaling pathway (Figure 5), whereas the downregulated KEGG pathways included PPAR signaling pathway, cardiac muscle contraction, calcium signaling pathway, motor proteins, etc.
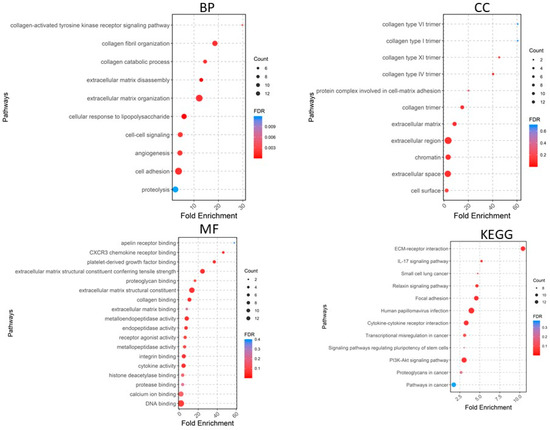
Figure 4.
Gene Ontology analyses of upregulated genes. BP, biological process; CC, cellular component; MF, molecular function; KEGG, Kyoto Encyclopedia of Genes and Genomes.
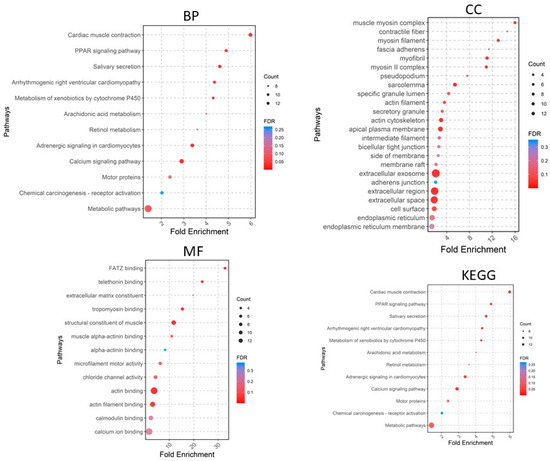
Figure 5.
Gene Ontology analyses of downregulated genes. BP, biological process; CC, cellular component; MF, molecular function; KEGG, Kyoto Encyclopedia of Genes and Genomes.
2.3. Relationship of Hub Genes and Disease-Related Genes
The disease genes linked to HNSCC tumorigenesis were identified from the GeneCards database (https://www.genecards.org/, accessed on 9 May 2024). This analysis highlighted significant differences in expression levels of several disease-associated genes between the control and HNSCC groups, including TP53, MET, NOTCH1, PTEN, PIK3CA, EGFR, CDKN2A, BRCA1, BRCA2, BRAF, and PALB2 (Figure 6A). Pearson correlation analysis revealed that FN1, MMP9, COL1A1, and IL1A were notably associated with the expression of these disease-related genes. Figure 6B illustrates that high expression of COL1A1, MMP9, and FN1 positively correlated with MET, EGFR, PTEN, and PIK3CA (excluding IL1A) and negatively correlated with TP53 and CDKN2A (excluding MMP9).
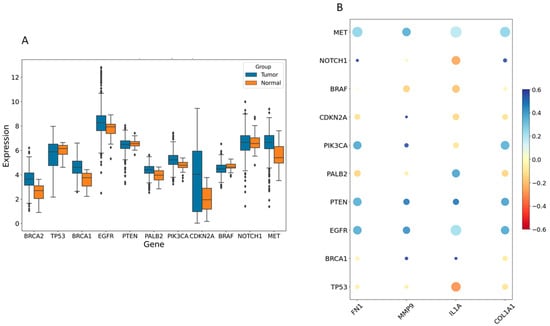
Figure 6.
The relationship between hub genes and disease-related genes. (A) The expression levels of various disease-related genes were compared between control and individuals with HNSCC. (B) A bubble plot was used to visualize the Pearson correlations between four hub genes (FN1, IL1A, MMP9, and COL1A1) and disease-related genes. Larger circles indicate p-values closer to zero, while redder shades represent stronger negative correlations and deeper blue shades indicate stronger positive correlations.
2.4. Gene Set Variation Analysis (GSVA) Analyses
We proceeded to analyze the specific signaling pathways involved in the four hub genes and explored the effect of candidate genes on the signaling pathways related to disease progression. GSVA results showed that high expression of COL1A1 primarily enriched coagulation, UV-response-down, apoptosis, NOTCH signaling, Wnt-beta catenin, and other signal pathways (Figure 7). High expression of FN1 mainly enriched signaling pathways such as UV-response-up, NOTCH signaling, interferon gamma response, TGF-beta signaling, IL6-JAK-STAT3 signaling, and apoptosis, whereas MMP9 is primarily enriched in signaling pathways such as coagulation, apical junction, UV response-up, KRAS signaling-up, interferon gamma response, and IL6-JAK-STAT3 (Figure 7). Low expression of IL1A enriched KRAS signaling-down and bile–acid metabolism, whereas low expression of MMP9 and COL1A1 enriched DNA repair, E2F target, fatty acid metabolism, MYC target V2, and G2M checkpoint.
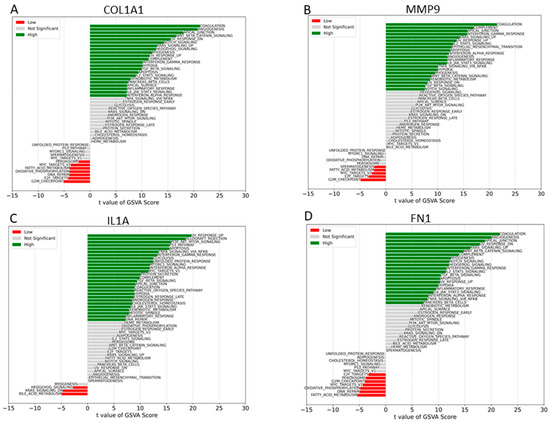
Figure 7.
GSVA analysis of high and low expression. (A) GSVA of COL1A1. (B) GSVA of MMP9. (C) GSVA of IL1A. (D) GSVA of FN1.
2.5. Prediction of miRNAs of Hub Genes and Enrichment Analyses
Among the interacting miRNA–mRNA pairs, four genes (COL1A1, IL1A, MMP9, and FN1) were mapped to miRNAs using the miRNet database (Figure 8A). A significant number of miRNAs were mapped to each of these four hub genes (Figure 8B). COL1A1 targets 168 miRNAs, MMP9 targets 47 miRNAs, and IL1A targets 38 miRNAs, whereas FN1 targets 98 miRNAs. Next, we embarked on constructing a key gene–miRNA network. Degree analysis of the key miRNA–mRNA regulatory network was used to identify the key miRNAs. We found that six of the above miRNAs, including miR-1-3p, miR-218-5p, miR-124-3p, miR-128-3p, miR-214-3p, and miR-129-2-3p, emerged as key miRNAs targeting four driver genes (COL1A1, FN1, MMP9, and IL1A) (Figure 9A). Functional enrichment analysis was performed on the predicted miRNAs from the key hub gene–miRNA analysis. Biological pathways and KEGG pathway enrichment analysis were successively identified by MIENTURNET to validate these miRNAs. Enrichment analysis revealed that these miRNAs were mainly enriched in p53 signaling, mTOR, cell cycle, focal adhesion, and PI3K-AKT and MAPK signaling (Figure 9B).
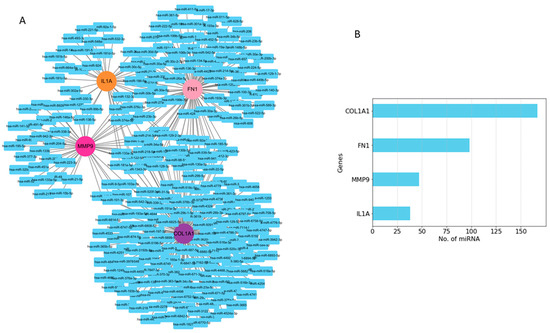
Figure 8.
Predicted regulatory networks of selected potential genes and their associated miRNAs. (A) miRNAs related to COL1A1, IL1A, FN1, and MMP9 genes were identified from the miRNet database. (B) The bar graph shows the number of predicted miRNAs.
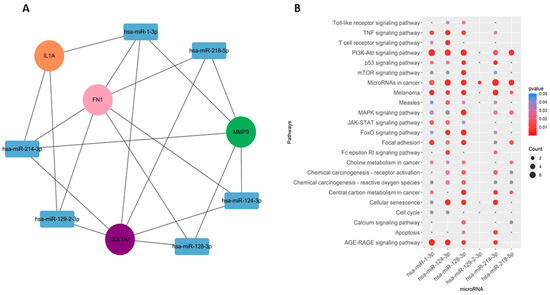
Figure 9.
miRNA–gene regulatory network. (A) Regulatory network of key genes–miRNAs. (B) Pathways associated with the miRNAs.
2.6. Drug–Gene Interaction Analysis
To further refine our search, we employed the Drug–Gene Interaction Database (DGIdb) to identify compounds with high interaction scores with the hub genes. Figure 10 shows the drugs related to FN1, COL1A1, IL1A, and MMP9. These drugs were ranked based on the highest total score in the Drug–Gene Interaction Database. They may hold promise as potential therapeutic agents, which could aid in the development of new treatment targets for HNSCC cancer therapy; however, further investigation is needed to determine their efficacy and safety.
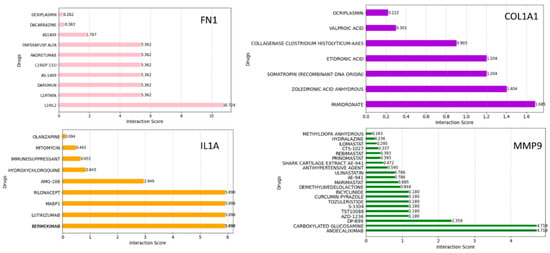
Figure 10.
Drug–gene interaction analyses using the DGIdb. The bar plot shows the possible therapeutic drugs significant for HNSCC in terms of interaction scores.
3. Discussion
3.1. Key Regulators Gene Analyses
In our investigation, we delved into the potential biomarkers and mechanisms underlying HNSCC tumors through systematic bioinformatics analysis. We conducted a comprehensive differential gene expression analysis (DGEA) between HNSCC cancer and normal samples sourced from the TCGA database. Our analysis identified a total of 405 upregulated and 660 downregulated genes. GO and KEGG pathway enrichment analyses indicated that upregulated genes were mainly enriched in extracellular matrix organization, collagen fibril organization, cell adhesion, endodermal cell differentiation, angiogenesis, and cell–cell signaling. Using the consensus network biology approach, we identified four key genes, including COL1A1, IL1A, MMP9, and FN1. COL1A1, which encodes collagen type I alpha 1 chain, has been implicated in promoting metastasis in various cancers. Collagen, the main component of ECM, is an essential component for normal tissue function; it has crucial roles in maintaining stability and integrity in both tissues and organs [21]. COL1A1 can enhance the activity of MMPs, particularly MMP2, which degrade the ECM and facilitate tumor cell invasion and metastasis [22,23]. However, its role in head and neck cancer is not fully understood, and further research is needed to elucidate the specific mechanisms by which COL1A1 contributes to tumor progression and metastasis in this context. Matrix metalloproteinases (MMPs) are a family of zinc-dependent proteases that play crucial roles in remodeling the extracellular matrix (ECM) and basement membranes, as well as regulating growth factors, cytokines, and chemokines [24]. One member, MMP9, is an inducible protease expressed by tumor epithelial cells. It is associated with macrophage and neutrophil infiltration and regulates ECM remodeling, neovascularization, and inflammatory signaling [25]. Matrix metalloproteinases (MMPs) emerged as key players, particularly MMP9, whose overexpression is implicated in HNSCC invasion and metastasis [26]. Iron-induced MMP9 expression through the activation of AP-1 via the ERK/AKT pathway underscores the intricate regulatory mechanisms governing HNSCC progression. Additionally, transforming growth factor-beta1 (TGF-β1) was identified as a potential regulator of MMP9 expression, further highlighting the complex signaling networks contributing to HNSCC pathogenesis [27]. FN1 is significantly overexpressed in HNSCC patients and has been associated with higher pathological stages and poor prognosis [28]. FN1 activation contributes to tumor growth and progression by stimulating PI3K-AKT signaling, leading to enhanced cell survival, proliferation, and metastasis [28]. The PI3K-AKT signaling pathway is reported to be the most frequently altered oncogenic pathway and is genetically altered in most HNSCC tumors [29]. The PI3K-AKT pathway is a crucial signaling cascade involved in cell growth, proliferation, survival, and metabolism [30]. Interleukin-1 alpha (IL1A) plays a significant role in head and neck cancer by primarily acting through the NF-κB signaling pathway. NF-κB is a transcription factor involved in regulating various cellular processes, including inflammation, immune responses, cell proliferation, and survival. In HNSCC, IL1A expression is often upregulated, leading to the activation of NF-κB signaling [31]. This activation promotes tumor growth, invasion, metastasis, and resistance to apoptosis. Additionally, IL1A-NF-κB signaling induces the secretion of pro-inflammatory cytokines and chemokines, creating a tumor-promoting microenvironment. Therefore, IL1A’s involvement in HNSCC pathogenesis highlights its potential as a therapeutic target for inhibiting tumor progression and improving patient outcomes.
3.2. GSVA Analyses
The GSVA analysis indicated that different expression levels of IL1A, COL1A1, MMP9, and FN1 might influence various signaling pathways related to disease progression, including coagulation, angiogenesis, apical junction, Wnt signaling pathways, and NOTCH signaling. Angiogenesis is widely acknowledged for its involvement in the progression of head and neck cancer, as well as its role in conferring resistance to drugs and radiotherapy. It is essential for the growth and progression of head and neck tumors by providing oxygen and nutrients to the growing cancer cells [32]. COL1A1 expression may promote angiogenesis by modulating the ECM composition and promoting the secretion of angiogenic factors, thereby supporting tumor growth and metastasis [33]. However, despite the importance of angiogenesis in head and neck cancer, only a small subset of antiangiogenic agents has proven effective in clinical practice and received approval for treating this condition [33]. Several other studies have shown that abnormal activation of the Wnt signaling pathway facilitates tumor transformation in head and neck tissues [34]. The NOTCH signaling cascade plays a vital role in various cellular processes, including cell proliferation, differentiation, and survival [35]. Dysregulation of the NOTCH pathway is linked to the progression of numerous malignant tumors, such as head and neck squamous cell carcinoma. Apical junction pathways play crucial roles in maintaining the integrity and function of epithelial tissues, which are often disrupted in cancer [36]. Epithelial cells form barriers between different tissue compartments and are held together by various junctional complexes, including tight junctions, adherens junctions, and desmosomes, collectively known as apical junctions.
3.3. Gene–Disease-Related Gene Interaction Analyses
Furthermore, our investigation unveiled correlations between these four hub genes and the expression of numerous disease-related genes, including MET, BRAF, PTEN, EGFR, and PIK3CA. Our data demonstrate that COL1A1, IL1A, MMP9, and FN1 are positively correlated with MET, PTEN, EGFR, and PIK3CA. This correlation suggests a complex interplay between these genes and pathways, influencing tumor progression and therapeutic responses in HNSCC. Head and neck cancers often have genetic mutations that activate oncogenes like PIK3CA or inactivate the PTEN tumor suppressor gene. Such changes lead to the increased activity of a key growth and survival pathway (PI3K/AKT/mTOR), which is commonly seen in head and neck squamous cell carcinomas. The epidermal growth factor receptor (EGFR), part of the ErbB family of receptor tyrosine kinases (RTKs), is recognized as a potential therapeutic target for HNSCC. Multiple agents targeting EGFR have been created and examined in clinical trials for HNSCC [37,38]. Understanding the relationship between FN1 and COL1A1 and key genes like PTEN, EGFR, and PIK3CA can have implications for therapeutic strategies in controlling HNSCC. Targeting FN1, COL1A1, or downstream signaling pathways may offer new therapeutic opportunities for inhibiting tumor growth and improving treatment responses. Cox et al. showed that co-expression of MMP9 and EGFR confers a poor prognosis in non-small cell lung cancer [39]. They proposed that the EGFR signaling pathway might contribute significantly to the invasive tendencies of NSCLC through the upregulation of MMP9 [25]. c-MET is often aberrantly activated in cancer, leading to the persistent activation of several downstream signaling pathways, including the mitogen-activated protein kinase (MAPK) and phosphatidylinositol 3-kinase (PI3K)-AKT pathways [29]. In summary, our findings shed light on the intricate molecular landscape of HNSCC, underscoring the potential of identified biomarkers and pathways as promising targets for therapeutic intervention and further exploration.
3.4. Gene–miRNAs Interaction Analyses
MicroRNAs (miRNAs), which are small non-coding RNAs, play crucial roles in gene regulation and cancer biology [40]. These miRNAs can bind to mRNA and control their expression, thereby influencing various cellular processes [40,41,42,43]. In order to comprehensively recognize the role and potential mechanism of the COL1A1, IL1A, MMP9, and FN1 genes in the prognosis of head and neck cancer, we constructed a miRNA-related regulatory network in the current study. Firstly, we extracted the mRNA–miRNA relationship pairs related to the mRNAs of the four hub genes from the miRNet database, resulting in a total of approximately 202 miRNAs (Figure 6). The constructed regulatory networks of miRNA–mRNA (target genes) revealed six key miRNAs, namely, miR-128-3p, miR-218-5p, miR-214-3p, miR-124-3p, miR-129-2-3p, and miR-1-3p. These miRNAs corresponded to the top nodes with the highest degree in the constructed network and have shown involvement in head and neck cancer as well as other cancers.
miR-1-3p can act as a tumor suppressor or promoter, depending on the specific cellular context and target genes involved [40,44]. It regulates cell proliferation, apoptosis, invasion, and metastasis by targeting oncogenes or tumor suppressor genes, thereby influencing cancer progression and response to therapy. A study has shown that low expression of miR-1-3p may facilitate tumorigenesis and evolution in HNSCC through signaling pathways [45]. miR-124-3p regulates cancer progression pathways, including PI3K/AKT, Wnt/β-catenin, and MAPK, by targeting key components to modulate proliferation, survival, and invasion in HNC cells. It acts as a tumor suppressor by directly interacting with PCDH8 and inhibiting the PI3K/AKT/mTOR signaling pathway [46]. Another study has shown that miR124-3p and miR766-3p are overexpressed in resistant HNSCC, correlating with poor prognosis and contributing to the acquisition of resistance phenotype [47]. In vitro and in vivo studies have shown that elevated levels of miR766-3p and miR124-3p promote aggressive HNSCC behavior, including drug resistance, proliferation, and invasion. miR-129-2-3p has been identified for its inhibitory effects on multiple cancer types; however, its impact on the growth and invasion of head and neck cancer has not been fully understood and extensively investigated.
The overexpression of miR-128 suppresses the development of HNSCC by directly targeting Paip-interacting protein 2 (Paip2), BAG Cochaperone 2 (BAG-2), H3F3B, Bmi-1, and Bcl-2-associated X protein, which are involved in proliferative and apoptotic processes. Upregulated miR-128 expression inhibits HNSCC cell growth and promotes apoptosis in HNSCC cells, partially through its direct modulation of these targets [48]. In our analyses, the hub genes identified in this study were found to be the targets of these miRNAs; however, verification through in vitro experiments is needed. Currently, many aspects of the mechanism of miRNA regulating hub genes in HCC are still unknown.
3.5. Gene–Drugs Interaction Analyses
DGIdb is a curated database of drug–gene interactions mined from various sources such as DrugBank, PharmGKB, ChEMBL, Drug Target Commons, and others. Using the DGIdb database, a total of 10 drugs for each hub gene were identified. Dacarbazine has been the most effective single agent for treating advanced metastatic melanoma and has remained the standard chemotherapy for this malignancy for over 30 years [49]. In our study, dacarbazine interacted with FN1, suggesting that FN1 might be a potential drug target for dacarbazine in anti-HNSCC therapy. Mitomycin is an older chemotherapy drug that has been in use for decades. As an antibiotic, it has demonstrated antitumor activity by selectively inhibiting the synthesis of DNA [50]. In our study, mitomycin interacted with IL1A. Andecaliximab (ADX) is a monoclonal antibody that inhibits matrix metalloproteinase 9, an extracellular enzyme involved in matrix remodeling, tumor growth, and metastasis [51]. A phase I and Ib study of modified oxaliplatin, leucovorin, and fluorouracil (mFOLFOX6) combined with ADX demonstrated encouraging antitumor activity in patients with gastric or gastroesophageal junction (GEJ) adenocarcinoma. Andecaliximab was found to interact with MMP9 with a high interaction score. The pharmacological mechanisms between the hub genes and drugs need to be further explored.
3.6. Advantages, Medical Applications, and Limitations of this Study
The advantage of our study is that it integrates complex data from curated databases like TCGA and DGIdb with network biology. Network biology considers biomarkers within the broader context of biological networks, such as protein–protein interaction networks, gene regulatory networks, or metabolic networks. This context allows for a deeper understanding of how biomarkers are interconnected and function within biological pathways. Our approach offers insights into disease mechanisms and potential therapeutic targets. By identifying hub genes, we pave the way for personalized medicine strategies that could enhance diagnosis, prognosis, and treatment outcomes. The miRNAs and drugs associated with hub genes hold promise for targeted therapies. For example, leveraging these findings could lead to more effective treatments tailored to individual genetic profiles, potentially improving patient outcomes. Despite its advantages, our study has some limitations. The principal limitation of our study is the lack of independent experimental validation. Although four hub genes were identified, their role in HNSCC pathogenesis lacks substantial validation, and their underlying mechanisms of action remain unclear. We acknowledge the need for rigorous experimental validation of predicted interactions and effects. Furthermore, while promising, clinical translation would require robust clinical trials to establish efficacy and safety.
4. Material and Methods
4.1. Dataset
The dataset related to HNSCC was downloaded from TCGA (https://portal.gdc.cancer.gov/, accessed on 5 April 2024) [19]. Screening for differentially expressed genes (DEGs) between cancer and normal samples was performed using the R package Limma [52] and BIOMAX [53]. The DEG threshold was set at an adjusted p < 0.05 and a log2-fold change > 2. The identified upregulated and downregulated genes were subsequently used for pathway analysis and construction of the PPI Network.
4.2. Functional Enrichment Analysis of the DEGs
To investigate the enrichment of biological functions among the DEGs, both the upregulated and downregulated DEGs were analyzed using the Database for Annotation, Visualization, and Integrated Discovery (DAVID) [20]. Gene Ontology (GO) analysis [54] and Kyoto Encyclopedia of Genes and Genomes (KEGG) pathway analysis [55] were conducted on specific genes. A significance level of p ≤ 0.001 was considered statistically significant.
4.3. Key Regulators (KR)
To understand the regulatory function of genes, a protein–protein interaction (PPI) network was constructed using the STRING database [56]. Physical interaction data from the STRING database were utilized for constructing, visualizing, and analyzing networks on the Cytoscape v3.6.0 platform [57]. The topological properties of the network were analyzed using the Network Analyzer [58] and CytoHubba [59] plugins of Cytoscape. The most impactful nodes within the network are recognized as its hubs. Nodes with the highest degrees and corresponding high centrality values were pinpointed as hubs within the PPI network. To identify the key regulators (KRs) within the PPI network, the initial step involved identifying the network’s crucial genes based on their degrees (k) and centrality measures (Cc, CB). The top 20 genes with different topological properties were compared to identify KR genes.
4.4. Topological Properties of the Network
The fundamental topology of a network is typically established by examining its key topological parameters, namely, P(k), C(k), and CN(k) [58]. The topology of the gene network was determined by analyzing these three parameters using the Network Analyzer version 4.5.0 [58] in Cytoscape v3.6.0 [57], with the network treated as undirected. The values of the three parameters P(k), C(k), and CN(k) were plotted against the degree k and their distribution patterns were assessed to characterize the network’s topological features.
4.5. Degree
The degree of a node represents the total number of connections it has within the network, denoted by k. This metric is considered a measure of the node’s local importance in network regulation. The graph is represented as G = (N, E), where E represents the edges and N represents the nodes. CB and CC serve as fundamental parameters and centrality measures used to approximate the global functional significance of a node in network regulation [16,60].
4.6. Betweenness Centrality
Betweenness centrality quantifies how quickly a node can communicate with other pairs of nodes within the network. This nodal measure, denoted as CB(n), is computed by tallying the number of shortest paths that traverse through a specific node u (Equation (1)).
where represents the shortest distance between node v and node w.
It reflects a node’s ability to leverage the information flow across the entire network, as well as its capacity to influence signal processing among other nodes within the network [16,58].
4.7. Closeness Centrality
Closeness centrality measures the proximity of a node to other nodes in a network, indicating how short a path is. The nodal measure is calculated as the inverse of the sum of distances between the node of interest u and all other v V/n (Equation (2)).
A higher-value indicate faster propagation of information in the network.
This parameter depicts the speed of information distribution within a network, from one node to other connected nodes [61].
4.8. ROC Curve Analyses
A ROC (receiver operating characteristic) curve for hub genes was calculated using logistic regression analyses [62]. Logistic regression models provide straightforward interpretation of coefficients, making it easier to understand the influence of predictors on the outcome (e.g., biomarker status or disease prognosis). The ROC curve plots the True Positive Rate (Sensitivity) against the False Positive Rate (1 − Specificity) for all possible thresholds. Further, the AUC is computed as the area under this curve. A perfect classifier would have an AUC of 1.0, while a completely random classifier would have an AUC of 0.5.
where TP is True Positives and FN is False Negatives.
where FP is False Positives and TN is True Negatives.
The AUC is then computed by integrating the area under the ROC curve. It essentially measures the ability of the model to distinguish between classes.
4.9. Gene Set Variation Analysis (GSVA)
GSVA is a non-parametric and unsupervised technique for assessing the enrichment of transcriptome gene sets [63]. By thoroughly scoring the gene set of interest, GSVA transforms gene-level variations into pathway-level alterations, thereby evaluating the biological functions of samples. In this study, gene sets were obtained from the Molecular Signatures Database, and the GSVA algorithm was employed to score each gene set comprehensively, allowing for the evaluation of potential changes in biological function across different samples.
4.10. Identification of miRNAs and Functional Enrichment Analysis
The miRNAs for four key genes were retrieved using miRNet (www.mirnet.ca, accessed on 30 April 2024). The tool fetched miRNA–target interaction data from the miRTarBase [64], miRDB [65], and TargetScan [66] databases. The miRNA–mRNA interactions were utilized to generate the network using Cytoscape v3.6.1 (https://cytoscape.org, accessed on 28 May 2024). Significant biological pathways of candidate miRNAs were identified using the MIENTURNET platform [67]. The most statistically enriched GO terms were visualized using the ggplot2 visualization R package [68].
4.11. Drug–Genes Interaction
We predicted the target drugs of hub genes through the Drug–Gene Interaction Database (DGIdb) [69]. The DGIdb is a web resource that offers information on drug–gene interactions and druggable genes sourced from publications, databases, and other web-based platforms. The bar plots depicting interaction scores were generated using the ggplot2 package in R [68].
5. Conclusions
This study evaluates the network biology approach for screening potential biomarkers for HNSCC. We used the Network Analyzer and CytoHubba modules from Cytoscape to identify key regulator genes from the TCGA–HNSCC dataset. This study identified and analyzed four core genes, namely, FN1, COL1A1, MMP9, and IL1A, associated with the development and progression of HNSCC. These findings could enhance our understanding of the carcinogenesis process and provide indicators for prognosis and early disease detection. The enrichment of these genes has revealed associations with cellular communication, metabolic processes, and various biological regulations. Additionally, we identified significant deregulated miRNAs associated with these key genes, which were further analyzed to explore their connections with cancer pathways. In addition, the four key genes exhibited close interactions with both new types of anticancer agents and traditional chemotherapy drugs. However, these findings are based on bioinformatics analysis; therefore, experimental research is necessary to validate our results concerning the pathogenesis of head and neck cancer. This validation can provide the most accurate information for the prevention and therapy of head and neck cancer.
Author Contributions
Conceptualization, D., M.A.H., and J.-J.K.; formal analysis, D., M.A.H., M.Z.M., P.S., R.A., K.-W.L., J.-J.K., and T.-S.J.; writing—original draft preparation, D. and M.A.H.; writing—review and editing, D., M.A.H., M.Z.M., R.A., P.S., J.-S.L., K.-W.L., J.-J.K., and T.-S.J.; funding acquisition, T.-S.J. All authors have read and agreed to the published version of the manuscript.
Funding
This research was funded by a Korea Research Foundation grant (RS-2023-00235511).
Institutional Review Board Statement
Not applicable.
Informed Consent Statement
Not applicable.
Data Availability Statement
All study data are included in this article.
Conflicts of Interest
Author Jeong-Sang Lee is employed by the company Innopolis Jeonbuk. Keun-Woo Lee is employed by the Korea Quantum Computing (KQC) and Angel i-Drug Design (AiDD). The remaining authors declare that the research was conducted in the absence of any commercial or financial relationships that could be construed as a potential conflict of interest.
References
- Johnson, D.E.; Burtness, B.; Leemans, C.R.; Lui, V.W.Y.; Bauman, J.E.; Grandis, J.R. Head and neck squamous cell carcinoma. Nat. Rev. Dis. Primers 2020, 6, 92. [Google Scholar] [CrossRef] [PubMed]
- Chung, C.H.; Parker, J.S.; Karaca, G.; Wu, J.; Funkhouser, W.K.; Moore, D.; Butterfoss, D.; Xiang, D.; Zanation, A.; Yin, X.; et al. Molecular classification of head and neck squamous cell carcinomas using patterns of gene expression. Cancer Cell 2004, 5, 489–500. [Google Scholar] [CrossRef] [PubMed]
- Gu, H.; Li, T.; Beeraka, N.M.; Zheng, Y.; Zhang, X.; Song, R.; Zhou, R.; Wang, X.; Sukocheva, O.; Fan, R.; et al. Molecular classification of human papilloma virus-negative head and neck squamous cell carcinomas: Cell cycle-based classifier and prognostic signature. PLoS ONE 2023, 18, e0286414. [Google Scholar] [CrossRef] [PubMed]
- Badwelan, M.; Muaddi, H.; Ahmed, A.; Lee, K.T.; Tran, S.D. Oral Squamous Cell Carcinoma and Concomitant Primary Tumors, What Do We Know? A Review of the Literature. Curr. Oncol. 2023, 30, 3721–3734. [Google Scholar] [CrossRef] [PubMed]
- Revesz, M.; Oberna, F.; Slezak, A.; Ferenczi, O.; Kenessey, I.; Takacsi-Nagy, Z. The characteristics of head and neck squamous cell cancer in young adults: A retrospective single-center study. Pathol. Oncol. Res. POR 2023, 29, 1611123. [Google Scholar] [CrossRef] [PubMed]
- Liu, J.C.; Bhayani, M.; Kuchta, K.; Galloway, T.; Fundakowski, C. Patterns of distant metastasis in head and neck cancer at presentation: Implications for initial evaluation. Oral Oncol. 2019, 88, 131–136. [Google Scholar] [CrossRef] [PubMed]
- Vander Broek, R.; Mohan, S.; Eytan, D.F.; Chen, Z.; Van Waes, C. The PI3K/Akt/mTOR axis in head and neck cancer: Functions, aberrations, cross-talk, and therapies. Oral Dis. 2015, 21, 815–825. [Google Scholar] [CrossRef] [PubMed]
- Gallo, O.; Masini, E.; Bianchi, B.; Bruschini, L.; Paglierani, M.; Franchi, A. Prognostic significance of cyclooxygenase-2 pathway and angiogenesis in head and neck squamous cell carcinoma. Hum. Pathol. 2002, 33, 708–714. [Google Scholar] [CrossRef] [PubMed]
- Michaud, D.S.; Langevin, S.M.; Eliot, M.; Nelson, H.H.; Pawlita, M.; McClean, M.D.; Kelsey, K.T. High-risk HPV types and head and neck cancer. Int. J. Cancer 2014, 135, 1653–1661. [Google Scholar] [CrossRef]
- Stein, A.P.; Saha, S.; Kraninger, J.L.; Swick, A.D.; Yu, M.; Lambert, P.F.; Kimple, R.J. Prevalence of Human Papillomavirus in Oropharyngeal Cancer: A Systematic Review. Cancer J. 2015, 21, 138–146. [Google Scholar] [CrossRef]
- Sabatini, M.E.; Chiocca, S. Human papillomavirus as a driver of head and neck cancers. Br. J. Cancer 2020, 122, 306–314. [Google Scholar] [CrossRef] [PubMed]
- Yeh, S.A. Radiotherapy for head and neck cancer. Semin. Plast. Surg. 2010, 24, 127–136. [Google Scholar] [CrossRef] [PubMed]
- Olmi, P.; Crispino, S.; Fallai, C.; Torri, V.; Rossi, F.; Bolner, A.; Amichetti, M.; Signor, M.; Taino, R.; Squadrelli, M.; et al. Locoregionally advanced carcinoma of the oropharynx: Conventional radiotherapy vs. accelerated hyperfractionated radiotherapy vs. concomitant radiotherapy and chemotherapy--a multicenter randomized trial. Int. J. Radiat. Oncol. Biol. Phys. 2003, 55, 78–92. [Google Scholar] [CrossRef] [PubMed]
- Argiris, A.; Karamouzis, M.V.; Raben, D.; Ferris, R.L. Head and neck cancer. Lancet 2008, 371, 1695–1709. [Google Scholar] [CrossRef] [PubMed]
- Nitsch, D.; Goncalves, J.P.; Ojeda, F.; de Moor, B.; Moreau, Y. Candidate gene prioritization by network analysis of differential expression using machine learning approaches. BMC Bioinform. 2010, 11, 460. [Google Scholar] [CrossRef] [PubMed]
- Ray, A.K.; Priya, A.; Malik, M.Z.; Thanaraj, T.A.; Singh, A.K.; Mago, P.; Ghosh, C.; Shalimar; Tandon, R.; Chaturvedi, R. A bioinformatics approach to elucidate conserved genes and pathways in C. elegans as an animal model for cardiovascular research. Sci. Rep. 2024, 14, 7471. [Google Scholar] [CrossRef] [PubMed]
- Nazarieh, M.; Wiese, A.; Will, T.; Hamed, M.; Helms, V. Identification of key player genes in gene regulatory networks. BMC Syst. Biol. 2016, 10, 88. [Google Scholar] [CrossRef] [PubMed]
- Lin, Q.; Cai, B.; Ke, R.; Chen, L.; Ni, X.; Liu, H.; Lin, X.; Wang, B.; Shan, X. Integrative bioinformatics and experimental validation of hub genetic markers in acne vulgaris: Toward personalized diagnostic and therapeutic strategies. J. Cosmet. Dermatol. 2024, 23, 1777–1799. [Google Scholar] [CrossRef]
- Tomczak, K.; Czerwinska, P.; Wiznerowicz, M. The Cancer Genome Atlas (TCGA): An immeasurable source of knowledge. Contemp. Oncol. 2015, 19, A68–A77. [Google Scholar] [CrossRef]
- Huang, D.W.; Sherman, B.T.; Tan, Q.; Collins, J.R.; Alvord, W.G.; Roayaei, J.; Stephens, R.; Baseler, M.W.; Lane, H.C.; Lempicki, R.A. The DAVID Gene Functional Classification Tool: A novel biological module-centric algorithm to functionally analyze large gene lists. Genome Biol. 2007, 8, R183. [Google Scholar] [CrossRef]
- Li, X.; Sun, X.; Kan, C.; Chen, B.; Qu, N.; Hou, N.; Liu, Y.; Han, F. COL1A1: A novel oncogenic gene and therapeutic target in malignancies. Pathol. Res. Pract. 2022, 236, 154013. [Google Scholar] [CrossRef] [PubMed]
- Pan, S.; Hu, Y.; Gan, L.; Lai, J.; Zheng, P.; Zhang, Y.; Shuai, L.; Jiang, Y.; Chen, M.; Wang, J.; et al. Matrix metalloproteinase-2 inducing COL1A1 synthesis via integrin alpha V promotes invasion and metastasis of cholangiocarcinoma cells. Ann. Hepatol. 2024, 29, 101279. [Google Scholar] [CrossRef] [PubMed]
- Sun, S.; Wang, Y.; Wu, Y.; Gao, Y.; Li, Q.; Abdulrahman, A.A.; Liu, X.F.; Ji, G.Q.; Gao, J.; Li, L.; et al. Identification of COL1A1 as an invasion-related gene in malignant astrocytoma. Int. J. Oncol. 2018, 53, 2542–2554. [Google Scholar] [CrossRef] [PubMed]
- Cabral-Pacheco, G.A.; Garza-Veloz, I.; Castruita-De la Rosa, C.; Ramirez-Acuna, J.M.; Perez-Romero, B.A.; Guerrero-Rodriguez, J.F.; Martinez-Avila, N.; Martinez-Fierro, M.L. The Roles of Matrix Metalloproteinases and Their Inhibitors in Human Diseases. Int. J. Mol. Sci. 2020, 21, 9739. [Google Scholar] [CrossRef] [PubMed]
- Quintero-Fabian, S.; Arreola, R.; Becerril-Villanueva, E.; Torres-Romero, J.C.; Arana-Argaez, V.; Lara-Riegos, J.; Ramirez-Camacho, M.A.; Alvarez-Sanchez, M.E. Role of Matrix Metalloproteinases in Angiogenesis and Cancer. Front. Oncol. 2019, 9, 1370. [Google Scholar] [CrossRef] [PubMed]
- Cox, G.; Jones, J.L.; O’Byrne, K.J. Matrix metalloproteinase 9 and the epidermal growth factor signal pathway in operable non-small cell lung cancer. Clin. Cancer Res. 2000, 6, 2349–2355. [Google Scholar] [PubMed]
- Sinpitaksakul, S.N.; Pimkhaokham, A.; Sanchavanakit, N.; Pavasant, P. TGF-beta1 induced MMP-9 expression in HNSCC cell lines via Smad/MLCK pathway. Biochem. Biophys. Res. Commun. 2008, 371, 713–718. [Google Scholar] [CrossRef] [PubMed]
- Zhou, W.H.; Du, W.D.; Li, Y.F.; Al-Aroomi, M.A.; Yan, C.; Wang, Y.; Zhang, Z.Y.; Liu, F.Y.; Sun, C.F. The Overexpression of Fibronectin 1 Promotes Cancer Progression and Associated with M2 Macrophages Polarization in Head and Neck Squamous Cell Carcinoma Patients. Int. J. Gen. Med. 2022, 15, 5027–5042. [Google Scholar] [CrossRef]
- Raj, S.; Kesari, K.K.; Kumar, A.; Rathi, B.; Sharma, A.; Gupta, P.K.; Jha, S.K.; Jha, N.K.; Slama, P.; Roychoudhury, S.; et al. Molecular mechanism(s) of regulation(s) of c-MET/HGF signaling in head and neck cancer. Mol. Cancer 2022, 21, 31. [Google Scholar] [CrossRef]
- Rascio, F.; Spadaccino, F.; Rocchetti, M.T.; Castellano, G.; Stallone, G.; Netti, G.S.; Ranieri, E. The Pathogenic Role of PI3K/AKT Pathway in Cancer Onset and Drug Resistance: An Updated Review. Cancers 2021, 13, 3949. [Google Scholar] [CrossRef]
- Niklander, S.E.; Murdoch, C.; Hunter, K.D. IL-1/IL-1R Signaling in Head and Neck Cancer. Front. Oral Health 2021, 2, 722676. [Google Scholar] [CrossRef] [PubMed]
- Carla, C.; Daris, F.; Cecilia, B.; Francesca, B.; Francesca, C.; Paolo, F. Angiogenesis in head and neck cancer: A review of the literature. J. Oncol. 2012, 2012, 358472. [Google Scholar] [CrossRef] [PubMed][Green Version]
- Ilhan-Mutlu, A.; Siehs, C.; Berghoff, A.S.; Ricken, G.; Widhalm, G.; Wagner, L.; Preusser, M. Expression profiling of angiogenesis-related genes in brain metastases of lung cancer and melanoma. Tumour Biol. 2016, 37, 1173–1182. [Google Scholar] [CrossRef] [PubMed]
- Xie, J.; Huang, L.; Lu, Y.G.; Zheng, D.L. Roles of the Wnt Signaling Pathway in Head and Neck Squamous Cell Carcinoma. Front. Mol. Biosci. 2020, 7, 590912. [Google Scholar] [CrossRef] [PubMed]
- Zhou, B.; Lin, W.; Long, Y.; Yang, Y.; Zhang, H.; Wu, K.; Chu, Q. Notch signaling pathway: Architecture, disease, and therapeutics. Signal Transduct. Target. Ther. 2022, 7, 95. [Google Scholar] [CrossRef]
- Gehren, A.S.; Rocha, M.R.; de Souza, W.F.; Morgado-Diaz, J.A. Alterations of the apical junctional complex and actin cytoskeleton and their role in colorectal cancer progression. Tissue Barriers 2015, 3, e1017688. [Google Scholar] [CrossRef] [PubMed]
- Egloff, A.M.; Grandis, J.R. Targeting epidermal growth factor receptor and SRC pathways in head and neck cancer. Semin. Oncol. 2008, 35, 286–297. [Google Scholar] [CrossRef] [PubMed]
- Cassell, A.; Grandis, J.R. Investigational EGFR-targeted therapy in head and neck squamous cell carcinoma. Expert Opin. Investig. Drugs 2010, 19, 709–722. [Google Scholar] [CrossRef] [PubMed]
- Swinson, D.E.; Cox, G.; O’Byrne, K.J. Coexpression of epidermal growth factor receptor with related factors is associated with a poor prognosis in non-small-cell lung cancer. Br. J. Cancer 2004, 91, 1301–1307. [Google Scholar] [CrossRef]
- Dai, S.; Li, F.; Xu, S.; Hu, J.; Gao, L. The important role of miR-1-3p in cancers. J. Transl. Med. 2023, 21, 769. [Google Scholar] [CrossRef]
- Thomaidou, A.C.; Batsaki, P.; Adamaki, M.; Goulielmaki, M.; Baxevanis, C.N.; Zoumpourlis, V.; Fortis, S.P. Promising Biomarkers in Head and Neck Cancer: The Most Clinically Important miRNAs. Int. J. Mol. Sci. 2022, 23, 8257. [Google Scholar] [CrossRef] [PubMed]
- Subha, S.T.; Chin, J.W.; Cheah, Y.K.; Mohtarrudin, N.; Saidi, H.I. Multiple microRNA signature panel as promising potential for diagnosis and prognosis of head and neck cancer. Mol. Biol. Rep. 2022, 49, 1501–1511. [Google Scholar] [CrossRef] [PubMed]
- Kozlowska-Maslon, J.; Guglas, K.; Kolenda, T.; Lamperska, K.; Makalowska, I. miRNA in head and neck squamous cell carcinomas: Promising but still distant future of personalized oncology. Rep. Pract. Oncol. Radiother. 2023, 28, 681–697. [Google Scholar] [CrossRef]
- Tao, S.; Li, H.; Ma, X.; Ma, Y.; He, J.; Gao, Y.; Li, J. Elevating microRNA-1-3p shuttled by cancer-associated fibroblasts-derived extracellular vesicles suppresses breast cancer progression and metastasis by inhibiting GLIS1. Cancer Gene Ther. 2021, 28, 634–648. [Google Scholar] [CrossRef] [PubMed]
- Chen, Y.; Liu, M.; Jin, H.; Peng, B.; Dai, L.; Wang, S.; Xing, H.; Wang, B.; Wu, Z. Synthetic Evaluation of MicroRNA-1-3p Expression in Head and Neck Squamous Cell Carcinoma Based on Microarray Chips and MicroRNA Sequencing. BioMed Res. Int. 2021, 2021, 6529255. [Google Scholar] [CrossRef]
- Ye, J.; Liao, Q.; Zeng, X.; Liu, C.; Ding, Y.; Liu, X.; Zeng, L.; Guan, T.; Yuan, Y. MicroRNA-124-3p inhibited progression of nasopharyngeal carcinoma by interaction with PCDH8 and the inactivation of PI3K/AKT/mTOR pathway. J. Cancer 2021, 12, 4933–4944. [Google Scholar] [CrossRef]
- Shibata, T.; Cao, D.Y.; Dar, T.B.; Ahmed, F.; Bhat, S.A.; Veiras, L.C.; Bernstein, E.A.; Khan, A.A.; Chaum, M.; Shiao, S.L.; et al. miR766-3p and miR124-3p Dictate Drug Resistance and Clinical Outcome in HNSCC. Cancers 2022, 14, 5273. [Google Scholar] [CrossRef]
- Hauser, B.; Zhao, Y.; Pang, X.; Ling, Z.; Myers, E.; Wang, P.; Califano, J.; Gu, X. Functions of MiRNA-128 on the regulation of head and neck squamous cell carcinoma growth and apoptosis. PLoS ONE 2015, 10, e0116321. [Google Scholar] [CrossRef]
- Jiang, G.; Li, R.H.; Sun, C.; Liu, Y.Q.; Zheng, J.N. Dacarbazine combined targeted therapy versus dacarbazine alone in patients with malignant melanoma: A meta-analysis. PLoS ONE 2014, 9, e111920. [Google Scholar] [CrossRef]
- Tomasz, M. Mitomycin C: Small, fast and deadly (but very selective). Chem. Biol. 1995, 2, 575–579. [Google Scholar] [CrossRef]
- Shah, M.A.; Bodoky, G.; Starodub, A.; Cunningham, D.; Yip, D.; Wainberg, Z.A.; Bendell, J.; Thai, D.; He, J.; Bhargava, P.; et al. Phase III Study to Evaluate Efficacy and Safety of Andecaliximab With mFOLFOX6 as First-Line Treatment in Patients With Advanced Gastric or GEJ Adenocarcinoma (GAMMA-1). J. Clin. Oncol. 2021, 39, 990–1000. [Google Scholar] [CrossRef] [PubMed]
- Ritchie, M.E.; Phipson, B.; Wu, D.; Hu, Y.; Law, C.W.; Shi, W.; Smyth, G.K. limma powers differential expression analyses for RNA-sequencing and microarray studies. Nucleic Acids Res. 2015, 43, e47. [Google Scholar] [CrossRef] [PubMed]
- Taverna, F.; Goveia, J.; Karakach, T.K.; Khan, S.; Rohlenova, K.; Treps, L.; Subramanian, A.; Schoonjans, L.; Dewerchin, M.; Eelen, G.; et al. BIOMEX: An interactive workflow for (single cell) omics data interpretation and visualization. Nucleic Acids Res. 2020, 48, W385–W394. [Google Scholar] [CrossRef] [PubMed]
- Young, M.D.; Wakefield, M.J.; Smyth, G.K.; Oshlack, A. Gene ontology analysis for RNA-seq: Accounting for selection bias. Genome Biol. 2010, 11, R14. [Google Scholar] [CrossRef] [PubMed]
- Kanehisa, M.; Goto, S. KEGG: Kyoto encyclopedia of genes and genomes. Nucleic Acids Res. 2000, 28, 27–30. [Google Scholar] [CrossRef] [PubMed]
- Szklarczyk, D.; Kirsch, R.; Koutrouli, M.; Nastou, K.; Mehryary, F.; Hachilif, R.; Gable, A.L.; Fang, T.; Doncheva, N.T.; Pyysalo, S.; et al. The STRING database in 2023: Protein-protein association networks and functional enrichment analyses for any sequenced genome of interest. Nucleic Acids Res. 2023, 51, D638–D646. [Google Scholar] [CrossRef] [PubMed]
- Shannon, P.; Markiel, A.; Ozier, O.; Baliga, N.S.; Wang, J.T.; Ramage, D.; Amin, N.; Schwikowski, B.; Ideker, T. Cytoscape: A software environment for integrated models of biomolecular interaction networks. Genome Res. 2003, 13, 2498–2504. [Google Scholar] [CrossRef] [PubMed]
- Assenov, Y.; Ramirez, F.; Schelhorn, S.E.; Lengauer, T.; Albrecht, M. Computing topological parameters of biological networks. Bioinformatics 2008, 24, 282–284. [Google Scholar] [CrossRef] [PubMed]
- Chin, C.H.; Chen, S.H.; Wu, H.H.; Ho, C.W.; Ko, M.T.; Lin, C.Y. cytoHubba: Identifying hub objects and sub-networks from complex interactome. BMC Syst. Biol. 2014, 8 (Suppl. 4), S11. [Google Scholar] [CrossRef]
- Gursoy, A.; Keskin, O.; Nussinov, R. Topological properties of protein interaction networks from a structural perspective. Biochem. Soc. Trans. 2008, 36, 1398–1403. [Google Scholar] [CrossRef]
- Newman, M.E.; Girvan, M. Finding and evaluating community structure in networks. Phys. Rev. E Stat. Nonlin. Soft Matter Phys. 2004, 69, 026113. [Google Scholar] [CrossRef] [PubMed]
- Kwon, Y.; Han, K.; Suh, Y.J.; Jung, I. Stability selection for LASSO with weights based on AUC. Sci. Rep. 2023, 13, 5207. [Google Scholar] [CrossRef] [PubMed]
- Hanzelmann, S.; Castelo, R.; Guinney, J. GSVA: Gene set variation analysis for microarray and RNA-seq data. BMC Bioinform. 2013, 14, 7. [Google Scholar] [CrossRef] [PubMed]
- Huang, H.Y.; Lin, Y.C.; Cui, S.; Huang, Y.; Tang, Y.; Xu, J.; Bao, J.; Li, Y.; Wen, J.; Zuo, H.; et al. miRTarBase update 2022: An informative resource for experimentally validated miRNA-target interactions. Nucleic Acids Res. 2022, 50, D222–D230. [Google Scholar] [CrossRef] [PubMed]
- Wang, X. miRDB: A microRNA target prediction and functional annotation database with a wiki interface. RNA 2008, 14, 1012–1017. [Google Scholar] [CrossRef] [PubMed]
- Lewis, B.P.; Burge, C.B.; Bartel, D.P. Conserved seed pairing, often flanked by adenosines, indicates that thousands of human genes are microRNA targets. Cell 2005, 120, 15–20. [Google Scholar] [CrossRef] [PubMed]
- Licursi, V.; Conte, F.; Fiscon, G.; Paci, P. MIENTURNET: An interactive web tool for microRNA-target enrichment and network-based analysis. BMC Bioinform. 2019, 20, 545. [Google Scholar] [CrossRef] [PubMed]
- R Core Team. R: A Language and Environment for Statistical Computing; R Foundation for Statistical Computing: Vienna, Austria, 2023. [Google Scholar]
- Cannon, M.; Stevenson, J.; Stahl, K.; Basu, R.; Coffman, A.; Kiwala, S.; McMichael, J.F.; Kuzma, K.; Morrissey, D.; Cotto, K.; et al. DGIdb 5.0: Rebuilding the drug–gene interaction database for precision medicine and drug discovery platforms. Nucleic Acids Res. 2023, 52, D1227–D1235. [Google Scholar] [CrossRef]


Disclaimer/Publisher’s Note: The statements, opinions and data contained in all publications are solely those of the individual author(s) and contributor(s) and not of MDPI and/or the editor(s). MDPI and/or the editor(s) disclaim responsibility for any injury to people or property resulting from any ideas, methods, instructions or products referred to in the content. |
© 2024 by the authors. Licensee MDPI, Basel, Switzerland. This article is an open access article distributed under the terms and conditions of the Creative Commons Attribution (CC BY) license (https://creativecommons.org/licenses/by/4.0/).