Review

Hypoxia Imaging in Lung Cancer: A PET-Based Narrative Review for Clinicians and Researchers

1
Radiologic Sciences Department, Kuwait University, Kuwait City 31470, Kuwait
2
Occupational Therapy Department, Kuwait University, Jabriya 31470, Kuwait
3
Nuclear Medicine Department, Jahra Hospital, Ministry of Health, Al Jahra 03200, Kuwait
*
Author to whom correspondence should be addressed.
Pharmaceuticals 2025, 18(4), 459; https://doi.org/10.3390/ph18040459
Submission received: 1 March 2025 / Revised: 12 March 2025 / Accepted: 14 March 2025 / Published: 25 March 2025
(This article belongs to the Special Issue Development of Novel Radiopharmaceuticals for SPECT and PET Imaging)

Abstract

:
Background: Hypoxia plays a critical role in lung cancer progression and treatment resistance by contributing to aggressive tumor behavior and poor therapeutic response. Molecular imaging, particularly positron emission tomography (PET), has become an essential tool for noninvasive hypoxia detection, providing valuable insights into tumor biology and aiding in personalized treatment strategies. Objective: This narrative review explores recent advancements in PET imaging for detecting hypoxia in lung cancer, with a focus on the development, characteristics, and clinical applications of various radiotracers. Findings: Numerous PET-based hypoxia radiotracers have been investigated, each with distinct pharmacokinetics and imaging capabilities. Established tracers such as 18F-Fluoromisonidazole (18F-FMISO) remain widely used, while newer alternatives like 18F-Fluoroazomycin Arabinoside (18F-FAZA) and 18F-Flortanidazole (18F-HX4) demonstrate improved clearance and image contrast. Additionally, 64Cu-ATSM has gained attention for its rapid tumor uptake and hypoxia selectivity. The integration of PET with hybrid imaging modalities, such as PET/CT and PET/MRI, enhances the spatial resolution and functional interpretation, making hypoxia imaging a promising approach for guiding radiotherapy, chemotherapy, and targeted therapies. Conclusions: PET imaging of hypoxia offers significant potential in lung cancer diagnosis, treatment planning, and therapeutic response assessment. However, challenges remain, including tracer specificity, quantification variability, and standardization of imaging protocols. Future research should focus on developing next-generation radiotracers with enhanced specificity, optimizing imaging methodologies, and leveraging multimodal approaches to improve clinical utility and patient outcomes.

1. Introduction

Most recent statistics (as of 2022) indicate that lung cancer (LC) remains the most prevalent type of cancer, constituting nearly 11% of all cancer cases across genders [1]. The two primary histological types of lung cancer are non-small-cell lung cancer (NSCLC) and small-cell lung cancer (SCLC) [2]. NSCLC encompasses several histological subtypes, with adenocarcinoma emerging as the most common subtype [2].
Likewise, in recent years, the field of molecular imaging has transformed oncological imaging by providing noninvasive evaluation of tumor pathophysiology. This technology provides a comprehensive characterization of the state of disease, prognosis, and therapeutic response, making it an essential tool in the fight against cancer [3]. Nuclear medicine is a pivotal field which leverages molecular imaging techniques, utilizing radionuclides to diagnose and treat various medical conditions. Radiopharmaceuticals, key agents in this domain, facilitate imaging modalities like single photon emission tomography (SPECT) and positron emission tomography (PET) [4], enabling noninvasive visualization of specific biological processes through the accumulation and kinetics of radiotracers [3], thereby making nuclear medicine an integral tool in both the imaging and treatment of many oncological diseases, including LC.
PET is advanced imaging technology which has the potential to visualize various tracers that target the altered biological processes observed in malignant tumors [5]. To develop effective diagnostic tracers for PET imaging, researchers used cancer hallmarks as a conceptual tool to describe the various mechanisms of cancer biology [5,6,7]. PET’s ability to visualize some of these altered states in cancer cells has also helped to improve our understanding of tumor biology and heterogeneity, thereby facilitating the development of more targeted and effective treatments for cancer [8]. Importantly, PET imaging has both diagnostic and prognostic importance and is commonly used for various types of malignancies for staging the disease, treatment evaluation and follow-up.
An ideal radionuclide for PET imaging is one that has an adequate half-life for imaging and a short positron range. This results in high-quality imaging outcomes and accurate diseased tissue localization [9]. Depending on the purpose of the imaging process, specific ligands are carefully chosen to visualize factors such as glucose metabolism, cell proliferation, somatostatin receptor expression, hypoxia, or angiogenesis. It is critical that these ligands exhibit high specificity and sensitivity in detecting particular types of cancer. This ensures that accurate and reliable imaging results aid the diagnosis and treatment of lung cancer patients.
Although there have been significant improvements in LC treatment in recent years, the presence of tumor hypoxia and other micro-environmental factors still limits the ability to achieve desirable treatment outcomes. Hypoxia is caused by inadequate blood flow and a subsequent low oxygen concentration [O2] and pO2 tension, which can lead to resistance to conventional cancer treatments, increased tumor aggressiveness, and unfavorable prognoses. The hypoxic condition arises from the rapid growth of aggressive cancer cells which consume a large amount of oxygen and might limit blood circulation. Under hypoxic conditions, cancer cells have a greater tendency to metastasize or initiate various types of resistance such as apoptosis resistance, genomic instability, or increased resistance to radiation and chemotherapy. Hypoxic cells are two or three times more resistant to radiation than normoxic cells [10,11]. This requires an increase in the radiation dose to kill malignant cells and prevent tumor relapse effectively. However, it has been found that increasing the radiation dose may exceed standard tissue tolerance and lead to unfavorable consequences [12,13,14]. Limiting the maximum dose of radiation in the chest area is important to prevent toxicity to normal tissue from radiation exposure. Due to all of these reasons, treating lung malignancy seems complicated and may result in lower patient survival rates.
In recent years, numerous studies have been conducted to provide an overview of the molecular basis of hypoxia in different physiological and pathophysiological conditions. The gold standard for evaluating tumor hypoxia is measuring the tissue oxygen pressure. This method involves the invasive measurement of tissue oxygen levels using a polarographic Eppendorf electrode. Höckel and Vaupel carried out the first experiments in the early 1990s [10,11]. However, the Eppendorf electrode has several disadvantages which cause tissue degradation and allow only one measurement per territory. Furthermore, this method involves invasive procedures and is only suitable for tumors which are easily accessible. Another limitation of this technique is that it cannot differentiate between necrotic and viable anoxic tissues. Consequently, it is not practical for regular clinical practice.
PET is considered one of the novel noninvasive imaging tools used to understand the molecular basis of hypoxia. Hypoxia PET imaging involves using nitroimidazole tracers or [Cu]-64Cu-ATSM. Recently, it has been suggested that 89Zr-girentuximab could indirectly assess variations in the intracellular pH due to hypoxia.
In this article, we aim to discuss the various aspects of PET imaging related to hypoxia radiotracers, particularly for lung malignancy, and propose future directions for better hypoxia detection and radiopharmaceutical design planning. Understanding the pathophysiology of hypoxia, its consequences, and the associated signaling pathways seems essential. Therefore, we will briefly highlight and explain these aspects as well.

2. Pathophysiology of Hypoxia

Hypoxia is a pathological condition caused by an oxygen supply which is inadequate for cellular metabolism in living tissues or the entire body. It occurs in approximately 50–60% of solid tumors, with significant variability between individuals and tumor types [15,16,17,18]. Typically, tumor hypoxia may occur due to poor perfusion, oxygen diffusion deficiency, or a low hemoglobin level associated with anemia. Hypoxic tumors exhibit morphological and functional abnormalities in newly formed capillaries caused by the imbalance between oxygen consumption and delivery [19]. Acute hypoxia is a type of hypoxia which occurs in tumors due to abnormal perfusion, which leads to a lack of oxygen delivery. On the contrary, chronic hypoxia is caused by an abnormality in oxygen diffusion [20].
Lack of oxygen (O2) is a serious health issue which can cause chronic diseases and even death. This is because O2 plays a significant role in nourishing cells and maintaining normal cellular and subcellular processes and mechanisms [21,22,23]. A deficiency in the pivot element has been associated with several severe illnesses, like resistant malignancy. The level of partial oxygen pressure (pO2) required for proper cellular function varies in different tissues. The threshold level below which cellular function is impacted negatively depends on the normal pO2 of the corresponding tissue. To maintain cellular oxygen homeostasis, there should be an equilibrium between oxygen delivery and demand [23].
Generally, malignant cells use a significant amount of oxygen, which will ultimately lead to failure in the oxygen equilibrium and result in hypoxia. The hypoxic conditions may trigger cancer cells to kick off angiogenesis, which is the process of developing new blood vessels from the already existing ones. Various studies support the positive correlation between hypoxia and angiogenesis processes in tumors. This relationship may cause an increase in blood flow to provide the tumor with the necessary oxygen and nutrients to grow, which can lead to metastasis [23]. Furthermore, chronic hypoxia may lead to corruption in the microenvironment which gives rise to variation in the chemokine, cytokine, growth factor, and reactive oxygen species (ROS) equilibrium. This imbalance, in turn, leads to deregulation in many protein complexes responsible for DNA transcription (e.g., NF-kB and HIF-1). This deregulation may, therefore, allow suitable survival for the de novo growth of cancer as well as its corresponding metastatic processes and other autoimmune complications [24,25,26]. This important connection between hypoxic cellular pO2 and disturbance in many molecular processes creates the need to study hypoxia more thoroughly and carefully rather than following a single molecular process. In fact, hypoxia should be distinguished from anoxia and necrosis (See Figure 1). This can be achieved by carefully estimating the cellular pO2 levels in contrast with the vascular pO2 levels using suitable imaging and gauging devices. Figure 1 classifies the biomolecular processes used in lung cancer hypoxia detection.

3. Narrative Survey

A broad literature search was conducted to explore the use of PET for assessing hypoxia in cancer. Relevant studies published between 1990 and 2025 were considered, with a focus on original research and comprehensive reviews discussing imaging modalities for hypoxia detection. Studies which did not specifically address hypoxia imaging for cancer, lacked methodological detail, or were limited to commentaries, editorials, or conference abstracts without full-text availability were not included in the discussion.
The literature search identified numerous studies (approximately 730 articles) related to PET, PET/CT, and PET/MR imaging. Articles were selected based on their relevance to the topic, emphasizing key findings and advancements in hypoxia imaging. The selection process was guided by expertise in nuclear medicine, radiopharmacy, and imaging sciences, ensuring a well-rounded perspective. Key studies which contributed significant insights into hypoxia detection were highlighted and discussed in the review.
A total of 189 research references related to PET-based hypoxia detection and imaging were analyzed for this narrative review. Studies were included if they focused on PET imaging of tumor hypoxia, discussed the use of radiopharmaceuticals for hypoxia detection, or provided insights into the clinical and preclinical applications of hypoxia imaging in oncology. Studies were excluded if they lacked a direct focus on PET-based hypoxia imaging, were limited to commentary or editorial pieces without original data, or primarily discussed imaging modalities unrelated to PET.
Among the analyzed studies, 50% (n = 95) addressed tumor hypoxia in a general context, covering aspects such as molecular mechanisms, imaging techniques, and the impact of hypoxia on cancer progression and treatment resistance. A substantial portion (about 39% (n = 75)) specifically examined tumor hypoxia in lung malignancies, including non-small-cell lung cancer (NSCLC) and small-cell lung cancer, emphasizing its prognostic significance and role in treatment outcomes. Additionally, 8% (n = 15) explored hypoxia in other cancer types, such as head and neck cancers, breast cancer, and gliomas. A small fraction of the studies (2% (n = 4)) was identified as unrelated to tumor hypoxia, and they were excluded from further discussion.
Through this review, we identified nine radiopharmaceuticals commonly used to evaluate tumor hypoxia, which are summarized in Table 1.

3.1. Hypoxia as a Limiting Factor for Cancer Therapeutics

In 1912, Swartz was the first person to observe a correlation between blood flow and radiation damage. He discovered that the skin’s reaction to radium decreases if the applicator presses hard on the skin, and this is attributed to a reduction in the blood supply [27]. However, Petry believed that there was a more complex mechanism to describe these findings. In fact, during his experiments on vegetable seeds, he was the first scientist to prove a correlation between oxygen levels and radiosensitivity [28,29]. Following these findings, Thomlinson and Grey conducted a pilot histopathological study in 1955, which revealed a correlation between oxygen and treatment effectiveness. They demonstrated that the effectiveness of radiotherapy is enhanced by oxygenation, while hypoxia diminishes it [30]. Since then, hypoxia has emerged as a popular research area for many leading cancer research institutions.
Moreover, it has been reported in the last two decades that a higher amount of hypoxia results in a worse prognosis during cancer treatment. In simple terms, the chances of successful treatment increase when the cellular microenvironment is at normoxic or near-normoxic levels [31]. In contrast with normoxic cells, hypoxic cells experience inefficient molecular signaling pathways due to a change in tissue histology, which primarily hinders the corrective processes (i.e., pO2 level restoration) and causes morphological changes leading to de novo tumor vasculature [32,33]. Aside from this, a low vascular density often fails to provide enough oxygenation to the affected tissue and gives rise to temporal and spatial variations during tumor adaptation to the pO2 levels [34] (see Figure 2). This variation in pO2 levels results in minimizing chemotherapeutic and radiotherapeutic effects through a variety of mechanisms (e.g., physiological and genomic mechanisms) (see Figure 3).

3.2. Molecular Mechanisms of Cancer Resistance to Radiotherapy and Chemotherapy

Radiation therapy (RT) is a common treatment for solid tumors, often used alongside chemotherapy, immunotherapy, or surgery. RT damages DNA through ionizing radiation, causing direct damage when radiation is absorbed by the DNA itself and indirect damage through radiolysis of the surrounding water molecules, leading to the formation of reactive oxygen species (ROS) [11,14,38]. The presence of oxygen enhances ROS formation, increasing cellular damage, while hypoxia reduces this effect, leading to radiotherapy resistance [39]. Tumor cells attempt to repair radiation-induced DNA damage through mismatch repair, base excision repair, nucleotide excision repair, and double-strand break (DSB) repair, primarily via non-homologous end joining (NHEJ) and homologous recombination [14,39]. However, due to dysfunctional DNA repair and hypoxia, cancer cells may survive radiation treatment, reducing its effectiveness [14,39].
Hypoxia also influences gene expression, particularly through hypoxia-inducible factor (HIF-1α), which upregulates the genes involved in angiogenesis and apoptosis (e.g., VEGF-1 and p53) [40,41]. Additionally, HIF-1α is associated with chemotherapy resistance, further complicating cancer treatment [31]. Given that hypoxia is a negative prognostic marker, precise and efficient detection methods are crucial. Traditional monitoring techniques, such as oxygen polarographic needle electrodes and immunohistochemical analysis, are invasive [31,42]. PET imaging has emerged as a promising noninvasive tool for real-time hypoxia monitoring through radiolabeling specific targets and receptors, allowing visualization of tumor metabolism and oxygenation levels in vivo [43]. This highlights the critical role of PET imaging in addressing hypoxia-related treatment challenges and improving therapeutic outcomes.

3.3. Hypoxia PET Imaging

Both nuclear medicine modalities, including PET and SPECT, use gamma ray photons to create an image [44]. SPECT imaging involves the use of hypoxia-specific compounds combined with gamma-emitting radioisotopes like 123I/125I [45,46] and 99mTc [47] to show hypoxic areas within tumors. Although SPECT imaging is easy to perform, PET is generally preferred for its higher specificity in detecting hypoxic tissue. PET imaging relies on administering targeted drugs labeled with radioactive isotopes called tracers [43,48]. The term used to refer to a drug which has been labeled with a radioactive tracer is radiopharmaceutical. After administering the radiopharmaceutical, it emits positrons. Each positron travels a few millimeters before colliding with an electron in the surrounding tissue [49]. The collision of the two particles results in the emission of two photons, which can be detected and used to produce images that depict the particles’ origin and distribution [50]. Various tracers have been developed to detect hypoxic regions in tumors, each with unique advantages and use in PET imaging [51].

3.3.1. 18F-Fluromisonidazole (18F-FMISO)

Selectively binding to hypoxic cells in vitro and in vivo is 18F-FMISO [17,52]. It is hydrophilic and can passively diffuse through cell membranes in normal tissues. Moreover, it diffuses and selectively binds to intracellular macromolecules after reduction with nitro-reductase enzymes in the cytoplasm within viable regions (see Figure 4) [53]. This binding is reversible when cells are well oxygenated. On the contrary, under hypoxic conditions, 18F-FMISO is gradually reduced, producing hydroxylamine (R-NHOH) compounds which covalently bind to intracellular proteins, resulting in metabolic trapping of the radiotracer (see Figure 4 and Figure 5) [54]. Importantly, 18F-FMISO is characterized by its slow reaction mechanisms and washout (2–4 h) from the normoxic cells as it regenerates after reoxidation [53]. Subsequently, using 18F-FMISO requires prolonged examination protocols to identify and quantify hypoxic tumor areas [53]. Therefore, the timing of passive diffusion, intracellular reduction, and trapping is vital for achieving good image contrast [55].
For assessing tumor hypoxia in patients with lung, brain, and head and neck cancer, 18F-FMISO has successfully been used [17,52,56,57,58,59]. Additionally, it has been used in benign medical conditions (e.g., to assess ischemia in patients with suspected coronary artery obstruction) [60]. Several clinical studies have investigated the potential role of 18F-FMISO in evaluating different aspects of head and neck cancer (HNC). These studies have evaluated various aspects of HNC, including correlation with other hypoxia biomarkers during radio-chemotherapy [17,61,62], its ability to predict outcomes in patients with HNC [63], and its uptake changes during serial imaging [16,64].
A clinical study was conducted on carbon ion radiotherapy patients with NSCLC which showed significant uptake of 18F-FMISO before radiotherapy and a decrease post therapy [65]. Furthermore, the association of 18F-FMISO uptake with the glioma tumor grade, hypoxia biomarkers (CA-IX and HIF-1α), and angiogenesis markers (VEGF) has also been reported [66]. The same study found a reduction in 18F-FMISO accumulation following chemotherapy, but the reason for this was not known. Some evidence suggests that in cases of severe hypoxia, where the level of oxygen (pO2) falls below 2–3 mmHg, the uptake of 18F-FMISO may not accurately indicate the level of hypoxia. This could be due to either a threshold point beyond which tracer uptake in the cell may not increase, or there may be a bioreduction in 18F-FMISO which does not exceed a certain point [67]. One study indicated that the use of 18F-FMISO may cause harmful side effects such as peripheral sensory neuropathy [68]. Therefore, a more hydrophilic version of 18F-FMISO, 18F-FETNIM, was developed [68].
Figure 5. Representative PET imaging results comparing [18F]-FMISO, [18F]-FDG, and [18F]-FAZA in a lung cancer patient. Coronal, axial fused, and axial PET images demonstrate tracer uptake in the tumor, highlighting differences in hypoxia ([18F]-FMISO and [18F]-FAZA) and glucose metabolism ([18F]-FDG). The images show the distinct localization of each tracer, emphasizing the role of hypoxia imaging ([18F]-FMISO and [18F]-FAZA) versus metabolic imaging ([18F]-FDG) in tumor characterization This figure is reproduced from Thureau et al., 2021 under a CC BY 4.0 license (DOI: 10.3390/cancers13164101) [69]. No additional permission is required.
Pharmaceuticals 18 00459 g005

3.3.2. 18F-FETNIM

Another type of nitroimidazole called 18F, which is labeled fluoroerythronitroimidazole (FETNIM), has been found to be more cost-effective and hydrophilic than FMISO in hypoxic tumor models [70]. Compared with FMISO, 18F-FETNIM has shown less penetration of the blood–brain barrier (BBB) while demonstrating similar tumor-to-muscle uptake ratios and correlation with the oxygenation status in mice with C3H mammary carcinomas [71]. Man Hu et al. [72] suggested that 18F-FETNIM can be a valuable tool for evaluating tumor hypoxia and targeting tumor cells resistant to conventional therapy in NSCLC patients. However, Yuchun Wei et al. [73] demonstrated that tumors exhibit significantly higher uptake with 18F-FMISO compared with 18F-FETNIM. Therefore, they suggested that 18F-FMISO may be a better hypoxia tracer for lung cancer patients (see Figure 6). On the contrary, some studies comparing the uptake of FMISO and FETNIM in lung cancer patients showed that there is no significant difference between the two in terms of tracer uptake and tumor-to-blood ratio (TBR). Nonetheless, both FETNIM and FMISO tumor uptake are considered effective prognostic factors for a patient’s overall survival [72,73,74].

3.3.3. 18F-FDG

Cancer is characterized by the reprogramming of energy metabolism, which has led to the development of tracers like fluorine-18 (18F) bound to the glucose analogue 2-[18F]fluoro-2-deoxy-D-glucose (18F-FDG) being extensively used for diagnostic purposes in various malignant conditions [5,75].
The most common radiotracer used for PET imaging is 18F-FDG [75]. This is because cancer cells consume more glucose than normal cells, which makes them easier to identify and locate [76]. A radiolabeled glucose analogue, 18F-FDG has the 18F radioisotope substitute the hydroxyl group of glucose at position 2. By injecting a small amount of 18F-FDG into a patient, the PET scanner can produce images which highlight the areas of the body with the highest glucose uptake [76]. Studies have demonstrated that this radiopharmaceutical is effective in determining the extent of cancer, detecting distant metastases, planning therapy, evaluating responses to treatment, and locating tumors in cases where the primary one is unknown [76,77,78,79]. Substantial evidence suggests that 18F-FDG PET/CT should be included in the diagnostic workup of patients with lung cancer due to its ability to provide valuable information for staging the disease and selecting appropriate therapy [80].
Clavo et al. proposed that 18F-FDG could be a substitute for hypoxia imaging [80]. This is because glucose metabolism is stimulated via HIF1α under hypoxic conditions. Zhao et al. demonstrated the relationship between the uptake pattern of 18F-FDG, the expression of glucose transport proteins and hexokinase, and the presence of HIF-1α using autoradiography and immunostaining [81,82]. Moreover, Dierckx and Van De Wiele discovered a correlation between glucose metabolism and hypoxia, detected using 18F-FDG PET imaging [18,83]. Several studies have been conducted to evaluate the relationship between 18F-FDG uptake and the level of hypoxia. However, the results obtained from these studies are contradictory to results depicted by Dierckx and Van De Wiele [18,83]. Zimny et al. discovered that 18F-FDG PET could not reliably differentiate between hypoxic and normoxic tumors, despite the effect of hypoxia on glucose metabolism in head and neck tumors [84]. Gagel et al. [66] demonstrated that there was no correlation between 18F-FDG PET and hypoxia, as assessed using 18F-FMISO, in patients with NSCLC. Moreover, the presence of HIF-1α protein in non-hypoxic tumor regions suggests that other factors may indirectly affect glucose metabolism and 18F-FDG uptake in these regions [20].
Overall, 18F-FDG PET/CT plays a crucial role in evaluating the response to therapy in various tumors, including lung cancer [85]. It has a specificity of 92% and a sensitivity of 100% in NSCLC patients [85]. Some publications suggest that the level of 18F-FDG avidity after treatment is linked to worse survival rates and an increased risk of local recurrence as well as distant metastases [86]. Recent studies indicate that interim 18F-FDG PET during chemotherapy can predict responses to therapy and patient survival in lung cancer cases [87]. Derlin et al. [88] conducted a study which demonstrated the significant benefits of using PET imaging in patients with(NSCLC. Furthermore, the study found that 18F-FDG PET imaging helped avoid unnecessary thoracotomies in about 50% of patients compared with those who did not undergo PET imaging. Therefore, PET/CT should be used in all patients who are planning to undergo radical radiotherapy (RT), surgery, or radio-chemotherapy.
While the 18F-FDG radiotracer is commonly used in PET/CT studies, it has a few limitations. Glucose accumulation in inflammatory cells can cause false-positive results in 18F-FDG PET/CT scans, especially during lymph node staging, tuberculosis, sarcoidosis, or other pulmonary inflammatory conditions [89]. A study used 18F-FDG PET/CT scans to distinguish between tuberculosis and malignant lung lesions, both in early and delayed stages. They reported that dual-phase 18F-FDG PET using both early and delayed imaging appears to be useful in distinguishing between TB and malignant lung lesions. In general, endobronchial ultrasound (EBUS) remains the gold standard for distinguishing between malignant and benign lymph nodes [90]. Due to these concerns, it is necessary to investigate more specific PET tracers which could provide additional information in such cases.

3.3.4. 18F-FSPG

Over the past decade, researchers have conducted studies to explore alternative changes in energy metabolism as a means of creating tracers which are more specific to cancer cells. The molecule (4S)-4-(3-[18F]fluoropropyl)-l-glutamate (18F-FSPG), also known as BAY 94-9392, is an 18F-labeled glutamic acid derivative designed to target the xc⁻ system, a key player in tumor-specific metabolic adaptations [91].
18F-FSPG is transported into cancer cells via the xCT transporter, a cystine/glutamate antiporter which facilitates the exchange of intracellular glutamate for extracellular cystine. This transporter functions as a glutamate/cystine exchanger (SLC7A11/SLC3A2 (CD44) heterodimer) which exchanges L-cystine for L-glutamate across the cell membrane, allowing L-cystine to enter the cell and L-glutamate to exit into the extracellular compartment [92]. In addition, 18F-FSPG has shown promising results in preclinical and clinical studies for cancer detection, with potential applications in differentiating benign from malignant lesions [92,93,94,95,96]. Moreover, 18F-FSPG has demonstrated utility in detecting cancers such as breast, lung, prostate, colorectal, and head and neck cancers as well as hepatocellular carcinoma, with ongoing research to validate its use in other malignancies [92,93,94,95,96,97,98]. Studies suggest that 18F-FSPG may offer advantages over 18F-FDG by reducing false positives in benign or inflammatory lesions [92,93,94,95,96,99]. An exploratory study evaluating 18F-FSPG PET/CT in different cancers demonstrated a comparable tumor-to-background ratio (TBR) and detection rate between 18F-FSPG PET/CT and 18F-FDG-PET/CT in NSCLC patients. Significant correlations between 18F-FSPG uptake and the xc⁻ system have been demonstrated in certain tumors using immunohistochemical staining [94]. Baek et al. [94] tested the diagnostic potential of 18F-FSPG PET/CT in detecting intermediate-risk pulmonary nodules in 26 patients and compared the results with 18F-FDG-PET/CT. According to this study’s findings, there was no significant difference in diagnostic accuracy between these two radiopharmaceuticals [94]. Ongoing clinical trials aim to evaluate the diagnostic performance of 18F-FSPG, particularly in patients with lung cancer [98,100].
In evaluating indeterminate pulmonary nodules, a study compared the effectiveness of 18F-FSPG PET imaging against the standard 18F-FDG PET. The findings revealed that 18F-FSPG PET successfully identified malignant lesions which exhibited low or no uptake in 18F-FDG PET scans. This suggests that 18F-FSPG PET can detect certain lung tumors which 18F-FDG PET might miss. Therefore, 18F-FSPG PET could serve as a complementary imaging modality, enhancing the detection and characterization of lung tumors, especially in cases where 18F-FDG PET results are negative or inconclusive (see Figure 7) [91].

3.3.5. 18F-FLT

18F-FLT is a thymidine analogue used as a radiopharmaceutical for cell proliferation imaging primarily due to its correlation with Ki-67 expression, which is a nuclear protein [101]. While 18F-FLT primarily functions as a tracer for cell proliferation by targeting thymidine kinase 1 activity, its use in a hypoxia-related review can be justified by the relationship between hypoxia and tumor proliferation. Tumor hypoxia is a major driver of cancer progression, and hypoxic regions often correlate with increased tumor aggressiveness, resistance to therapy, and enhanced proliferative signaling. These effects make it crucial to consider proliferation imaging alongside hypoxia imaging for a more comprehensive understanding of tumor biology. The concentration of FLT in lung cancer cells reflects the activity of the proliferation-dependent enzyme thymidine kinase, which is upregulated selectively prior to and throughout the S phase (DNA replication and growth phase) [102]. Vera et al. conducted a pilot study with three different tracers, namely 18F-FDG for metabolism, 18F-FMISO for hypoxia, and 18F-FLT proliferation, for five patients with NSCLC who were undergoing radiation therapy [103]. The study utilized the tracers before and during treatment, and the results showed correlations between the three [103].
Alwadani et al. found that 18F-FLT had a higher specificity but a low sensitivity compared with 18F-FDG for diagnosing and staging patients with lung cancer [104]. They also stated that although this tracer was linked to time to progression and progression-free survival (PFS), it had a weaker correlation with tumor size and overall survival (OS). 18F-FLT may not be an ideal ligand for imaging of patients with SCLC because of its limited uptake, as it only reflects cells in the S phase [104]. This could limit its diagnostic performance, since cells in other phases may not be detected. Additionally, the accumulation of FLT in rapidly dividing cancer cells and benign tissues, such as bone marrow and the liver, could also be influenced by cell transport mechanisms [105]. Still, 18F-FLT provides predictive values for therapy in other cases. A study showed that radiation therapy significantly reduced 18F-FLT uptake in patients with NSCLC, indicating that this radiotracer could potentially detect early radiation response [106]. It was also demonstrated that the uptake of 18F-FLT is substantially reduced after receiving 5–11 fractions of RT [106]. Moreover, after completing chemotherapy, Allen et al. observed a considerable reduction in 18F-FLT uptake, which had a better diagnostic accuracy than 18F-FDG [107]. This also appears to be consistent with the previously mentioned study by Alwadani et al. [104]. FLT is generally not considered an alternative to the current pan-cancer agent FDG. However, it could be used in specific clinical conditions, such as assessing early therapeutic response or monitoring recurrences of NSCLC [104].

3.3.6. 18F-FAZA

The use of FMISO is limited due to its slow clearance from normoxic background tissue, leading to low image contrast and prolonged imaging protocols [108,109]. The combination of FMISO’s slow clearance and its radioisotope’s half-life of 110 min poses challenges for efficient imaging [109]. These challenges underscore the need for a more hydrophilic alternative to FMISO, such as 18F-FAZA, which addresses these limitations while retaining the ability to detect hypoxic tissue accurately. Subsequently, a second-generation nitroimidazole derivative called 18F-FAZA was developed as a follow-up to 18F-FMISO [109].
18F-FAZA demonstrates enhanced pharmacokinetic properties, including greater hydrophilicity, lower lipophilicity, faster vascular clearance, and renal excretion, making it a more efficient tracer compared with FMISO [108]. These radiotracer characteristics result in higher uptake and improved hypoxia-to-normoxia contrast compared with FMISO, which exhibits slower clearance and is excreted via the hepatobiliary system [108,109]. In a comparison between 18F-FAZA and 18F-FMISO in two murine tumor models, 18F-FAZA consistently showed higher tumor-to-muscle and tumor-to-blood ratios, attributed to its faster clearance rate. Furthermore, 18F-FAZA has been clinically applied for imaging hypoxia in a range of tumors, including gliomas, rhabdomyosarcomas, lymphomas, and carcinomas of the lung, head, neck, cervix, and rectum [83,110,111,112,113]. A research study conducted on 38 patients suffering from advanced non-small-cell lung cancer (NSCLC) found that the level of hypoxia, as measured by 18F-FAZA, was linked to disease progression during chemoradiation treatment [114]. Emerging evidence suggests that 18F-FAZA holds greater potential for clinical and preclinical applications compared with its first-generation counterpart, 18F-FMISO [108,115]. Busk et al. [116] suggested that 18F-FAZA imaging data may be sufficient for radiotherapy planning. Their study demonstrated the reproducibility of FAZA PET hypoxia imaging at baseline and during fractionated radiotherapy in tumor-bearing mice, highlighting its potential for treatment adaptation. This evidence supports the sufficiency of FAZA imaging data for guiding radiotherapy decisions by assessing tumor hypoxia over time.
Although various clinical studies have been conducted on lung malignancies [111,117,118], none of these clinical studies provide a direct comparison of 18F-FAZA with hypoxia biomarkers, to the best of our knowledge. For example, numerous research groups have confirmed the validity of pimonidazole HCl as a hypoxia marker [119,120,121], and indeed, a correlation has been reported between pimonidazole immunostaining in tissues and the level of oxygen as measured with electrodes or luminescent pO2 sensors [122]. However, limited studies associate 18F-FAZA uptake with hypoxia hallmarks or pimonidazole immunostaining in specific cancer cell xenografts. Some clinical studies have suggested that the uptake of 18F-FAZA is dependent on oxygen, but there are only a few studies which validated or established its correlation with oxygenation.
Under ideal circumstances, the uptake of a hypoxia tracer is not directly proportional to perfusion. However, a lack of perfusion can potentially affect tracer delivery, which may disturb the association between tissue hypoxia and 18F-FAZA uptake [123]. Subsequently, in low-perfusion regions which contain strongly hypoxic tissue, poor tracer delivery may result in the underestimation of hypoxia as detected by 18F-FAZA [123]. The uptake of 18F-FAZA is expected to be higher in areas with low perfusion, while regions with high perfusion may exhibit lower uptake due to a sufficient oxygen supply. Unfortunately, most PET hypoxia tracer uptake analysis methods do not account for potential perfusion effects at present [111,124].

3.3.7. 18F-EF3

Several other molecules of hypoxia-avid radiopharmaceuticals are represented by 18F-2-nitroimidazol-pentafluoropropyl acetamide (18F-EF5) and 18F-2 nitroimidazol-trifluoropropyl acetamide (18F-EF3). The EF family of molecules is promising due to their increased stability in comparison with FMISO [125,126,127,128,129,130,131]. The compound 18F-EF3 was thoroughly researched by Mahy et al. [125] for its potential use in ear, nose, and throat (ENT) tumors. Their results revealed that 18F-EF3 was eliminated from the body at a faster rate than 18F-FMISO. Additionally, the images obtained four hours after injection indicated that the compound was evenly distributed in healthy tissue, being similar to the distribution observed with 18F-FMISO. However, the EF family was abandoned due to its complex radio-labeling processes and tendency to rapidly de-fluorinate. Moreover, these compounds have a long biological half-life of 12 h, which can cause them to bind to aerobic cells and remain in the bloodstream, leading to a poor TBR [131]. Many other clinical studies have been carried out using this radiotracer [125,126].

3.3.8. 18F-EF5

Another member of the EF family is 2-(2-nitro-1H-imidazol-1-yl)-N-(2,2,3,3,3-penta-fluoropropyl)-acetamide labeled with fluorine (18F-EF5). 18F-EF5 has a higher octanol-water partition coefficient, enabling passive diffusion through cell membranes, which could enhance the consistency of both tumor uptake and tracer distribution [126,127]. As seen with 18F-EF3, 18F-EF5 has demonstrated the capability of identifying tumor hypoxia in head and neck, cervical, and brain cancers [126]. However, again, the complexity of radiolabeling processes gives 18F-EF5 no significant advantage over 18F-FMISO. The tracer 18F-EF5 was used to study NSCLC, and its uptake was found to be correlated with tumor hypoxia [128,129]. Its excretion occurs mainly through the kidneys, with a smaller amount excreted in the liver and bowels [127]. Due to its lipophilicity, 18F-EF5 is uniformly distributed in the normal brain [127].

3.3.9. 18F-HX4

3-[18F]fluoro-2-(4-((2-nitro-1H-imidazol-1-yl) methyl)-1H-1,2,3-triazol-1-yl)propan-1-ol (18F-HX4) is a third-generation 2-nitroimidazole nucleoside analogue [130,131]. Dubois et al. synthesized 18F-Flortanidazole (18F-HX4) using a process known as “click chemistry”, which involves assembling small units together through heteroatom linkages [131]. This technique enables a faster and more efficient synthesis process. The presence of a 1,2,3-triazole moiety in 18F-HX4 increases its hydrophilicity, resulting in improved renal clearance compared with FMISO [130,131]. Despite having favorable pharmacokinetics, the limited published clinical data are a reason for its limited use.
Nonetheless, the initial clinical trials demonstrated similar outcomes when compared with FMISO, provided that image acquisition was performed 4 h after tracer administration [132,133]. Ureba et al. reported that there was a correlation between the level of pO2 and 18F-HX4 uptake in patients with non-small-cell lung cancer (NSCLC) [134]. Furthermore, another study carried out among patients with NSCLC which explored the relationship between tumor metabolism and tumor oxygenation using 18F-FDG and 18F-HX4, respectively [135], found that the biological imaging characteristics observed in NSCLC tumors exhibited significant interpatient and intratumor variability. The majority of the tumors showed overlapping regions of hypoxia and metabolic activity, while regions with high blood flow did not align with areas of increased hypoxia. Additionally, Zegers et al. used PET imaging with 18F-HX4 in a study of 15 NSCLC patients. They observed that this tracer showed uptake in the majority of NSCLC lesions. Moreover, it has been suggested that 18F-HX4 PET could be a more effective hypoxia imaging biomarker than 18F-FMISO, as it can be used with a shorter injection-acquisition time [136]. However, further validation in a larger patient cohort is still required. Zegers et al. conducted several studies which revealed the potential application of 18F-HX4 as a hypoxia PET tracer in NSCLC and HNSCC. They found that it could be useful for monitoring changes in hypoxic areas during radiotherapy or treatment intensification [137]. One of these studies was conducted on two 18F-HX4 PET scans on patients with lung, head, and neck cancer in the same week before radiotherapy treatment and showed that 18F-HX4 PET provided consistent and reproducible results over time [138].
This study on [18F]HX4 for hypoxia PET imaging in lung cancer also demonstrated that repeated scans provide highly reproducible results, with SUVmax and SUVmean showing strong correlations between scans (r = 0.958 and r = 0.946, respectively). Figure 8 illustrates a voxel-wise analysis of lung cancer patients, highlighting stable hypoxic regions over two scans and enabling reliable mapping for potential hypoxia-targeted therapies. This imaging technique identifies hypoxic tumor areas with spatial consistency, making it a promising tool for personalizing treatments in patients with hypoxic tumors [138].

3.3.10. Cu-ATSM

Thiosemicarbazone-based tracers, such as copper complexes of diacetyl-bis(N4-methylthiosemicarbazone) (Cu-ATSM), are widely used for imaging hypoxia due to their selective accumulation in hypoxic tissues. However, the precise mechanisms underlying the hypoxia selectivity of this tracer group still remain incompletely understood [131]. The most widely accepted theory suggests that Cu-ATSM is initially reduced in both normoxic and hypoxic cells to form a less lipophilic and unstable Cu(I)-ATSM complex. However, in the case of normoxia, this complex undergoes reoxidation, which causes it to be expelled from the cell [130]. Cu-ATSM exhibits favorable pharmacokinetics, with quick uptake in hypoxic tissues and rapid clearance from normoxic tissues [123,139], which enable imaging 30 min after injection.
On the contrary, another study indicated the uncertainty of considering Cu-ATSM as a hypoxia-selective radiopharmaceutical [140]. For instance, the documented relationship between Cu-ATSM and fatty acid synthase (FAS) proves that the former is not capable of detecting hypoxia due to its altered uptake pattern during FAS overexpression associated with prostatic malignancies [141]. Additionally, changes in the intracellular environment and biology (mitochondrial changes and pH, respectively) may lead to non-hypoxic trapping of 64Cu-ATSM [140]. A comparative study between 64Cu-ATSM and 18F-FDG found no correlation between their corresponding uptakes [21]. The accumulation of 64Cu-ATSM was observed at the periphery, while a high accumulation of 18F-FDG was noticed at the center of the tumor. This difference may be explained by the differences in the perfusion and metabolic demand of the hypo-perfused tumor center (see Figure 9). Furthermore, an inverse correlation between 64Cu-ATSM uptake and blood flow has been observed [21].
Cu-ATSM is potentially more useful in clinical practice than FMISO due to its ability to accurately determine the hypoxia conditions within tumor cells [142]. However, several studies indicate that the uptake of Cu-ATSM is influenced not only by hypoxia but also by other factors, such as tumor type and blood flow [123,131,139,143]. This affects the release of copper ions, which in turn affects Cu-ATSM uptake. Clinical trials of Cu-ATSM have shown conflicting results as a hypoxic agent compared with FMISO in lung cancer over the past two decades [130]. Still, Cu-ATSM may have better clinical applicability due to its favorable pharmacokinetics [130]. Cu-ATSM imaging has several important advantages, including its ability to predict treatment response after chemo-radiotherapy, which makes it a useful prognostic factor [22]. Cu-ATSM imaging can, therefore, play a role in treatment planning for advanced stages of lung cancer, as well as for monitoring treatment response [22,108,144]. Studies have shown that Cu-ATSM imaging can be particularly effective in these scenarios.
Copper-labeled radiopharmaceuticals, including 60Cu, 61Cu, and 64Cu, have distinct physical properties which determine their applications. First, 60Cu (half-life of ~23.7 min) is suited for imaging rapid physiological processes, such as acute hypoxia, and 61Cu (half-life of ~3.33 h) provides a longer imaging window, allowing for the study of processes with intermediate kinetics. Meanwhile, 64Cu (half-life of ~12.7 h) is the most versatile of the three, supporting both diagnostic imaging and therapeutic uses due to its longer decay characteristics. Moreover, Cu-PTSM (pyruvaldehyde-bis(N4-methylthiosemicarbazone)) is specifically designed for perfusion imaging, targeting highly oxygenated and well-perfused tissues. On the contrary, Cu-ATSM compounds preferentially accumulate in the hypoxic regions of tumors, making them valuable for studying oxygen-deprived microenvironments. These radiopharmaceuticals provide complementary insights, enhancing our ability to characterize tumors and tailor treatment strategies [34,145,146,147,148,149,150,151].
Lohith et al. compared the uptake and intra-tumoral distribution of 62Cu-ATSM and 18F-FDG in squamous cell carcinoma (SCC) and adenocarcinoma, and the findings revealed that SCC showed spatial mismatching of the two tracers, with 62Cu-ATSM accumulating in peripheral regions and 18F-FDG concentrating in central regions, whereas in adenocarcinomas, there was a more homogeneous distribution. These variations highlight the potential of dual-tracer PET imaging for identifying tumor hypoxia and glucose metabolism differences, offering valuable insights for diagnosis and treatment planning (see Figure 8) [152].
Figure 9. Transaxial PET images of 62Cu-ATSM (A), 18F-FDG (B), their fused overlay (C), and the corresponding CT scan (D) of a 59-year-old male with SCC in the right hilus. The fusion image displays 62Cu-ATSM PET in color and 18F-FDG PET in grayscale. Reproduced from Lohith et al., 2009 under a CC BY license (DOI: 10.2967/jnumed.109.069021) [152].
Pharmaceuticals 18 00459 g009

4. Discussion

It is important for a design of hypoxia agents to follow the general medicinal practice for radiopharmaceuticals and also exhibit various favorable characteristics. This article explores the potential of certain PET radiotracers and their corresponding hypoxia imaging. However, it is imperative to understand the major limitations of traditional methods to measure hypoxia, such as immunohistochemical (IHC) assays. IHC assays are considered the gold standard for hypoxia detection, and nitrimidazoles are the extrinsic markers used for this purpose [153,154,155]. During hypoxia, the nitrimidazoles become trapped inside cells due to the predominance of covenant bonding with the cells’ macromolecules. A subsequent biopsy should be taken, and employing antibody markers to the biopsy specimen is required to acquire the fluorescent signal. This process of using IHC assays is difficult, cumbersome, invasive, and operator-dependent. Other examples of measuring hypoxia include protein-based assays which use endogenous marker proteins, such as carbonic anhydrase IX and glucose transporter 1, to identify the oxygen levels by detecting overexpression of hypoxia-related proteins [156]. This assay again has similar limitations to those mentioned for IHC [157,158].
Targeting specific molecular processes associated with hypoxia, rather than assessing overall organ activity, provides a more specific and insightful understanding of tumor development. This targeted approach enables earlier detection and more precise characterization of the tumor microenvironment, ultimately improving diagnostic accuracy and treatment strategies [159,160,161]. However, it is important to carefully consider various factors when selecting the radionuclide, biomolecule, and chelation agents [162]. These factors have a direct impact on the specific binding, in vivo affinity, metabolic stability, overall pharmacokinetics, and bio-behavior of the product molecule. Therefore, the design of a hypoxia agent must undergo an optimization process to ensure the best imaging criteria, such as high specific binding and selectivity [163]. This involves choosing the most suitable radioisotope, labeling site, lipophilicity, and size of the targeting molecule. When selecting a radioisotope, one must consider the energy, half-life, and traveling range of the β+ particles emitted from the isotope [163]. Zirconium-89 (Zr) is used in hypoxia imaging due to its long half-life, compatibility with PET imaging, and ability to label hypoxia-targeted biomolecules such as CAIX inhibitors and antibodies, enabling precise visualization of hypoxic tumor microenvironments [164]. However, more energetic isotopes (such as 89Zr with a half-life of 78.4 h, Emean of 0.396 Mev, and mean range of 1.3 mm) travel further in the tissue, which can affect the spatial resolution. After designing the radio-molecule, it should undergo thorough studies to test its feasibility and applicability (see Figure 10).

4.1. Technical Consideration

Effective hypoxia imaging relies on two key qualifications: imaging modality and hypoxia delineation. The chosen modality must possess the sensitivity to detect subtle variations in tumor and tissue oxygenation, ideally enabling (1) differentiation of hypoxia from other oxygen-related pathologies; (2) the estimation and identification of cellular rather than vascular pO2 values; and (3) sensitivity within the low mmHg range (0–15 mmHg). In the context of hypoxia imaging, it is essential for the imaging equipment to meet specific technical specifications, including an appropriate spatial resolution (70–100 µm) and temporal resolution [165,166,167]. These resolutions should be equal to or smaller than the distribution and diffusion distances of the imaging agents [168,169]. Furthermore, the imaging modality must facilitate repeated studies across various regions of the body with minimal invasiveness. Positron emission tomography (PET) generally fulfills these criteria and enables real-time imaging through the use of various radiotracers. PET operates by detecting gamma ray signals emitted from the radiotracer retained in the tissue, which correlates with tissue oxygenation. The temporal heterogeneity in a tumor’s blood supply is a limiting factor in hypoxia imaging [170,171,172], as well as dynamic tumor vasculature [170,171,172], presenting another challenge during PET imaging.
Tumor-associated blood vessels often exhibit deformities and abnormalities [172], resulting in longitudinal and radial variations in the blood supply which can change within seconds [173]. This necessitates a higher temporal resolution and direct measurements to accurately assess these fluctuations. Moreover, the continuous remodeling of a tumor’s vasculature leads to variations in red blood cell flux within the micro-vessels lasting from minutes to hours, which can significantly impact oxygen saturation [174,175].
In order to overcome these limitations, PET can be integrated with other imaging modalities to provide a more comprehensive analysis. Magnetic resonance imaging (MRI), utilizing distinct principles for imaging hypoxia, is a promising candidate for addressing these challenges [139]. MRI can offer a higher temporal resolution and direct measurements of the partial oxygen pressure (pO2), such as through fluorine-19 magnetic resonance spectroscopy (MRS). This technique allows for the assessment of direct oxygen consumption by detecting changes in the probe (e.g., perfluorocarbons) during its interaction with O2. MRS can quantify pO2 levels in a range higher than PET (0–100 mmHg) with high sensitivity (1–3 mmHg) [176,177,178]. Although the cost of MRS is a notable limitation, it can be complemented by various other imaging techniques, including immunohistochemistry, reporter gene imaging, oxygen-sensing probes, optical spectrometry, and electron paramagnetic resonance imaging [179].
Quantification of hypoxia agent levels is typically achieved using one of three parameters: the standard uptake value (SUV), tumor-to-blood ratio (TBR), or hypoxia fraction (HF). The SUV is a numerical representation of tumor uptake commonly measured with 18F-FDG following the administration of a radioactive dose [19,48]. This value is normalized to the injected dose and distribution factors, such as body weight, and is calculated using the following formula:
S U V = A C v o i   ( k B q m L ) r a d i a c t i v e   d o s e   ( M B q B W   k g )
where, ACvoi represents the concentration of the average activity and the administered FDG dose’s (decay-corrected) activity. Comparing the four main hypoxia radiotracers (i.e., 18F-FAZA, 18F-HX4, 18F-FMISO, and 64Cu-ATSM). it can be found that each radiotracer shows variation in its SUVs. Therefore, the use of other parameters is necessary to accurately measure hypoxia.
The target-to-background ratio (TBR) refers to the ratio of the maximum radiotracer concentration in the region of interest (ROI) to the background concentration [180]. A tumor-to-blood ratio (TBR) value greater than 1.2 (or 1.4 in some studies) two hours post injection has been established as a hypoxia-specific value for 18F-FMISO [19]. However, normal retention of the radiotracer does not allow for imaging at this time, necessitating a waiting period for better TBR estimation. On the contrary, the hypoxia fraction (HF) is defined as the fraction of pixels with a TBR greater than 1.2 (or 1.4) within the region of interest (ROI) at two hours post-injection [19]. Factors affecting standard uptake value (SUV), TBR, and HF quantification can be divided into two main categories: (1) physical and technical factors and (2) physiological effects.
In the former category, several factors recognized in the literature are common sources of errors during SUV, TBR, and HF estimation. One major source of error is the cross-calibration between PET-CT (or PET) and the dose calibrator. Calibration establishes the relationship between the measured count rate from the body and the actual concentration of activity. Failure to fulfill this requirement results in cross-calibration errors, which can introduce a systematic error in the SUV, TBR, and HF equivalent to the relative value of miscalibration [181,182]. To avoid this error, basic calibration should be performed using a 68Ga phantom of homogeneous activity in a solid matrix for each mode of data acquisition. The activity used in the calibration (in the phantom and matrix) should be verified using the on-site dose calibrator. This is particularly important in multi-center studies aiming to acquire quantitative data, with the accuracy required to be at least 5–10% [183,184,185].
To ensure accurate dosages for patients or test subjects, estimating the exact dose administered is crucial. This can be achieved by counting the residual activity in the syringe. Synchronizing the PET and dose calibrator clocks accurately is also essential; incorrect synchronization can lead to erroneous estimation of the SUV, TBR, and HF. For decay correction, the calibration time of the dose should be used instead of the injection time. Using the injection time can overlook the interval between calibration and injection, leading to inaccurate calculations of actual activity and the SUV, TBR, and HF. This discrepancy can significantly impact the results, especially with short-lived radionuclides like 18F (T1/2 = 110 min) [185,186]. Additionally, to prevent infiltration of the dose, a secure cannula should be in place prior to injection, and any residual activity at the injection site should be avoided under the camera, as this may affect the SUV by up to 50% [108].
In the latter category, physiological factors can also influence SUV, TBR, and HF estimation, some of which may originate from the patient or subject. For instance, increased blood glucose levels have been shown to reduce the SUV during 18F-FDG imaging. Busing et al. found that changes in blood glucose levels, insulin resistance, diabetes, and obesity could affect SUV estimation. Moreover, the time interval between injection and image acquisition may also impact SUVs and the HF [181]. Lowe et al. discovered that the optimal time for improved SUV estimation and better differentiation between normal and abnormal tissue in pulmonary malignancy is 50 min post injection. However, this may not hold true for all cancer types or other radiopharmaceuticals [141]. Some publications suggest a waiting period of 2–4 h for nitroimidazole analogues and less than 1 h for Cu-ATSM. Exceeding the recommended duration may lead to incorrect SUVs, TBRs, and HFs. Other factors, such as patient breathing and inflammation, may also falsely increase the SUV [141].
It is worth noting that several studies have emphasized the importance of standardizing the appropriate waiting period after chemotherapy and radiotherapy. For chemotherapy, Juweid et al. suggested a minimum waiting time of 14 days [187]. For radiotherapy, others recommended waiting up to three months due to the extent of inflammation following treatment and the involvement of different tissues during therapy. Body weight and height should be considered during every scan to enhance normalization and improve SUV and HF estimation [186,188].
Technical factors play an essential role in accurately measuring hypoxia. The body’s increased noise level can lead to overestimation of SUVs and poor image quality. To counter this problem, it is important to follow good injection (and dose) techniques, appropriate uptake periods, and adequate scan durations [189,190]. Breathing [191,192,193], contrast agents [194,195,196,197], and movement [193,194] during a scan can cause problems in PET/CT image registration, which can affect SUV, TBR, and HR estimation [186,189]. Therefore, proper breath-holding protocols [191] and reconstruction methods (see Figure 11), including attenuation and decay correction, should be used [186]. Increased iterations may also result in increased noise and SUVs. Various reconstruction recommendations have been extensively discussed in the literature [191,192,193,194]. It is advisable to match the image resolutions in multi-center studies, as different image resolutions make the comparison (pre- and post-therapy) of SUVs difficult. Furthermore, standardizing the region of interest (ROI) techniques using a universal or highly automated ROI delineation method may also help reduce sources of uncertainty. Table 2 summarizes the recommendations to enhance standardized uptake values (SUVs) in hypoxia PET imaging.
To measure the tumor volume, there are two methods which can be employed. The first method involves predefining the primary and secondary gross tumor volume (GTV1 and GTV2, respectively) and determining the uptake in the GTV1. The second method involves calculating the DICE coefficient by defining the high percentile uptake value UV (e.g., 60–90% range) at two and four hours post-injection. Another important step is to set the HF threshold (e.g., 6%) and define the volumes at four hours post-injection before comparing them to the values at two hours post-injection. The equation can be described as follows:
D I C E = U V   2   h U V   ( 4   h ) U V   2   h + U V   ( 4   h )
The use of standardized protocols in PET comparison studies is mandatory for achieving the inter-interpretability of hypoxia trials. However, this is still a topic of debate and cannot be standardized easily due to multiple reasons. Firstly, the quality of images is not solely dependent on the patient or subject’s weight and may require the consideration of other factors such as the scanning mode and time per bed position. Secondly, the acquisition and reconstruction parameters are usually preset and fixed by the manufacturer, and adjusting them requires careful consideration [199]. For instance, when changing the parameters for PET acquisition, the CT parameters should be adjusted accordingly. Furthermore, available software for SUV quantification from different companies should be also taken into consideration [186].
The complexity of the reconstruction algorithm presents a challenge for imaging technologists who require educational and practical sessions to bridge this gap. A challenge observed in PET centers in nuclear medicine departments around the world is the lack of proper coordination between the radio-pharmacy and cyclotron units. The initial activity generated from the cyclotron is transferred to the radio-pharmacy unit for counting and recording and subsequently to the PET imaging unit for injections. This may cause uncertainties in the actual activity calculations. This is considered a major problem when the used dose calibrators are not accurately calibrated. Another limitation is the CT setting, which is typically preset and fixed. This may differ from center to center and cause issues with different attenuation correction and standardized uptake values. Furthermore, the lack of proper standardized protocols for PET/CT studies is still an issue. Some centers use diluted oral contrast agents in PET/CT studies, and the way they are used is arbitrary. Many studies showed that the contrast agent may affect PET/CT quantification studies by factors of up to 103%. Therefore, a complete history of the patient’s former medical and radiological procedures should be available. Another subjective issue is selection of the hypoxia cutoff, which seems to differ between many PET studies due to the use of different comparison modalities. This adds more complexity and consequently results in complications in retrospective studies.
A possible solution for addressing this problem is to establish a standard protocol which outlines the technical approach and specifies the gold standard for PET comparisons. Hiring qualified technologists can help minimize the risk of errors during PET imaging. It is important to note that studies investigating the same hypothesis should ideally use the same PET imager and dose calibrator. However, if different PET imagers are used, then the studies should be reregistered and normalized before any comparative analysis takes place.

4.2. Tumor Perfusion Versus Uptake

Does a higher level of blood perfusion result in enhanced delivery of drugs or radiotracers? Well, the answer is not simple and depends on the specific radiotracer being used and the surrounding tissues, including the endothelial. Tumor blood flow and hypoxia significantly influence the calculation of standardized uptake values (SUVs) in positron emission tomography (PET) imaging, particularly when assessing tumor metabolism and response to therapies. The chaotic microcirculation within tumors, characterized by irregular blood vessel formation and increased capillary transit time heterogeneity (CTH) [200,201], complicates the relationship between blood flow and the extraction of oxygen and glucose. Elevated CTH can lead to ineffective oxygen extraction, as some blood flows too quickly through capillaries, preventing adequate diffusion of oxygen and nutrients into tumor cells [202]. This results in a state of hypoxia, which is often associated with aggressive tumor behavior and resistance to treatment [11]. Interestingly, while antiangiogenic therapies aim to normalize tumor vasculature and improve oxygenation, studies have shown mixed results; some reported improved tumor oxygenation [201,203], whereas others indicated that these therapies can exacerbate hypoxia. The variability in tumor blood flow (TBF) [19] and oxygen extraction fraction [204] further complicates SUV calculations, as the SUV is influenced by the availability of the radiotracer, which is affected by both blood flow and the tumor’s metabolic state. Therefore, understanding the interplay between tumor blood flow, hypoxia, and SUVs is crucial for accurately interpreting PET imaging results and optimizing therapeutic strategies.
Many theoretical models of hypoxia did not show the full relationship between tumor vasculature and tissue oxygenation [35,200,201,202,203]. It is imperative to understand this complex relationship, as it creates a need to pre-delineate the area where hypoxia is predicted to avoid any overlap between malignant and non-malignant hypoxia. One way to achieve this is by using hybrid modalities for the delineation and localization of tumors to correlate them with hypoxia. However, these innovative methods may face challenges when it comes to the tumor microenvironment.
Many publications suggest that the tumor microenvironment plays a significant role in drug and radiotracer delivery, as well as drug resistance [10,11,205]. The microenvironment of a solid tumor is highly diverse, consisting of varied numbers of cells and phenotypes, and it has an organ-like structure which differs according to the genotype, location, and stage of the tumor. These factors, among others, can impact the delivery of drugs or radiotracers, causing heterogeneity in tumor uptake [26,170]. The sensitivity of constituent cells to different drugs may vary based on the three-dimensional structure of the solid tumor. This may be due to the physics of blood–tissue interactions. For instance, fluid kinematics cause the blood passing through capillaries to experience different types of forces which can alter the microenvironment. Mathematical models can help us study this relationship extensively to understand the bio-behavior of hypoxia radiotracers. Therefore, considering blood dynamics while designing mathematical models may also be beneficial [26,170,206,207].

5. Limitations and Future Perspective

Despite the growing utility of PET imaging in hypoxia detection, several limitations must be acknowledged. One major challenge is the variability in tracer uptake, which can be influenced by factors such as blood flow heterogeneity, tumor microenvironment dynamics, and radiotracer pharmacokinetics. The spatial resolution of PET, though adequate for many clinical applications, is still limited when assessing hypoxia at a microscopic level, particularly in tumors with highly heterogeneous oxygenation. Additionally, the reliance on indirect hypoxia biomarkers, such as nitroimidazole-based tracers, introduces potential confounders, as their accumulation can be affected by factors beyond hypoxia, including redox status and cellular metabolism. Standardization of imaging protocols remains a critical issue, as differences in acquisition parameters, quantification methods (SUV, TBR, and HF), and patient-specific physiological variations can impact reproducibility and inter-study comparisons.
To address these challenges, future advancements in PET imaging should focus on improving the spatial resolution and sensitivity through novel detector technologies and improved reconstruction algorithms. Hybrid imaging modalities, such as PET/MRI, offer a promising avenue by combining PET’s functional imaging capabilities with MRI’s superior soft-tissue contrast and oxygenation quantification. The development of next-generation hypoxia tracers with enhanced specificity, faster clearance, and improved target-to-background ratios is also essential. Additionally, artificial intelligence (AI) and machine learning algorithms could play a pivotal role in optimizing image analysis, automating tumor segmentation, and enhancing quantitative hypoxia assessment. The integration of PET with molecular and genetic profiling may also enable a more comprehensive understanding of tumor hypoxia, paving the way for personalized treatment strategies. Ultimately, continued research and technical advancements will be key to refining PET-based hypoxia imaging and expanding its clinical applications in oncology and beyond.

6. Conclusions

The ability to accurately detect and quantify tumor hypoxia is critical for optimizing cancer treatment strategies. Improved hypoxia imaging can play a pivotal role in the selection of chemotherapeutic agents which effectively target hypoxic tumor cells, as well as enhancing the effectiveness of radiation therapy, which relies on oxygen availability for maximum therapeutic impact. A key consideration in hypoxia imaging is the distinction between acute and chronic hypoxia. While acute hypoxia can arise from transient changes in blood flow, chronic hypoxia is more relevant to tumor progression and treatment resistance. The focus of imaging should therefore be directed toward chronic hypoxia, which is associated with sustained metabolic and genetic adaptations that contribute to therapeutic resistance. Biomarkers associated with hypoxia, such as HIF-1α, provide valuable insight into these adaptations and should be considered in hypoxia-targeted imaging and treatment planning.
To further enhance the accuracy and clinical applicability of hypoxia PET imaging, standardization of imaging protocols and mathematical modeling are essential. Current challenges include variability in tracer kinetics, differences in PET acquisition and analysis methods, and the need for robust hypoxia thresholds. Addressing these challenges requires international standardization efforts (e.g., the image biomarker standardization initiative), and this should be thoroughly discussed in conferences, training workshops, and continuous updates in nuclear medicine research. Collaborative efforts between oncologists, radiopharmacists, and imaging specialists will be necessary to refine PET imaging techniques and expand their role in personalized cancer therapy.
Moving forward, the integration of advanced imaging modalities, improved radiotracers, and AI-based analytical tools will be key to overcoming the current limitations in hypoxia imaging. These advancements will not only enhance the diagnostic accuracy but also support precision medicine approaches, ultimately leading to better patient outcomes in lung cancer and other malignancies.

Author Contributions

Conceptualization, A.A. (Ahmad Alenezi); methodology, A.A. (Ahmad Alenezi) and H.A.; software, A.A. (Ahmad Alenezi); validation, A.A. (Ahmad Alenezi) and H.A.; formal analysis, A.A. (Ahmad Alenezi); investigation, A.A. (Ahmad Alenezi), A.A. (Aishah Alenezi), and M.U.K.; resources A.A. (Ahmad Alenezi), A.A. (Aishah Alenezi), and M.U.K.; writing—original draft preparation, A.A. (Ahmad Alenezi), A.A. (Aishah Alenezi), and M.U.K.; writing—review and editing, A.A. (Ahmad Alenezi) and M.U.K.; visualization, A.A. (Ahmad Alenezi); supervision, A.A. (Ahmad Alenezi); funding acquisition, A.A. (Ahmad Alenezi). All authors have read and agreed to the published version of the manuscript.

Funding

This research received no external funding.

Data Availability Statement

Not applicable.

Acknowledgments

We express our sincere gratitude to Laila Ghadenfer for her support during this research.

Conflicts of Interest

The authors declare no conflicts of interest.

Abbreviations

The following abbreviations are used in this manuscript:
LCLung cancer
NSCLCNon-small cell lung cancer

References

  1. National Cancer Institute. Lung and Bronchus Cancer; Cancer Stat Facts. Available online: https://seer.cancer.gov/statfacts/html/lungb.html (accessed on 14 April 2024).
  2. Nicholson, A.G.; Tsao, M.S.; Beasley, M.B.; Borczuk, A.C.; Brambilla, E.; Cooper, W.A.; Dacic, S.; Jain, D.; Kerr, K.M.; Lantuejoul, S.; et al. The 2021 WHO classification of lung tumors: Impact of advances since 2015. J. Thorac. Oncol. 2022, 17, 362–387. [Google Scholar] [CrossRef] [PubMed]
  3. Ekinci, M.; Magne, T.M.; Alencar, L.M.R.; Fechine, P.B.A.; Santos-Oliveira, R.; Ilem-Özdemir, D. Molecular imaging for lung cancer: Exploring small molecules, peptides, and beyond in radiolabeled diagnostics. Pharmaceutics 2024, 16, 404. [Google Scholar] [CrossRef] [PubMed]
  4. Oprea-Lager, D.E.; MacLennan, S.; Bjartell, A.; Briganti, A.; Burger, I.A.; de Jong, I.; De Santis, M.; Eberlein, U.; Emmett, L.; Fizazi, K.; et al. European association of nuclear medicine focus 5: Consensus on molecular imaging and theranostics in prostate cancer. Eur. Urol. 2024, 85, 49–60. [Google Scholar] [CrossRef] [PubMed]
  5. Hanahan, D. Hallmarks of cancer: New dimensions. Cancer Discov. 2022, 12, 31–46. [Google Scholar] [CrossRef]
  6. Hanahan, D.; Weinberg, R.A. The hallmarks of cancer. Cell 2000, 100, 57–70. [Google Scholar] [CrossRef]
  7. Hanahan, D.; Weinberg, R.A. Hallmarks of cancer: The next generation. Cell 2011, 144, 646–674. [Google Scholar] [CrossRef]
  8. Voigt, W. Advanced PET imaging in oncology: Status and developments with current and future relevance to lung cancer care. Curr. Opin. Oncol. 2018, 30, 77–83. [Google Scholar] [CrossRef]
  9. Uusijärvi, H.; Bernhardt, P.; Ericsson, T.; Forssell-Aronsson, E. Dosimetric characterization of radionuclides for systemic tumor therapy: Influence of particle range, photon emission, and subcellular distribution. Med. Phys. 2006, 33, 3260–3269. [Google Scholar] [CrossRef]
  10. Kopecka, J.; Salaroglio, I.C.; Perez-Ruiz, E.; Sarmento-Ribeiro, A.B.; Saponara, S.; De Las Rivas, J.; Riganti, C. Hypoxia as a driver of resistance to immunotherapy. Drug Resist. Updat. 2021, 59, 100787. [Google Scholar] [CrossRef]
  11. Beckers, C.; Pruschy, M.; Vetrugno, I. Tumor hypoxia and radiotherapy: A major driver of resistance even for novel radiotherapy modalities. Semin. Cancer Biol. 2024, 98, 19–30. [Google Scholar] [CrossRef]
  12. Hopewell, J.W.; Trott, K.R. Volume effects in radiobiology as applied to radiotherapy. Radiother. Oncol. 2000, 56, 283–288. [Google Scholar] [CrossRef] [PubMed]
  13. Grimes, D.R.; Warren, D.R.; Warren, S. Hypoxia imaging and radiotherapy: Bridging the resolution gap. Br. J. Radiol. 2017, 90, 20160939. [Google Scholar] [CrossRef] [PubMed]
  14. Ferreira, S.; Dutreix, M. DNA repair inhibitors to enhance radiotherapy: Progresses and limitations. Cancer Radiother. 2019, 23, 883–890. [Google Scholar] [CrossRef] [PubMed]
  15. Piert, M.; Machulla, H.-J.; Picchio, M.; Reischl, G.; Ziegler, S.; Kumar, P.; Wester, H.-J.; Beck, R.; McEwan, A.J.B.; I Wiebe, L.; et al. Hypoxia-Specific Tumor Imaging with 18F-Fluoroazomycin Arabinoside. J. Nucl. Med. 2005, 46, 106–113. [Google Scholar]
  16. Eschmann, S.M.; Paulsen, F.; Bedeshem, C.; Machulla, H.J.; Hehr, T.; Bamberg, M.; Bares, R. Hypoxia-imaging with 18F-misonidazole and PET: Changes of kinetics during radiotherapy of head-and-neck cancer. Radiother. Oncol. 2007, 83, 406–410. [Google Scholar] [CrossRef]
  17. Löck, S.; Linge, A.; Seidlitz, A.; Bandurska-Luque, A.; Nowak, A.; Gudziol, V.; Buchholz, F.; Aust, D.E.; Baretton, G.B.; Zöphel, K.; et al. Repeat FMISO-PET imaging weakly correlates with hypoxia-associated gene expressions for locally advanced HNSCC treated by primary radiochemotherapy. Radiother. Oncol. 2019, 135, 43–50. [Google Scholar] [CrossRef]
  18. Dierckx, R.A.; Van de Wiele, C. FDG uptake, a surrogate of tumour hypoxia? Eur. J. Nucl. Med. Mol. Imaging 2008, 35, 1544–1549. [Google Scholar] [CrossRef]
  19. Yip, C.; Blower, P.J.; Goh, V.; Landau, D.B.; Cook, G.J.R. Molecular imaging of hypoxia in non-small-cell lung cancer. Eur. J. Nucl. Med. Mol. Imaging 2015, 42, 956–976. [Google Scholar] [CrossRef]
  20. Kim, J.W.; Gao, P.; Dang, C.V. Effects of hypoxia on tumor metabolism. Cancer Metastasis Rev. 2007, 26, 291–298. [Google Scholar] [CrossRef]
  21. Takahashi, N.; Fujibayashi, Y.; Yonekura, Y.; Welch, M.J.; Waki, A.; Tsuchida, T.; Sadato, N.; Sugimoto, K.; Itoh, H. Evaluation of 62Cu labeled diacetyl-bis(N4-methylthiosemicarbazone) as a hypoxic tissue tracer in patients with lung cancer. Ann. Nucl. Med. 2000, 14, 323–328. [Google Scholar] [CrossRef]
  22. Kinoshita, T.; Fujii, H.; Hayashi, Y.; Kamiyama, I.; Ohtsuka, T.; Asamura, H. Prognostic significance of hypoxic PET using 18F-FAZA and 62Cu-ATSM in non-small-cell lung cancer. Lung Cancer 2016, 91, 56–66. [Google Scholar] [CrossRef] [PubMed]
  23. Zhou, S.; Sun, J.; Zhu, W.; Yang, Z.; Wang, P.; Zeng, Y. Hypoxia studies in non-small cell lung cancer: Pathogenesis and clinical implications (Review). Oncol. Rep. 2025, 53, 29. [Google Scholar] [CrossRef] [PubMed]
  24. Challapalli, A.; Carroll, L.; Aboagye, E.O. Molecular mechanisms of hypoxia in cancer. Clin. Transl. Imaging 2017, 5, 225–253. [Google Scholar] [CrossRef] [PubMed]
  25. Cardenas-Navia, L.I.; Richardson, R.A.; Dewhirst, M.W. Targeting the molecular effects of a hypoxic tumor microenvironment. Front. Biosci. 2007, 12, 4061–4078. [Google Scholar] [CrossRef]
  26. Arneth, B. Tumor microenvironment. Medicina 2019, 56, 15. [Google Scholar] [CrossRef]
  27. Bernier, J.; Hall, E.J.; Giaccia, A. Radiation oncology: A century of achievements. Nat. Rev. Cancer 2004, 4, 737–747. [Google Scholar] [CrossRef]
  28. Read, J. The “oxygen effect” in radiation biology and radiotherapy. Australas. Radiol. 1959, 3, 115–119. [Google Scholar] [CrossRef]
  29. Bertout, J.A.; Patel, S.A.; Simon, M.C. The impact of O2 availability on human cancer. Nat. Rev. Cancer 2008, 8, 967–975. [Google Scholar] [CrossRef]
  30. Thomlinson, R.H.; Gray, L.H. The histological structure of some human lung cancers and the possible implications for radiotherapy. Br. J. Cancer 1955, 9, 539–549. [Google Scholar] [CrossRef]
  31. Jing, X.; Yang, F.; Shao, C.; Wei, K.; Xie, M.; Shen, H.; Shu, Y. Role of hypoxia in cancer therapy by regulating the tumor microenvironment. Mol. Cancer 2019, 18, 157. [Google Scholar] [CrossRef]
  32. Begg, K.; Tavassoli, M. Inside the hypoxic tumour: Reprogramming of the DDR and radioresistance. Cell Death Discov. 2020, 6, 77. [Google Scholar] [CrossRef] [PubMed]
  33. Bristow, R.G.; Hill, R.P. Hypoxia and metabolism. Hypoxia, DNA repair and genetic instability. Nat. Rev. Cancer 2008, 8, 180–192. [Google Scholar] [CrossRef] [PubMed]
  34. Siemann, D.W.; Horsman, M.R. Modulation of the tumor vasculature and oxygenation to improve therapy. Pharmacol. Ther. 2015, 153, 107–124. [Google Scholar] [CrossRef] [PubMed]
  35. Höckel, M.; Vaupel, P. Tumor hypoxia: Definitions and current clinical, biologic, and molecular aspects. J. Natl. Cancer Inst. 2001, 93, 266–276. [Google Scholar] [CrossRef]
  36. Lasalle, C.; Onwuka, O.; Saddemi, J.; Aydogmus, F.S.A.; Ramsey, D.J. A comparison of symptoms at diagnosis in sequential neovascular age-related macular degeneration. Investig. Ophthalmol. Vis. Sci. 2022, 63, 3759–F0180. [Google Scholar]
  37. Carlin, S.; Zhang, H.; Reese, M.; Ramos, N.N.; Chen, Q.; Ricketts, S.A. A comparison of the imaging characteristics and microregional distribution of 4 hypoxia PET tracers. J. Nucl. Med. 2014, 55, 515–521. [Google Scholar] [CrossRef]
  38. Lee, S.Y.; Ju, M.K.; Jeon, H.M.; Lee, Y.J.; Kim, C.H.; Park, H.G.; Han, S.I.; Kang, H.S. Oncogenic metabolism acts as a prerequisite step for induction of cancer metastasis and cancer stem cell phenotype. Oxid. Med. Cell. Longev. 2018, 2018, 1027453. [Google Scholar] [CrossRef]
  39. Monge-Cadet, J.; Moyal, E.; Supiot, S.; Guimas, V. DNA repair inhibitors and radiotherapy. Cancer Radiother. 2022, 26, 947–954. [Google Scholar] [CrossRef]
  40. Evans, C.E. Hypoxia-inducible factor signaling in inflammatory lung injury and repair. Cells 2022, 11, 183. [Google Scholar] [CrossRef]
  41. Wu, Q.; You, L.; Nepovimova, E.; Heger, Z.; Wu, W.; Kuca, K.; Adam, V. Hypoxia-inducible factors: Master regulators of hypoxic tumor immune escape. J. Hematol. Oncol. 2022, 15, 77. [Google Scholar] [CrossRef]
  42. Chapman, J.D. Measurement of tumor hypoxia by invasive and non-invasive procedures: A review of recent clinical studies. Radiother. Oncol. 1991, 20 (Suppl. S1), 13–19. [Google Scholar] [CrossRef] [PubMed]
  43. Sørensen, B.S.; Horsman, M.R. Tumor hypoxia: Impact on radiation therapy and molecular pathways. Front. Oncol. 2020, 10, 562. [Google Scholar] [CrossRef]
  44. Sun, X.; Niu, G.; Chan, N.; Shen, B.; Chen, X. Tumor hypoxia imaging. Mol. Imaging Biol. 2011, 13, 399–410. [Google Scholar] [CrossRef] [PubMed]
  45. Li, Z.; Chu, T. Recent advances on radionuclide labeled hypoxia-imaging agents. Curr. Pharm. Des. 2012, 18, 1084–1097. [Google Scholar] [CrossRef]
  46. Ueda, M.; Kudo, T.; Mutou, Y.; Umeda, I.O.; Miyano, A.; Ogawa, K.; Ono, M.; Fujii, H.; Kizaka-Kondoh, S.; Hiraoka, M.; et al. Evaluation of [125I]IPOS as a molecular imaging probe for hypoxia-inducible factor-1-active regions in a tumor: Comparison among single-photon emission computed tomography/X-ray computed tomography imaging, autoradiography, and immunohistochemistry. Cancer Sci. 2011, 102, 2090–2096. [Google Scholar] [CrossRef]
  47. Lin, X.; Tan, X.; Wu, F.; Yu, Q. A novel tumor hypoxia imaging agent: [99mTc]Tc(CO)3-CPA-2-NIM. Curr. Radiopharm. 2023, 16, 300–307. [Google Scholar] [CrossRef]
  48. Chitneni, S.K.; Palmer, G.M.; Zalutsky, M.R.; Dewhirst, M.W. Molecular imaging of hypoxia. J. Nucl. Med. 2011, 52, 165–168. [Google Scholar] [CrossRef]
  49. Dubois, L.; Landuyt, W.; Cloetens, L.; Bol, A.; Bormans, G.; Haustermans, K.; Labar, D.; Nuyts, J.; Grégoire, V.; Mortelmans, L. [18F]EF3 is not superior to [18F]FMISO for PET-based hypoxia evaluation as measured in a rat rhabdomyosarcoma tumour model. Eur. J. Nucl. Med. Mol. Imaging 2009, 36, 209–218. [Google Scholar] [CrossRef]
  50. Ollinger, J.M.; Fessler, J.A. Positron-emission tomography. IEEE Signal Process Mag. 1997, 14, 43–55. [Google Scholar] [CrossRef]
  51. Mokoala, K.M.G.; Sathekge, M.M. Non-FDG hypoxia tracers. Semin. Nucl. Med. 2024, 54, 827–844. [Google Scholar] [CrossRef]
  52. Bekaert, L.; Valable, S.; Lechapt-Zalcman, E.; Ponte, K.; Collet, S.; Constans, J.M.; Levallet, G.; Bordji, K.; Petit, E.; Branger, P.; et al. [18F]-FMISO PET study of hypoxia in gliomas before surgery: Correlation with molecular markers of hypoxia and angiogenesis. Eur. J. Nucl. Med. Mol. Imaging 2017, 44, 1383–1392. [Google Scholar] [CrossRef] [PubMed]
  53. Bruehlmeier, M.; Roelcke, U.; Schubiger, P.A.; Ametamey, S.M. Assessment of hypoxia and perfusion in human brain tumors using PET with 18F-Fluoromisonidazole and 15O-H2O. J. Nucl. Med. 2004, 45, 1851–1859. [Google Scholar] [PubMed]
  54. Hirata, K.; Yamaguchi, S.; Shiga, T.; Kuge, Y.; Tamaki, N. The roles of hypoxia imaging using 18F-fluoromisonidazole positron emission tomography in glioma treatment. J. Clin. Med. 2019, 8, 1088. [Google Scholar] [CrossRef] [PubMed]
  55. dos Santos, S.N.; Wuest, M.; Jans, H.-S.; Woodfield, J.; Nario, A.P.; Krys, D.; Dufour, J.; Glubrecht, D.; Bergman, C.; Bernardes, E.S.; et al. Comparison of three 18F-labeled 2-nitroimidazoles for imaging hypoxia in breast cancer xenografts: [18F]FBNA, [18F]FAZA and [18F]FMISO. Nucl. Med. Biol. 2023, 124–125, 108383. [Google Scholar] [CrossRef]
  56. Cheng, J.; Lei, L.; Xu, J.; Sun, Y.; Zhang, Y.; Wang, X.; Pan, L.; Shao, Z.; Zhang, Y.; Liu, G. 18F-Fluoromisonidazole PET/CT: A Potential Tool for Predicting Primary Endocrine Therapy Resistance in Breast Cancer. J. Nucl. Med. 2013, 333, 54. [Google Scholar]
  57. Thorwarth, D.; Welz, S.; Mönnich, D.; Pfannenberg, C.; Nikolaou, K.; Reimold, M.; La Fougère, C.; Reischl, G.; Mauz, P.S.; Paulsen, F.; et al. Prospective evaluation of a tumor control probability model based on dynamic 18F-FMISO PET for head and neck cancer radiotherapy. J. Nucl. Med. 2019, 60, 1698–1704. [Google Scholar] [CrossRef]
  58. Watanabe, S.; Inoue, T.; Okamoto, S.; Magota, K.; Takayanagi, A.; Sakakibara-Konishi, J.; Katoh, N.; Hirata, K.; Manabe, O.; Toyonaga, T.; et al. Combination of FDG-PET and FMISO-PET as a treatment strategy for patients undergoing early-stage NSCLC stereotactic radiotherapy. EJNMMI Res. 2019, 9, 104. [Google Scholar] [CrossRef]
  59. Troost, E.G.C.; Laverman, P.; Philippens, M.E.P.; Lok, J.; van der Kogel, A.J.; Oyen, W.J.G.; Boerman, O.C.; Kaanders, J.H.A.M.; Bussink, J. Correlation of [18F]FMISO autoradiography and pimonodazole immunohistochemistry in human head and neck carcinoma xenografts. Eur. J. Nucl. Med. Mol. Imaging 2008, 35, 1803–1811. [Google Scholar] [CrossRef]
  60. Martin, G.V.; Caldwell, J.H.; Graham, M.M.; Grierson, J.R.; Kroll, K.; Cowan, M.J.; Lewellen, T.K.; Rasey, J.S.; Casciari, J.J.; Krohn, K.A. Noninvasive detection of hypoxic myocardium using fluorine-18-fluoromisonidazole and positron emission tomography. J. Nucl. Med. 1992, 33, 2202–2208. [Google Scholar]
  61. Bittner, M.I.; Wiedenmann, N.; Bucher, S.; Hentschel, M.; Mix, M.; Rücker, G.; Weber, W.A.; Meyer, P.T.; Werner, M.; Grosu, A.L.; et al. Analysis of relation between hypoxia PET imaging and tissue-based biomarkers during head and neck radiochemotherapy. Acta Oncol. 2016, 55, 1299–1304. [Google Scholar] [CrossRef]
  62. Norikane, T.; Yamamoto, Y.; Maeda, Y.; Kudomi, N.; Matsunaga, T.; Haba, R.; Iwasaki, A.; Hoshikawa, H.; Nishiyama, Y. Correlation of 18F-fluoromisonidazole PET findings with HIF-1α and p53 expressions in head and neck cancer: Comparison with. Nucl. Med. Commun. 2014, 18, 30–35. [Google Scholar] [CrossRef]
  63. Tachibana, I.; Nishimura, Y.; Hanaoka, K.; Inada, M.; Fukuda, K.; Tatebe, H.; Ishikawa, K.; Nakamatsu, K.; Kanamori, S.; Hosono, M. Tumor hypoxia detected by 18F-fluoromisonidazole Positron Emission Tomography (FMISO PET) as a prognostic indicator of radiotherapy (RT). Anticancer Res. 2018, 38, 1775–1781. [Google Scholar] [CrossRef] [PubMed]
  64. Zschaeck, S.; Haase, R.; Abolmaali, N.; Perrin, R.; Stützer, K.; Appold, S.; Steinbach, J.; Kotzerke, J.; Zips, D.; Richter, C.; et al. Spatial distribution of FMISO in head and neck squamous cell carcinomas during radio-chemotherapy and its correlation to pattern of failure. Acta Oncol. 2015, 54, 1355–1363. [Google Scholar] [CrossRef] [PubMed]
  65. Liu, M.; Ma, N.; Ren, C.; Song, S.; Wu, K.; Sun, Y.; Mao, J.; Cheng, J. Hypoxia predicts favorable response to carbon ion radiotherapy in non-small cell lung cancer (NSCLC) defined by 18F-FMISO positron emission tomography/computed tomography (PET/CT) imaging. Quant. Imaging Med. Surg. 2024, 14, 3489–3500. [Google Scholar] [CrossRef]
  66. Gagel, B.; Reinartz, P.; Demirel, C.; Kaiser, H.J.; Zimny, M.; Piroth, M.; Pinkawa, M.; Stanzel, S.; Asadpour, B.; Hamacher, K.; et al. [18F]fluoromisonidazole and [18F]fluorodeoxyglucose positron emission tomography in response evaluation after chemo-/radiotherapy of non-small-cell lung cancer: A feasibility study. BMC Cancer 2006, 6, 51. [Google Scholar] [CrossRef]
  67. Couturier, O.; Luxen, A.; Chatal, J.-F.; Vuillez, J.-P.; Rigo, P.; Hustinx, R. Fluorinated tracers for imaging cancer with positron emission tomography. Eur. J. Nucl. Med. Mol. Imaging 2004, 31, 1182–1206. [Google Scholar] [CrossRef]
  68. Yuan, H.; Palmer, G.M.; Dewhirst, M.W. Imaging hypoxia. In Molecular Imaging: Principles and Practice; Elsevier: Amsterdam, The Netherlands, 2021; pp. 869–895. [Google Scholar] [CrossRef]
  69. Thureau, S.; Piton, N.; Gouel, P.; Modzelewski, R.; Dujon, A.; Baste, J.M.; Melki, J.; Rinieri, P.; Peillon, C.; Rastelli, O.; et al. First comparison between [18F]-FMISO and [18F]-Faza for preoperative pet imaging of hypoxia in lung cancer. Cancers 2021, 13, 4101. [Google Scholar] [CrossRef]
  70. Yang, D.J.; Wallace, S.; Cherif, A.; Li, C.; Gretzer, M.B.; Kim, E.E.; Podoloff, D.A. Development of F-18-labeled fluoroerythronitroimidazole as a PET agent for imaging tumor hypoxia. Radiology 1995, 194, 795–800. [Google Scholar] [CrossRef]
  71. Grönroos, T.; Bentzen, L.; Marjamäki, P.; Murata, R.; Horsman, M.R.; Keiding, S.; Eskola, O.; Haaparanta, M.; Minn, H.; Solin, O. Comparison of the biodistribution of two hypoxia markers [18F]FETNIM and [18F]FMISO in an experimental mammary carcinoma. Eur. J. Nucl. Med. Mol. Imaging 2004, 31, 513–520. [Google Scholar] [CrossRef]
  72. Hu, M.; Kong, L.; Zhao, S.Q.; Yang, G.R.; Yang, W.F.; Han, A.Q.; Fu, Z.; Ma, L.; Zheng, J.S.; Yu, J.M. Value of 18F-FETNIM PET-CT for detection of tumor hypoxia in non-small-cell lung cancer. Zhonghua Zhong Liu Za Zhi 2010, 32, 463–466. [Google Scholar]
  73. Wei, Y.; Zhao, W.; Huang, Y.; Yu, Q.; Zhu, S.; Wang, S.; Zhao, S.; Hu, X.; Yu, J.; Yuan, S. A comparative study of noninvasive hypoxia imaging with 18F-Fluoroerythronitroimidazole and 18F-Fluoromisonidazole PET/CT in patients with lung cancer. PLoS ONE 2016, 11, e0157606. [Google Scholar] [CrossRef]
  74. Wei, S.; Lin, H.; Shi, C.; Xiong, W.; Chen, C.C.; Huang, S.; Press, R.H.; Hasan, S.; Chhabra, A.M.; Choi, J.I.; et al. Use of single-energy proton pencil beam scanning Bragg peak for intensity-modulated proton therapy FLASH treatment planning in liver-hypofractionated radiation therapy. Med. Phys. 2022, 49, 6560–6574. [Google Scholar] [CrossRef] [PubMed]
  75. Kapoor, V.; McCook, B.M.; Torok, F.S. An introduction to PET-CT imaging. RadioGraphics 2004, 24, 523–543. [Google Scholar] [CrossRef] [PubMed]
  76. Telo, S.; Calderoni, L.; Vichi, S.; Zagni, F.; Castellucci, P.; Fanti, S. Alternative and new radiopharmaceutical agents for lung cancer. Curr. Radiopharm. 2020, 13, 185–194. [Google Scholar] [CrossRef] [PubMed]
  77. Verhagen, A.F.T.; Bootsma, G.P.; Tjan-Heijnen, V.C.G.; van der Wilt, G.J.; Cox, A.L.; Brouwer, M.H.; Corstens, F.H.; Oyen, W.J. FDG-PET in staging lung cancer: How does it change the algorithm? Lung Cancer 2004, 44, 175–181. [Google Scholar] [CrossRef]
  78. Cuaron, J.; Dunphy, M.; Rimner, A. Role of FDG-PET scans in staging, response assessment, and follow-up care for non-small cell lung cancer. Front. Oncol. 2012, 2, 208. [Google Scholar] [CrossRef]
  79. Park, J.; Kang, S.K.; Hwang, D.; Choi, H.; Ha, S.; Seo, J.M.; Eo, J.S.; Lee, J.S. Automatic lung cancer segmentation in [18F]FDG PET/CT using a two-stage deep learning approach. Nucl. Med. Mol. Imaging 2023, 57, 86–93. [Google Scholar] [CrossRef]
  80. Clavo, A.C.; Brown, R.S.; Wahl, R.L. Fluorodeoxyglucose uptake in human cancer cell lines is increased by hypoxia. J. Nucl. Med. 1995, 36, 1625–1632. [Google Scholar]
  81. Zhao, S.; Kuge, Y.; Mochizuki, T.; Takahashi, T.; Nakada, K.; Sato, M.; Takei, T.; Tamaki, N. Biologic correlates of intratumoral heterogeneity in 18F-FDG distribution with regional expression of glucose transporters and hexokinase-II in experimental tumor. J. Nucl. Med. 2005, 46, 675–682. [Google Scholar]
  82. Van Laere, K.; Koole, M.; Lemahieu, I.; Dierckx, R. Image filtering in single-photon emission computed tomography: Principles and applications. Comput. Med. Imaging Graph. 2001, 25, 127–133. [Google Scholar] [CrossRef]
  83. Lopci, E.; Grassi, I.; Chiti, A.; Nanni, C.; Cicoria, G.; Toschi, L.; Fonti, C.; Lodi, F.; Mattioli, S.; Fanti, S. Review Article PET Radiopharmaceuticals for Imaging of Tumor Hypoxia: A Review of the Evidence. Am. J. Nucl. Med. Mol. Imaging. 2014, 4, 365–384. [Google Scholar] [PubMed] [PubMed Central]
  84. Zimny, M.; Gagel, B.; DiMartino, E.; Hamacher, K.; Coenen, H.H.; Westhofen, M.; Eble, M.; Buell, U.; Reinartz, P. FDG—A marker of tumour hypoxia? A comparison with [18F]fluoromisonidazole and pO2-polarography in metastatic head and neck cancer. Eur. J. Nucl. Med. Mol. Imaging 2006, 33, 1426–1431. [Google Scholar] [CrossRef]
  85. Bury, T.; Corhay, J.L.; Duysinx, B.; Daenen, F.; Ghaye, B.; Barthelemy, N.; Rigo, P.; Bartsch, P. Value of FDG-PET in detecting residual or recurrent nonsmall cell lung cancer. Eur. Respir. J. 1999, 14, 1376–1380. [Google Scholar] [CrossRef]
  86. Machtay, M.; Duan, F.; Siegel, B.A.; Snyder, B.S.; Gorelick, J.J.; Reddin, J.S.; Munden, R.; Johnson, D.W.; Wilf, L.H.; DeNittis, A.; et al. Prediction of survival by [18F]fluorodeoxyglucose positron emission tomography in patients with locally advanced non-small-cell lung cancer undergoing definitive chemoradiation therapy: Results of the ACRIN 6668/RTOG 0235 trial. J. Clin. Oncol. 2013, 31, 3823–3830. [Google Scholar] [CrossRef]
  87. Vera, P.; Mezzani-Saillard, S.; Edet-Sanson, A.; Ménard, J.F.; Modzelewski, R.; Thureau, S.; Meyer, M.E.; Jalali, K.; Bardet, S.; Lerouge, D.; et al. FDG PET during radiochemotherapy is predictive of outcome at 1 year in non-small-cell lung cancer patients: A prospective multicentre study (RTEP2). Eur. J. Nucl. Med. Mol. Imaging 2014, 41, 1057–1065. [Google Scholar] [CrossRef]
  88. Derlin, T.; Grünwald, V.; Steinbach, J.; Wester, H.J.; Ross, T.L. Molecular imaging in oncology using positron emission tomography. Dtsch. Ärztebl. Int. 2018, 115, 175–181. [Google Scholar] [CrossRef]
  89. Rivera, M.P.; Mehta, A.C.; Wahidi, M.M. Establishing the diagnosis of lung cancer: Diagnosis and management of lung cancer, 3rd ed: American College of Chest Physicians evidence-based clinical practice guidelines. Chest 2013, 143, e142S–e165S. [Google Scholar] [CrossRef]
  90. Cegla, P.; Bos-Liedke, A.; Burchardt, E.; Konstanty, E.; Piotrowski, A.; Kozak, M.; Cholewinski, W. Diagnosis and treatment of lung cancer using nuclear medicine techniques—Current state of the art. Nucl. Med. Rev. Cent. East. Eur. 2023, 26, 77–84. [Google Scholar] [CrossRef]
  91. Paez, R.; Shah, C.; Cords, A.J.; Muterspaugh, A.; Helton, J.E.; Antic, S.; Eisenberg, R.; Chen, H.; Grogan, E.L.; Manning, H.C.; et al. 18F-FSPG PET imaging for the evaluation of indeterminate pulmonary nodules. PLoS ONE 2022, 17, e0265427. [Google Scholar] [CrossRef]
  92. Lo, M.; Wang, Y.-Z.; Gout, P.W. The x cystine/glutamate antiporter: A potential target for therapy of cancer and other diseases. J. Cell Physiol. 2008, 215, 593–602. [Google Scholar] [CrossRef]
  93. Park, S.Y.; Mosci, C.; Kumar, M.; Wardak, M.; Koglin, N.; Bullich, S.; Mueller, A.; Berndt, M.; Stephens, A.W.; Chin, F.T.; et al. Initial evaluation of (4S)-4-(3-[18F]fluoropropyl)-l-glutamate (FSPG) PET/CT imaging in patients with head and neck cancer, colorectal cancer, or non-Hodgkin lymphoma. EJNMMI Res. 2020, 10, 100. [Google Scholar] [CrossRef]
  94. Baek, S.; Choi, C.-M.; Ahn, S.H.; Lee, J.W.; Gong, G.; Ryu, J.-S.; Oh, S.J.; Bacher-Stier, C.; Fels, L.; Koglin, N.; et al. Exploratory clinical trial of (4S)-4-(3-[18F]fluoropropyl)-l-glutamate for imaging xC transporter using positron emission tomography in patients with non–small cell lung or breast cancer. Clin. Cancer Res. 2012, 18, 5427–5437. [Google Scholar] [CrossRef]
  95. Park, S.Y.; Na, S.J.; Kumar, M.; Mosci, C.; Wardak, M.; Koglin, N.; Bullich, S.; Mueller, A.; Berndt, M.; Stephens, A.W.; et al. Clinical evaluation of (4S)-4-(3-[18F]fluoropropyl)-L-glutamate (18F-FSPG) for PET/CT imaging in patients with newly diagnosed and recurrent prostate cancer. Clin. Cancer Res. 2020, 26, 5380–5387. [Google Scholar] [CrossRef]
  96. Mittra, E.S.; Koglin, N.; Mosci, C.; Kumar, M.; Hoehne, A.; Keu, K.V.; Iagaru, A.H.; Mueller, A.; Berndt, M.; Bullich, S.; et al. Pilot preclinical and clinical evaluation of (4S)-4-(3-[18F]fluoropropyl)-L-glutamate (18F-FSPG) for PET/CT imaging of intracranial malignancies. PLoS ONE 2016, 11, e0148628. [Google Scholar] [CrossRef]
  97. Kavanaugh, G.; Williams, J.; Morris, A.S.; Nickels, M.L.; Walker, R.; Koglin, N.; Stephens, A.W.; Washington, M.K.; Geevarghese, S.K.; Liu, Q.; et al. Utility of [18F]FSPG PET to image hepatocellular carcinoma: First clinical evaluation in a US population. Mol. Imaging Biol. 2016, 18, 924–934. [Google Scholar] [CrossRef]
  98. Sharkey, A.R.; Koglin, N.; Mittra, E.S.; Han, S.; Cook, G.J.R.; Witney, T.H. Clinical [18F]FSPG positron emission tomography Imaging Reveals Heterogeneity in Tumor-Associated System xc− activity. Cancers 2024, 16, 1437. [Google Scholar] [CrossRef]
  99. Chae, S.Y.; Choi, C.-M.; Shim, T.S.; Park, Y.; Park, C.-S.; Lee, H.S.; Lee, S.J.; Oh, S.J.; Kim, S.-Y.; Baek, S.; et al. Exploratory Clinical Investigation of (4S)-4-(3-18F-Fluoropropyl)-L-Glutamate PET of Inflammatory and Infectious Lesions. J. Nucl. Med. 2016, 57, 67–69. [Google Scholar] [CrossRef]
  100. Krarup, M.M.K.; Fischer, B.M.; Christensen, T.N. New PET tracers: Current knowledge and perspectives in lung cancer. Semin. Nucl. Med. 2022, 52, 781–796. [Google Scholar] [CrossRef]
  101. Kairemo, K.; Santos, E.B.; Macapinlac, H.A.; Subbiah, V. Early Response Assessment to Targeted Therapy Using 3′-deoxy-3′[18F]-Fluorothymidine (18F-FLT) PET/CT in Lung Cancer. Diagnostics 2020, 10, 26. [Google Scholar] [CrossRef]
  102. Rasey, J.S.; Grierson, J.R.; Wiens, L.W.; Kolb, P.D.; Schwartz, J.L. Validation of FLT uptake as a measure of thymidine Kinase-1 activity in A549 carcinoma cells. J. Nucl. Med. 2002, 43, 1210–1217. [Google Scholar]
  103. Vera, P.; Bohn, P.; Edet-Sanson, A.; Salles, A.; Hapdey, S.; Gardin, I.; Ménard, J.F.; Modzelewski, R.; Thiberville, L.; Dubray, B. Siultaneous positron emission tomography (PET) assessment of metabolism with 18F-fluoro-2-deoxy-d-glucose (FDG), proliferation with 18F-fluoro-thymidine (FLT), and hypoxia with ¹⁸fluoro-misonidazole (F-miso) before and during radiotherapy in patients with non-small-cell lung cancer (NSCLC): A pilot study. Radiother. Oncol. 2011, 98, 109–116. [Google Scholar] [CrossRef]
  104. Alwadani, B.; Dall’Angelo, S.; Fleming, I.N. Clinical value of 3′-deoxy-3′-[18F]fluorothymidine-positron emission tomography for diagnosis, staging and assessing therapy response in lung cancer. Insights Imaging 2021, 12, 90. [Google Scholar] [CrossRef]
  105. Buck, A.K.; Schirrmeister, H.; Hetzel, M.; von der Heide, M.; Halter, G.; Glatting, G.; Mattfeldt, T.; Liewald, F.; Reske, S.N.; Neumaier, B. 3-Deoxy-3-[18F]Fluorothymidine-Positron Emission Tomography for Noninvasive Assessment of Proliferation in Pulmonary Nodules. Cancer Res. 2002, 62, 3331–3334. Available online: https://aacrjournals.org/cancerres/article-pdf/62/12/3331/2495004/ch1202003331.pdf (accessed on 19 January 2025).
  106. Trigonis, I.; Koh, P.K.; Taylor, B.; Tamal, M.; Ryder, D.; Earl, M.; Anton-Rodriguez, J.; Haslett, K.; Young, H.; Faivre-Finn, C.; et al. Early reduction in tumour [18F]fluorothymidine (FLT) uptake in patients with non-small cell lung cancer (NSCLC) treated with radiotherapy alone. Eur. J. Nucl. Med. Mol. Imaging 2014, 41, 682–693. [Google Scholar] [CrossRef]
  107. Allen, M.D.; Luong, P.; Hudson, C.; Leyton, J.; Delage, B.; Ghazaly, E.; Cutts, R.; Yuan, M.; Syed, N.; Lo Nigro, C.; et al. Prognostic and therapeutic impact of argininosuccinate synthetase 1 control in bladder cancer as monitored longitudinally by PET imaging. Cancer Res. 2014, 74, 896–907. [Google Scholar] [CrossRef]
  108. Huang, Y.; Fan, J.; Li, Y.; Fu, S.; Chen, Y.; Wu, J. Imaging of tumor hypoxia with radionuclide-labeled tracers for PET. Front. Oncol. 2021, 11, 731503. [Google Scholar] [CrossRef]
  109. Sorger, D.; Patt, M.; Kumar, P.; Wiebe, L.I.; Barthel, H.; Seese, A.; Dannenberg, C.; Tannapfel, A.; Kluge, R.; Sabri, O. [18F]Fluoroazomycinarabinofuranoside (18FAZA) and [18F]Fluoromisonidazole (18FMISO): A comparative study of their selective uptake in hypoxic cells and PET imaging in experimental rat tumors. Nucl. Med. Biol. 2003, 30, 317–326. [Google Scholar] [CrossRef]
  110. Postema, E.J.; McEwan, A.J.B.; Riauka, T.A.; Kumar, P.; Richmond, D.A.; Abrams, D.N.; Wiebe, L.I. Initial results of hypoxia imaging using 1-α-d-(5-deoxy-5-[18F]-fluoroarabinofuranosyl)-2-nitroimidazole (18F-FAZA). Eur. J. Nucl. Med. Mol. Imaging 2009, 36, 1565–1573. [Google Scholar] [CrossRef]
  111. Trinkaus, M.E.; Blum, R.; Rischin, D.; Callahan, J.; Bressel, M.; Segard, T.; Roselt, P.; Eu, P.; Binns, D.; MacManus, M.P.; et al. Imaging of hypoxia with 18F-FAZA PET in patients with locally advanced non-small cell lung cancer treated with definitive chemoradiotherapy. J. Med. Imaging Radiat. Oncol. 2013, 57, 475–481. [Google Scholar] [CrossRef]
  112. Graves, E.E.; Hicks, R.J.; Binns, D.; Bressel, M.; Le, Q.T.; Peters, L.; Young, R.J.; Rischin, D. Quantitative and qualitative analysis of [18F]FDG and [18F]FAZA positron emission tomography of head and neck cancers and associations with HPV status and treatment outcome. Eur. J. Nucl. Med. Mol. Imaging 2016, 43, 617–625. [Google Scholar] [CrossRef]
  113. Mortensen, L.S.; Johansen, J.; Kallehauge, J.; Primdahl, H.; Busk, M.; Lassen, P.; Alsner, J.; Sørensen, B.S.; Toustrup, K.; Jakobsen, S.; et al. FAZA PET/CT hypoxia imaging in patients with squamous cell carcinoma of the head and neck treated with radiotherapy: Results from the DAHANCA 24 trial. Radiother. Oncol. 2012, 105, 14–20. [Google Scholar] [CrossRef]
  114. Saga, T.; Inubushi, M.; Koizumi, M.; Yoshikawa, K.; Zhang, M.R.; Tanimoto, K.; Horiike, A.; Yanagitani, N.; Ohyanagi, F.; Nishio, M. Prognostic value of 18F-fluoroazomycin arabinoside PET/CT in patients with advanced non-small-cell lung cancer. Cancer Sci. 2015, 106, 1554–1560. [Google Scholar] [CrossRef]
  115. Saksø, M.; Mortensen, L.S.; Primdahl, H.; Johansen, J.; Kallehauge, J.; Hansen, C.R.; Overgaard, J. Influence of FAZA PET hypoxia and HPV-status for the outcome of head and neck squamous cell carcinoma (HNSCC) treated with radiotherapy: Long-term results from the DAHANCA 24 trial (NCT01017224). Radiother. Oncol. 2020, 151, 126–133. [Google Scholar] [CrossRef]
  116. Busk, M.; Mortensen, L.S.; Nordsmark, M.; Overgaard, J.; Jakobsen, S.; Hansen, K.V.; Theil, J.; Kallehauge, J.F.; D’Andrea, F.P.; Steiniche, T.; et al. PET hypoxia imaging with FAZA: Reproducibility at baseline and during fractionated radiotherapy in tumour-bearing mice. Eur. J. Nucl. Med. Mol. Imaging 2013, 40, 186–197. [Google Scholar] [CrossRef]
  117. Bollineni, V.R.; Kerner, G.S.M.A.; Pruim, J.; Steenbakkers, R.J.H.M.; Wiegman, E.M.; Koole, M.J.B.; de Groot, E.H.; Willemsen, A.T.M.; Luurtsema, G.; Widder, J.; et al. PET imaging of tumor hypoxia using 18F-fluoroazomycin arabinoside in stage III-IV non-small cell lung cancer patients. J. Nucl. Med. 2013, 54, 1175–1180. [Google Scholar] [CrossRef]
  118. Beck, R.; Röper, B.; Carlsen, J.M.; Huisman, M.C.; Lebschi, J.A.; Andratschke, N.; Picchio, M.; Souvatzoglou, M.; Machulla, H.J.; Piert, M. Pretreatment 18F-FAZA PET predicts success of hypoxia-directed radiochemotherapy using tirapazamine. J. Nucl. Med. 2007, 48, 973–980. [Google Scholar] [CrossRef]
  119. Varia, M.A.; Lee, D.Y.W.; Raleigh, J.A. Oral pimonidazole HCl as tumor hypoxia marker: Report of first clinical use—Pharmacokinetics and tolerance. Int. J. Radiat. Oncol. Biol. Phys. 2009, 75, S539–S540. [Google Scholar] [CrossRef]
  120. Rios-Colon, L.; Kim, S.; Su, Y.; Kumar, D.; Deep, G. Immunofluorescence-based method to assess cancer biomarker in the hypoxic region of the tumor. In Methods in Molecular Biology; Humana Press Incorporated: New York, NY, USA, 2022; Volume 2413, pp. 37–43. [Google Scholar] [CrossRef]
  121. Labiano, S.; Serrano-Mendioroz, I.; Rodriguez-Ruiz, M.E. Assessment of hypoxia by pimonidazole staining following radiotherapy. Methods Cell Biol. 2022, 172, 179–189. [Google Scholar] [CrossRef]
  122. Bussink, J.; Kaanders, J.H.A.M.; Strik, A.M.; Vojnovic, B.; van Der Kogel, A.J. Optical sensor-based oxygen tension measurements correspond with hypoxia marker binding in three human tumor xenograft lines. Radiat. Res. 2000, 154, 547–555. [Google Scholar] [CrossRef]
  123. Verwer, E.E.; Boellaard, R.; Van Der Veldt, A.A.M. Positron emission tomography to assess hypoxia and perfusion in lung cancer. World J. Clin. Oncol. 2014, 5, 824–844. [Google Scholar] [CrossRef]
  124. Halmos, G.B.; Bruine de Bruin, L.; Langendijk, J.A.; van der Laan, B.F.A.M.; Pruim, J.; Steenbakkers, R.J.H.M. Head and neck tumor hypoxia imaging by 18F-Fluoroazomycin-arabinoside (18F-FAZA)-PET: A review. Clin. Nucl. Med. 2014, 39, 44–48. [Google Scholar] [CrossRef] [PubMed]
  125. Mahy, P.; Geets, X.; Lonneux, M.; Levêque, P.; Christian, N.; De Bast, M.; Gillart, J.; Labar, D.; Lee, J.; Grégoire, V. Determination of tumour hypoxia with [18F]EF3 in patients with head and neck tumours: A phase I study to assess the tracer pharmacokinetics, biodistribution and metabolism. Eur. J. Nucl. Med. Mol. Imaging 2008, 35, 1282–1289. [Google Scholar] [CrossRef] [PubMed]
  126. Komar, G.; Seppänen, M.; Eskola, O.; Lindholm, P.; Grönroos, T.J.; Forsback, S.; Sipilä, H.; Evans, S.M.; Solin, O.; Minn, H. 18F-EF5: A new PET tracer for imaging hypoxia in head and neck cancer. J. Nucl. Med. 1944, 49, 1944–1951. [Google Scholar]
  127. Koch, C.J.; Scheuermann, J.S.; Divgi, C.; Judy, K.D.; Kachur, A.V.; Freifelder, R.; Reddin, J.S.; Karp, J.; Stubbs, J.B.; Hahn, S.M.; et al. Biodistribution and dosimetry of 18F-EF5 in cancer patients with preliminary comparison of 18F-EF5 uptake versus EF5 binding in human glioblastoma. Eur. J. Nucl. Med. Mol. Imaging 2010, 37, 2048–2059. [Google Scholar] [CrossRef]
  128. Qian, Y.; Von Eyben, R.; Liu, Y.; Chin, F.T.; Miao, Z.; Apte, S.; Carter, J.N.; Binkley, M.S.; Pollom, E.L.; Harris, J.P.; et al. 18F-EF5 PET-based imageable hypoxia predicts local recurrence in tumors treated with highly conformal radiation therapy. Int. J. Radiat. Oncol. Biol. Phys. 2018, 102, 1183–1192. [Google Scholar] [CrossRef]
  129. Lin, L.L.; Silvoniemi, A.; Stubbs, J.B.; Rengan, R.; Suilamo, S.; Solin, O.; Divgi, C.; Eskola, O.; Sorger, J.M.; Stabin, M.G.; et al. Radiation dosimetry and biodistribution of the hypoxia tracer 18F-EF5 in oncologic patients. Cancer Biother. Radiopharm. 2012, 27, 412–419. [Google Scholar] [CrossRef]
  130. Novruzov, E.; Mori, Y.; Antke, C.; Dabir, M.; Schmitt, D.; Kratochwil, C.; Koerber, S.A.; Haberkorn, U.; Giesel, F.L. A role of non-FDG tracers in lung cancer? Semin. Nucl. Med. 2022, 52, 720–733. [Google Scholar] [CrossRef]
  131. Dubois, L.J.; Lieuwes, N.G.; Janssen, M.H.M.; Peeters, W.J.M.; Windhorst, A.D.; Walsh, J.C.; Kolb, H.C.; Ollers, M.C.; Bussink, J.; van Dongen, G.A.M.S.; et al. Preclinical evaluation and validation of [18F]HX4,a promising hypoxia marker for imaging. Proc. Natl. Acad. Sci. USA 2011, 108, 14620–14625. [Google Scholar] [CrossRef]
  132. van Loon, J.; Janssen, M.H.M.; Öllers, M.; Aerts, H.J.W.L.; Dubois, L.; Hochstenbag, M.; Dingemans, A.M.C.; Lalisang, R.; Brans, B.; Windhorst, B.; et al. PET imaging of hypoxia using [18F]HX4: A phase I trial. Eur. J. Nucl. Med. Mol. Imaging 2010, 37, 1663–1668. [Google Scholar] [CrossRef]
  133. Sanduleanu, S.; Wiel, A.M.A.V.; Lieverse, R.I.Y.; Marcus, D.; Ibrahim, A.; Primakov, S.; Wu, G.; Theys, J.; Yaromina, A.; Dubois, L.J.; et al. Hypoxia PET Imaging with [18F]-HX4-A Promising Next-Generation Tracer. Cancers 2020, 12, 1322. [Google Scholar] [CrossRef]
  134. Ureba, A.; Lindblom, E.; Dasu, A.; Uhrdin, J.; Even, A.J.G.; van Elmpt, W.; Lambin, P.; Wersäll, P.; Toma-Dasu, I. Non-linear conversion of HX4 uptake for automatic segmentation of hypoxic volumes and dose prescription. Acta Oncol. 2018, 57, 485–490. [Google Scholar] [CrossRef] [PubMed]
  135. van Elmpt, W.; Zegers, C.M.L.; Reymen, B.; Even, A.J.G.; Dingemans, A.C.; Oellers, M.; Wildberger, J.E.; Mottaghy, F.M.; Das, M.; Troost, E.G.C.; et al. Multiparametric imaging of patient and tumour heterogeneity in non-small-cell lung cancer: Quantification of tumour hypoxia, metabolism and perfusion. Eur. J. Nucl. Med. Mol. Imaging 2016, 43, 240–248. [Google Scholar] [CrossRef] [PubMed]
  136. Zegers, C.M.L.; van Elmpt, W.; Wierts, R.; Reymen, B.; Sharifi, H.; Öllers, M.C.; Hoebers, F.; Troost, E.G.C.; Wanders, R.; van Baardwijk, A.; et al. Hypoxia imaging with [18F]HX4 PET in NSCLC patients: Defining optimal imaging parameters. Radiother. Oncol. 2013, 109, 58–64. [Google Scholar] [CrossRef]
  137. Zegers, C.M.L.; van Elmpt, W.; Reymen, B.; Even, A.J.G.; Troost, E.G.C.; Ollers, M.C.; Hoebers, F.J.P.; Houben, R.M.A.; Eriksson, J.; Windhorst, A.D.; et al. In vivo quantification of hypoxic and metabolic status of NSCLC tumors using [18F]HX4 and [18F]FDG-PET/CT imaging. Clin. Cancer Res. 2014, 20, 6389–6397. [Google Scholar] [CrossRef] [PubMed]
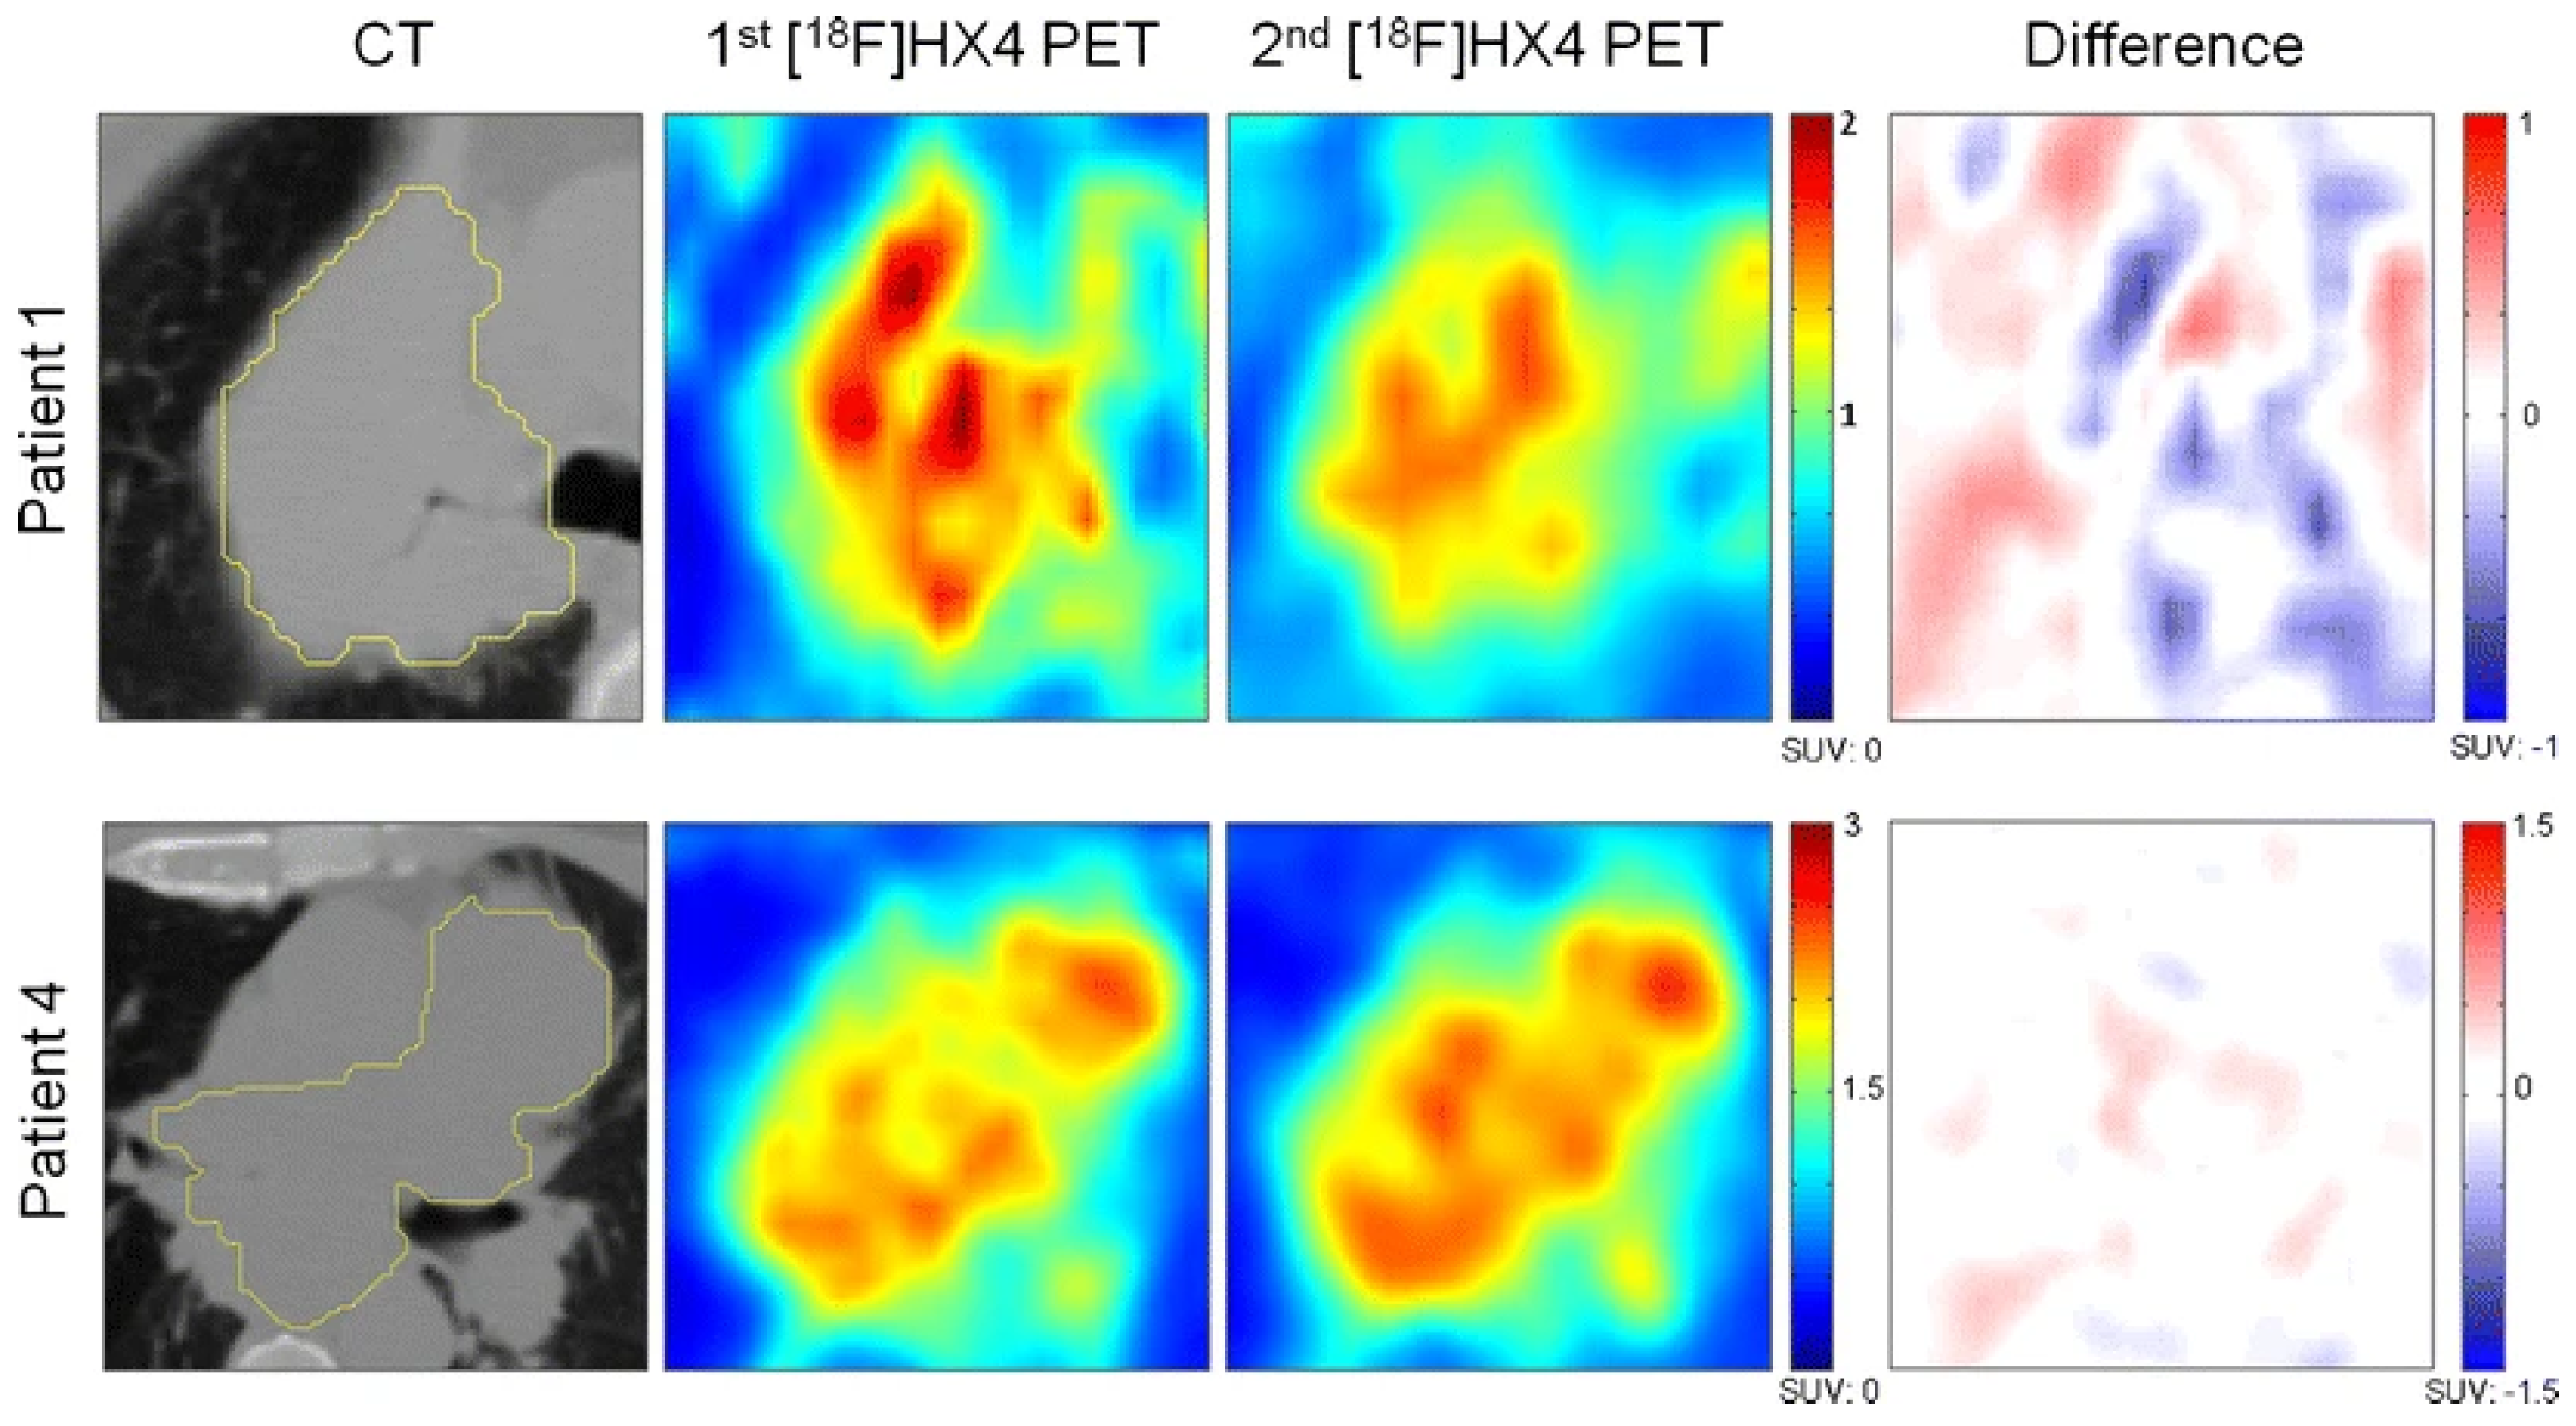
  138. Zegers, C.M.L.; van Elmpt, W.; Szardenings, K.; Kolb, H.; Waxman, A.; Subramaniam, R.M.; Moon, D.H.; Brunetti, J.C.; Srinivas, S.M.; Lambin, P.; et al. Repeatability of hypoxia PET imaging using [18F]HX4 in lung and head and neck cancer patients: A prospective multicenter trial. Eur. J. Nucl. Med. Mol. Imaging 2015, 42, 1840–1849. [Google Scholar] [CrossRef]
  139. Perez, R.C.; Kim, D.; Maxwell, A.W.P.; Camacho, J.C. Functional imaging of hypoxia: PET and MRI. Cancers 2023, 15, 3336. [Google Scholar] [CrossRef]
  140. Dearling, J.L.J.; Packard, A.B. Some thoughts on the mechanism of cellular trapping of Cu(II)-ATSM. Nucl. Med. Biol. 2010, 37, 237–243. [Google Scholar] [CrossRef]
  141. Lowe, V.J.; DeLong, D.M.; Hoffman, J.M.; Coleman, R.E. Optimum scanning protocol for FDG-PET evaluation of pulmonary malignancy. J. Nucl. Med. 1995, 36, 883–887. [Google Scholar]
  142. Folkman, J. Angiogenesis in cancer, vascular, rheumatoid and other disease. Nat. Med. 1995, 1, 27–31. [Google Scholar] [CrossRef]
  143. Pan, Y.; Yu, Y.; Wang, X.; Zhang, T. Tumor-associated macrophages in tumor immunity. Front. Immunol. 2020, 11, 583084. [Google Scholar] [CrossRef]
  144. Holland, J.P.; Lewis, J.S.; Dehdashti, F. Assessing Tumor Hypoxia by Positron Emission Tomography with Cu-ATSM. Q. J. Nucl. Med. Mol. Imaging 2009, 53, 193–200. [Google Scholar]
  145. Yoshii, Y.; Matsumoto, H.; Yoshimoto, M.; Furukawa, T.; Morokoshi, Y.; Sogawa, C.; Zhang, M.R.; Wakizaka, H.; Yoshii, H.; Fujibayashi, Y.; et al. Controlled administration of penicillamine reduces radiation exposure in critical organs during64Cu-ATSM internal radiotherapy: A novel strategy for liver protection. PLoS ONE 2014, 9, e86996. [Google Scholar] [CrossRef]
  146. Wong, T.Z.; Lacy, J.L.; Petry, N.A.; Hawk, T.C.; Sporn, T.A.; Dewhirst, M.W.; Vlahovic, G. PET of hypoxia and perfusion with 62Cu-ATSM and 62Cu-PTSM using a 62Zn/62Cu generator. AJR Am. J. Roentgenol. 2008, 190, 427–432. [Google Scholar] [CrossRef]
  147. Firth, G.; Blower, J.E.; Bartnicka, J.J.; Mishra, A.; Michaels, A.M.; Rigby, A.; Darwesh, A.; Al-Salemee, F.; Blower, P.J. Non-invasive radionuclide imaging of trace metal trafficking in health and disease: “PET metallomics”. RSC Chem. Biol. 2022, 3, 495–518. [Google Scholar] [CrossRef]
  148. Bourgeois, M.; Rajerison, H.; Guerard, F.; Mougin-Degraef, M.; Barbet, J.; Michel, N.; Cherel, M.; Faivre-Chauvet, A. Contribution of [164Cu]-ATSM PET in molecular imaging of tumour hypoxia compared to classical [18F]MISO—A selected review. Nucl. Med. Rev. Cent. East. Eur. 2011, 14, 90–95. [Google Scholar] [CrossRef]
  149. Okazawa, H.; Fujibayashi, Y.; Yonekura, Y.; Tamaki, N.; Nishizawa, S.; Magata, Y.; Ishizu, K.; Tsuchida, T.; Sadato, N.; Konishi, J. Clinical application of 62Zn/62Cu positron generator: Perfusion and plasma pool images in normal subjects. Ann. Nucl. Med. 1995, 9, 81–87. [Google Scholar] [CrossRef]
  150. Zhang, T.; Das, S.K.; Fels, D.R.; Hansen, K.S.; Wong, T.Z.; Dewhirst, M.W.; Vlahovic, G. PET with 62Cu-ATSM and 62Cu-PTSM is a useful imaging tool for hypoxia and perfusion in pulmonary lesions. AJR Am. J. Roentgenol. 2013, 201, W698–W706. [Google Scholar] [CrossRef]
  151. Dehdashti, F.; Mintun, M.A.; Lewis, J.S.; Bradley, J.; Govindan, R.; Laforest, R.; Welch, M.J.; Siegel, B.A. In vivo assessment of tumor hypoxia in lung cancer with 60Cu-ATSM. Eur. J. Nucl. Med. Mol. Imaging 2003, 30, 844–850. [Google Scholar] [CrossRef]
  152. Lohith, T.G.; Kudo, T.; Demura, Y.; Umeda, Y.; Kiyono, Y.; Fujibayashi, Y.; Okazawa, H. Pathophysiologic correlation between 62Cu-ATSM and 18F-FDG in lung cancer. J. Nucl. Med. 2009, 50, 1948–1953. [Google Scholar] [CrossRef]
  153. Sun, W.; Falzon, C.; Naimi, E.; Akbari, A.; Wiebe, L.I.; Tandon, M.; Kumar, P. Synthesis of [18F]FAZA using nosyl and iodo precursors for nucleophilic radiofluorination. Curr. Radiopharm. 2019, 12, 49–57. [Google Scholar] [CrossRef]
  154. Sharma, R. Nitroimidazole radiopharmaceuticals in hypoxia: Part II cytotoxicity and radiosensitization applications. Curr. Radiopharm. 2011, 4, 379–393. [Google Scholar] [CrossRef]
  155. Sharma, R. Nitroimidazole radiopharmaceuticals in bioimaging: Part I: Synthesis and imaging applications. Curr. Radiopharm. 2011, 4, 361–378. [Google Scholar] [CrossRef]
  156. Russell, J.; Carlin, S.; Burke, S.A.; Wen, B.; Yang, K.M.; Ling, C.C. Immunohistochemical detection of changes in tumor hypoxia. Int. J. Radiat. Oncol. Biol. Phys. 2009, 73, 1177–1186. [Google Scholar] [CrossRef]
  157. Godet, I.; Doctorman, S.; Wu, F.; Gilkes, D.M. Detection of hypoxia in cancer models: Significance, challenges, and advances. Cells 2022, 11, 686. [Google Scholar] [CrossRef]
  158. Close, D.A.; Johnston, P.A. Detection and impact of hypoxic regions in multicellular tumor spheroid cultures formed by head and neck squamous cell carcinoma cells lines. SLAS Discov. 2022, 27, 39–54. [Google Scholar] [CrossRef]
  159. Corroyer-Dulmont, A.; Valable, S.; Fantin, J.; Chatre, L.; Toutain, J.; Teulier, S.; Bazille, C.; Letissier, E.; Levallet, J.; Divoux, D.; et al. Multimodal evaluation of hypoxia in brain metastases of lung cancer and interest of hypoxia image-guided radiotherapy. Sci. Rep. 2021, 11, 11239. [Google Scholar] [CrossRef]
  160. Rudà, R.; Franchino, F.; Soffietti, R. Treatment of brain metastasis: Current status and future directions. Curr. Opin. Oncol. 2016, 28, 502–510. [Google Scholar] [CrossRef]
  161. Rankin, E.B.; Giaccia, A.J. Hypoxic control of metastasis. Science 2016, 352, 175–180. [Google Scholar] [CrossRef]
  162. Saxena, P.; Gambhir, S.; Dixit, M. Insight into tumor hypoxia: Radionuclide-based biomarker as diagnostic tools. Curr. Top. Med. Chem. 2023, 23, 1136–1154. [Google Scholar] [CrossRef]
  163. Cabral, P.; Cerecetto, H. Radiopharmaceuticals in tumor hypoxia imaging: A review focused on medicinal chemistry aspects. Anti Cancer Agents Med. Chem. 2017, 17, 318–332. [Google Scholar] [CrossRef]
  164. Bonnitcha, P.; Grieve, S.; Figtree, G. Clinical imaging of hypoxia: Current status and future directions. Free Radic. Biol. Med. 2018, 126, 296–312. [Google Scholar] [CrossRef]
  165. Padhani, A.R.; Liu, G.; Koh, D.M.; Chenevert, T.L.; Thoeny, H.C.; Takahara, T.; Dzik-Jurasz, A.; Ross, B.D.; Van Cauteren, M.; Collins, D.; et al. Diffusion-weighted magnetic resonance imaging as a cancer biomarker: Consensus and recommendations. Neoplasia 2009, 11, 102–125. [Google Scholar] [CrossRef]
  166. Juweid, M.E.; Hoekstra, O.S. Positron emission tomography. J. Nucl. Med. 2012, 53, 1002–1003. [Google Scholar] [CrossRef]
  167. Lasne, M.-C.; Perrio, C.; Rouden, J.; Barré, L.; Roeda, D.; Dolle, F.; Crouzel, C. Chemistry of β +-Emitting Compounds Based on Fluorine-18; Springer: Berlin/Heidelberg, Germany, 2002; pp. 201–258. [Google Scholar]
  168. Jødal, L.; Le Loirec, C.; Champion, C. Positron range in PET imaging: Non-conventional isotopes. Phys. Med. Biol. 2014, 59, 7419–7434. [Google Scholar] [CrossRef]
  169. Carter, L.M.; Kesner, A.L.; Pratt, E.C.; Sanders, V.A.; Massicano, A.V.F.; Cutler, C.S.; Lapi, S.E.; Lewis, J.S. The impact of positron range on PET resolution, evaluated with phantoms and PHITS Monte Carlo simulations for conventional and non-conventional radionuclides. Mol. Imaging Biol. 2020, 22, 73–84. [Google Scholar] [CrossRef]
  170. De Palma, M.; Biziato, D.; Petrova, T.V. Microenvironmental regulation of tumour angiogenesis. Nat. Rev. Cancer 2017, 17, 457–474. [Google Scholar] [CrossRef]
  171. Lin, Q.; Choyke, P.L.; Sato, N. Visualizing vasculature and its response to therapy in the tumor microenvironment. Theranostics 2023, 13, 5223–5246. [Google Scholar] [CrossRef]
  172. Ruoslahti, E. Specialization of tumour vasculature. Nat. Rev. Cancer 2002, 2, 83–90. [Google Scholar] [CrossRef]
  173. Goel, S.; Wong, A.H.K.; Jain, R.K. Vascular normalization as a therapeutic strategy for malignant and nonmalignant disease. Cold Spring Harb. Perspect. Med. 2012, 2, a006486. [Google Scholar] [CrossRef]
  174. Rieger, H.; Welter, M. Integrative models of vascular remodeling during tumor growth. Wiley Interdiscip. Rev. Syst. Biol. Med. 2015, 7, 113–129. [Google Scholar] [CrossRef]
  175. Carmeliet, P.; Jain, R.K. Angiogenesis in cancer and other diseases. Nature 2000, 407, 249–257. [Google Scholar] [CrossRef]
  176. Fishman, J.E.; Joseph, P.M.; Floyd, T.F.; Mukherji, B.; Sloviter, H.A. Oxygen-sensitive 19F NMR imaging of the vascular system in vivo. Magn. Reson. Imaging 1987, 5, 279–285. [Google Scholar] [CrossRef]
  177. Jirak, D.; Galisova, A.; Kolouchova, K.; Babuka, D.; Hruby, M. Fluorine polymer probes for magnetic resonance imaging: Quo vadis? Magma 2019, 32, 173–185. [Google Scholar] [CrossRef]
  178. Carmona-Bozo, J.C.; Manavaki, R.; Miller, J.L.; Brodie, C.; Caracò, C.; Woitek, R.; Baxter, G.C.; Graves, M.J.; Fryer, T.D.; Provenzano, E.; et al. PET/MRI of hypoxia and vascular function in ER-positive breast cancer: Correlations with immunohistochemistry. Eur. Radiol. 2023, 33, 6168–6178. [Google Scholar] [CrossRef]
  179. Ohno, Y.; Chen, Q.; Hatabu, H. Oxygen-enhanced magnetic resonance ventilation imaging of lung. Eur. J. Radiol. 2001, 37, 164–171. [Google Scholar] [CrossRef]
  180. Michalski, M.H.; Chen, X. Molecular imaging in cancer treatment. Eur. J. Nucl. Med. Mol. Imaging 2011, 38, 358–377. [Google Scholar] [CrossRef]
  181. Büsing, K.A.; Schönberg, S.O.; Brade, J.; Wasser, K. Impact of blood glucose, diabetes, insulin, and obesity on standardized uptake values in tumors and healthy organs on 18F-FDG PET/CT. Nucl. Med. Biol. 2013, 40, 206–213. [Google Scholar] [CrossRef]
  182. Smith, T.A. FDG uptake, tumour characteristics and response to therapy: A review. Nucl. Med. Commun. 1998, 19, 97–105. [Google Scholar] [CrossRef]
  183. Miwa, K.; Wagatsuma, K.; Iimori, T.; Sawada, K.; Kamiya, T.; Sakurai, M.; Miyaji, N.; Murata, T.; Sato, E. Multicenter study of quantitative PET system harmonization using NIST-traceable 68Ge/68Ga cross-calibration kit. Phys. Med. 2018, 52, 98–103. [Google Scholar] [CrossRef]
  184. Aide, N.; Lasnon, C.; Veit-Haibach, P.; Sera, T.; Sattler, B.; Boellaard, R. EANM/EARL harmonization strategies in PET quantification: From daily practice to multicentre oncological studies. Eur. J. Nucl. Med. Mol. Imaging 2017, 44 (Suppl. S1), 17–31. [Google Scholar] [CrossRef]
  185. Scheuermann, J.S.; Saffer, J.R.; Karp, J.S.; Levering, A.M.; Siegel, B.A. Qualification of PET scanners for use in multicenter cancer clinical trials: The American College of Radiology Imaging Network experience. J. Nucl. Med. 2009, 50, 1187–1193. [Google Scholar] [CrossRef]
  186. Adams, M.C.; Turkington, T.G.; Wilson, J.M.; Wong, T.Z. A systematic review of the factors affecting accuracy of SUV measurements. AJR Am. J. Roentgenol. 2010, 195, 310–320. [Google Scholar] [CrossRef]
  187. Juweid, M.E.; Wiseman, G.A.; Vose, J.M.; Ritchie, J.M.; Menda, Y.; Wooldridge, J.E.; Mottaghy, F.M.; Rohren, E.M.; Blumstein, N.M.; Stolpen, A.; et al. Response assessment of aggressive non-Hodgkin’s lymphoma by integrated international workshop criteria and fluorine-18–fluorodeoxyglucose positron emission tomography. J. Clin. Oncol. 2005, 23, 4652–4661. [Google Scholar] [CrossRef]
  188. Han, H.S.; Escalón, M.P.; Hsiao, B.; Serafini, A.; Lossos, I.S. High incidence of false-positive PET scans in patients with aggressive non-Hodgkin’s lymphoma treated with rituximab-containing regimens. Ann. Oncol. 2009, 20, 309–318. [Google Scholar] [CrossRef]
  189. Kinahan, P.E.; Fletcher, J.W. Positron emission tomography-computed tomography standardized uptake values in clinical practice and assessing response to therapy. Semin. Ultrasound CT MR 2010, 31, 496–505. [Google Scholar] [CrossRef]
  190. Weber, W.A.; Grosu, A.L.; Czernin, J. Technology Insight: Advances in molecular imaging and an appraisal of PET/CT scanning. Nat. Clin. Pract. Oncol. 2008, 5, 160–170. [Google Scholar] [CrossRef]
  191. Yamaguchi, T.; Ueda, O.; Hara, H.; Sakai, H.; Kida, T.; Suzuki, K.; Adachi, S.; Ishii, K. Usefulness of a breath-holding acquisition method in PET/CT for pulmonary lesions. Ann. Nucl. Med. 2009, 23, 65–71. [Google Scholar] [CrossRef]
  192. Cheng, N.M.; Yu, C.T.; Ho, K.C.; Wu, Y.C.; Liu, Y.C.; Wang, C.W.; Yen, T.C. Respiration-averaged CT for attenuation correction in non-small-cell lung cancer. Eur. J. Nucl. Med. Mol. Imaging 2009, 36, 607–615. [Google Scholar] [CrossRef]
  193. Tsai, Y.J.; Liu, C. Pitfalls on PET/CT due to artifacts and instrumentation. Semin. Nucl. Med. 2021, 51, 646–656. [Google Scholar] [CrossRef]
  194. Rahmim, A.; Zaidi, H. Pet versus spect: Strengths, limitations and challenges. Nucl. Med. Commun. 2008, 29, 193–207. [Google Scholar] [CrossRef]
  195. Zeng, Y.; Ma, J.; Zhang, S.; Wu, D. Imaging agents in targeting tumor hypoxia. Curr. Med. Chem. 2016, 23, 1775–1800. [Google Scholar] [CrossRef]
  196. Shi, H.; Wang, Z.; Huang, C.; Gu, X.; Jia, T.; Zhang, A.; Wu, Z.; Zhu, L.; Luo, X.; Zhao, X.; et al. A functional CT contrast agent for in vivo imaging of tumor hypoxia. Small 2016, 12, 3995–4006. [Google Scholar] [CrossRef]
  197. Peng, C.; Zheng, L.; Chen, Q.; Shen, M.; Guo, R.; Wang, H.; Cao, X.; Zhang, G.; Shi, X. Pegylated dendrimer-entrapped gold nanoparticles for in vivo blood pool and tumor imaging by computed tomography. Biomaterials 2012, 33, 1107–1119. [Google Scholar] [CrossRef]
  198. Boellaard, R. Standards for PET image acquisition and quantitative data analysis. J. Nucl. Med. 2009, 50 (Suppl. S1), 11S–20S. [Google Scholar] [CrossRef]
  199. Mawlawi, O.; Kappadath, S.C.; Pan, T.; Rohren, E.; Macapinlac, H. Factors affecting quantification in PET/CT imaging. Curr. Med. Imaging Rev. 2008, 4, 34–45. [Google Scholar] [CrossRef]
  200. Ebbesen, P.; Pettersen, E.O.; Gorr, T.A.; Jobst, G.; Williams, K.; Kieninger, J.; Wenger, R.H.; Pastorekova, S.; Dubois, L.; Lambin, P.; et al. Taking advantage of tumor cell adaptations to hypoxia for developing new tumor markers and treatment strategies. J. Enzyme Inhib. Med. Chem. 2009, 24 (Suppl. S1), 1–39. [Google Scholar] [CrossRef]
  201. Østergaard, L.; Tietze, A.; Nielsen, T.; Drasbek, K.R.; Mouridsen, K.; Jespersen, S.N.; Horsman, M.R. The Relationship between tumor blood flow, angiogenesis, tumor hypoxia, and aerobic glycolysis. Cancer Res. 2013, 73, 5618–5624. [Google Scholar] [CrossRef]
  202. Angleys, H.; Jespersen, S.N.; Østergaard, L. The effects of capillary transit time heterogeneity (CTH) on the cerebral uptake of glucose and glucose analogs: Application to FDG and comparison to oxygen uptake. Front. Comput. Neurosci. 2016, 10, 103. [Google Scholar] [CrossRef]
  203. Sutherland, R.M.; Ausserer, W.A.; Murphy, B.J.; Laderoute, K.R. Tumor hypoxia and heterogeneity: Challenges and opportunities for the future. Semin. Radiat. Oncol. 1996, 6, 59–70. [Google Scholar] [CrossRef]
  204. Johnson, G.B.; Harms, H.J.; Johnson, D.R.; Jacobson, M.S. PET imaging of tumor perfusion: A potential cancer biomarker? Semin. Nucl. Med. 2020, 50, 549–561. [Google Scholar] [CrossRef]
  205. Bao, M.H.R.; Wong, C.C.L. Hypoxia, metabolic reprogramming, and drug resistance in liver cancer. Cells 2021, 10, 1715. [Google Scholar] [CrossRef] [PubMed]
  206. Milotti, E.; Fredrich, T.; Chignola, R.; Rieger, H. Oxygen in the tumor microenvironment: Mathematical and numerical modeling. Adv. Exp. Med. Biol. 2020, 1259, 53–76. [Google Scholar] [CrossRef] [PubMed]
  207. Malossini, A.; Blanzieri, E.; Ng, R.T. Detecting potential labeling errors in microarrays by data perturbation. Bioinformatics 2006, 22, 2114–2121. [Google Scholar] [CrossRef]
Figure 1. Lung cancer can be detected via biomolecular processes used in lung cancer hypoxia imaging.
Pharmaceuticals 18 00459 g001
Figure 2. The mean (approximate) oxygen levels in various tissues (pressure in mmHg and oxygen as a percentage). The information included in this figure was derived from several articles [35,36,37]. 1: Includes human and animal studies. 2: Pressure and percentage of oxygen may vary as they are subject to change due their proximity to major organs. 3: Represent disruption to normal homeostasis at or below which a hypoxic catastrophic cascade of the event may initiate (as shown in Figure 3). 4: At this point, the radiotoxic effect is at half maximal. Also, the hypoxia cutoff is different for different radiotracers.
Pharmaceuticals 18 00459 g002
Figure 3. Illustration of the cascade of events leading to cancer progression during therapeutic interventions. The author assumes hypoxia as a starting point of this catastrophic cascade of illness.
Pharmaceuticals 18 00459 g003
Figure 4. Nitroimidazoles reaction inside hypoxic cells (mechanism of trapping). During the hypoxic conditions, the reactive species (R-NHOH) predominantly form covenant (σ) bonds with intracellular macromolecules and are trapped inside the hypoxic cell.
Pharmaceuticals 18 00459 g004
Figure 6. Uptake of 18F-FETNIM (A) in a squamous carcinoma patient and 18F-FMISO (B) in a small cell lung cancer patient at 2 h post-injection. The arrows indicate the tumor’s location. Reproduced from Wei et al., 2016 under a CC BY license (DOI: 10.1371/journal.pone.0157606) [73].
Pharmaceuticals 18 00459 g006
Figure 7. Subject demonstrated positive 18F-FSPG uptake (FSBG+) (SUVmax 2.02) and negative 18F-FDG uptake (FDG−) (SUVmax 0.7) in PET/CT imaging. Reproduced from Paez et al., 2022 under a CC BY license (DOI: 10.1371/journal.pone.0265427) [91].
Pharmaceuticals 18 00459 g007
Figure 8. Illustration of voxel-wise analysis in lung cancer patients (patients 1 and 4), showing the axial plane of CT scans with gross tumor volumes outlined in yellow alongside the first and second registered [18F]HX4 PET scans and a difference map highlighting variations between the two scans. Reproduced from Zegers et al., 2015 under a CC BY license (DOI: 10.1007/s00259-015-3100-z) [138].
Pharmaceuticals 18 00459 g008
Figure 10. Steps for radiotracer feasibility studies.
Pharmaceuticals 18 00459 g010
Figure 11. Effect of reconstruction on SUVmax and lesion volume (liver lesion, arrow). (A) 2 × 8 OSEM, 128 × 128 matrix, 8-mm filter: ~11-mm resolution, 4.5 mL lesion. (B) 4 × 16 OSEM, 256 × 256 matrix, 5-mm filter: ~7-mm resolution, 1.5 mL lesion. (Image from [198]).
Pharmaceuticals 18 00459 g011
Table 1. This table provides a comprehensive overview of the radiopharmaceuticals specifically utilized for tumor PET hypoxia imaging. It details each compound’s chemical structure, mechanism of uptake, biochemical characteristics (lipophilicity vs. hydrophilicity), and pharmacokinetic and pharmacodynamic profiles.
RadiopharmaceuticalMechanism of UptakeBiochemical Characteristics3D ConformerPharmacokinetics and Pharmacodynamics
18F-Fluoromisonidazole (18F-FMISO)Under hypoxic conditions, FMISO undergoes bioreduction, forming reactive intermediates which bind to intracellular macromolecules, trapping the tracer in hypoxic cells.Moderately lipophilicPharmaceuticals 18 00459 i001
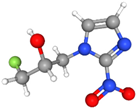
Slow clearance from normoxic tissues, leading to modest tumor-to-background contrast. Primarily excreted via the kidneys and liver.
18F-Fluoroazomycin Arabinoside (18F-FAZA)Reduced in hypoxic cells, leading to covalent binding and retention in hypoxic tissues.More hydrophilic than FMISOPharmaceuticals 18 00459 i002Faster clearance from non-hypoxic tissues than FMISO, improving imaging contrast. Excreted primarily through the renal pathway.
18F-EF3Hypoxia-specific reduction and trapping, resulting in accumulation in hypoxic tumor cells.Moderately lipophilicPharmaceuticals 18 00459 i003
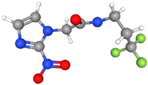
Retained in hypoxic tissues with effective clearance from normoxic areas. Excreted primarily via the renal system.
18F-EF5Bioreduced in hypoxic cells, forming stable adducts retained within hypoxic tumor regions.Moderately lipophilicPharmaceuticals 18 00459 i004
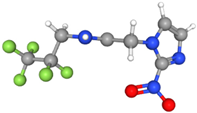
High retention in hypoxic tissues but limited by slow plasma clearance as a result of its lipophilicity. Excreted via the renal system.
18F-FSPG (4-(3-[18F]Fluoropropyl)-l-glutamate)Targets the xC cystine/glutamate antiporter. Upregulated in hypoxic and metabolically active tumor cells.HydrophilicPharmaceuticals 18 00459 i005Rapid blood clearance and renal excretion. Provides specific imaging of metabolic and hypoxic regions.
64Cu-ATSMReduced and trapped within hypoxic cells, selectively accumulating in hypoxic tumor areas.LipophilicPharmaceuticals 18 00459 i006Rapid clearance from blood and high tumor uptake in hypoxic regions. Primarily metabolized in the liver and excreted via the biliary route.
18F-FETNIM (Fluoroerythronitroimidazole)Undergoes bioreduction in hypoxic cells, forming stable adducts retained in hypoxic tissues.HydrophilicPharmaceuticals 18 00459 i007
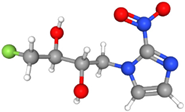
Rapid clearance from normoxic tissues and prolonged retention in hypoxic regions. Primarily excreted via the renal system.
[18F]HX4Similar to FMISO, HX4 is bioreduced in hypoxic cells, resulting in covalent binding and retention in hypoxic regions.More hydrophilic than FMISOPharmaceuticals 18 00459 i008
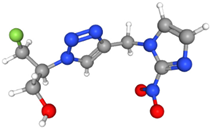
Rapid clearance from normoxic tissues. High retention in hypoxic areas, providing excellent tumor-to-background contrast. Excreted via kidneys.
Table 2. Recommendations to enhance standardized uptake value (SUV) in hypoxia PET imaging.
CategoryKey Points
RecommendationsUse the same scanner and protocols for baseline and follow-up hypoxia PET/CT studies.
Ensure precise calibration of dose calibrators for low-activity tracers.
Adopt standardized postinjection uptake times specific to the hypoxia tracer used.
Correct for respiratory motion in thoracic imaging to improve SUV accuracy.
Document tumor oxygenation context and perfusion characteristics to aid interpretation.
Avoid confounding factors such as recent oxygen supplementation or hyperbaric oxygen therapy.
Provide explicit reporting of region-of-interest (ROI) definitions and imaging protocols for reproducibility.
Disclaimer/Publisher’s Note: The statements, opinions and data contained in all publications are solely those of the individual author(s) and contributor(s) and not of MDPI and/or the editor(s). MDPI and/or the editor(s) disclaim responsibility for any injury to people or property resulting from any ideas, methods, instructions or products referred to in the content.

