
Maximizing Leaves, Inflorescences, and Chemical Composition Production of Moringa oleifera Trees under Calcareous Soil Conditions

 , , ,
, , ,
Abstract
:1. Introduction
2. Results
2.1. Growth Characteristics
2.2. Weight and Yield of Fresh and Dry Leaves
2.3. Inflorescences Parameters
2.4. Yield of Inflorescences
2.5. Total Chlorophyll, Leaf Soluble Protein, and Vitamin C Contents
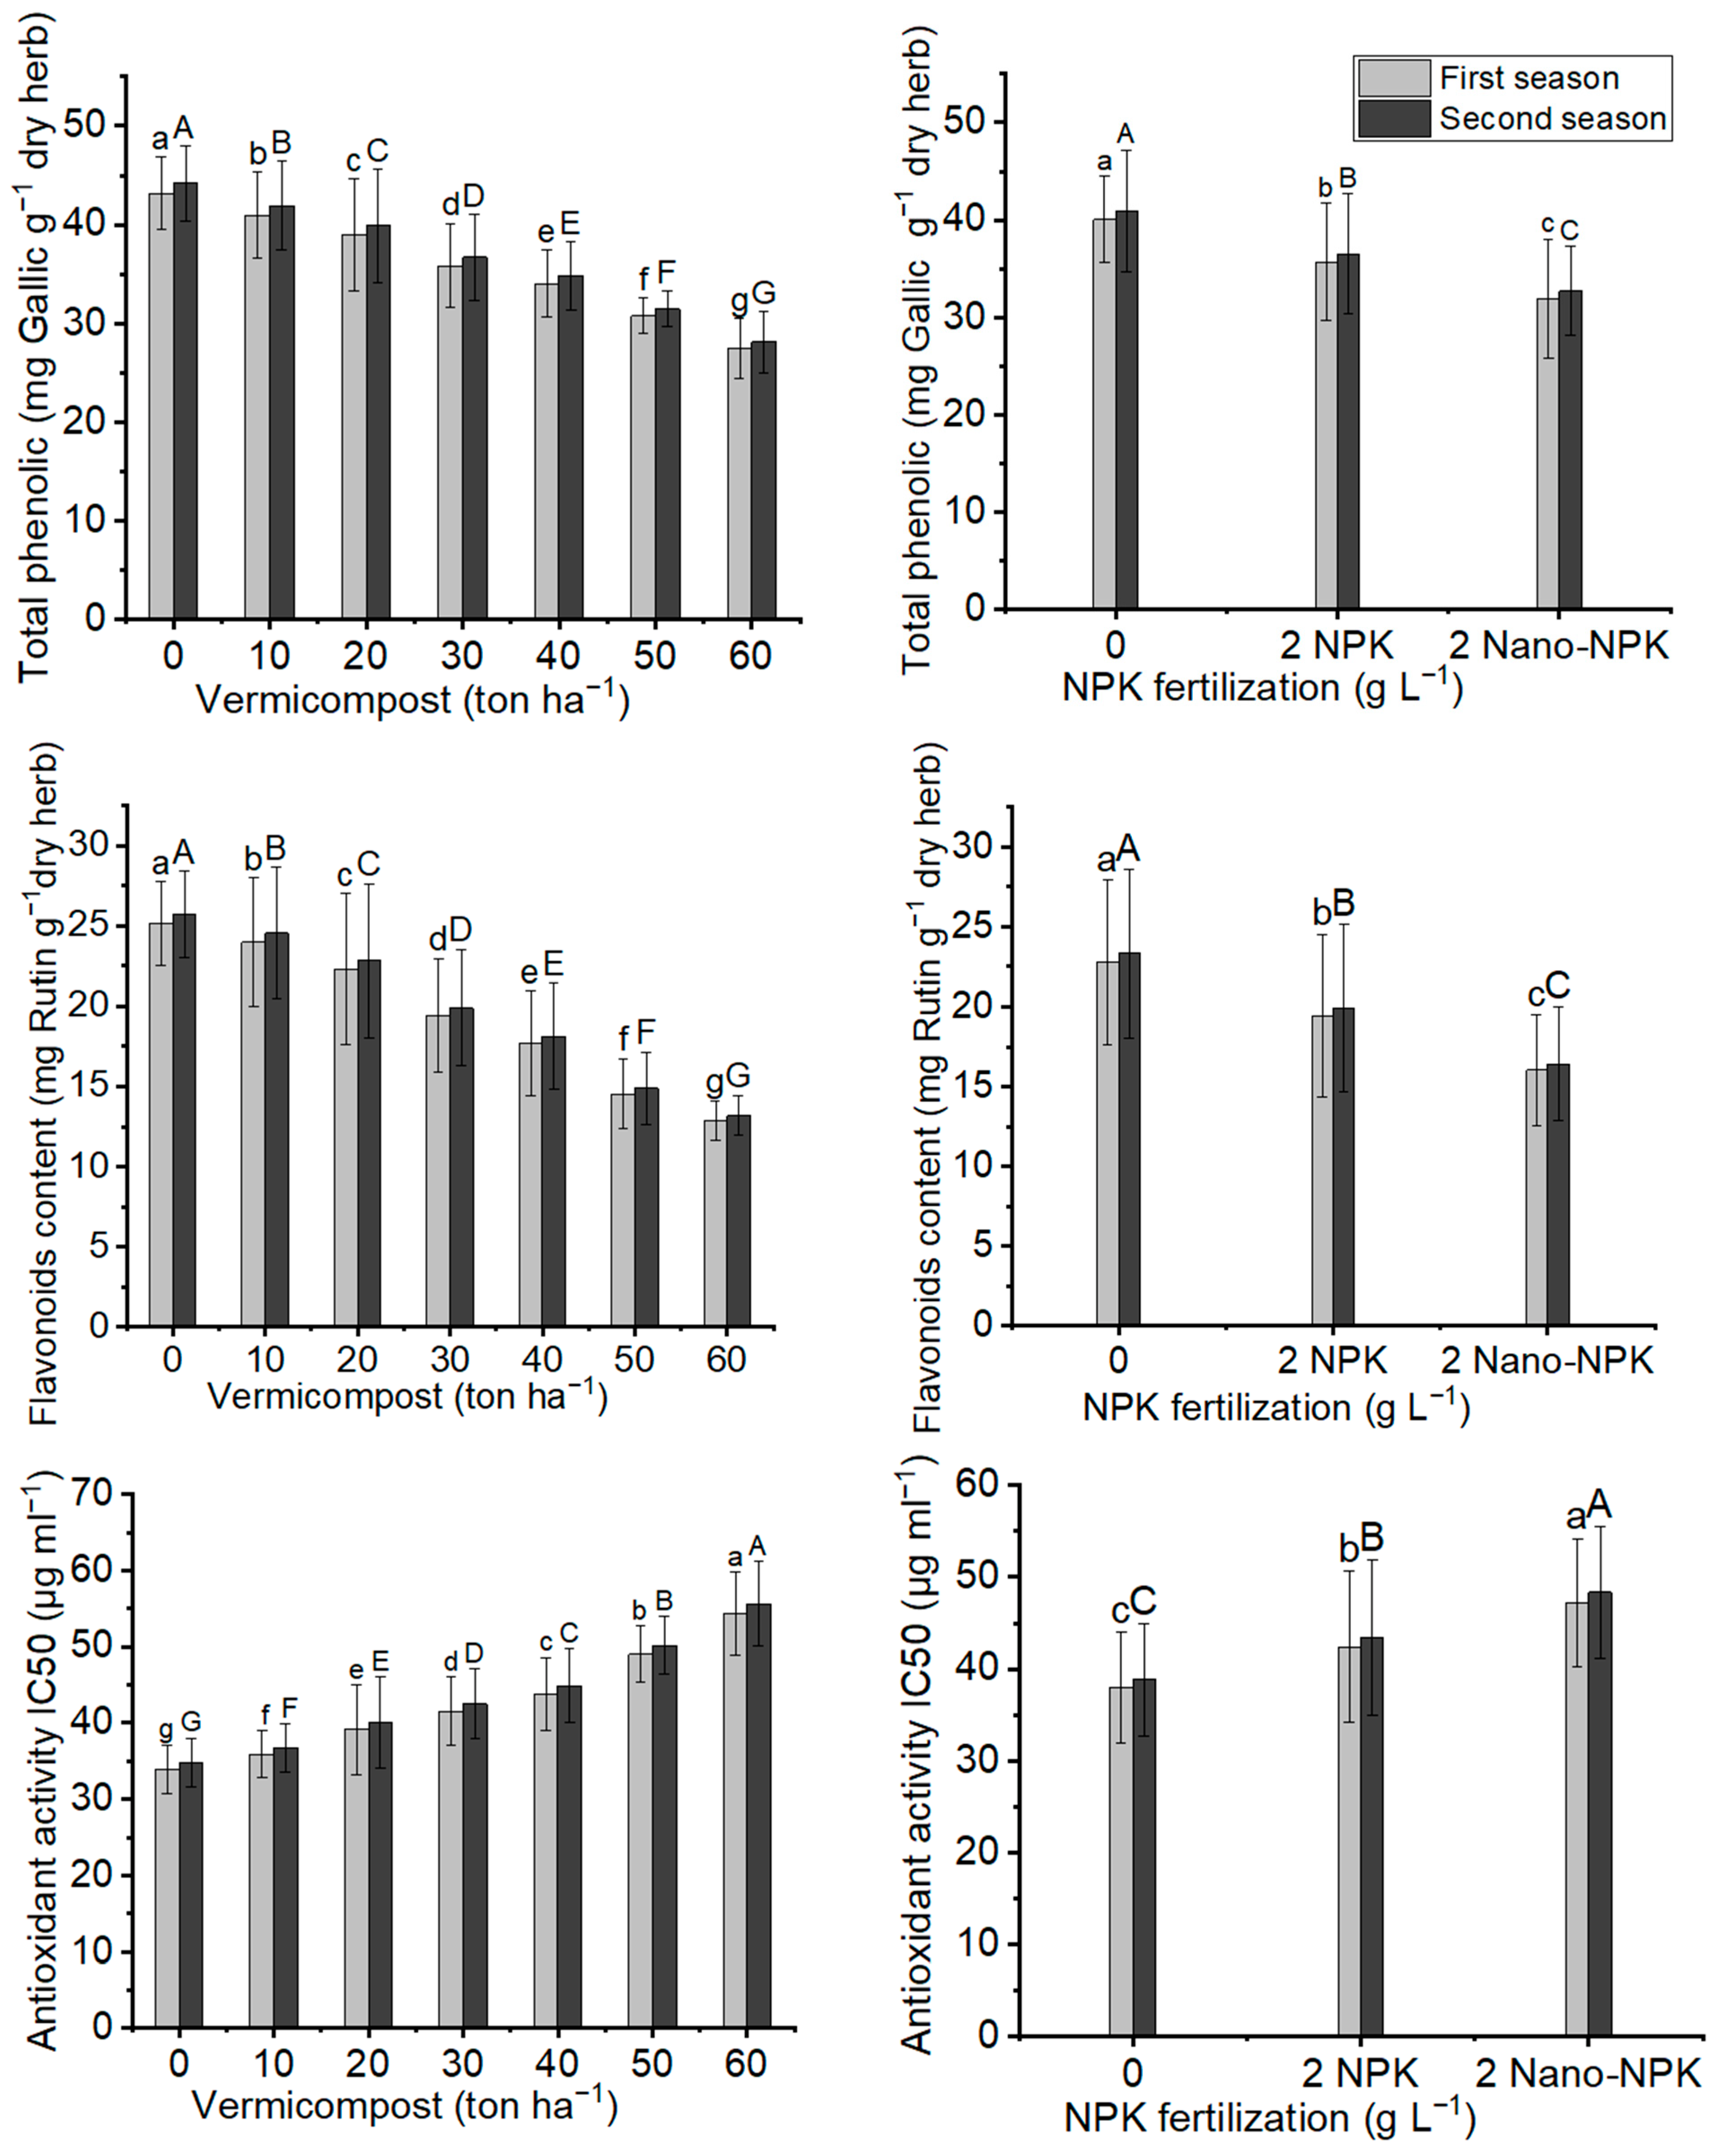
2.6. Total Phenoliccontent, Flavonoid Content and Antioxidant Activity
2.7. Phosphorus and Potassium Contents
3. Discussion
3.1. The Impact of Calcareous Soil on Moringa oleifera Growth Characteristics, Yield, and Chemical Constituents
3.2. Effects of Vermicompost on Moringa oleifera Tree Yield, Growth Parameters, and Its Chemical Components
3.3. Effects of NPK Fertilizer on Moringa oleifera Growth Parameters, Yield, and Chemical Components
3.4. Effects of Vermicompost–NPK Combination Treatments on Moringa oleifera Tree Yield Growth Parameters, and Chemical Components
4. Materials and Methods
4.1. Plant Material
4.2. Treatment
Nano-NPK Preparation
4.3. Data Recorded Each Season
4.3.1. Growth and Flowering Parameters
4.3.2. Total Chlorophyll
4.3.3. Leaf Soluble Protein Content (mg g−1)
4.3.4. Vitamin C (mg g−1 dry weight)
4.3.5. Total Phenolic Content (mg Gallic g−1 dry herb)
4.3.6. Total Flavonoid Content (mg Rutin g−1 dry herb)
4.3.7. Antioxidant Activity Determinations IC50 (µg mL−1)
4.3.8. Phosphorus Percentage (P2O5)
4.3.9. Potassium Percentage (K2O)
4.4. Statistical Analysis
5. Conclusions
Author Contributions
Funding
Institutional Review Board Statement
Informed Consent Statement
Data Availability Statement
Acknowledgments
Conflicts of Interest
References
- Elgabaly, M.M. Reclamation and management of the calcareous soils of Egypt. In FAO Soils Bulletin 21, Calcareous Soils: Report of the FAO/UNDP Regional Seminar on Reclamation and Management of Calcareous Soils; FAO: Rome, Italy, 1973; pp. 123–127. [Google Scholar]
- El-Hady, O.A.; Abo-Sedera, S.A. Conditioning effect of composts and acrylamide hydrogels on a sandy calcareous soil. II-Physico-bio-chemical properties of the soil. Int. J. Agric. Biol. 2006, 8, 876–884. [Google Scholar]
- FAO. FAO Soils Portal: Management of Calcareous Soil. 2016. Available online: http://www.fao.org/soils-portal/soil-management/managementof-some-problem-soils/calcareous-soils/ar/ (accessed on 1 April 2016).
- Aboukila, E.F.; Nassar, I.N.; Rashad, M.; Hafez, M.; Norton, J.B. Reclamation of calcareous soil and improvement of squash growth using brewers’ spent grain and compost. J. Saudi Soc. Agric. Sci. 2018, 17, 390–397. [Google Scholar] [CrossRef] [Green Version]
- Wahba, M.M.; Labib, F.; Zaghloul, A. Management of Calcareous Soils in Arid Region. Int. J. Environ. Pollut. Environ. 2019, 2, 248–258. [Google Scholar]
- Parker, W.F. Influence of inorganic fertilizer on multipurpose trees in tropical regions. J. Propag. Grow Multipurp. Trees 1998, 15, 40–62. [Google Scholar]
- Sadat, M.S.I. Studies on the Effects of Different Levels of Nitrogen, Phosphorous and Potassium on the Growth Yield and Seed Production of Okra (Abelmoschus esculentus L.). Master’s Thesis, Department of Horticulture, Bangladesh Agricultural University, Mymensingh, Bangladesh, 2000. [Google Scholar]
- Yadav, H.; Fatima, R.; Sharma, A.; Mathur, S. Enhancement of applicability of rock phosphate in alkaline soils by organic compost. Appl. Soil Ecol. 2017, 113, 80–85. [Google Scholar] [CrossRef]
- Mortvedt, J.J.; Murphy, L.S.; Follet, R.H. Fertilizer Technology and Application; Meister Publishing: Willoughby, OH, USA, 1999. [Google Scholar]
- DeRosa, M.R.; Monreal, C.; Schnitzer, M.; Walsh, R.; Sultan, Y. Nanotechnology in fertilizers. Nat. Nanotechnol. J. 2010, 5, 91. [Google Scholar] [CrossRef] [PubMed]
- Gohari, A.A.; Noorhosseini Niyaki, S.A. Effects of iron and nitrogen fertilizers on yield and yield components of peanut (Arachis hypogaea L.) in staneh Ashrafiyeh, Iran. Am.-Eurasian J. Agric. Environ. Sci. 2010, 9, 256–262. [Google Scholar]
- Sheykhbaglou, R.; Sedghi, M.; Tajbakhsh Shishevan, M.; SeyedSharifi, R. Effects of Nano-Iron oxide particles on agronomic traits of soybean. Not Sci. Biol. 2010, 2, 112–113. [Google Scholar] [CrossRef] [Green Version]
- Bozorgi, H.R. Effects of foliar spraying with marine plant ascophyll umnodosum extract and Nano-iron chelate fertilizer on fruit yield and several attributes of eggplant (Solanum melongena L.). ARPN J. Agric. Biol. Sci. 2012, 7, 357–362. [Google Scholar]
- Hagagg, L.F.; Mustafa, N.S.; Genaidy, E.A.E.; El-Hady, E.S. Effect of spraying Nano-NPK on growth performance and nutrients status for (Kalamat cv.) olive seedling. Biosci. Res. 2018, 15, 1297–1303. [Google Scholar]
- Bachmana, G.R.; Metzger, J.D. Growth of bedding plants in commercial potting substrate amended with vermicompost. Bioresour. Technol. 2008, 99, 3155–3161. [Google Scholar] [CrossRef] [PubMed]
- Rivera, M.C.; Wright, E.R. Research on vermicompost as plant growth promoter and disease suppressive substrate in Latin America. Dyn. Soil Dyn. Plant 2009, 3, 32–40. [Google Scholar]
- Brown, G.G. How do earthworms affect microfloral and faunal community diversity? Plant Soil. 1995, 170, 209–231. [Google Scholar] [CrossRef]
- Chaoui, H.; Edwards, C.A.; Brickner, M.; Lee, S.; Arancon, N. Suppression of the plant diseases, Pythium (damping off), Rhizoctonia (root rot) and Verticillum (wilt) by vermicomposts. In Proceedings of the Brighton Crop Protection Conference—Pests and Diseases, Brighton, UK, 18–21 November 2002; Volume II (8B-3), pp. 711–716. [Google Scholar]
- Singleton, D.R.; Hendrixb, P.F.; Colemanb, D.C.; Whitmana, W.B. Identification of uncultured bacteria tightly associated with the intestine of the earthworm Lumbricus rubellus (Lumbricidae; Oligochaeta). Soil Biol. Biochem. 2003, 35, 1547–1555. [Google Scholar] [CrossRef]
- Abd El Gayed, M.E.; Attia, E.A. Impact of growing media and compound fertilizer rates on growth and flowering of cocks comb (Celosia argentea) Plants. J. Plant Production. 2018, 9, 895–900. [Google Scholar] [CrossRef]
- Kumar, V.; Singh, K.P. Enriching vermicompost by nitrogen fixing and phosphate solubilizing bacteria. Bioresour. Technol. 2001, 76, 173–175. [Google Scholar] [CrossRef]
- Goldstein, J. Compost suppresses diseases in the lab and fields. Biol. Cycle 1998, 39, 62–64. [Google Scholar]
- Herencia, J.F.; Ruiz-Porras, J.C.; Melero, S.; Garcia-Galavis, P.A.; Morillo, E.; Maqueda, C. Comparison between organic and mineral fertilization for soil fertility levels, crop macronutrient concentrations, and yield. Agron. J. 2007, 99, 973–983. [Google Scholar] [CrossRef]
- Marschner, H. Mineral Nutrition of Higher Plants; Academic Press: London, UK, 1995. [Google Scholar]
- Loeppert, R.H.; Hossner, L.R.; Amin, P.K. Formation of ferric oxyhydroxides from ferrous and ferric perchlorate in stirredcalcareous systems. Soil Sci. Soc. Am. J. 1984, 48, 677–683. [Google Scholar] [CrossRef]
- Tomati, U.; Grapppelli, A.; Galli, E. The hormone-like effect of earthworm casts on plant growth. Biol. Fertil. Soils 1988, 5, 288–294. [Google Scholar] [CrossRef]
- Nagavallemma, K.P.; Wani, S.P.; Stephane, L.; Padmaja, V.V.; Vineela, C.; Rao, M.B.; Sahrawat, K.L. Vermicomposting: Recycling Wastes into Valuable Organic Fertilizer. In Global Theme on Agrecosystems; Report No. 8. Patancheru 502324; International Crops Research Institute for the Semi-Arid Tropics: Patancheru, Andhra Pradesh, India, 2004; p. 20. [Google Scholar]
- Aguiar, N.O.; Olivares, F.L.; Novotny, E.H.; Dobbss, L.B.; Balmori, D.M.; Santos-Júnior, L.G.; Chagas, J.G.; Façanha, A.R.; Canellas, L.P. Bioactivity of humic acids isolated from vermicomposts at different maturation stages. Plant Soil. 2013, 362, 161–174. [Google Scholar] [CrossRef]
- Canellas, L.P.; Olivares, F.L.; Okorokova-Facanha, A.L.; Facanha, A.R. Humic acids isolated from earthworm compost enhance root elongation, lateral root emergence, and plasma membrane h+-atpase activity in maize roots. Plant Physiol. 2002, 130, 1951–1957. [Google Scholar] [CrossRef] [PubMed] [Green Version]
- Zandonadi, D.B.; Busato, J.G. Vermicompost humic substances: Technology for converting pollution into plant growth regulators. Int. J. Environ. Sci. Eng. Res. 2012, 3, 73–84. [Google Scholar]
- Zandonadi1, D.B.; Santos, M.P.; Busato, J.G.; Peres, L.E.P.; Façanha, A.R. Plant physiology as affected by humified organic matter. Theor. Exp. Plant Physiol. 2013, 25, 12–25. [Google Scholar] [CrossRef] [Green Version]
- Haynes, R.J.C.A.; Science, C.; Naidu, R. Influence of lime, fertilizer and manure applications on soil organic matter content and soil physical conditions: A review. Nutr. Cycl. Agroecosyst. 1998, 51, 123–137. [Google Scholar] [CrossRef]
- Burgin, A.J.; Groffman, P.M. Soil O2 controls denitrificationrates and N2O yield in a riparian wetland. J. Geophys. Res. Biogeosci. 2012, 117, G01010. [Google Scholar] [CrossRef] [Green Version]
- Busato, J.G.; Lima, L.; Aguiar, N.O.; Canellas, L.P.; Olivares, F.L. Changes in labile phosphorus forms during maturation of vermicompost enriched with phosphorus-solubilizing and diazotrophic bacteria. Bioresour. Technol. 2012, 110, 390–395. [Google Scholar] [CrossRef] [Green Version]
- Arancon, N.Q.; Edwards, C.A.; Babenko, A.; Cannon, J.; Galvis, P.; Metzger, J.D. Influences of vermicomposts, produced by earthworms and microorganisms from cattle manure, food waste and paper waste, on the germination, growth and flowering of petunias in the greenhouse. Appl. Soil Ecol. 2008, 39, 91–99. [Google Scholar] [CrossRef]
- Joshi, R.; Vig, A.P. Effect of vermicompost on growth, yield and quality of tomato (Lycopersicum esculentum L.). Afr. J. Basic Appl. Sci. 2010, 2, 117–123. [Google Scholar]
- Salehi, A.; Ghalavand, A.; Sefidkan, F.; Asgharzadeh, A. Effect of zeolite bacterial inoculum of vermicomposting concentration NPK elements essential oil content and essential oil yield in organic farming chamomile Matricaria chamomilla. J. Med. Aromat. Plants Iran Res. 2011, 27, 188–201. [Google Scholar]
- Madahi, S. Investigating the Effect of Organic Biological and Chemical Fertilizers and Soil Organic Carbon on the Yield of Saffron (Crocus sativus L.). Master’s Thesis, Faculty of Agriculture, Ferdowsi University of Mashhad,, Mashhad, Iran, 2015. [Google Scholar]
- Oftadeh, A.; Aminifard, M.H.; Behdani, M.A.; Moradineghad, F. The Effect of different levels of nitroxin and vermicompost on yield and photosynthetic pigmentation of saffron (Crocus sativus L.). J. Saffron Res. 2017, 5, 163–179. [Google Scholar]
- Johnston, A.E.; Poulton, P.R.; Coleman, K. Soil organic matter: Its importance in sustainable agriculture and carbon dioxide fluxs. Adv. Agron. 2009, 101, 1–57. [Google Scholar]
- Ramachandran, C.; Peter, K.V.; Gopalakrishnan, P.K. Drumstick (Moringa oleifera): A multipurpose. Indian Veg. Econ. Bot. 1980, 34, 276–283. [Google Scholar] [CrossRef]
- Morton, J.F. The horseradish tree, Moringa pterygosperma (Moringaceae) a boon to arid lands. Econ. Bot. 1991, 45, 318–333. [Google Scholar] [CrossRef]
- Rockwood, J.L.; Anderson, B.G.; Casamatta, D.A. Potential uses of Moringa oleifera and an examination of antibiotic efficacy conferred by M. oleifera seed and leaf extracts using crude extraction techniques available to underserved indigenous populations. Int. J. Phytother. Res. 2013, 3, 61–71. [Google Scholar]
- Fuglier, L.J. The Miracle Tree: Moringa oleifera, Natural Nutrition for the Tropics; Church World Service: Dakar, Senegal, 1999. [Google Scholar]
- Aiyelaagbe, I.O.O. Nigerian Horticulture: Facing the challenges of human health and agricultural productivity. In Proceedings of the 29th Annual National Conference of Horticultural Society of Nigeria (Hortson ‘11), Makurdi, Nigeria, 24–29 July 2011; pp. 24–29. [Google Scholar]
- Jones, P.D. Journal on the propagation and growing of multipurpose trees, vol. 19, 56: 60–78. In: Vegetative and Reproductive tissue of the multipurpose tree, Moringa oleifera. J. Agric. Food Chem. 1999, 51, 3546–3553. [Google Scholar]
- Sánchez, N.; Ledin, S.; Ledin, I. Biomass production and chemical composition of Moringa oleifera under different management regimes in nicaragua. Agrofor. Syst. 2006, 66, 231–242. [Google Scholar] [CrossRef]
- Isaiah, M.A. Effects of inorganic fertilizer on the growth and nutrient composition of Moringa (Moringa oleifera). J. Emerg. Trends Eng. Appl. Sci. 2013, 4, 341–343. [Google Scholar]
- Dania, S.O.; Akpansubi, P.; Eghagara, O.O. Comparative effects of different fertilizer sources on the growth and nutrient content of Moringa (Moringa oleifera) seedling in a greenhouse trial. Adv. Agric. 2014, 2014, 1–6. [Google Scholar] [CrossRef]
- Von Uexküll, H.R.; Date, M.E.R.A.; Grundon, N.J.; Raymet, G.E.; Probert, M.E. Global Extent, Development and Economic Impact of Acid Soils, Plant–Soil Interactions at Low pH: Principles and Management; Kluwer Academic Publishers: Dordrecht, The Netherlands, 1995; pp. 5–19. [Google Scholar]
- Haukioja, E.; Ossipov, V.; Koricheva, J.; Honkanen, T.; Larsson, S.; Lempa, K. Biosynthetic origin of carbon-based secondary compounds: Cause of variable responses of woody plants to fertilization? Chemoecology 1998, 8, 133–139. [Google Scholar] [CrossRef]
- Bavaresco, L.; Poni, S. Effect of calcareous soil on photosynthesis rate, mineral nutrition, and source-sink ratio of table grape. J Plant Nutr. 2007, 26, 2123–2135. [Google Scholar] [CrossRef]
- Khan, M.J.; Qasim, M. Integrated use of boiler ash as organic fertilizer and soil conditioner with NPK in calcareous soil. Songklanakarin J. Sci. Technol. 2008, 30, 281–289. [Google Scholar]
- Semida, W.M.; Abd El-Mageed, T.A.; Howladar, S.M.; Mohamed, G.F.; Rady, M.M. Response of Solanum melongena L. seedlings grown under saline calcareous soil conditions to a new organo-mineral fertilizer. J. Plant Nutr. 2015, 25, 1018–7081. [Google Scholar]
- Atiyeh, R.M.; Dominguez, J.; Subler, S.; Edwards, C.A. Changes in biochemical properties of cow manure during processing by earthworms (Eisenia andrei, Bouché) and the effects on seedling growth. Pedobiologia 2000, 44, 709–724. [Google Scholar] [CrossRef] [Green Version]
- Pant, A.P.; Radovich, T.J.K.; Hue, N.V.; Talcottb, S.T.; Krenek, K.A. Vermicompost extracts influence growth, mineral nutrients, phytonutrients and antioxidant activity in pakchoi (Brassica rapa cv. Bonsai, Chinensis group) grown under vermicompost and chemical fertilizer. J. Sci. Food Agric. 2009, 89, 2383–2392. [Google Scholar] [CrossRef]
- Krishnamoorthy, R.V.; Ajranabhiah, S.N.V. Biological activity of earthworm Casts an assessment of plant growth promoter levels in casts. Proc. Indian Acad. Sci. 1986, 95, 341–351. [Google Scholar] [CrossRef]
- Amini, S.; Farahani, M.S.; Shargi, Y. Effect of organic fertilizers and biological PGPR on the quality of saffron Crocus sativus L. In Proceedings of the National Conference on Medical Plants, Islamic Azad University, Science and Research Branch Aytollah Amoli, Tehran, Iran, 20–21 November 2014; pp. 730–735. [Google Scholar]
- Atiyeh, R.M.; Arancon, N.; Edwards, C.A.; Metzger, J.D. Incorporation of wastes into greenhouse container media for production of marigolds. J. Bioresour. Technol. 2002, 81, 103–108. [Google Scholar] [CrossRef]
- Arancon, N.Q.; Edwars, C.A.; Bierman, P.; Wech, C.; Metzger, J.D. Influence of vermicompost on field strawberries. J. Bioresour. Technol. 2004, 93, 145–153. [Google Scholar] [CrossRef]
- Liuc, J.; Pank, B. Fertility levels on growth and oil yield of Roman Chamomile. J. Sci. Pharm. 2005, 46, 63–69. [Google Scholar]
- Muscolo, A.; Bovalo, F.; Gionfriddo, F.; Nardi, F. Earthworm humic matter produces auxin-like effects on Daucus carota Cell growth and nitrate metabolism. J. Soil Biol. Biochem. 1999, 31, 1303–1311. [Google Scholar] [CrossRef]
- Singh, R.; Sharma, R.R.; Kumar, S.; Gupta, R.K.; Patil, R.T. Vermicompost substitution influences growth, physiological disorders, fruit yield and quality of strawberry (Fragaria x ananassa Duch.). Bioresour. Technol. 2008, 99, 8507–8511. [Google Scholar] [CrossRef]
- Coria-Cayupan, Y.S.; De Pinto, M.I.S.; Nazareno, M.A. Variations in bioactive substance contents and crop yields of lettuce (Lactuca sativa L.) cultivated in soils with different fertilization treatments. J. Agric. Food Chem. 2009, 57, 10122–10129. [Google Scholar] [CrossRef]
- Wang, D.; Shi, Q.; Wang, X.; Wei, M.; Hu, J.; Liu, J.; Yang, F. Influence of cow manure vermicompost on the growth, metabolite contents, and antioxidant activities of chinese cabbage (Brassica campestris ssp. chinensis). Biol. Fertil. Soils 2010, 46, 689–696. [Google Scholar] [CrossRef]
- Kumari, M.S.S.; Ushakumari, K. Effect of vermicompost enriched with rock phosphate on the yield and uptake of nutrients in cowpea (Vigna unguiculata L. Walp). J. Trop. Agric. 2002, 40, 27–30. [Google Scholar]
- Baldotto, L.E.B.; Baldotto, M.A.; Giro, V.B.; Canellas, L.P.; Olivares, F.L.; Bressan-Smith, R. Desempenho do abacaxizeiro “Vitória” em resposta à aplicação de ácidos húmicos durante a aclimatação. Rev. Bras. Ciênc. Solo 2009, 33, 979–990. [Google Scholar] [CrossRef]
- Atere, C.T.; Olayinka, A. Soil chemical properties and growth of maize as affected by cocoa pod compost base N and P fertilizer. Nigeria J. Soil Sci. 2013, 23, 83–93. [Google Scholar]
- Zanin, L.; Tomasi, N.; Zamboni, A.; Sega, D.; Varanini, Z.; Pinton, R. Water-extractable humic substances speed up the transcriptional response of maize roots to nitrate. Environ. Exp. Bot. 2018, 147, 167–178. [Google Scholar] [CrossRef]
- Brown, P.H.; Graham, R.B.; Nicholas, D.J.D. The effects of manganese and nitrate supply on the levels of phenolics and lignin in young wheat plants. Plant Soil. 1984, 81, 437–440. [Google Scholar] [CrossRef]
- Estiarte, M.; Filella, I.; Serra, J.; Pefiuelas, J. Effects of nutrient and water stress on leaf phenolic content of peppers and susceptibility to generalist herbivore Helicoverpa armigera (Hubner). Oecologia 1994, 99, 387–391. [Google Scholar] [CrossRef]
- Dixon, R.A.; Paiva, N.L. Stress-induced phenylpropanoid metabolism. Plant Cell 1995, 57, 1085–1097. [Google Scholar]
- Zhao, X.; Iwamoto, T.; Carey, E.E. Antioxidant capacity of leafy vegetables as affected by high tunnel environment, fertilisation and growth stage. J. Sci. Food Agric. 2007, 87, 2692–2699. [Google Scholar] [CrossRef] [PubMed]
- Kafle, N.; Sharma, M.D.; Shakya, S.M.; Pande, K.R. Effect of different organic manures management on cabbage (Brassica oleraceae L. Var. Capitata) at farmer’s field of phulbari, chitwan. Nepal Agric. Sci. Dev. 2011, 8, 35–45. [Google Scholar]
- Law-Ogbomo, K.E.; Ojeniyi, S.O.; OMazi, F.E. Combined and sole application of compost and NPK effect on Okra yield, soil and nutrient content. Nigeria J. Soil Sci. 2013, 23, 130–135. [Google Scholar]
- Nieto, K.F.; Frankenberger, W.T. Biosynthesis of cytokinins in soil. Soil Sci. Soc. Am. J. 2011, 53, 735–740. [Google Scholar]
- Aryal, J.; Tamrakar, A.S. Domestic organic waste composting in madhyapur thimi, bhaktapur. Nepal J. Sci. Technol. 2013, 14, 129–136. [Google Scholar] [CrossRef] [Green Version]
- Vine, H. Experiments on the Maintenance of soil Fertility in Ibadan, Nigeria. Emp. J. Exp. Agric. 1953, 21, 65–71. [Google Scholar]
- Cooke, G.W. Fertilizer for Maximum Yield; Cambridge University Press: Cambridge, UK, 1982; p. 465. [Google Scholar]
- Solubo, R.A. Studies on white yam (Discorea rotundata) II. Changes in nutrient content with age. Exp. Agric. 1972, 8, 107–115. [Google Scholar]
- Ling, F.; Silberbush, M. Response of maize to foliar vs. soil application of nitrogen-phosphorus-potassium fertilizers. J. Plant Nutr. 2002, 25, 2333–2342. [Google Scholar] [CrossRef]
- Fageria, N.K.; Filho, M.P.B.; Moreira, A.; Guimarães, C.M. Foliar fertilization of crop plants. J. Plant Nutr. 2009, 32, 1044–1064. [Google Scholar] [CrossRef]
- Danish, S.; Kiran, S.; Fahad, S.; Ahmad, N.; Ali, M.A.; Tahir, F.A.; Rasheed, M.K.; Shahzad, K.; Li, X.; Wang, D.; et al. Alleviation of chromium toxicity in maize by Fe fortification and chromium tolerant ACC deaminase producing plant growth promoting rhizobacteria. Ecotoxicol. Environ. Saf. 2019, 185, 109706. [Google Scholar] [CrossRef]
- Rai, P.K. Impacts of particulate matter pollution on plants: Implications for environmental biomonitoring. Ecotoxicol. Environ. Saf. 2016, 129, 120–136. [Google Scholar] [CrossRef]
- Wang, W.; Tarafdar, J.C.; Biswas, P. Nanoparticle synthesis and delivery by an aerosol route for watermelon plant foliar uptake. J. Nanopart. Res. 2013, 15, 1415–1417. [Google Scholar] [CrossRef]
- Abdel-Aziz, H.M.M.; Hasaneen, M.N.A.; Omer, A.M. Nano-chitosan-NPK fertilizer enhances the growth and productivity of wheat plants grown in sandy soil. Span. J. Agric. Res. 2016, 14, 1–9. [Google Scholar] [CrossRef]
- Elshamy, M.T.; ELKhallal, S.M.; Husseiny, S.M.; Farroh, K.Y. Application of Nano-chitosan NPK fertilizer on growth and productivity of potato plant. J. Sci. Res. Sci. 2019, 36, 424–441. [Google Scholar] [CrossRef] [Green Version]
- Adisa, I.O.; Pullagurala, V.L.R.; Peralta-Videa, J.R.; Dimkpa, C.O.; Elmer, W.H.; Gardea-Torresdey, J.L.; White, J.C. Recent advances in Nano-enabled fertilizers and pesticides: A critical review of mechanisms of action. Environ. Sci. Nano 2019, 6, 2002–2030. [Google Scholar] [CrossRef]
- Silberstein, O.; Wittwer, S.H. Foliar application of phosphatic nutrients to vegetable crops. Proc. Am. Soc. Hort. Sci. 1951, 58, 179–190. [Google Scholar]
- Dixon, R.C. Foliar fertilization improves nutrient use efficiency. Fluid J. 2003, 11, 22–23. [Google Scholar]
- Liu, R.; Lal, R. Synthetic apatite Nanoparticles as a phosphorus fertilizer for soybean (Glycine max). Sci. Rep. 2014, 4, 6. [Google Scholar] [CrossRef] [PubMed]
- Fagbenro, J.A. Effect of inorganic and organic NPK fertilizers on the growth of three tropical hardwood seedlings grown in an Ultisol. In Proceedings of the International Conference on Nursery Production and Stand Establishment of Broad Leaves to Promote Sustainable Forest Management, Rome, Italy, 7–10 May 2001; Ciccarese, L., Finno, A., Eds.; International Union of Forest Research Organization (IUFRO): Rome, Italy; Italian Environmental Protection Agency (ANPA): Rome, Italy; Dalarna University: Falun, Sweden, 2001; pp. 79–91. [Google Scholar]
- Ainika, J.N.; Amans, E.B. Growth and yield response of vegetable Amaranth to NPK fertilizer and farmyard manure at Samaru, Nigeria. Proceedings of 29th Annual National Conference of Horticultural Society of Nigeria (Hortson ‘11), Makurdi, Nigeria, 24–29 July 2011. [Google Scholar]
- Ghafariyan, M.H.; Malakouti, M.J.; Dadpour, M.R.; Stroeve, P.; Mahmoudi, M. Effects of magnetite Nanoparticles on soybean chlorophyll. Environ. Sci. Technol. 2013, 47, 10645–10652. [Google Scholar] [CrossRef] [PubMed] [Green Version]
- Mahmoodzadeh, H.; Aghili, R.; Nabavi, M. Physiological effects of TiO2 Nanoparticles on wheat (Triticum aestivum). Technol. J. Eng. Appl. Sci. Sci. Exp. Publ. 2013, 3, 1365–1370. [Google Scholar]
- Delfani, M.; Firouzabadi, M.B.; Farrokhi, N.; Makarian, H. Some physiological responses of black-eyed pea to iron and magnesium Nanofertilizers. Commun. Soil. Sci. Plant Anal. 2014, 45, 11. [Google Scholar] [CrossRef]
- Farnia, A.; Ghorbani, A. Effect of K Nanofertilizer and N bio-fertilizer on yield and yield components of red bean (Phaseolus vulgaris L.). Int. J. Biosci. 2014, 5, 296–303. [Google Scholar]
- Oyedeji, S.; Animasaun, D.A.; Bello, A.A.; Agboola, O.O. Effect of NPK and poultry manure on growth, yield, and proximate composition of three Amaranths. J. Bot. 2014, 2014, 828750. [Google Scholar] [CrossRef]
- Bărăscu, N.M.I.; Duda, M.M.; Donescu, V. The effect of high NPK levels on potato yield size structure and tubers starch content. Sci. Pap.-Ser. A Agron. 2015, 58, 136–142. [Google Scholar]
- Mokrani, K.; Hamdi, K.; Tarchoun, N. Potato (Solanum tuberosum L.) Response to Nitrogen, Phosphorus and Potassium Fertilization Rates. Commun. Soil Sci. Plant Anal. 2018, 49, 1314–1330. [Google Scholar] [CrossRef]
- Khalid, A.K.; Shedeed, M.R. Effect of NPK and foliar nutrition on growth, yield and chemical constituents in Nigella sativa L. J. Mater. Environ. Sci. 2015, 6, 1709–1714. [Google Scholar]
- Hasaneen, M.N.A.; Abdel-aziz, H.M. Effect of foliar application of engineered Nanomaterials: Carbon Nanotubes NPK and chitosan Nanoparticles NPK fertilizer on the growth of French bean plant. Biochem. Biotechnol. Res. 2016, 4, 68–76. [Google Scholar]
- Sarwar, M.; Patra, J.K.; Jihui, B. Comparative effects of compost and NPK fertilizer on vegetative growth, protein, and carbohydrate of Moringa oleifera lam hybrid PKM-1. J. Plant Nutr. 2018, 41, 1587–1596. [Google Scholar] [CrossRef]
- Soylu, S.; Sade, B.; Topal, A.; Akgün, N.; Gezgin, S.; Hakki, E.E.; Babaoglu, M. Responses of irrigated durum and bread wheat cultivars to boron application in a low boron calcareous soil. Turk. J. Agric. For. 2005, 29, 275–286. [Google Scholar]
- Soleimani, R. The effects of integrated application of micronutrient on wheat in low organic carbon conditions of alkaline soils of western Iran. In Proceedings of the 18th World Congress of Soil Science, Philadelphia, PA, USA, 9–15 July 2006; Volume 22. [Google Scholar]
- Arif, M.; Chohan, M.A.; Ali, S.; Gul, R.; Khan, S. Response of wheat to foliar application of nutrients. J. Agric. Biol. Sci. 2006, 1, 30–34. [Google Scholar]
- Hamayun, M.; Khan, S.A.; Khan, A.L.; Shinwari, Z.K.; Ahmad, N.; Kim, Y.H.; Lee, I.J. Effect of foliar and soil application of nitrogen, phosphorus and potassium on yield components of lentil. Pak. J. Bot. 2011, 43, 391–396. [Google Scholar]
- Jubeir, S.M.; Ahmed, W.A. Effect of Nano-fertilizers and application methods on vegetative growth and yield of date palm. Iraqi J. Agric. Sci. 2019, 50, 267–274. [Google Scholar]
- Alzreejawi, S.A.M.; Al-Juthery, H.W.A. Effect of spray with Nano-NPK, complete micro fertilizers and Nano amino acids on some growth and yield indicators of maize (Zea mays L.). Earth Environ. Sci. 2020, 553, 012010. [Google Scholar] [CrossRef]
- Rafiullah, M.; Khan, J.; Muhammad, D.; Fahad, S.; Adnan, M.; Wahid, F.; Alamri, S.; Khan, F.; Dawar, K.M.; Irshad, I.; et al. Phosphorus nutrient management through synchronization of application methods and rates in wheat and maize crops. Plants 2020, 9, 1389. [Google Scholar] [CrossRef]
- Toscano, P.; Godino, G.; Belfiore, T.; Briccoli-Bati, C. Foliar Fertilization: A valid alternative for olive cultivar. In Proceedings of the International Symposium on Foliar Nutrition of Perennial Fruit Plants, Meran, Italy, 11–15 September 2001. [Google Scholar]
- Goyal, S.; Chander, K.; Mundra, M.C.; Kapoor, K.K. Influence of inorganic fertilizers and organic amendments on soil organic matter and soil microbial properties under tropical conditions. Biol. Fertil. Soils 1999, 29, 196–200. [Google Scholar] [CrossRef]
- Kaur, K.; Kapoor, K.K.; Gupta, A.P. Impact of organic manures with and without mineral fertilizers on soil chemical and biological properties under tropical conditions. J. Plant Nutr. Soil Sci. 2005, 168, 117–122. [Google Scholar] [CrossRef]
- Valiki, S.R.H.; Ghanbari, S.; Golmohammadzadeh, S.; Tat, O.F. The effect of vermicompost and NPK fertilizer on yield, growth parameters and essential oil of fennel (Foeniculum vulgare). Int. J. Life Sci. 2015, 9, 38–43. [Google Scholar] [CrossRef] [Green Version]
- Bajracharya, S.K.; Sherchan, D.P.; Bhattarai, S. Effect of vermicompost in combination with bacterial and mineral fertilizers on the yield of vegetable soybean. Korean J. Crop Sci. 2007, 52, 100–103. [Google Scholar]
- Bhattarai, B.P.; Tomar, C.S. Effect of integrated nutrient management on leaf nutrient status of Walnut (Juglans regia L.). Nepal J. Sci. Technol. 2009, 10, 63–67. [Google Scholar] [CrossRef] [Green Version]
- Thakur, A.K.; Uphoff, N.; Antony, E. An assessment of physiological effects of system of rice intensification (SRI) practices compared with recommended rice cultivation practices in India. Exp. Agric. 2010, 46, 77–98. [Google Scholar] [CrossRef] [Green Version]
- Zhao, L.; Wu, L.; Dong, C.; Li, Y. Rice yield, nitrogen utilization and ammonia volatilization as influenced by modified rice cultivation at varying nitrogen rates. Agric. Sci. 2010, 1, 10–16. [Google Scholar] [CrossRef] [Green Version]
- Prativa, K.C.; Bhattarai, B.P. Effect of integrated nutrient management on the growth, yield and soil nutrient status in tomato. Nepal J. Sci. Technol. 2011, 12, 23–28. [Google Scholar]
- Ghimire, S.; Shakya, S.M.; Srivastava, A. Sweet pepper production using different nitrogen sources in subtropical climate. Direct Res. J. Agric. Food Sci. 2013, 1, 6–10. [Google Scholar]
- Jackson, M.L. Methods of Chemical Analysis; Prentice Hall of India: New Delhi, India, 1973. [Google Scholar]
- Cottenie, A.; Verloo, M.; Kikens, L. Chemical Analysis of Plants and Soils; RUG Laboratory of Analytical and Agrochemistry: Gent, Belgium, 1982. [Google Scholar]
- Lowry, O.H.; Rosebrough, N.J.; Farr, A.L.; Randall, R.J. Protein measurement with the Folin phenol reagent. J. Biol. Chem. 1951, 193, 265–275. [Google Scholar] [CrossRef]
- Association of Official Analytical Chemists. Official Methods of Analysis, 12th ed.; Association of Official Analytical Chemists: Washington, DC, USA, 1980. [Google Scholar]
- Singleton, V.L.; Rossi, J.A. Colorimetry of total phenolics with phosphomolybdicphosphotungstic acid reagents. Am. J. Enol. Vitic. 1965, 16, 144–158. [Google Scholar]
- Kim, D.; Chun, O.; Kim, Y.; Moon, H.; Lee, C. Quantification of phenolics and their antioxidant capacity in fresh plums. J. Agric. Food Chem. 2003, 51, 6509–6515. [Google Scholar] [CrossRef]
- Brand-Williams, W.; Cuvelier, M.E.; Berset, C. Use of a free radical method to evaluate antioxidant activity. Lebensm Wiss. Technol. 1995, 26, 25–30. [Google Scholar] [CrossRef]
- Ghosh, P.; Paul, S.K. Photograft copolymerization of methyl methacrylate on potato starch using potassium pervanadate as initiator. J. Macromol. Sci. Chem. 1983, 20, 261–269. [Google Scholar] [CrossRef]
- SAS Institute Inc. SAS/STAT User’s Guide, Release 6.03 Edition; SAS Institute: Cary, NC, USA, 1988. [Google Scholar]


| Vermicompost (ton ha−1) | NPK (2 g L−1) | Plant Height (cm) | Stem Diameter (mm) | Number of Main Branches Tree−1 | |||
|---|---|---|---|---|---|---|---|
| First Season | Second Season | First Season | Second Season | First Season | Second Season | ||
| Control | Control | 146.6 ± 2.16 u | 145.4 ± 2.16 u | 20.18 ± 0.20 u | 19.89 ± 0.43 s | 1.31 ± 0.10 p | 1.34 ± 0.02 t |
| Mineral | 148.7 ± 2.23 t | 147.4 ± 2.23 t | 29.76 ± 0.30 t | 29.33 ± 0.66 r | 2.47 ± 0.19 o | 2.52 ± 0.04 s | |
| Nano | 165.4 ± 2.43 p | 164.1 ± 2.43 p | 37.68 ± 0.37 p | 37.14 ± 0.80 n | 3.65 ± 0.28 lm | 3.73 ± 0.06 p | |
| 10 | Control | 151.8 ± 2.19 s | 150.6 ± 2.19 s | 30.99 ± 0.29 s | 30.55 ± 0.63 q | 2.48 ± 0.19 o | 2.52 ± 0.04 s |
| Mineral | 158.1 ± 2.32 r | 156.8 ± 2.32 r | 32.43 ± 0.32 r | 31.97 ± 0.69 p | 3.36 ± 0.26 n | 3.43 ± 0.06 r | |
| Nano | 178.0 ± 2.62 m | 176.5 ± 2.62 m | 39.94 ± 0.39 m | 39.37 ± 0.85 k | 4.54 ± 0.35 j | 4.64 ± 0.08 m | |
| 20 | Control | 160.2 ± 2.36 q | 158.9 ± 2.36 q | 35.32 ± 0.34 q | 34.81 ± 0.75 o | 3.45 ± 0.26 mn | 3.53 ± 0.06 q |
| Mineral | 182.2 ± 2.68 l | 180.7 ± 2.68 l | 40.39 ± 0.39 l | 39.82 ± 0.85 k | 4.74 ± 0.36 j | 4.84 ± 0.08 l | |
| Nano | 194.7 ± 2.86 i | 193.1 ± 2.86 i | 47.37 ± 0.46 i | 46.7 ± 1.00 h | 5.33 ± 0.41 h | 5.45 ± 0.09 i | |
| 30 | Control | 169.6 ± 2.49 o | 168.2 ± 2.49 o | 38.32 ± 0.37 p | 37.78 ± 0.81 m | 3.75 ± 0.29 kl | 3.83 ± 0.07 o |
| Mineral | 185.3 ± 2.72 k | 183.8 ± 2.72 k | 42.68 ± 0.42 k | 42.07 ± 0.90 j | 5.03 ± 0.38 i | 5.14 ± 0.09 k | |
| Nano | 207.3 ± 3.05 f | 205.6 ± 3.05 f | 55.38 ± 0.54 f | 54.59 ± 1.17 e | 6.12 ± 0.47 ef | 6.25 ± 0.11 f | |
| 40 | Control | 172.8 ± 2.54 n | 171.3 ± 2.54 n | 39.15 ± 0.38 n | 38.59 ± 0.83 l | 3.95 ± 0.30 k | 4.03 ± 0.07 n |
| Mineral | 205.2 ± 3.02 g | 203.5 ± 3.02 g | 52.45 ± 0.51 g | 51.7 ± 1.11 f | 5.92 ± 0.45 fg | 6.05 ± 0.11 g | |
| Nano | 218.8 ± 3.22 c | 217.0 ± 3.22 c | 68.82 ± 0.67 c | 67.84 ± 1.46 c | 7.21 ± 0.55 c | 7.36 ± 0.13 c | |
| 50 | Control | 188.5 ± 2.77 i | 186.9 ± 2.77 j | 43.74 ± 0.43 j | 43.12 ± 0.93 i | 5.13 ± 0.39 hi | 5.24 ± 0.09 j |
| Mineral | 209.4 ± 3.08 e | 207.7 ± 3.08 e | 57.63 ± 0.56 e | 56.81 ± 1.22 d | 6.32 ± 0.48 e | 6.45 ± 0.11 e | |
| Nano | 228.2 ± 3.36 b | 226.4 ± 3.36 b | 70.43 ± 0.69 b | 69.43 ± 1.49 b | 7.70 ± 0.59 b | 7.87 ± 0.14 b | |
| 60 | Control | 197.9 ± 2.91 h | 196.2 ± 2.91 h | 48.02 ± 0.47 h | 47.34 ± 1.02 g | 5.72 ± 0.44 g | 5.85 ± 0.10 h |
| Mineral | 214.6 ± 3.16 d | 212.9 ± 3.16 d | 58.22 ± 0.57 d | 57.39 ± 1.23 d | 6.81 ± 0.52 d | 6.96 ± 0.12 d | |
| Nano | 240.8 ± 3.54 a | 238.8 ± 3.54 a | 72.57 ± 0.71 a | 71.54 ± 1.54 a | 7.99 ± 0.61 a | 8.17 ± 0.14 a | |
| Treatments | Number of Leaves Branch−1 | Fresh Weight of Leaf (g) | Yield of Fresh Leaves (g tree−1) | ||||
|---|---|---|---|---|---|---|---|
| Vermicompost (ton ha−1) | NPK (2 g L−1) | First Season | Second Season | First Season | Second Season | First Season | Second Season |
| Control | Control | 6.36 ± 0.22 u | 6.44 ± 0.04 u | 3.09 ± 0.02 j | 2.95 ± 0.12 r | 33 ± 4 o | 32 ± 1 t |
| Mineral | 6.46 ± 0.22 t | 6.55 ± 0.04 t | 3.80 ± 0.03 ij | 3.63 ± 0.14 q | 60 ± 7 no | 59 ± 2 s | |
| Nano | 7.07 ± 0.24 q | 7.16 ± 0.05 q | 5.04 ± 0.04 efghij | 4.81 ± 0.19 m | 130 ± 15 klm | 128 ± 5 p | |
| 10 | Control | 6.66 ± 0.23 s | 6.75 ± 0.04 s | 4.01 ± 0.03 hij | 3.83 ±0.15 p | 64 ± 7 no | 63 ± 3 s |
| Mineral | 7.67 ± 0.26 n | 7.77 ± 0.05 n | 4.32 ± 0.03 ghij | 4.12 ± 0.16 o | 97 ± 11 mn | 95 ± 4 r | |
| Nano | 8.08 ± 0.28 l | 8.18 ± 0.05 l | 5.96 ± 0.04 bcdefghi | 5.69 ± 0.23 j | 208 ± 24 j | 205 ± 8 m | |
| 20 | Control | 6.87 ± 0.24 r | 6.95 ± 0.04 r | 4.73 ± 0.04 fghij | 4.52 ± 0.18 n | 112 ± 13 lm | 111 ± 4 q |
| Mineral | 7.98 ± 0.27 m | 8.08 ± 0.05 m | 6.17 ± 0.05 abcdefgh | 5.89 ± 0.23 i | 234 ± 27 ij | 230 ± 9 l | |
| Nano | 8.58 ± 0.29 h | 8.69 ± 0.05 h | 6.99 ± 0.05 abcdef | 6.68 ± 0.26 f | 321 ± 37 fg | 316 ± 12 i | |
| 30 | Control | 7.37 ± 0.25 p | 7.47 ± 0.05 p | 5.24 ± 0.04 efghij | 5.01± 0.20 l | 145 ± 17 kl | 143 ± 6 o |
| Mineral | 8.18 ± 0.28 k | 8.28 ± 0.05 k | 6.38 ± 0.05 abcdefg | 6.09 ± 0.24 h | 263 ± 30 hi | 259 ± 10 k | |
| Nano | 8.99 ± 0.31 f | 9.10 ± 0.06 f | 7.51 ± 0.06 abcd | 7.17 ± 0.28 d | 414 ± 48 d | 408 ± 16 f | |
| 40 | Control | 7.47 ± 0.26 o | 7.57 ± 0.05 o | 5.45 ± 0.04 cdefghi | 5.20 ± 0.21 k | 161 ± 19 k | 159 ± 6 n |
| Mineral | 8.68 ± 0.30 g | 8.79 ± 0.06 g | 7.20 ± 0.05 abcde | 6.87 ± 0.27 e | 371 ± 43 e | 366 ± 14 g | |
| Nano | 9.89 ± 0.34 c | 10.02 ± 0.06 c | 8.02 ± 0.06 ab | 7.66 ± 0.30 b | 573 ± 66 b | 565 ± 22 c | |
| 50 | Control | 8.38 ± 0.29 j | 8.49 ± 0.05 j | 6.68 ± 0.05 abcdef | 6.38 ± 0.25 g | 288 ± 33 gh | 284 ± 11 j |
| Mineral | 9.19 ± 0.32 l | 9.31 ± 0.06 e | 7.71 ± 0.06 abc | 7.36 ± 0.29 c | 449 ± 52 d | 442 ± 17 e | |
| Nano | 10.00 ± 0.34 b | 10.12 ± 0.06 b | 8.23 ± 0.06 ab | 7.85 ± 0.31 a | 634 ± 73 a | 625 ± 25 b | |
| 60 | Control | 8.48 ± 0.29 i | 8.59 ± 0.05 i | 7.10 ± 0.05 abcde | 6.77 ± 0.27 ef | 345 ± 40 ef | 340 ± 13 h |
| Mineral | 9.29 ± 0.32 d | 9.41 ± 0.06 d | 7.82 ± 0.06 ab | 7.46 ± 0.30 c | 496 ± 57 c | 488 ± 19 d | |
| Nano | 10.10 ± 0.35 a | 10.23 ± 0.06 a | 8.33 ± 0.06 a | 7.95 ± 0.31 a | 674 ± 78 a | 664 ± 26 a | |
| Treatments | Yield of Fresh Leaves (kg ha−1) | Dry Weight of Leaf (g) | Yield of Dry Leaves (g tree−1) | ||||
|---|---|---|---|---|---|---|---|
| Vermicompost (ton ha−1) | NPK (2 g L−1) | First Season | Second Season | First Season | Second Season | First Season | Second Season |
| Control | Control | 328 ± 38 o | 323 ± 13 t | 0.93 ± 0.01 u | 0.88 ± 0.03 r | 9.8 ± 1.1o | 9.7 ± 0.4 t |
| Mineral | 599 ± 69 no | 590 ± 23 s | 1.14 ± 0.01 t | 1.09 ± 0.04 q | 18.0 ± 2.1 no | 17.7 ± 0.7 s | |
| Nano | 1303 ± 150 klm | 1285 ± 51 p | 1.51 ± 0.01 p | 1.44 ± 0.06 m | 39.1 ± 4.5 klm | 38.5 ± 1.5 p | |
| 10 | Control | 641 ± 74 no | 632 ± 25 s | 1.20 ± 0.01 s | 1.15 ± 0.05 p | 19.2 ± 2.2 no | 18.9 ± 0.7 s |
| Mineral | 968 ± 112 mn | 954 ± 38 r | 1.30 ± 0.01 r | 1.24 ± 0.05 o | 29.0 ± 3.4 mn | 28.6 ± 1.1 r | |
| Nano | 2083 ± 240 j | 2052 ± 81 m | 1.79 ± 0.01 m | 1.71 ± 0.07 j | 62.5 ± 7.2 j | 61.6 ± 2.4 m | |
| 20 | Control | 1124 ± 130 lm | 1108 ± 44 lm | 1.42 ± 0.01 q | 1.35 ± 0.05 n | 33.7 ± 3.9 lm | 33.2 ± 1.3 q |
| Mineral | 2337 ± 270 ij | 2303 ± 91 l | 1.85 ± 0.01 l | 1.77 ± 0.07 i | 70.1 ± 8.1 ij | 69.1 ± 2.7 l | |
| Nano | 3206 ± 370 fg | 3159 ± 125 i | 2.10 ± 0.02 i | 2.00 ± 0.08 f | 96.2 ± 11.1 fg | 94.8 ± 3.7 i | |
| 30 | Control | 1453 ± 168 kl | 1432 ± 57 o | 1.57 ± 0.01 o | 1.50 ± 0.06 l | 43.6 ± 5.0 kl | 43.0 ± 1.7 o |
| Mineral | 2631 ± 304 hi | 2592 ± 102 k | 1.91 ± 0.01 k | 1.83 ± 0.07 h | 78.9 ± 9.1 hi | 77.8 ± 3.1 k | |
| Nano | 4137 ± 478 d | 4077 ± 161 f | 2.25 ± 0.02 f | 2.15 ± 0.09 d | 124.1 ± 14.3 d | 122.3 ± 4.8 f | |
| 40 | Control | 1611 ± 186 k | 1588 ± 63n | 1.64 ± 0.01 n | 1.56 ± 0.06 k | 48.3 ± 5.6 k | 47.6 ± 1.9 n |
| Mineral | 3710 ± 428 e | 3656 ± 144g | 2.16 ± 0.02 g | 2.06 ± 0.08 e | 111.3 ± 12.9 e | 109.7 ± 4.3 g | |
| Nano | 5731 ± 662 b | 5648 ± 223c | 2.41 ± 0.02 c | 2.30 ± 0.09 b | 171.9 ± 19.9 b | 169.4 ± 6.7 c | |
| 50 | Control | 2881 ± 333 gh | 2840 ± 112 j | 2.01 ± 0.01 j | 1.91 ± 0.08 g | 86.4 ± 10.0 gh | 85.2 ± 3.4 j |
| Mineral | 4486 ± 518 d | 4421 ± 175 e | 2.31 ± 0.02 e | 2.21 ± 0.09 c | 134.6 ± 15.5 d | 132.6 ± 5.2 e | |
| Nano | 6345 ± 733 a | 6253 ± 247 b | 2.47 ± 0.02 b | 2.36 ± 0.09 a | 190.3 ± 22.0 a | 187.6 ± 7.4 b | |
| 60 | Control | 3453 ± 399 ef | 3403 ± 134 h | 2.13 ± 0.02 h | 2.03 ± 0.08 ef | 103.6 ± 12.0 ef | 102.1 ± 4.0 h |
| Mineral | 4955 ± 572 c | 4883 ± 193 d | 2.34 ± 0.02 d | 2.24 ± 0.09 c | 148.7 ± 17.2 c | 146.5 ± 5.8 d | |
| Nano | 6739 ± 778 a | 6641 ± 262 a | 2.50 ± 0.02 a | 2.39 ± 0.09 a | 202.2 ± 23.3 a | 199.2 ± 7.9 a | |
| Treatments | Yield of Dry Leaves (kg ha−1) | Number of Inflorescences Per Tree | Fresh Weight of Inflorescences (g) | ||||
|---|---|---|---|---|---|---|---|
| Vermicompost (ton ha−1) | NPK (2 g L−1) | First Season | Second Season | First Season | Second Season | First Season | Second Season |
| Control | Control | 98 ± 11 o | 97 ± 4 t | 6.3 ± 0.58 o | 6.5 ± 0.13 t | 2.07 ± 0.05 u | 2.10 ± 0.04 u |
| Mineral | 180 ± 21 no | 177 ± 7 s | 9.3 ± 0.91 o | 9.6 ± 0.20 s | 2.59 ± 0.06 t | 2.63 ± 0.05 t | |
| Nano | 391 ± 45 klm | 385 ± 15 p | 16.5 ± 1.69 lmn | 17.0 ± 0.37 p | 3.63 ± 0.09 p | 3.68 ± 0.07 p | |
| 10 | Control | 192 ± 22 no | 189 ± 7 s | 9.8 ± 0.96 o | 10.1 ± 0.21 s | 2.90 ± 0.07 s | 2.94 ± 0.06 s |
| Mineral | 290 ± 34 mn | 286 ± 11 r | 13.8 ± 1.39 n | 14.2 ± 0.31 r | 3.11 ± 0.08 r | 3.15 ± 0.06 r | |
| Nano | 625 ± 72 j | 616 ± 24 m | 24.0 ± 2.51 k | 24.8 ± 0.55 m | 4.35 ± 0.11 m | 4.41 ± 0.08 m | |
| 20 | Control | 337 ± 39 lm | 332 ± 13 q | 15.0 ± 1.53 mn | 15.5 ± 0.34 q | 3.42 ± 0.08 q | 3.47 ± 0.07 q |
| Mineral | 701 ± 81 ij | 691 ± 27 l | 26.7 ± 2.80 jk | 27.6 ± 0.62 l | 4.56 ± 0.11 l | 4.62 ± 0.09 l | |
| Nano | 962 ± 111 fg | 948 ± 37 i | 34.4 ± 3.64 h | 35.6 ± 0.80 i | 5.08 ± 0.12 i | 5.15 ± 0.10 i | |
| 30 | Control | 436 ± 50 kl | 430 ± 17 o | 18.2 ± 1.87 lm | 18.7 ± 0.41 o | 3.84 ± 0.09 o | 3.89 ± 0.07 o |
| Mineral | 789 ± 91 hi | 778 ± 31 k | 29.9 ± 3.14 ij | 30.8 ± 0.69 k | 4.67 ± 0.11 k | 4.73 ± 0.09 k | |
| Nano | 1241 ± 143 d | 1223 ± 48 f | 43.4 ± 4.61 f | 44.8 ± 1.02 f | 5.70 ± 0.14 f | 5.78 ± 0.11 f | |
| 40 | Control | 483 ± 56 k | 476 ± 19 n | 19.6 ± 2.03 l | 20.2 ± 0.45 n | 4.04 ± 0.10 n | 4.10 ± 0.08 n |
| Mineral | 1113 ± 129 e | 1097 ± 43 g | 39.6 ± 4.20 g | 40.9 ± 0.93 g | 5.49 ± 0.13 g | 5.57 ± 0.11 g | |
| Nano | 1719 ± 199 b | 1694 ± 67 c | 61.7 ± 6.60 b | 60.0 ± 1.37 c | 6.32 ± 0.15 c | 6.41 ± 0.12 c | |
| 50 | Control | 864 ± 100 gh | 852 ± 34 j | 32.0 ± 3.38 hi | 34.0 ± 1.00 j | 4.77± 0.12 j | 4.83 ± 0.09 j |
| Mineral | 1346 ± 155 d | 1326 ± 52 e | 52.2 ± 5.57 d | 52.1 ± 1.19 d | 5.91 ± 0.14 e | 5.99 ± 0.11 e | |
| Nano | 1903 ± 220 a | 1876 ± 74 a | 70.6 ± 7.16 a | 73.5 ± 1.69 a | 6.53 ± 0.16 b | 6.62 ± 0.13 b | |
| 60 | Control | 1036 ± 120 ef | 1021± 40 ef | 33.5 ± 1.00 h | 39.1 ± 1.00 h | 5.29 ± 0.13 h | 5.36 ± 0.10 h |
| Mineral | 1487 ± 172 c | 1465± 58 c | 48.5 ± 5.17 e | 49.4 ± 1.13 e | 6.12 ± 0.15 d | 6.20 ± 0.12 d | |
| Nano | 2022 ± 233 a | 1992± 79 a | 57.3 ± 6.69 c | 61.4 ± 1.74 b | 6.95 ± 0.17 a | 7.04 ± 0.13 a | |
| Treatments | Yield of Fresh Inflorescences (g tree−1) | Yield of Fresh Inflorescences (kg ha−1) | Dry Weight of Inflorescences (g) | ||||
|---|---|---|---|---|---|---|---|
| Vermicompost (ton ha−1) | NPK (2 g L−1) | First Season | Second Season | First Season | Second Season | First Season | Second Season |
| Control | Control | 13.1 ± 1.5 m | 13.6 ± 0.3 q | 131 ± 15 m | 136 ± 3 q | 0.30 ± 0.01 u | 0.31 ± 0.01 u |
| Mineral | 24.2 ± 2.9 lm | 25.2 ± 0.5 p | 242 ± 29 lm | 252 ± 5 p | 0.46 ± 0.02 t | 0.47 ± 0.01 t | |
| Nano | 60.0 ± 7.4 ijk | 62.6 ± 1.3 n | 600 ± 74 ijk | 626 ± 13 n | 0.79 ± 0.03 q | 0.80 ± 0.02 q | |
| 10 | Control | 28.4 ± 3.4 klm | 29.6 ± 0.6 p | 284 ± 34 klm | 296 ± 6 p | 0.55 ± 0.02 s | 0.56 ± 0.02 s |
| Mineral | 42.9 ± 5.3 jklm | 44.7 ± 0.9 o | 429 ± 53 jklm | 447 ± 9 o | 0.62 ± 0.02 r | 0.63 ± 0.02 r | |
| Nano | 104.8 ± 13.2 gh | 109.3 ± 2.4 l | 1048 ± 132 gh | 1093 ± 24 l | 1.08 ± 0.03 m | 1.09 ± 0.03 m | |
| 20 | Control | 51.5 ± 6.3 ijkl | 53.6 ± 1.1 no | 515 ± 63 ijkl | 536 ± 11 no | 0.86 ± 0.08 p | 0.88 ± 0.06 p |
| Mineral | 122.2 ± 15.4 fg | 127.5 ± 2.8 k | 1222 ± 154 fg | 1275 ± 28 k | 1.15 ± 0.04 l | 1.17 ± 0.03 l | |
| Nano | 175.3 ± 22.3 e | 182.9 ± 4.0 h | 1753 ± 223 e | 1829 ± 40 h | 1.36 ± 0.04 i | 1.38 ± 0.03 i | |
| 30 | Control | 69.8 ± 8.7 ij | 72.8 ± 1.6 m | 698 ± 87 ij | 728 ± 16 m | 0.90 ± 0.03 o | 0.91 ± 0.02 o |
| Mineral | 139.6 ± 17.7 f | 145.6 ± 3.2 j | 1396 ± 177 f | 1456 ± 32 j | 1.20 ± 0.04 k | 1.22 ± 0.03 k | |
| Nano | 247.9 ± 31.7 d | 258.8 ± 5.7 e | 2479 ± 317 d | 2588 ± 57 e | 1.59 ± 0.05 f | 1.62 ± 0.04 f | |
| 40 | Control | 79.4 ± 9.9 hi | 82.8 ± 1.8 m | 794 ± 99 hi | 828 ± 18 m | 0.97 ± 0.03 n | 0.99 ± 0.02 n |
| Mineral | 218.1 ± 27.8 d | 227.6 ± 5.0 f | 2181 ± 278 d | 2276 ± 50 f | 1.51 ± 0.04 g | 1.54 ± 0.04 g | |
| Nano | 390.8 ± 50.2 b | 400.3 ± 21.1 c | 3908 ± 502 b | 4003 ± 211 c | 1.84 ± 0.05 c | 1.86 ± 0.04 c | |
| 50 | Control | 152.9 ± 19.4 ef | 164.3 ± 8.0 i | 1529 ± 194 ef | 1643 ± 80 i | 1.25 ± 0.04 j | 1.26 ± 0.03 j |
| Mineral | 308.7 ± 39.6 c | 311.5 ± 6.8 d | 3087 ± 396 c | 3115 ± 68 d | 1.67 ± 0.05 e | 1.70 ± 0.04 e | |
| Nano | 461.8 ± 56.8 a | 485.9 ± 10.7 a | 4618 ± 568 a | 4859 ± 107 a | 1.92 ±0.05 b | 1.95 ± 0.04 b | |
| 60 | Control | 177.1 ± 9.6 e | 209.7 ± 9.3 g | 1771 ± 96 e | 2097 ± 93 g | 1.43 ± 0.04 h | 1.46 ± 0.04 h |
| Mineral | 297.3 ± 38.1 c | 306.3 ± 6.7 d | 2973 ± 381 c | 3063 ± 67 d | 1.76 ± 0.05 d | 1.78 ± 0.04 d | |
| Nano | 398.3 ± 55.9a | 432.1 ± 15.3 b | 3983 ± 559 a | 4321 ± 153 b | 2.13 ± 0.06 a | 2.16 ± 0.05 a | |
| Treatments | Yield of Dry Inflorescences (g tree−1) | Yield of Dry Inflorescences (g ha−1) | Total Chlorophyll (spad unit) | ||||
|---|---|---|---|---|---|---|---|
| Vermicompost (ton ha−1) | NPK (2 g L−1) | First Season | Second Season | First Season | Second Season | First Season | Second Season |
| Control | Control | 1.9 ± 0.3 n | 2.0 ± 0.1 r | 19 ± 3 n | 20 ±1 r | 28.4 ± 0.4 u | 28.5 ± 0.1 u |
| Mineral | 4.3 ± 0.6 mn | 4.5 ± 0.1 qr | 43 ± 6 mn | 45 ± 1 qr | 30.5 ± 0.5 t | 30.6 ± 0.1 t | |
| Nano | 13.0 ±1.7 klm | 13.7 ± 0.3 o | 130 ± 17 klm | 137 ± 3 o | 33.4 ± 0.5 p | 33.5 ± 0.2 p | |
| 10 | Control | 5.4 ± 0.7 mn | 5.7 ± 0.2 q | 54 ± 7 mn | 57 ± 2 q | 31.5 ± 0.5 s | 31.6 ± 0.2 s |
| Mineral | 8.6 ± 1.1 lmn | 9.0 ± 0.2 p | 86 ± 11 lmn | 90 ± 2 p | 32.6 ± 0.5 r | 32.7 ± 0.2 r | |
| Nano | 25.9 ± 3.4 ij | 27.1 ± 0.7 l | 259 ± 34 ij | 271 ± 7 l | 35.0 ± 0.5 m | 35.1 ± 0.2 m | |
| 20 | Control | 13.0 ± 2.4 klm | 13.6 ± 0.8 o | 130 ± 24 klm | 136 ± 8 o | 32.9 ± 0.5 q | 33.0 ± 0.2 q |
| Mineral | 30.8 ± 4.1 hi | 32.3 ± 0.8 k | 308 ± 41 hi | 323 ± 8 k | 35.2 ± 0.5 l | 35.3 ± 0.2 l | |
| Nano | 46.8 ± 6.2 f | 49.0 ± 1.2 h | 468 ± 62 f | 490 ± 12 h | 36.8 ± 0.6 i | 36.9 ± 0.2 i | |
| 30 | Control | 16.3 ± 2.2 kl | 17.1 ± 0.4 n | 163 ± 22 kl | 171 ± 4 n | 34.7 ± 0.5 o | 34.8 ± 0.2 o |
| Mineral | 36.0 ± 4.8 gh | 37.6 ± 0.9 j | 360 ± 48 gh | 376 ± 9 j | 36.3 ± 0.6 k | 36.4 ± 0.2 k | |
| Nano | 69.3 ± 9.1 d | 72.5 ± 1.7 e | 693 ± 91 d | 725 ± 17 e | 38.8 ± 0.6 f | 38.9 ± 0.2 f | |
| 40 | Control | 19.1 ± 2.5 jk | 19.9 ± 0.5 m | 191 ± 25 jk | 199 ± 5 m | 34.9 ± 0.5 n | 35.0 ± 0.2 n |
| Mineral | 60.1 ± 7.9 e | 62.8 ± 1.5 f | 601 ± 79 e | 628 ± 15 f | 38.3 ± 0.6 g | 38.4 ± 0.2 g | |
| Nano | 113.6 ± 15.0 b | 111.9 ± 2.6 c | 1136 ± 150 b | 1119 ± 26 c | 39.7 ± 0.6 c | 39.9 ± 0.2 c | |
| 50 | Control | 39.9 ± 5.3 fg | 43.0 ± 2.3 i | 399 ± 53 fg | 430 ± 23 i | 36.6 ± 0.6 j | 36.7 ± 0.2 j |
| Mineral | 87.5 ± 11.6 c | 88.4 ± 2.1 d | 875 ± 116 c | 884 ± 21d | 39.0 ± 0.6 e | 39.1 ± 0.2 e | |
| Nano | 135.8 ± 17.2 a | 143.2 ± 3.3 a | 1358 ± 172 a | 1432 ± 33 a | 40.0 ± 0.6 b | 40.1 ± 0.2 b | |
| 60 | Control | 48.0 ± 2.8 f | 57.2 ± 3.0 g | 480 ± 28 f | 572 ± 30 g | 37.8 ± 0.6 h | 38.0 ± 0.2 h |
| Mineral | 85.3 ± 11.2 c | 88.1 ± 2.0 d | 853 ± 112 c | 881 ± 20 d | 39.2 ± 0.6 d | 39.3 ± 0.2 d | |
| Nano | 122.2 ± 6.5 b | 132.8 ± 4.9 b | 1222 ± 65 b | 1328 ± 49 b | 40.3 ± 0.6 a | 40.4 ± 0.2 a | |
| Treatments | Leaf Soluble Protein (mg g−1) | Vitamin C (mg g−1 Dry Weight) | |||
|---|---|---|---|---|---|
| Vermicompost (ton ha−1) | NPK (2 g L−1) | First Season | Second Season | First Season | Second Season |
| Control | Control | 17.5 ± 0.4 u | 17.7 ± 0.4 u | 27.7 ± 2.2 p | 28.9 ± 0.4 u |
| Mineral | 19.5 ± 0.5 t | 19.8 ± 0.5 t | 29.0 ± 2.3 o | 30.3 ± 0.4 t | |
| Nano | 22.5 ± 0.6 p | 22.8 ± 0.6 p | 35.2 ± 2.7 l | 36.8 ± 0.5 p | |
| 10 | Control | 20.6 ± 0.5 s | 20.8 ± 0.5 s | 30.0 ± 2.3 n | 31.4 ± 0.5 s |
| Mineral | 21.6 ± 0.5 r | 21.9 ± 0.5 r | 33.1 ± 2.6 m | 34.6 ± 0.5 r | |
| Nano | 23.6 ± 0.6 m | 23.9 ± 0.6 m | 39.7 ± 3.1 j | 41.5 ± 0.6 m | |
| 20 | Control | 22.0 ± 0.5 q | 22.3 ± 0.5 q | 33.5 ± 2.6 m | 35.0 ± 0.5 q |
| Mineral | 23.8 ± 0.6 l | 24.1 ± 0.6 l | 40.8 ± 3.2 i | 42.7 ± 0.6 l | |
| Nano | 24.8 ± 0.6 i | 25.1 ± 0.6 i | 44.0 ± 3.4 fg | 46.0 ± 0.7 i | |
| 30 | Control | 22.9 ± 0.6 o | 23.2 ± 0.6 o | 38.2 ± 3.0 k | 40.0 ± 0.6 o |
| Mineral | 24.2 ± 0.6 k | 24.5 ± 0.6 k | 42.5 ± 3.3 h | 44.4 ± 0.7 k | |
| Nano | 26.5 ± 0.7 f | 26.9 ± 0.7 f | 45.5 ± 3.5 e | 47.5 ± 0.7 f | |
| 40 | Control | 23.3 ± 0.6 n | 23.6 ± 0.6 n | 38.7 ± 3.0 k | 40.5 ± 0.6 n |
| Mineral | 26.0 ± 0.6 g | 26.4 ± 0.6 g | 45.3 ± 3.5 e | 47.3 ± 0.7 g | |
| Nano | 27.8 ± 0.7 c | 28.1 ± 0.7 c | 48.3 ± 3.8 c | 50.5 ± 0.7 c | |
| 50 | Control | 24.5 ± 0.6 j | 24.8 ± 0.6 j | 43.1 ± 3.4 gh | 45.1 ± 0.7 j |
| Mineral | 26.9 ± 0.7 e | 27.3 ± 0.7 e | 47.2 ± 3.7 d | 49.4 ± 0.7 e | |
| Nano | 28.1 ± 0.7 b | 28.4 ± 0.7 b | 51.5 ± 4.0 b | 53.8 ± 0.8 b | |
| 60 | Control | 25.2 ± 0.6 h | 25.5 ± 0.6 h | 44.7 ± 3.5 ef | 46.7 ± 0.7 h |
| Mineral | 27.6 ± 0.7 d | 27.9 ± 0.7 d | 47.6 ± 3.7 cd | 49.8 ± 0.7 d | |
| Nano | 28.9 ± 0.7 a | 29.3 ± 0.7 a | 53.7 ± 4.2 a | 56.1 ± 0.8 a | |
| Treatments | Total Phenolic (mg Gallic 1 g−1 dry herb) | Flavonoids (mg Rutin g−1 dry herb) | Antioxidant activity (IC50b) | ||||
|---|---|---|---|---|---|---|---|
| Vermicompost (ton ha−1) | NPK (2 g L−1) | First Season | Second Season | First Season | Second Season | First Season | Second Season |
| Control | Control | 47.12 ± 1.67 a | 48.23 ± 1.67 a | 28.01 ± 0.99 a | 28.67 ± 0.99 a | 30.70 ± 1.09 r | 31.42 ± 1.09 r |
| Mineral | 45.30 ± 1.60 b | 46.36 ± 1.60 b | 27.61 ± 0.98 b | 28.26 ± 0.98 b | 33.03 ± 1.17 q | 33.81 ± 1.17 q | |
| Nano | 41.02 ± 1.45 e | 41.99 ± 1.45 f | 23.74 ± 0.84 d | 24.30 ± 0.84 d | 36.98 ± 1.31 n | 37.85 ± 1.31 n | |
| 10 | Control | 44.90 ± 1.59 b | 45.95 ± 1.59 c | 27.32 ± 0.97 b | 27.96 ± 0.97 b | 34.04 ± 1.20 p | 34.84 ± 1.20 p |
| Mineral | 43.21 ± 1.53 c | 44.23 ± 1.53 d | 25.13 ± 0.89 c | 25.72 ± 0.89 c | 33.64 ± 1.19 p | 34.43 ± 1.19 p | |
| Nano | 37.75 ± 1.33 h | 38.63 ± 1.33 i | 21.16 ± 0.75 g | 21.66 ± 0.75 g | 38.70 ± 1.37 l | 39.61 ± 1.37 l | |
| 20 | Control | 41.83 ± 1.48 d | 42.81 ± 1.48 e | 25.43 ± 0.90 c | 26.03 ± 0.90 c | 35.06 ± 1.24 o | 35.88 ± 1.24 o |
| Mineral | 35.76 ± 1.26 i | 36.60 ± 1.26 j | 18.87 ± 0.67 h | 19.32 ± 0.67 h | 39.51 ± 1.40 k | 40.44 ± 1.40 k | |
| Nano | 32.78 ± 1.16 l | 33.55 ± 1.16 m | 17.38 ± 0.61 j | 17.79 ± 0.61 j | 44.59 ± 1.58 h | 45.64 ± 1.58 h | |
| 30 | Control | 39.73 ± 1.40 f | 40.67 ± 1.40 g | 22.95 ± 0.81 e | 23.49 ± 0.81 e | 36.68 ± 1.30 n | 37.54 ± 1.30 n |
| Mineral | 34.87 ± 1.23 j | 35.69 ± 1.23 k | 18.77 ± 0. 66 h | 19.22 ± 0.66 h | 40.73 ± 1.44 j | 41.69 ± 1.44 j | |
| Nano | 31.29 ± 1.11 n | 32.03 ± 1.11 p | 14.40 ± 0.51 m | 14.74 ± 0.51 m | 47.62 ± 1.68 f | 48.74 ± 1.68 f | |
| 40 | Control | 39.14 ± 1.38 g | 40.06 ± 1.38 h | 22.25 ± 0.79 f | 22.77 ± 0.79 f | 37.59 ± 1.33 m | 38.47 ± 1.33 m |
| Mineral | 31.69 ± 1.12 n | 32.43 ± 1.12 o | 15.79 ± 0.56 l | 16.17 ± 0.56 l | 46.91 ± 1.66 g | 48.01 ± 1.66 g | |
| Nano | 29.60 ± 1.05 p | 30.30 ± 1.05 r | 12.81 ± 0.45 p | 13.12 ± 0.45 p | 51.98 ± 1.84 c | 53.20 ± 1.84 c | |
| 50 | Control | 33.97 ± 1.20 k | 34.77 ± 1.20 l | 18.18 ± 0.64 i | 18.61 ± 0.64 i | 43.57 ± 1.54 i | 44.59 ± 1.54 i |
| Mineral | 30.40 ± 1.07 o | 31.11 ± 1.07 q | 13.81 ± 0.49 n | 14.13 ± 0.49 n | 49.24 ± 1.74 e | 50.40 ± 1.74 e | |
| Nano | 26.32 ± 0.93 q | 26.94 ± 0.93 s | 12.22 ± 0.43 q | 12.51 ± 0.43 q | 56.74 ± 2.01 b | 58.07 ± 2.01 b | |
| 60 | Control | 32.28 ± 1.14 m | 33.04 ± 1.14 n | 16.69 ± 0.59 k | 17.08 ± 0.59 k | 46.61 ± 1.65 g | 47.70 ± 1.65 g |
| Mineral | 29.90 ± 1.06 p | 30.60 ± 1.06 r | 13.41 ± 0.47 o | 13.73 ± 0.47 o | 50.46 ± 1.78 d | 51.64 ± 1.78 d | |
| Nano | 24.83 ± 0.88 r | 25.42 ± 0.88 t | 12.02 ± 0.42 q | 12.30 ± 0.42 q | 58.77 ± 2.08 a | 60.15 ± 2.08 a | |
| Treatments | Phosphorus (% P2O5) | Potassium (% K2O) | |||
|---|---|---|---|---|---|
| Vermicompost (ton ha−1) | NPK (2 g L−1) | First Season | Second Season | First Season | Second Season |
| Control | Control | 0.189 ± 0.017 q | 0.207 ± 0.003 u | 2.08 ± 0.18 n | 2.27 ± 0.03 t |
| Mineral | 0.217 ± 0.018 o | 0.238 ± 0.003 t | 2.25 ± 0.20 lm | 2.47 ± 0.04 r | |
| Nano | 0.232 ± 0.021 m | 0.254 ± 0.004 p | 2.40 ± 0.21 jk | 2.62 ± 0.04 o | |
| 10 | Control | 0.198 ± 0.019 p | 0.217 ± 0.004 s | 2.21 ± 0.20 m | 2.42 ± 0.04 s |
| Mineral | 0.222 ± 0.020 n | 0.243 ± 0.004 r | 2.28 ± 0.20 lm | 2.50 ± 0.04 q | |
| Nano | 0.247 ± 0.022 j | 0.271 ± 0.004 m | 2.63 ± 0.23 h | 2.88 ± 0.04 l | |
| 20 | Control | 0.228 ± 0.020 m | 0.250 ± 0.004 q | 2.32 ± 0.21 kl | 2.54 ± 0.04 p |
| Mineral | 0.250 ± 0.022 ij | 0.274 ± 0.004 l | 2.66 ± 0.24 gh | 2.91 ± 0.04 k | |
| Nano | 0.258 ± 0.023 fg | 0.283 ± 0.004 i | 2.89 ± 0.26 e | 3.16 ± 0.05 h | |
| 30 | Control | 0.237 ± 0.021 l | 0.259 ± 0.004 o | 2.47 ± 0.22 ij | 2.71 ± 0.04 n |
| Mineral | 0.254 ± 0.023 hi | 0.278 ± 0.004 k | 2.72 ± 0.24 g | 2.98 ± 0.04 j | |
| Nano | 0.267 ± 0.024 cd | 0.292 ± 0.004 f | 3.41 ± 0.30 b | 3.74 ± 0.06 e | |
| 40 | Control | 0.242 ± 0.022 k | 0.266 ± 0.004 n | 2.53 ± 0.22 i | 2.77 ± 0.04 m |
| Mineral | 0.264 ± 0.023 de | 0.289 ± 0.004 g | 3.33 ± 0.30 c | 3.65 ± 0.05 f | |
| Nano | 0.273 ± 0.024 b | 0.299 ± 0.004 c | 3.58 ± 0.32 a | 3.92 ± 0.06 c | |
| 50 | Control | 0.256 ± 0.023 gh | 0.280 ± 0.004 j | 2.80 ± 0.25 f | 3.07 ± 0.05 i |
| Mineral | 0.269 ± 0.024 bc | 0.295 ± 0.004 e | 3.48 ± 0.31 b | 3.81 ± 0.06 d | |
| Nano | 0.278 ± 0.025 a | 0.305 ± 0.005 b | 3.60 ± 0.32 a | 3.95 ± 0.06 b | |
| 60 | Control | 0.262 ± 0.023 ef | 0.287 ± 0.004 h | 3.12 ± 0.28 d | 3.42 ± 0.05 g |
| Mineral | 0.271 ± 0.024 bc | 0.297 ± 0.004 d | 3.49 ± 0.31 b | 3.82 ± 0.06 d | |
| Nano | 0.282 ± 0.025 a | 0.309 ± 0.005 a | 3.63 ± 0.32 a | 3.98 ± 0.06 a | |
| Treatments | Main-Plot | Sub-Plot |
|---|---|---|
| T1 | 0 ton ha−1 vermicompost | 0 g L−1 NPK |
| T2 | 2 g L−1 NPK | |
| T3 | 2 g L−1 Nano-NPK | |
| T4 | 10 ton ha−1 vermicompost | 0 g L−1 NPK |
| T5 | 2 g L−1 NPK | |
| T6 | 2 g L−1 Nano-NPK | |
| T7 | 20 ton ha−1 vermicompost | 0 g L−1 NPK |
| T8 | 2 g L−1 NPK | |
| T9 | 2 g L−1 Nano-NPK | |
| T10 | 30 ton ha−1 vermicompost | 0 g L−1 NPK |
| T11 | 2 g L−1 NPK | |
| T12 | 2 g L−1 Nano-NPK | |
| T13 | 40 ton ha−1 vermicompost | 0 g L−1 NPK |
| T14 | 2 g L−1 NPK | |
| T15 | 2 g L−1 Nano-NPK | |
| T16 | 50 ton ha−1 vermicompost | 0 g L−1 NPK |
| T17 | 2 g L−1 NPK | |
| T18 | 2 g L−1 Nano-NPK | |
| T19 | 60 ton ha−1 vermicompost | 0 g L−1 NPK |
| T20 | 2 g L−1 NPK | |
| T21 | 2 g L−1 Nano-NPK |
| Vermicompost Property | ||
|---|---|---|
| Organic matter | % | 41.57 |
| C | % | 17.02 |
| N | % | 1.82 |
| Mn | % | 0.03 |
| B | mg g−1 | 0.054 |
| Ca | mg g−1 | 19.57 |
| Cu | mg g−1 | 0.25 |
| Fe | mg g−1 | 1.27 |
| Mg | mg g−1 | 6.01 |
| Na | mg g−1 | 1.48 |
| P2O5 | mg g−1 | 4.61 |
| K | mg g−1 | 1.93 |
| Ec | ds m−1 | 1.78 |
| pH | 7.2 | |
| Soil Property | ||
|---|---|---|
| O.M. | 0.75 | |
| Sand | % | 65.3 |
| Silt | % | 15.8 |
| Clay | % | 18.9 |
| Texture class | Sandy clay loam | |
| pH | 8.51 | |
| Ec | ds m−1 | 1.72 |
| N | % | 0.032 |
| P2O4 | mg g−1 | 0.004 |
| K+ | mg g−1 | 0.287 |
| Fe | mg g−1 | 0.0038 |
| Zn | mg g−1 | 0.0014 |
| Mn | mg g−1 | 0.0035 |
| Cu | mg g−1 | 0.00059 |
| B | mg g−1 | 0.0003 |
Publisher’s Note: MDPI stays neutral with regard to jurisdictional claims in published maps and institutional affiliations. |
© 2022 by the authors. Licensee MDPI, Basel, Switzerland. This article is an open access article distributed under the terms and conditions of the Creative Commons Attribution (CC BY) license (https://creativecommons.org/licenses/by/4.0/).
Share and Cite
Atteya, A.K.G.; Albalawi, A.N.; Bayomy, H.M.; Alamri, E.S.; Genaidy, E.A.E. Maximizing Leaves, Inflorescences, and Chemical Composition Production of Moringa oleifera Trees under Calcareous Soil Conditions. Plants 2022, 11, 234. https://doi.org/10.3390/plants11020234
Atteya AKG, Albalawi AN, Bayomy HM, Alamri ES, Genaidy EAE. Maximizing Leaves, Inflorescences, and Chemical Composition Production of Moringa oleifera Trees under Calcareous Soil Conditions. Plants. 2022; 11(2):234. https://doi.org/10.3390/plants11020234
Chicago/Turabian StyleAtteya, Amira K. G., Aishah N. Albalawi, Hala M. Bayomy, Eman S. Alamri, and Esmail A. E. Genaidy. 2022. "Maximizing Leaves, Inflorescences, and Chemical Composition Production of Moringa oleifera Trees under Calcareous Soil Conditions" Plants 11, no. 2: 234. https://doi.org/10.3390/plants11020234
APA StyleAtteya, A. K. G., Albalawi, A. N., Bayomy, H. M., Alamri, E. S., & Genaidy, E. A. E. (2022). Maximizing Leaves, Inflorescences, and Chemical Composition Production of Moringa oleifera Trees under Calcareous Soil Conditions. Plants, 11(2), 234. https://doi.org/10.3390/plants11020234