
In Silico and In Vitro Study of Isoquercitrin against Kidney Cancer and Inflammation by Triggering Potential Gene Targets

 , ,
, ,  , and
, and
Abstract
1. Introduction
2. Materials and Methods
2.1. Selection of Gene Targets and Molecular Docking Study
2.2. Molecular Dynamic (MD) Simulation
2.3. Investigation of Fee-Binding Energy by Prime MM-GBSA
2.4. Kyoto Encyclopedia of Genes and Genomes (KEGG) and Gene Ontology (GO) Databases
2.5. Cell Culture
2.6. Cell Viability, Proliferation, and Cytotoxicity Measured by MTT Assay
2.7. In Vitro Validation by Reverse Transcription Polymerase Chain Reaction (RT-PCR)
2.8. qRT-PCR Assay Validation
3. Results
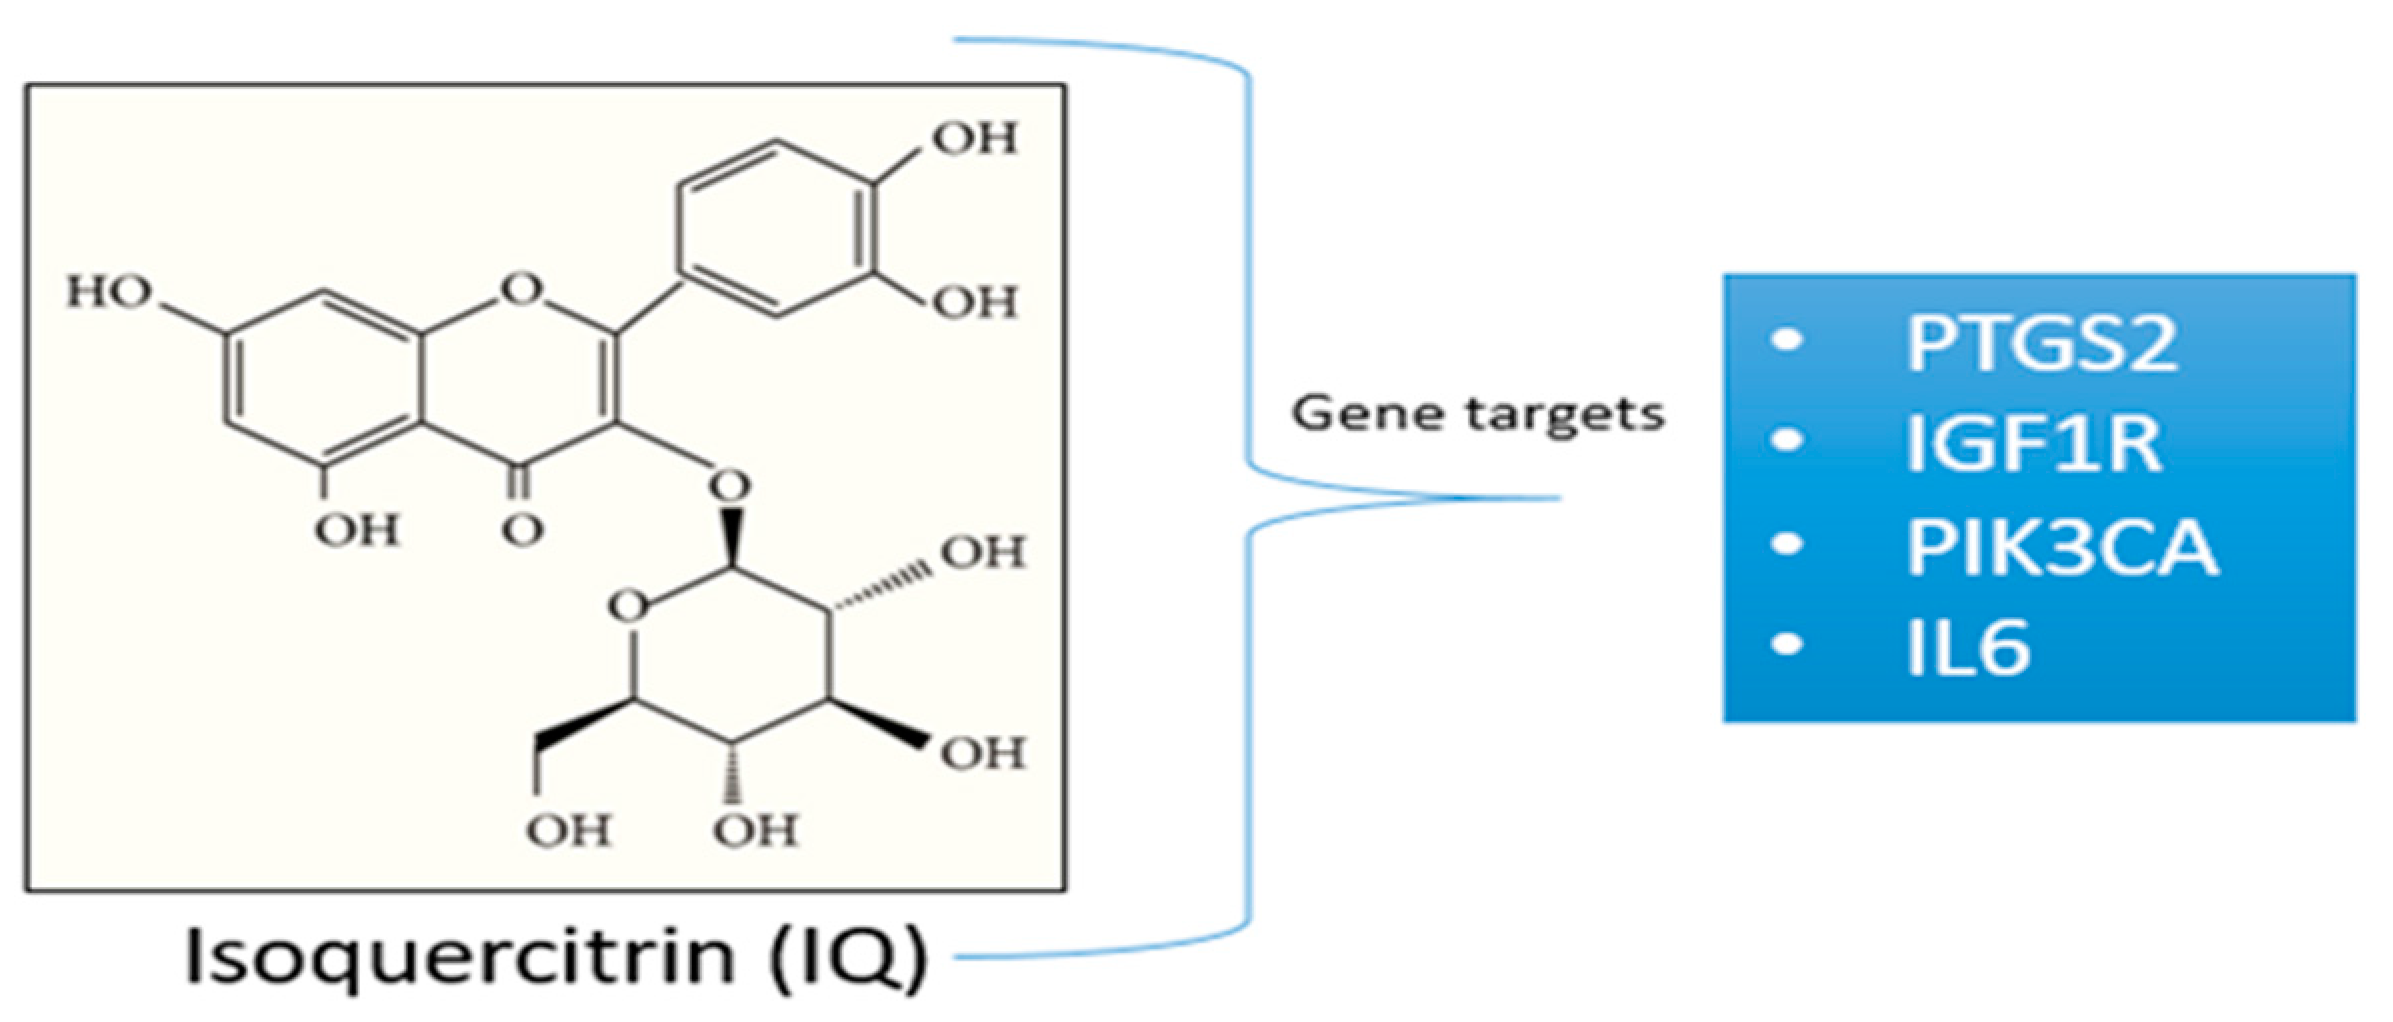
3.1. Gene Targets from the Previous Study
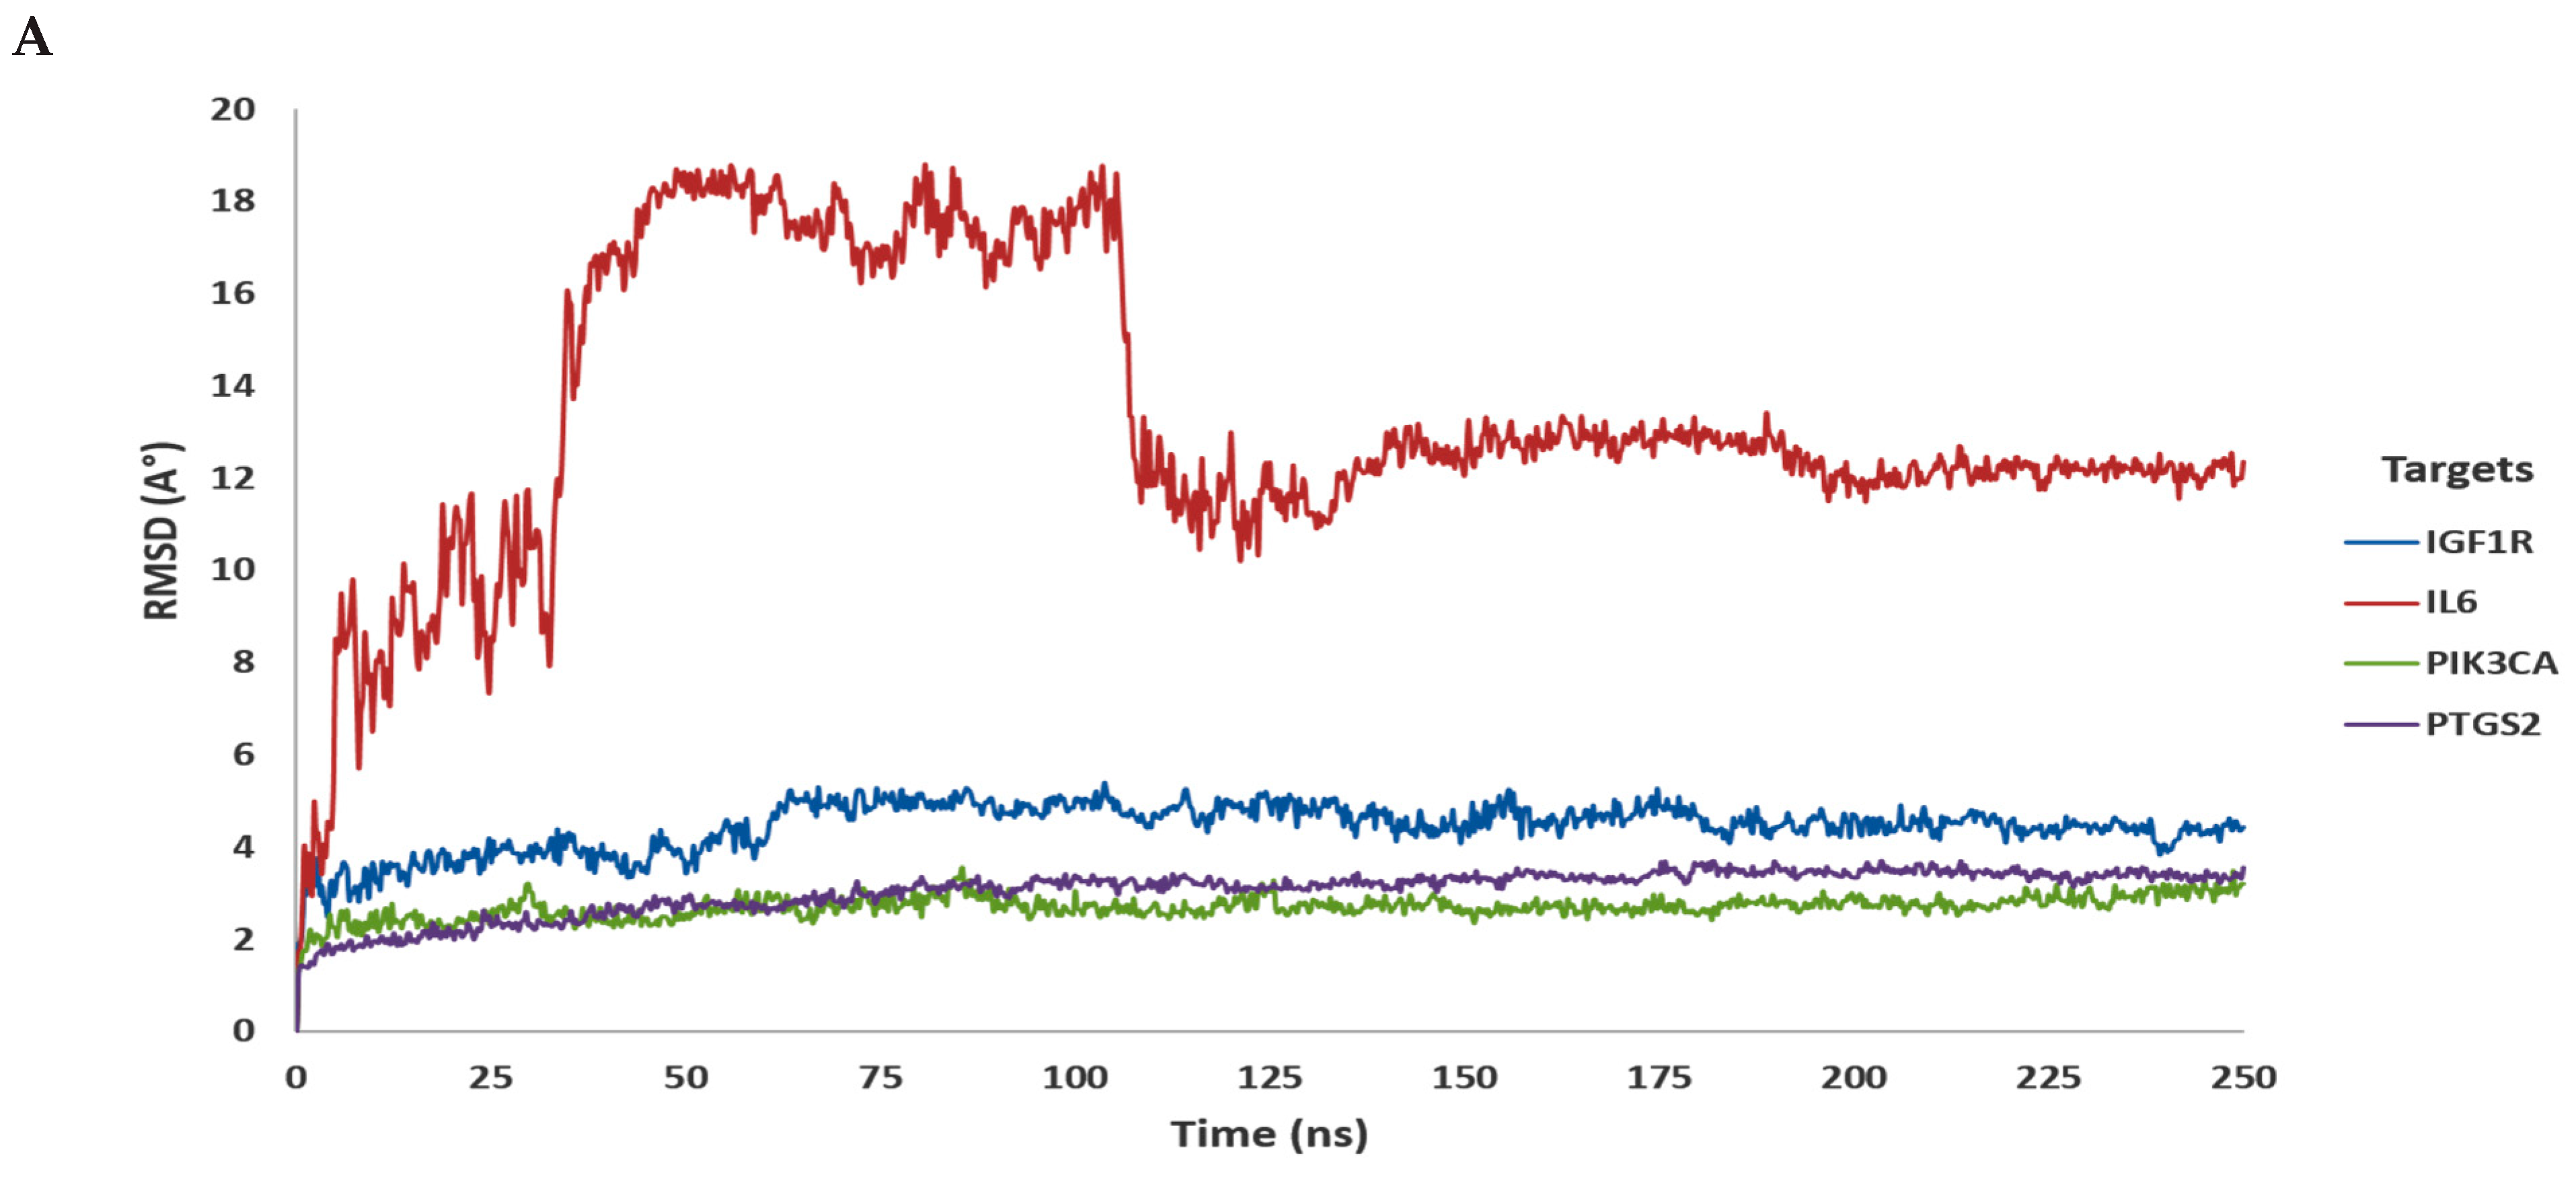
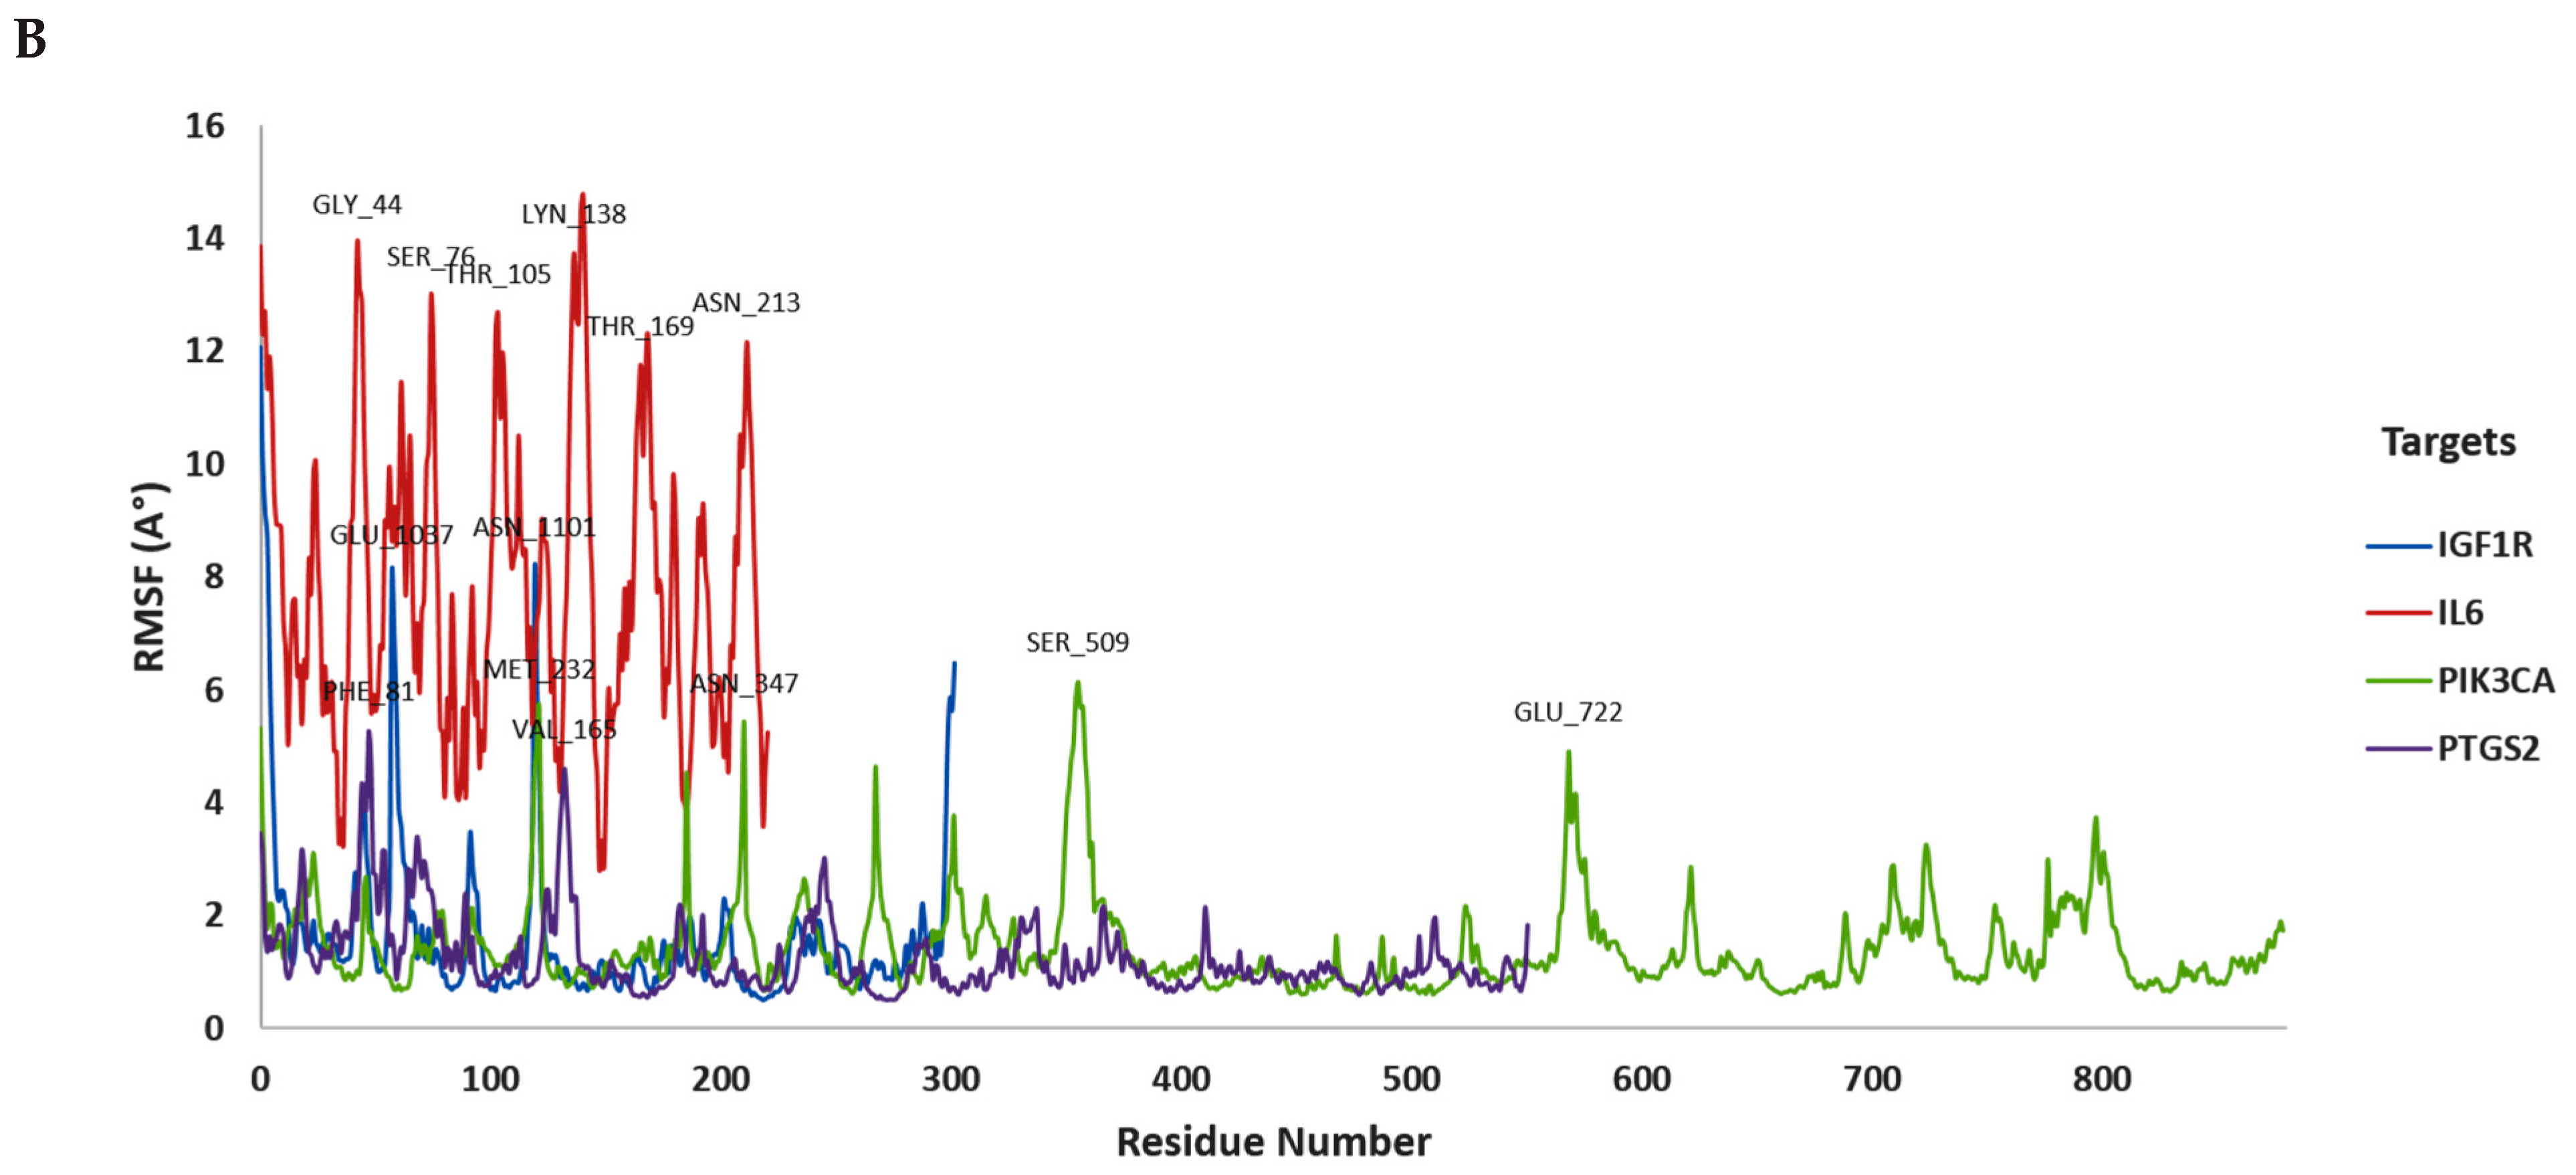
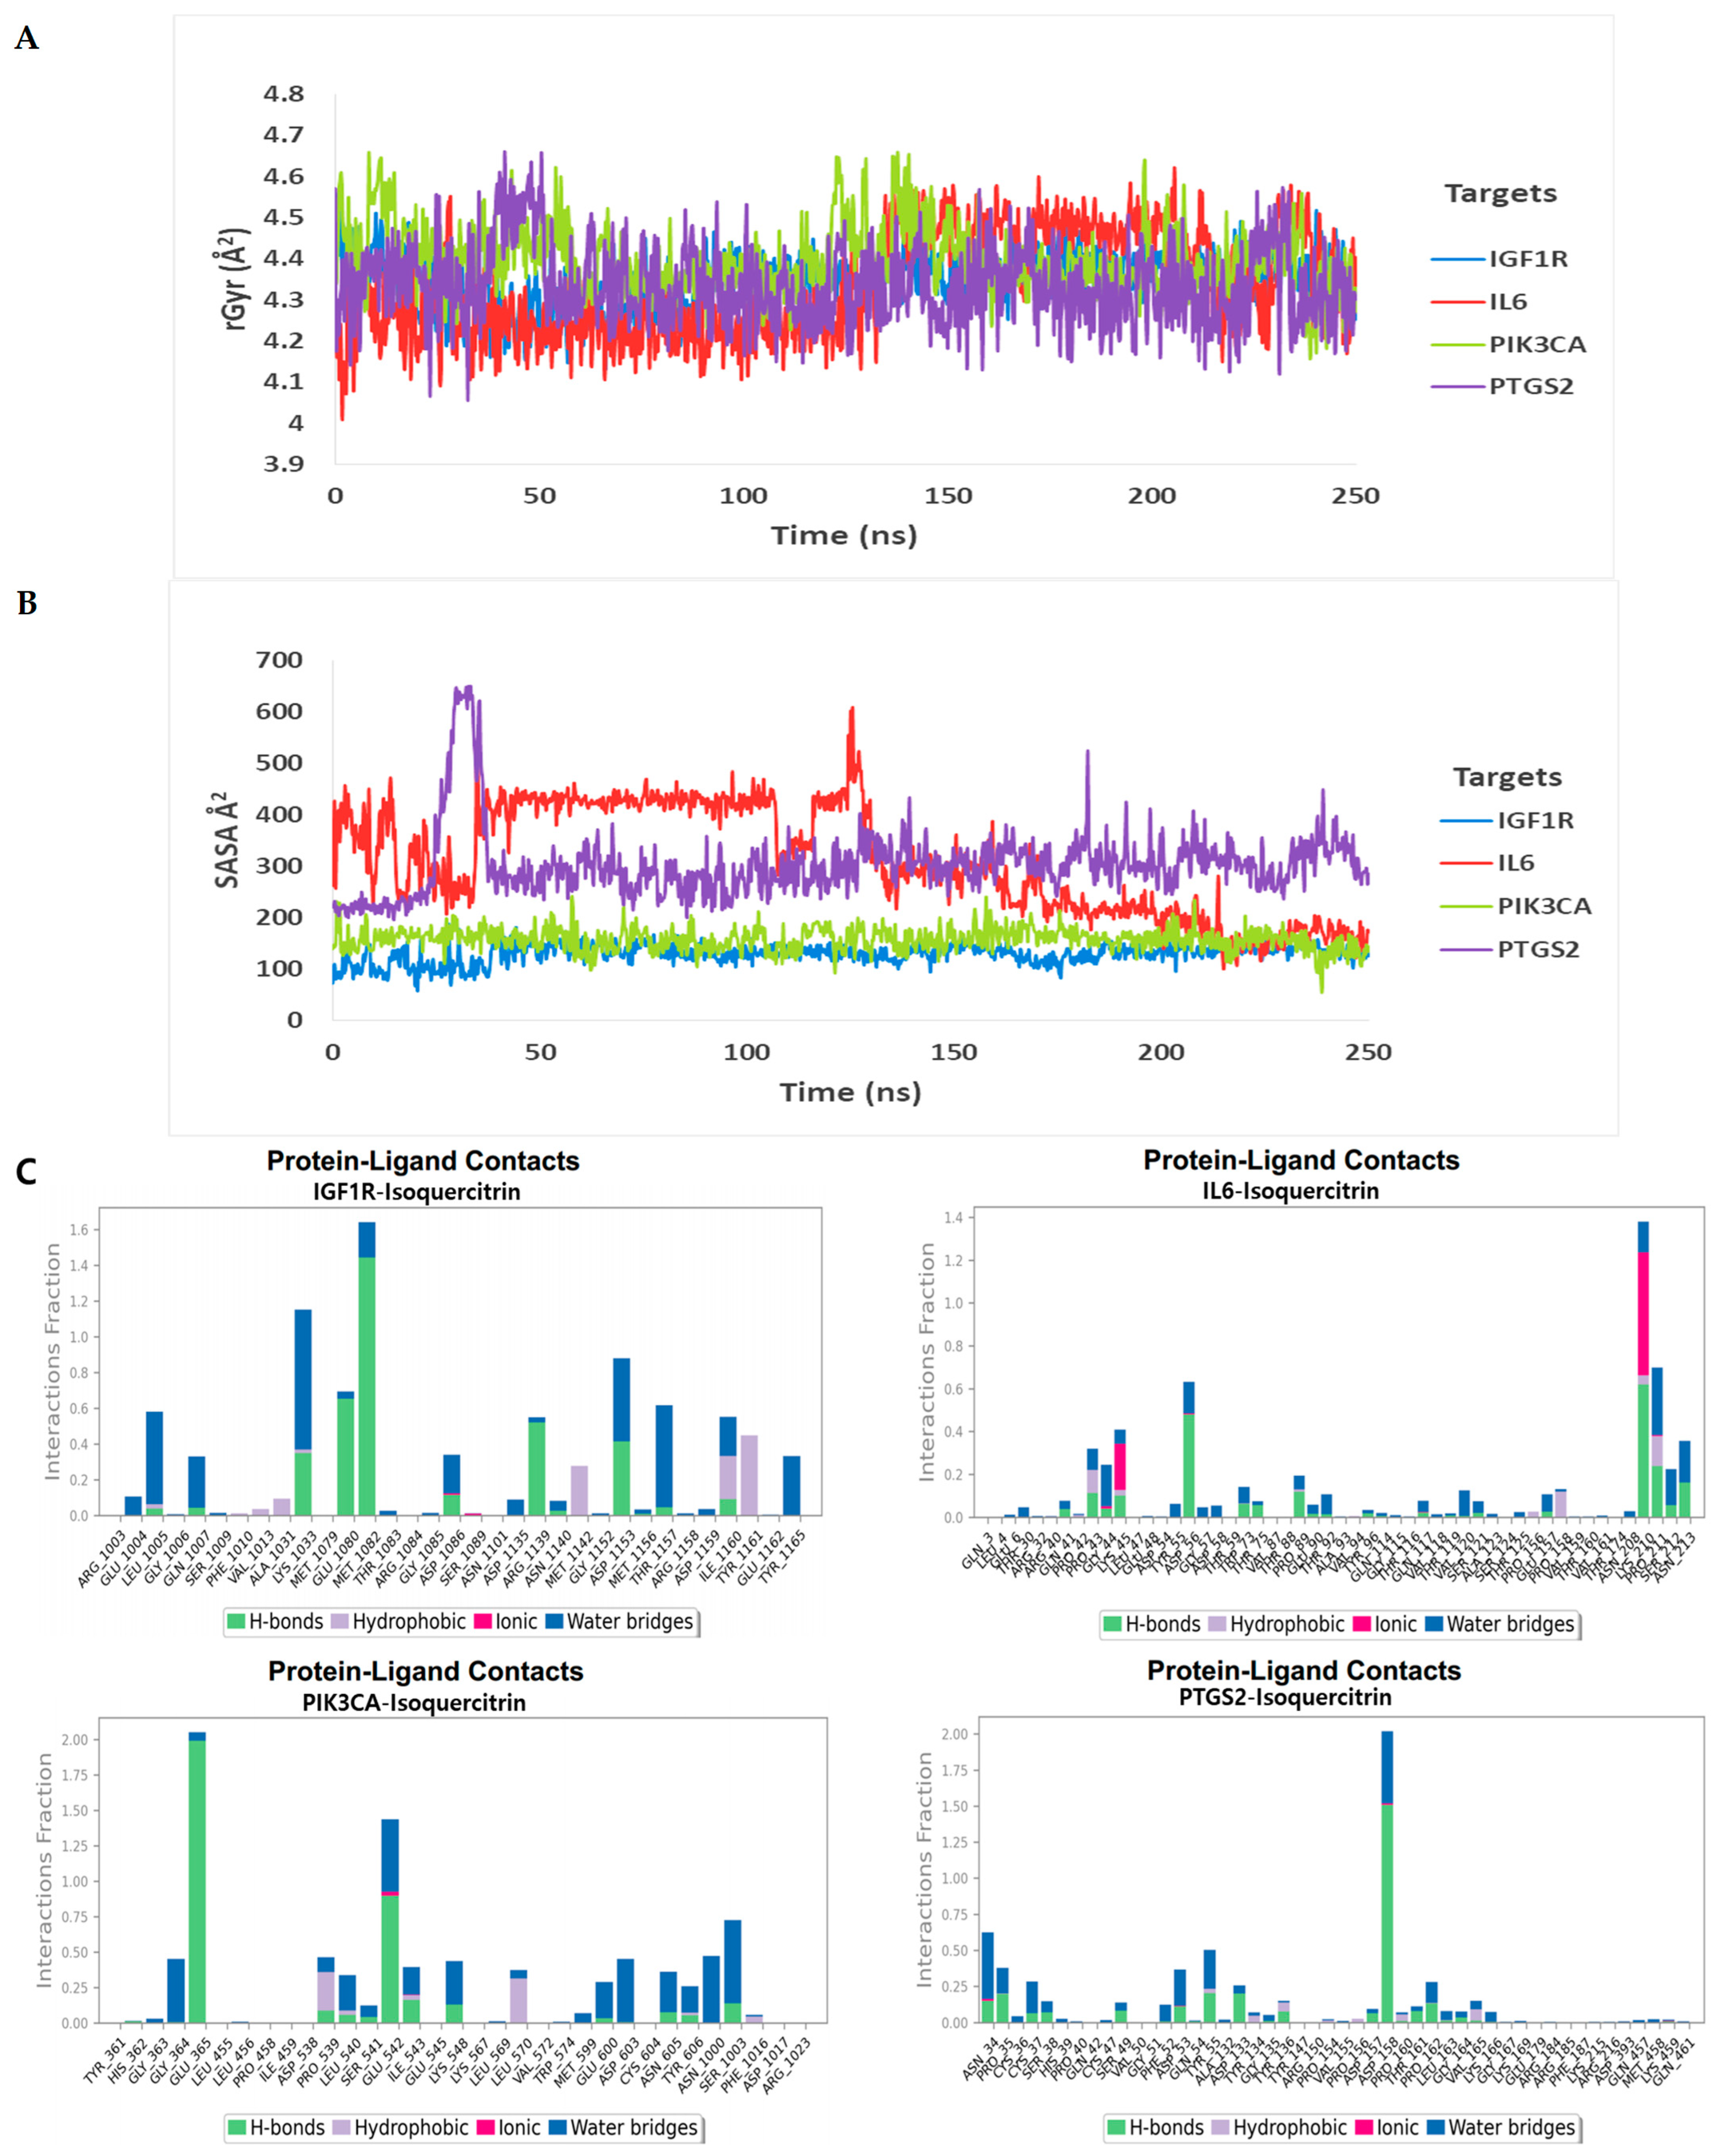
3.2. In Silico Molecular Dynamic (MD) Simulation
3.3. Molecular Mechanics-Generalized Born Surface Area (MM-GBSA) Analysis
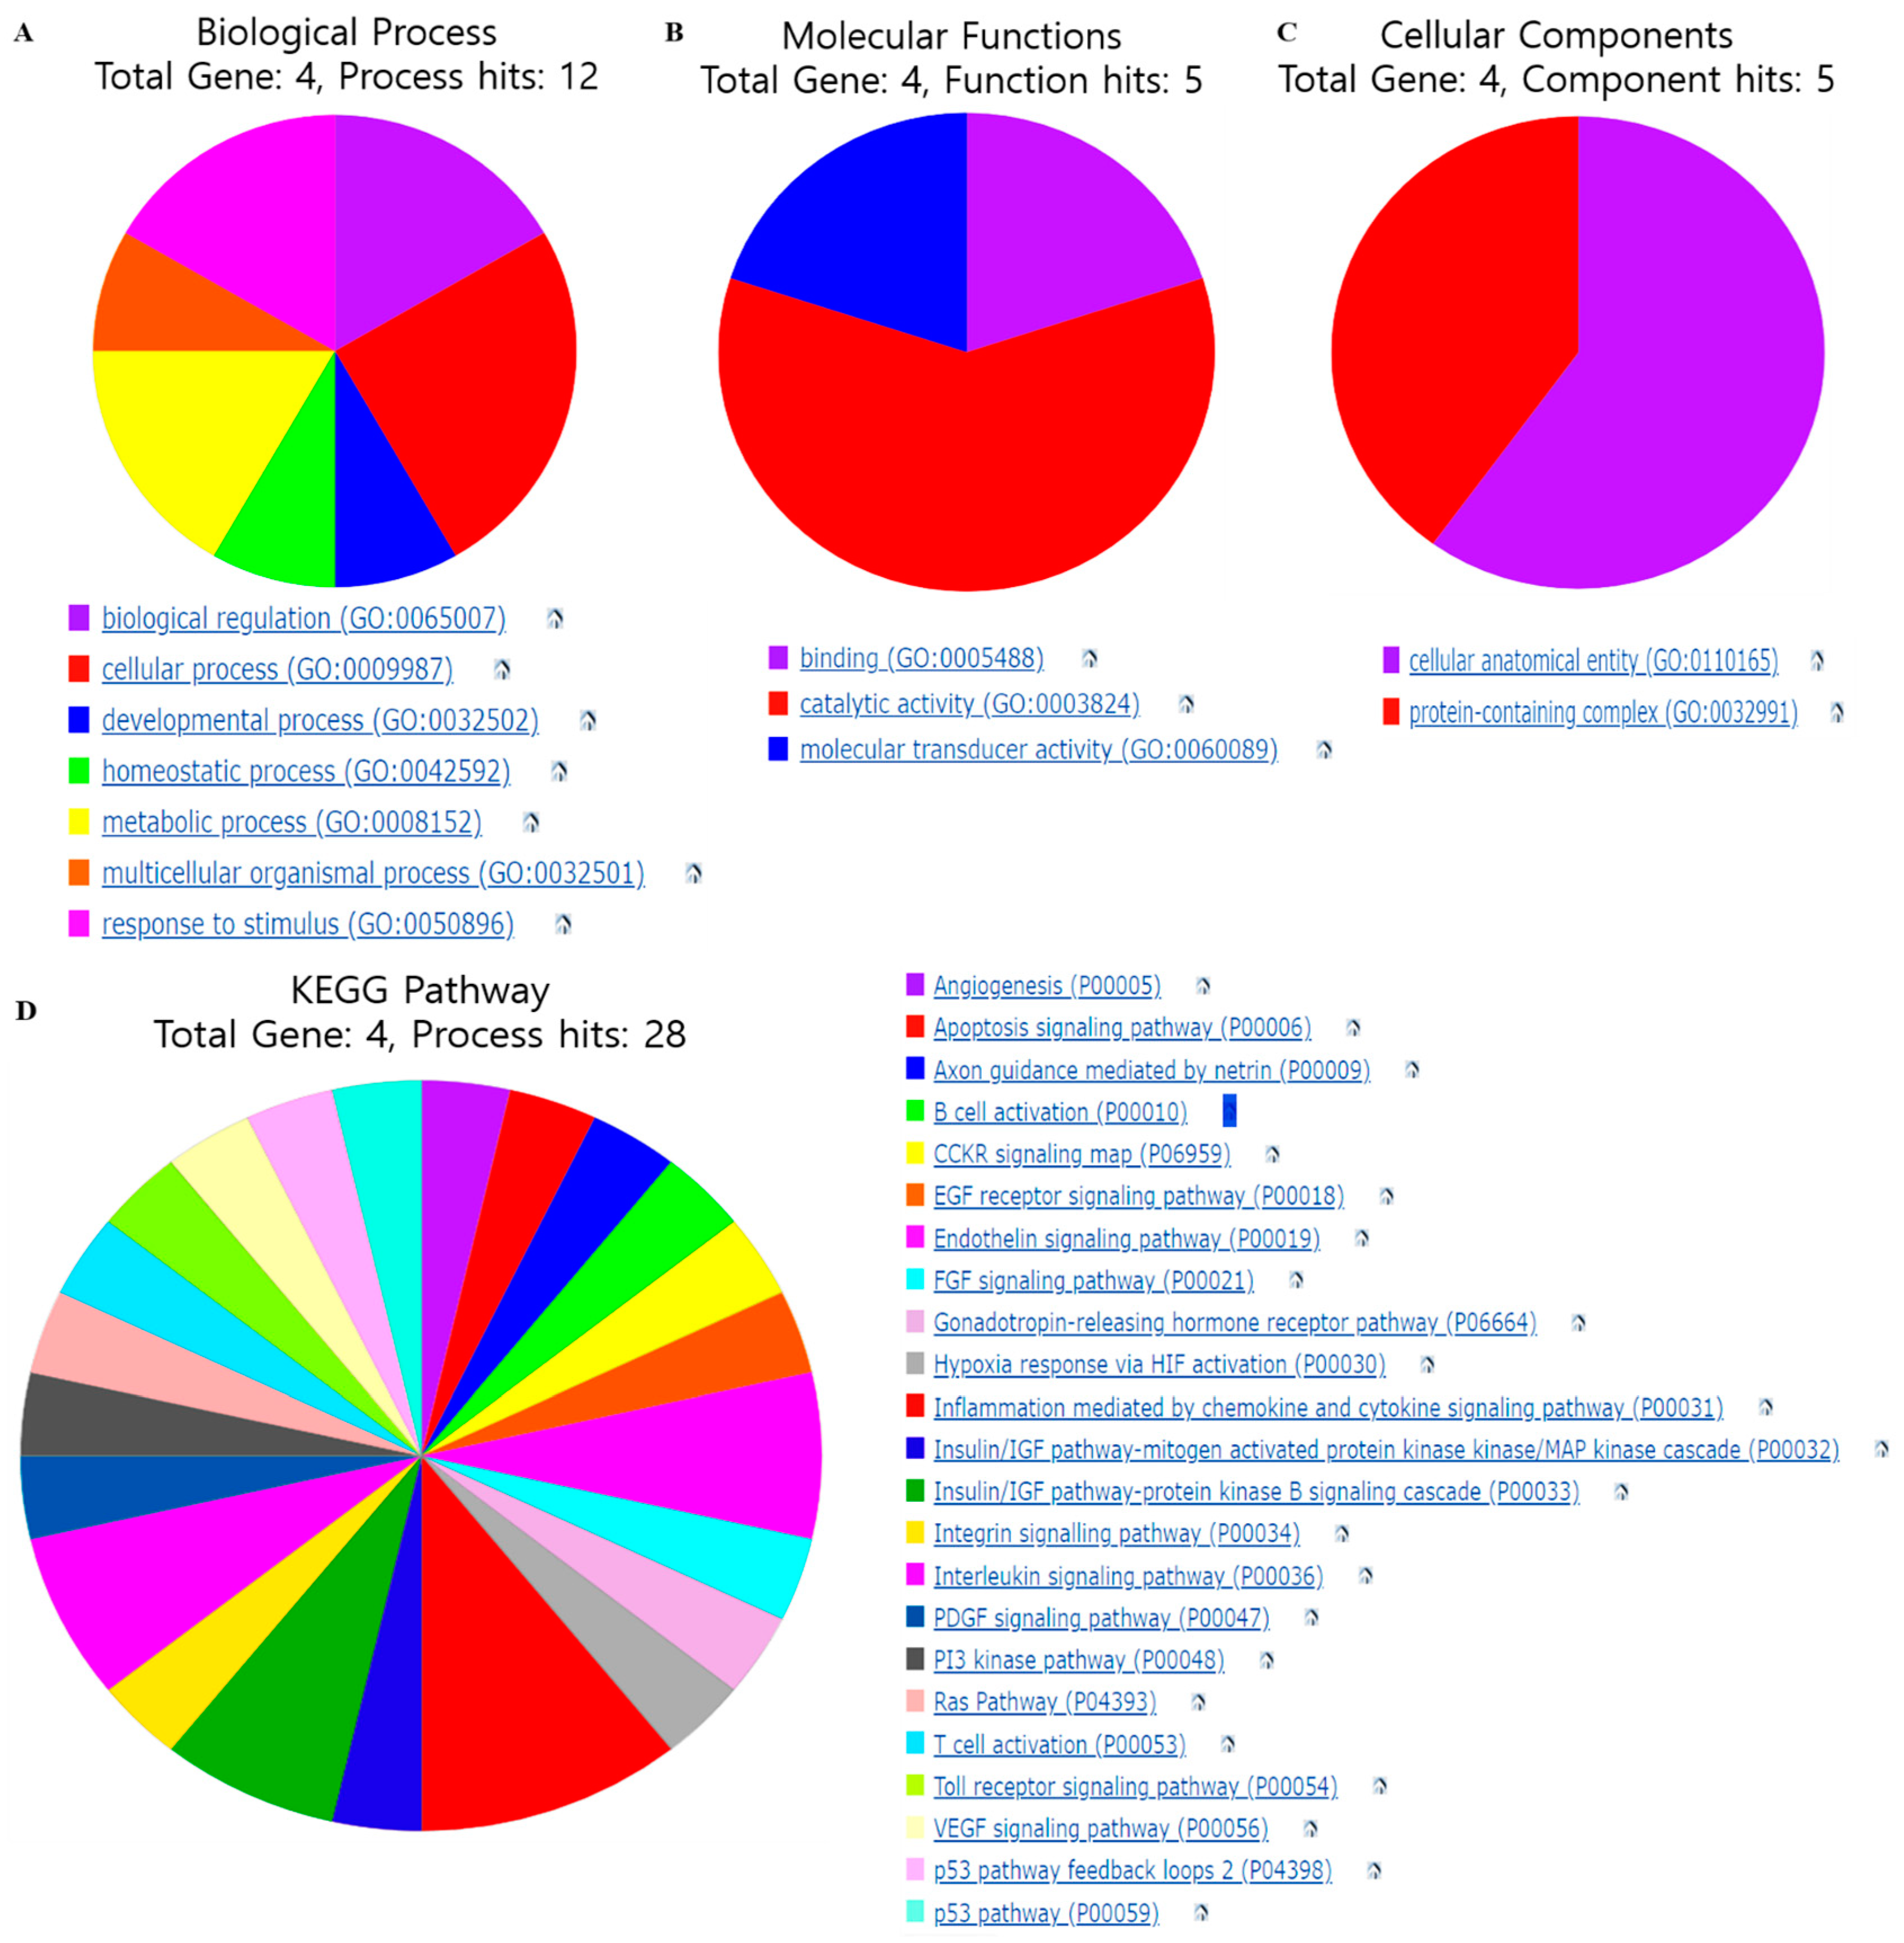
3.4. Gene Function and Pathways Regulated by Selected Gene Targets
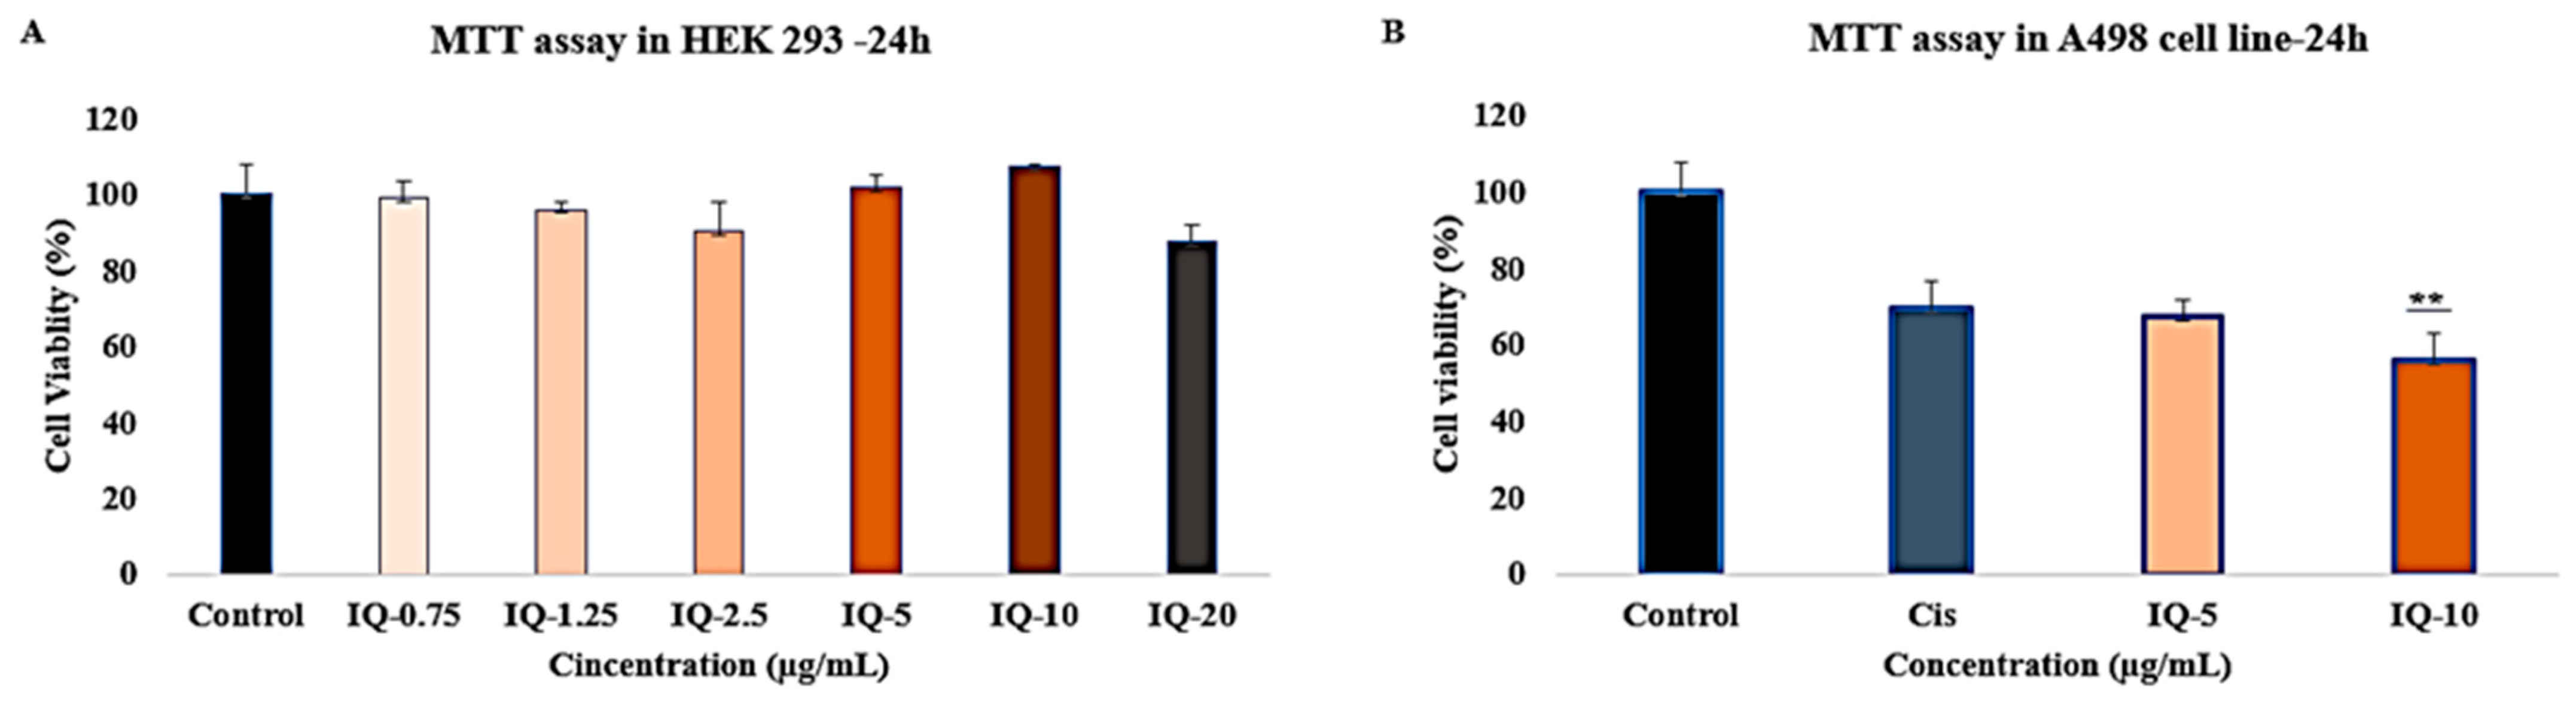
3.5. Cytotoxicity Effects of Isoquercitrin
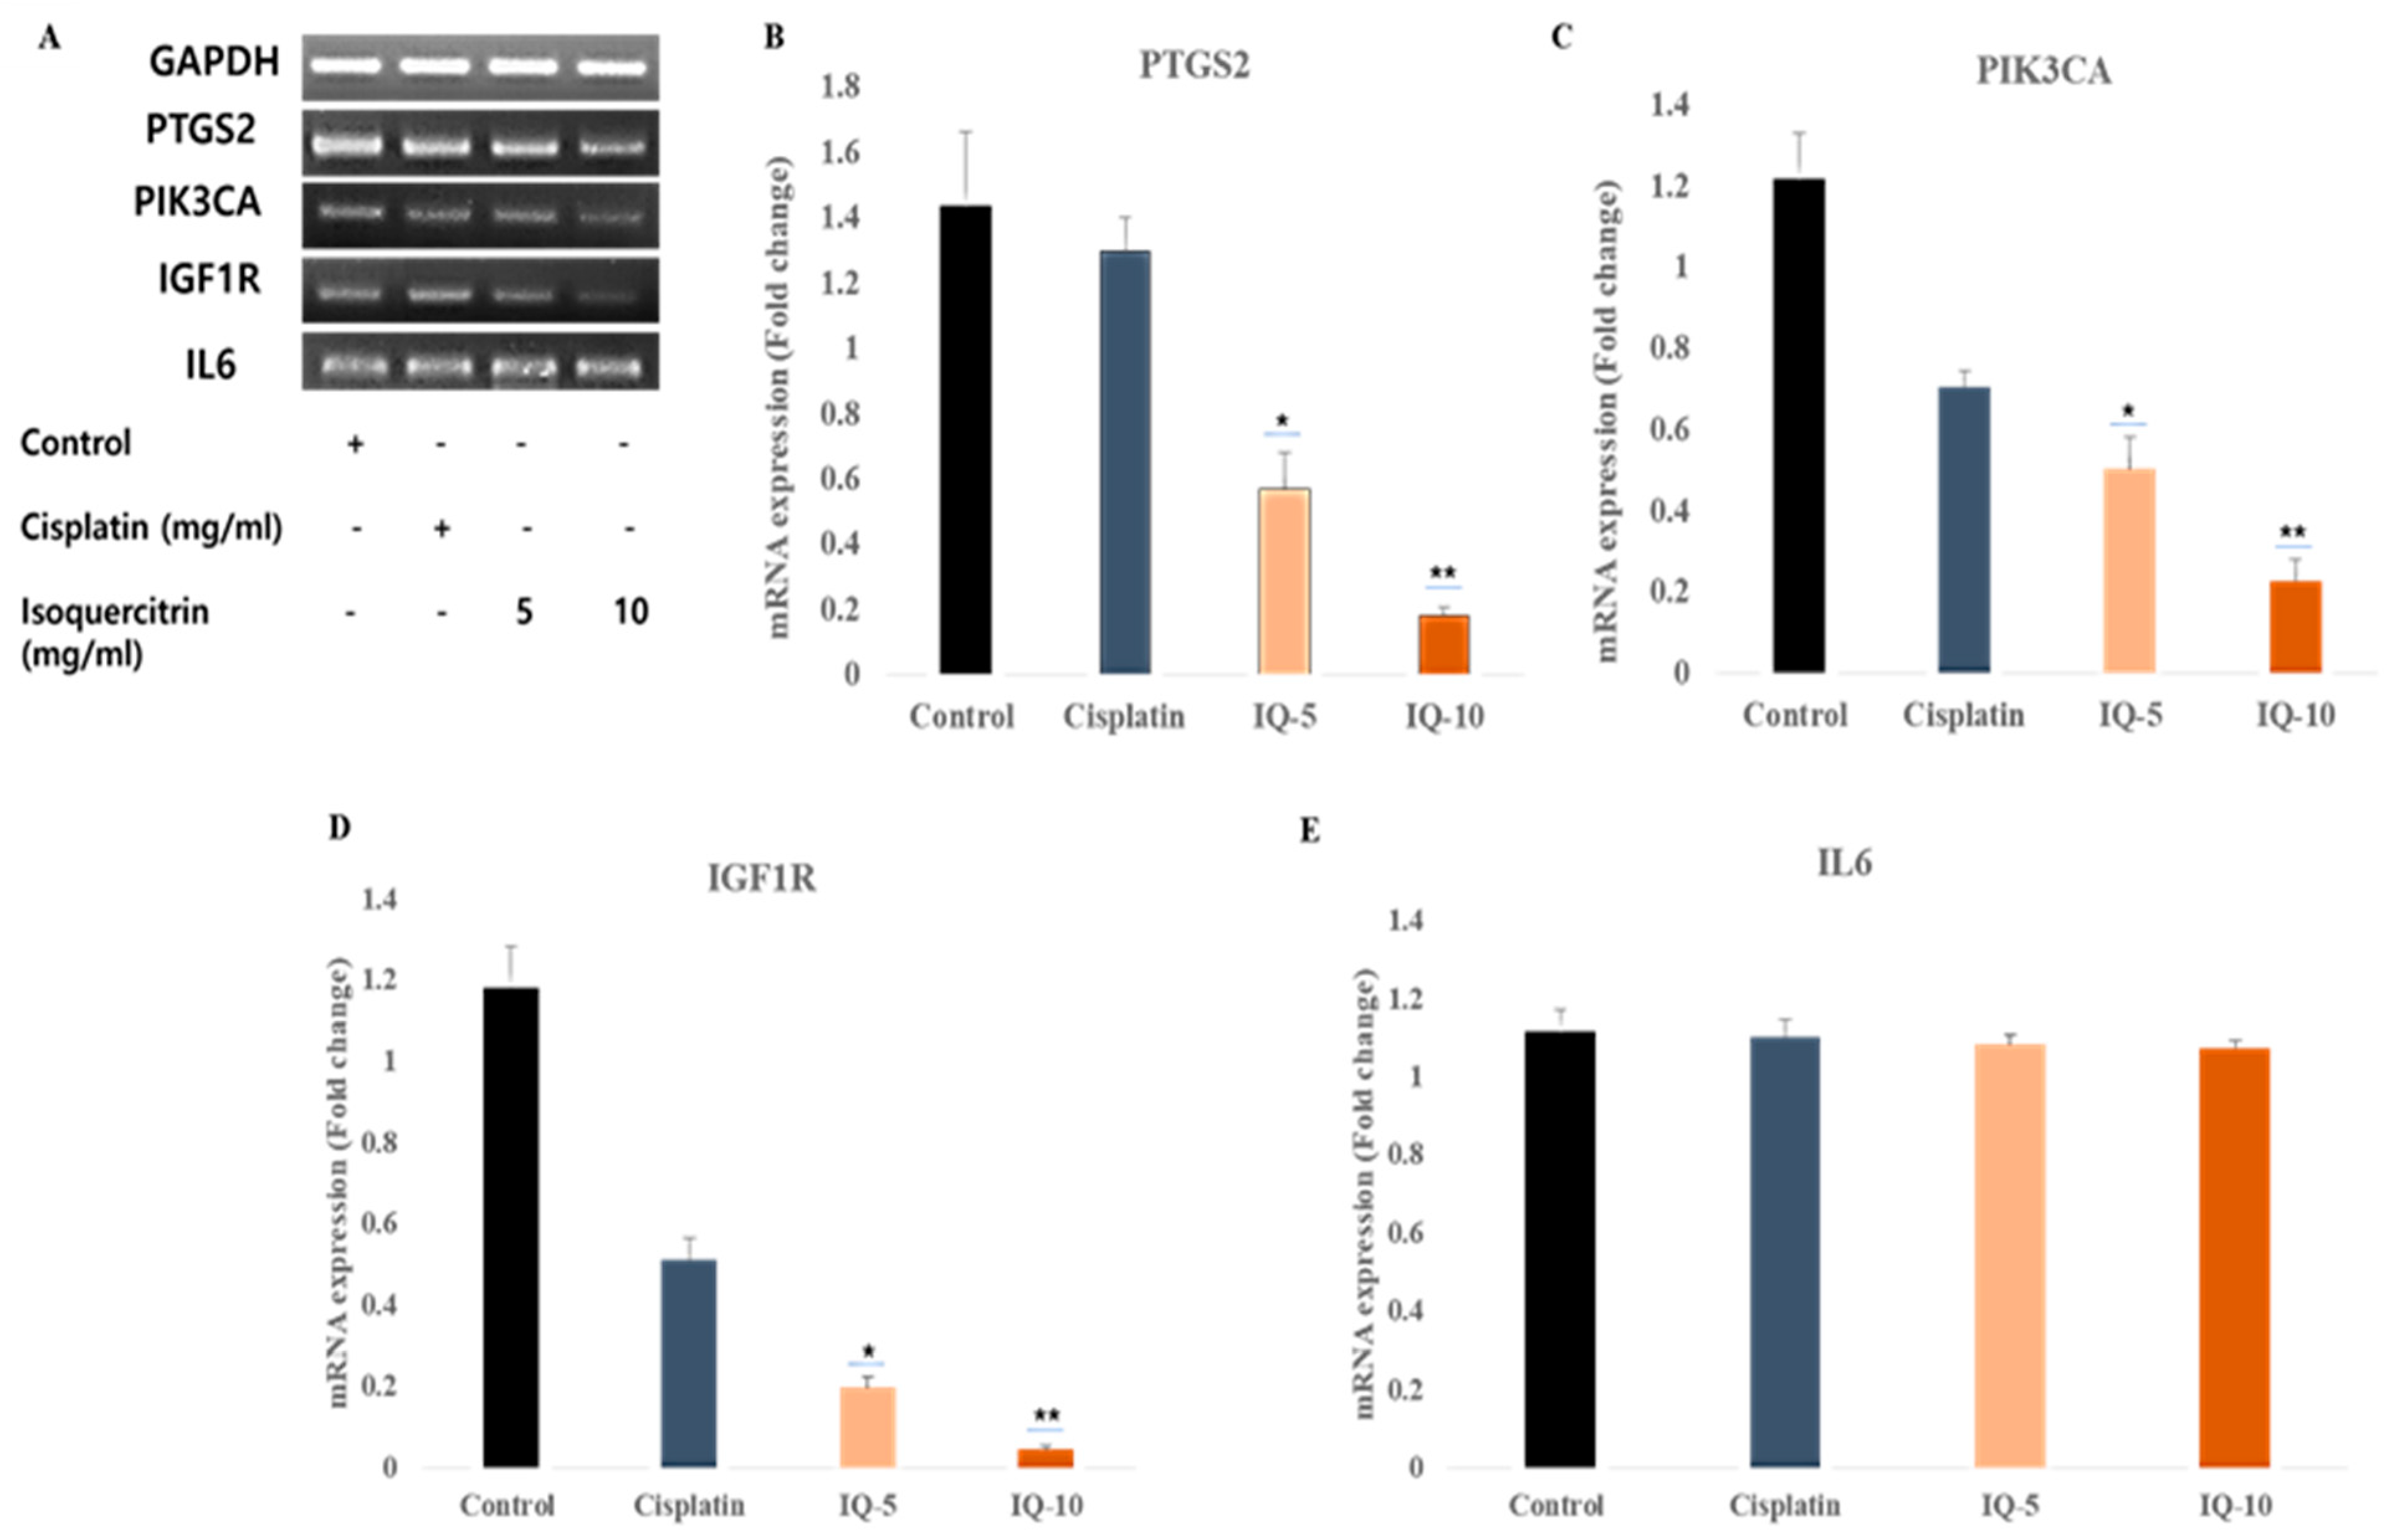
3.6. Isoquercitrin Controls the Gene Expression of the Selective Gene Targets
4. Discussion
5. Conclusions
Supplementary Materials
Author Contributions
Funding
Institutional Review Board Statement
Informed Consent Statement
Data Availability Statement
Conflicts of Interest
References
- Miller, K.D.; Goding Sauer, A.; Ortiz, A.P.; Fedewa, S.A.; Pinheiro, P.S.; Tortolero-Luna, G.; Martinez-Tyson, D.; Jemal, A.; Siegel, R.L. Cancer Statistics for Hispanics/Latinos, 2018. CA Cancer J. Clin. 2018, 68, 425–445. [Google Scholar] [CrossRef]
- Hsieh, J.J.; Purdue, M.P.; Signoretti, S.; Swanton, C.; Albiges, L.; Schmidinger, M.; Heng, D.Y.; Larkin, J.; Ficarra, V. Renal cell carcinoma. Nat. Rev. Dis. Primers 2017, 3, 17009. [Google Scholar] [CrossRef]
- Bahadoram, S.; Davoodi, M.; Hassanzadeh, S.; Bahadoram, M.; Barahman, M.; Mafakher, L. Renal cell carcinoma: An overview of the epidemiology, diagnosis, and treatment. G. Ital. Nefrol. 2022, 39, 1. [Google Scholar]
- Motzer, R.J.; Jonasch, E.; Agarwal, N.; Alva, A.; Bagshaw, H.; Baine, M.; Beckermann, K.; Carlo, M.I.; Choueiri, T.K.; Costello, B.A.; et al. NCCN Guidelines® Insights: Kidney Cancer, Version 2.2024. J. Natl. Compr. Cancer Netw. 2024, 22, 4–16. [Google Scholar] [CrossRef]
- Siegel, R.L.; Giaquinto, A.N.; Jemal, A. Cancer statistics, 2024. CA Cancer J. Clin. 2024, 74, 12–49. [Google Scholar] [CrossRef]
- Karim, M.R.; Morshed, M.N.; Iqbal, S.; Mohammad, S.; Mathiyalagan, R.; Yang, D.C.; Kim, Y.J.; Song, J.H.; Yang, D.U. A Network Pharmacology and Molecular-Docking-Based Approach to Identify the Probable Targets of Short-Chain Fatty-Acid-Producing Microbial Metabolites against Kidney Cancer and Inflammation. Biomolecules 2023, 13, 1678. [Google Scholar] [CrossRef]
- Valentová, K.; Vrba, J.; Bancířová, M.; Ulrichová, J.; Křen, V. Isoquercitrin: Pharmacology, toxicology, and metabolism. Food Chem. Toxicol. 2014, 68, 267–282. [Google Scholar] [CrossRef]
- Boligon, A.A.; Sagrillo, M.R.; Machado, L.F.; de Souza Filho, O.; Machado, M.M.; da Cruz, I.B.; Athayde, M.L. Protective effects of extracts and flavonoids isolated from Scutia buxifolia Reissek against chromosome damage in human lymphocytes exposed to hydrogen peroxide. Molecules 2012, 17, 5757–5769. [Google Scholar] [CrossRef]
- Jung, S.H.; Kim, B.J.; Lee, E.H.; Osborne, N.N. Isoquercitrin is the most effective antioxidant in the plant Thuja orientalis and able to counteract oxidative-induced damage to a transformed cell line (RGC-5 cells). Neurochem. Int. 2010, 57, 713–721. [Google Scholar] [CrossRef]
- Procházková, D.; Boušová, I.; Wilhelmová, N. Antioxidant and prooxidant properties of flavonoids. Fitoterapia 2011, 82, 513–523. [Google Scholar] [CrossRef]
- Reuter, S.; Gupta, S.C.; Chaturvedi, M.M.; Aggarwal, B.B. Oxidative stress, inflammation, and cancer: How are they linked? Free Radic. Biol. Med. 2010, 49, 1603–1616. [Google Scholar] [CrossRef]
- Amado, N.G.; Predes, D.; Fonseca, B.F.; Cerqueira, D.M.; Reis, A.H.; Dudenhoeffer, A.C.; Borges, H.L.; Mendes, F.A.; Abreu, J.G. Isoquercitrin suppresses colon cancer cell growth in vitro by targeting the Wnt/β-catenin signaling pathway. J. Biol. Chem. 2014, 289, 35456–35467. [Google Scholar] [CrossRef]
- Ali Syeda, Z.; Langden, S.S.S.; Munkhzul, C.; Lee, M.; Song, S.J. Regulatory Mechanism of MicroRNA Expression in Cancer. Int. J. Mol. Sci. 2020, 21, 1723. [Google Scholar] [CrossRef]
- Sastry, G.M.; Adzhigirey, M.; Day, T.; Annabhimoju, R.; Sherman, W. Protein and ligand preparation: Parameters, protocols, and influence on virtual screening enrichments. J. Comput. Aided Mol. Des. 2013, 27, 221–234. [Google Scholar] [CrossRef]
- Baral, K.; Adhikari, P.; Jawad, B.; Podgornik, R.; Ching, W.Y. Solvent Effect on the Structure and Properties of RGD Peptide (1FUV) at Body Temperature (310 K) Using Ab Initio Molecular Dynamics. Polymers 2021, 13, 3434. [Google Scholar] [CrossRef]
- Mahdavi, M.; Fattahi, A.; Tajkhorshid, E.; Nouranian, S. Molecular Insights into the Loading and Dynamics of Doxorubicin on PEGylated Graphene Oxide Nanocarriers. ACS Appl. Bio Mater. 2020, 3, 1354–1363. [Google Scholar] [CrossRef]
- Lyne, P.D.; Lamb, M.L.; Saeh, J.C. Accurate prediction of the relative potencies of members of a series of kinase inhibitors using molecular docking and MM-GBSA scoring. J. Med. Chem. 2006, 49, 4805–4808. [Google Scholar] [CrossRef]
- Genheden, S.; Ryde, U. The MM/PBSA and MM/GBSA methods to estimate ligand-binding affinities. Expert. Opin. Drug Discov. 2015, 10, 449–461. [Google Scholar] [CrossRef]
- Mi, H.; Muruganujan, A.; Casagrande, J.T.; Thomas, P.D. Large-scale gene function analysis with the PANTHER classification system. Nat. Protoc. 2013, 8, 1551–1566. [Google Scholar] [CrossRef]
- Mi, H.; Muruganujan, A.; Huang, X.; Ebert, D.; Mills, C.; Guo, X.; Thomas, P.D. Protocol Update for large-scale genome and gene function analysis with the PANTHER classification system (v.14.0). Nat. Protoc. 2019, 14, 703–721. [Google Scholar] [CrossRef]
- Turajlic, S.; Swanton, C.; Boshoff, C. Kidney cancer: The next decade. J. Exp. Med. 2018, 215, 2477–2479. [Google Scholar] [CrossRef]
- Maher, E.R. Hereditary renal cell carcinoma syndromes: Diagnosis, surveillance and management. World J. Urol. 2018, 36, 1891–1898. [Google Scholar] [CrossRef] [PubMed]
- Zou, C.; Xu, F.; Shen, J.; Xu, S. Identification of a Ferroptosis-Related Prognostic Gene PTGS2 Based on Risk Modeling and Immune Microenvironment of Early-Stage Cervical Cancer. J. Oncol. 2022, 2022, 3997562. [Google Scholar] [CrossRef] [PubMed]
- Zahedi, T.; Hosseinzadeh Colagar, A.; Mahmoodzadeh, H. PTGS2 Over-Expression: A Colorectal Carcinoma Initiator not an Invasive Factor. Rep. Biochem. Mol. Biol. 2021, 9, 442–451. [Google Scholar] [CrossRef] [PubMed]
- Goos, J.A.; Hiemstra, A.C.; Coupé, V.M.; Diosdado, B.; Kooijman, W.; Delis-Van Diemen, P.M.; Karga, C.; Beliën, J.A.; Menke-van der Houven van Oordt, C.W.; Geldof, A.A.; et al. Epidermal growth factor receptor (EGFR) and prostaglandin-endoperoxide synthase 2 (PTGS2) are prognostic biomarkers for patients with resected colorectal cancer liver metastases. Br. J. Cancer 2014, 111, 749–755. [Google Scholar] [CrossRef]
- Wang, P.; Mak, V.C.; Cheung, L.W. Drugging IGF-1R in cancer: New insights and emerging opportunities. Genes Dis. 2023, 10, 199–211. [Google Scholar] [CrossRef]
- Alfaro-Arnedo, E.; López, I.P.; Piñeiro-Hermida, S.; Canalejo, M.; Gotera, C.; Sola, J.J.; Roncero, A.; Peces-Barba, G.; Ruíz-Martínez, C.; Pichel, J.G. IGF1R acts as a cancer-promoting factor in the tumor microenvironment facilitating lung metastasis implantation and progression. Oncogene 2022, 41, 3625–3639. [Google Scholar] [CrossRef]
- Huang, B.; Lang, X.; Li, X. The role of IL-6/JAK2/STAT3 signaling pathway in cancers. Front. Oncol. 2022, 12, 1023177. [Google Scholar] [CrossRef]
- Owczarek-Januszkiewicz, A.; Magiera, A.; Olszewska, M.A. Enzymatically Modified Isoquercitrin: Production, Metabolism, Bioavailability, Toxicity, Pharmacology, and Related Molecular Mechanisms. Int. J. Mol. Sci. 2022, 23, 14784. [Google Scholar] [CrossRef]
- Baildya, N.; Khan, A.A.; Ghosh, N.N.; Dutta, T.; Chattopadhyay, A.P. Screening of potential drug from Azadirachta Indica (Neem) extracts for SARS-CoV-2: An insight from molecular docking and MD-simulation studies. J. Mol. Struct. 2021, 1227, 129390. [Google Scholar] [CrossRef]
- Mahmud, S.; Rahman, E.; Nain, Z.; Billah, M.; Karmakar, S.; Mohanto, S.C.; Paul, G.K.; Amin, A.; Acharjee, U.K.; Saleh, M.A. Computational discovery of plant-based inhibitors against human carbonic anhydrase IX and molecular dynamics simulation. J. Biomol. Struct. Dyn. 2021, 39, 2754–2770. [Google Scholar] [CrossRef] [PubMed]


| Compound | Gene Target | Docking Score | Hydrogen Bond | Other Bonds | Docking Structure |
|---|---|---|---|---|---|
| Isoquercitrin | PTGS2 | −9.5 | TYR 136, ASN 34 | PRO 153, CYS 36, ASP 133 | 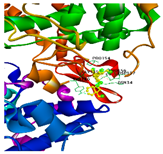 |
| PIK3CA | −8.4 | GLN 682, LYN 678, SER 464, ASN 428 | ASP 133 | 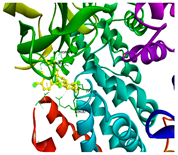 | |
| IGF1R | −7.9 | MET 1082, MET 1156, THR 1083 | GLY 1085, ARG 1084, LEU 1005, SER 1089 | 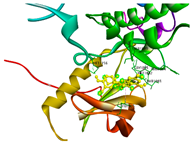 | |
| IL6 | −7.9 | ALA 177, GLN 144, GLY 43, THR 44 | VAL 94, GLU 157, PRO 176 |  |
| Complex | Isoquercitrin–IGF1R | Isoquercitrin–PIK3CA | Isoquercitrin–PTGS2 | Isoquercitrin–IL6 |
|---|---|---|---|---|
| Total ΔG Bind (NS) Kcal/mol | −40.41 | −54.81 | −42.60 | −21.82 |
| ΔG Bind(NS) Coulomb Kcal/mol | −27.18 | −44.49 | −58.85 | −20.61 |
| ΔG Bind Covalent Kcal/mol | 12.21 | 5.09 | 9.90 | 5.13 |
| ΔG Bind(NS) Hbond Kcal/mol | −2.55 | −6.21 | −4.74 | −1.99 |
| ΔG Bind(NS) Lipo Kcal/mol | −12.87 | −12.50 | −7.34 | −4.84 |
| ΔG Bind(NS) vdW Kcal/mol | −40.03 | −46.01 | −32.44 | −25.80 |
| ΔG Bind(NS) Solv GB Kcal/mol | 30.01 | 49.82 | 50.94 | 28.18 |
| Ligand stain energy Kcal/mol | 20.952 | 8.794 | 17.008 | 12.189 |
Disclaimer/Publisher’s Note: The statements, opinions and data contained in all publications are solely those of the individual author(s) and contributor(s) and not of MDPI and/or the editor(s). MDPI and/or the editor(s) disclaim responsibility for any injury to people or property resulting from any ideas, methods, instructions or products referred to in the content. |
© 2024 by the authors. Licensee MDPI, Basel, Switzerland. This article is an open access article distributed under the terms and conditions of the Creative Commons Attribution (CC BY) license (https://creativecommons.org/licenses/by/4.0/).
Share and Cite
Iqbal, S.; Karim, M.R.; Mohammad, S.; Ahn, J.C.; Kariyarath Valappil, A.; Mathiyalagan, R.; Yang, D.-C.; Jung, D.-H.; Bae, H.; Yang, D.U. In Silico and In Vitro Study of Isoquercitrin against Kidney Cancer and Inflammation by Triggering Potential Gene Targets. Curr. Issues Mol. Biol. 2024, 46, 3328-3341. https://doi.org/10.3390/cimb46040208
Iqbal S, Karim MR, Mohammad S, Ahn JC, Kariyarath Valappil A, Mathiyalagan R, Yang D-C, Jung D-H, Bae H, Yang DU. In Silico and In Vitro Study of Isoquercitrin against Kidney Cancer and Inflammation by Triggering Potential Gene Targets. Current Issues in Molecular Biology. 2024; 46(4):3328-3341. https://doi.org/10.3390/cimb46040208
Chicago/Turabian StyleIqbal, Safia, Md. Rezaul Karim, Shahnawaz Mohammad, Jong Chan Ahn, Anjali Kariyarath Valappil, Ramya Mathiyalagan, Deok-Chun Yang, Dae-Hyo Jung, Hyocheol Bae, and Dong Uk Yang. 2024. "In Silico and In Vitro Study of Isoquercitrin against Kidney Cancer and Inflammation by Triggering Potential Gene Targets" Current Issues in Molecular Biology 46, no. 4: 3328-3341. https://doi.org/10.3390/cimb46040208
APA StyleIqbal, S., Karim, M. R., Mohammad, S., Ahn, J. C., Kariyarath Valappil, A., Mathiyalagan, R., Yang, D.-C., Jung, D.-H., Bae, H., & Yang, D. U. (2024). In Silico and In Vitro Study of Isoquercitrin against Kidney Cancer and Inflammation by Triggering Potential Gene Targets. Current Issues in Molecular Biology, 46(4), 3328-3341. https://doi.org/10.3390/cimb46040208