
The Effect of Kidney Transplantation and Immunosuppressive Therapy on Adipose Tissue Content and Adipocytokine Plasma Concentration—Preliminary Study

 , , and
Abstract
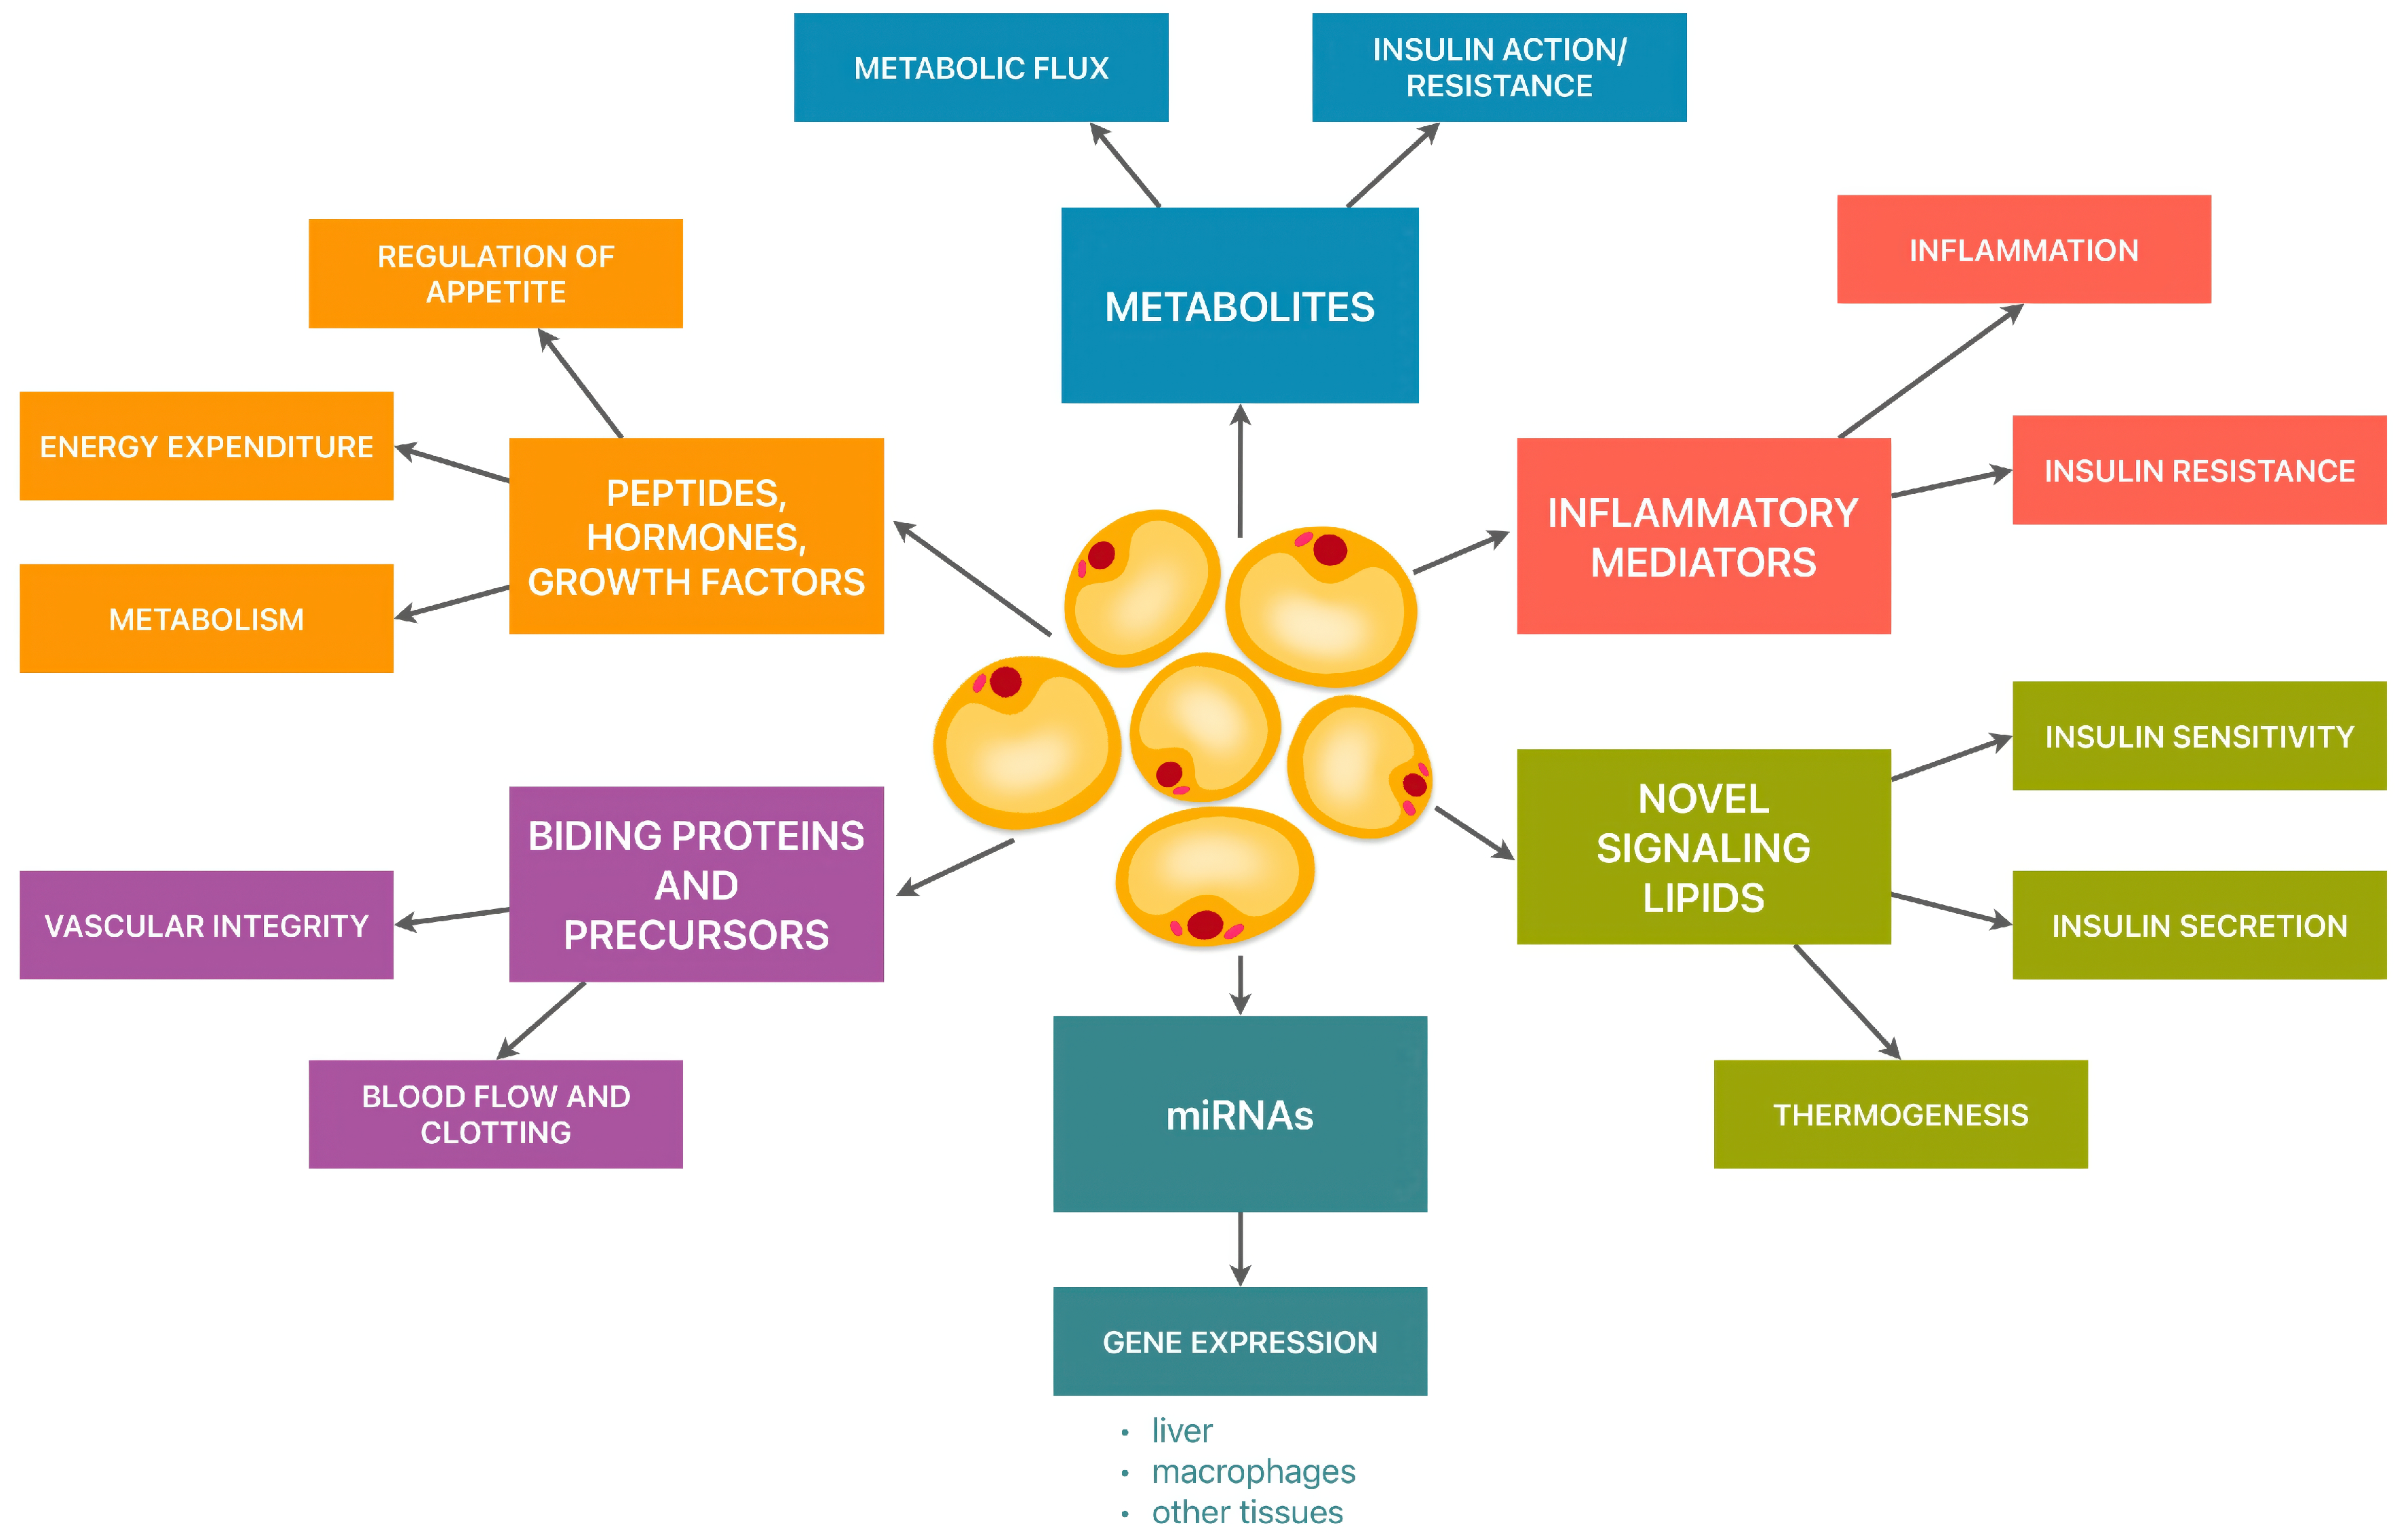
:1. Introduction
2. Materials and Methods
2.1. Characteristics of the Study and Control Groups
2.2. Tested Material
2.2.1. Assay Procedures
2.2.2. Statistical Analysis
3. Results
3.1. The Biochemical and Immunochemical Parameters
3.2. The Adipocytokine Concentrations
3.3. The Bioelectrical Impedance
3.4. Spearman’s Correlations
4. Discussion
Study Limitations
5. Conclusions
Author Contributions
Funding
Institutional Review Board Statement
Informed Consent Statement
Data Availability Statement
Conflicts of Interest
References
- Heinonen, S.; Jokinen, R.; Rissanen, A.; Pietiläinen, K.H. White adipose tissue mitochondrial metabolism in health and in obesity. Obes. Rev. 2020, 21, e12958. [Google Scholar] [CrossRef]
- Zorena, K.; Jachimowicz-Duda, O.; Ślęzak, D.; Robakowska, M.; Mrugacz, M. Adipokines and Obesity. Potential Link to Metabolic Disorders and Chronic Complications. Int. J. Mol. Sci. 2020, 21, 3570. [Google Scholar] [CrossRef]
- Song, T.; Kuang, S. Adipocyte dedifferentiation in health and diseases. Clin. Sci. 2019, 133, 2107. [Google Scholar] [CrossRef]
- Żelechowska, P.; Brzezińska-Błaszczyk, E.; Wiktorska, M.; Różalska, S.; Wawrocki, S.; Kozłowska, E.; Agier, J. Adipocytokines leptin and adiponectin function as mast cell activity modulators. Immunology 2019, 158, 3. [Google Scholar] [CrossRef]
- Martínez-Sánchez, N. There and Back Again: Leptin Actions in White Adipose Tissue. Int. J. Mol. Sci. 2020, 21, 6039. [Google Scholar] [CrossRef]
- Farkhondeh, T.; Llorens, S.; Pourbagher-Shahri, A.M.; Ashrafizadeh, M.; Talebi, M.; Shakibaei, M.; Samarghandian, S. An Overview of the Role of Adipokines in Cardiometabolic Diseases. Molecules 2020, 25, 5218. [Google Scholar] [CrossRef]
- Landecho, M.F.; Tuero, C.; Valentí, V.; Bilbao, I.; de la Higuera, M.; Frühbeck, G. Relevance of Leptin and Other Adipokines in Obesity-Associated Cardiovascular Risk. Nutrients 2019, 11, 2664. [Google Scholar] [CrossRef]
- Park, Y.C.; Lee, S.; Kim, Y.S.; Park, J.M.; Han, K.; Lee, H.; Hong, K.W.; Kim, J.K.; Cho, E.S.; Chung, T.H.; et al. Serum leptin level and incidence of CKD: A longitudinal study of adult enrolled in the Korean genome and epidemiology study(KoGES). BMC Nephrol. 2022, 23, 197. [Google Scholar] [CrossRef]
- Coimbra, S.; Rocha, S.; Valente, M.J.; Catarino, C.; Bronze-da-Rocha, E.; Belo, L.; Santos-Silva, A. New Insights into Adiponectin and Leptin Roles in Chronic Kidney Disease. Biomedicines 2022, 10, 2642. [Google Scholar] [CrossRef]
- García-Pino, G.; Luna, E.; Mota-Zamorano, S.; González, L.M.; Tormo, M.Á.; Gervasini, G. Effect of leptin concentrations and leptin receptor gene polymorphisms on the outcome of renal transplantation. Arch. Med. Sci. 2021, 20, 1220–1227. [Google Scholar] [CrossRef] [PubMed] [PubMed Central]
- Szumilas, K.; Wilk, A.; Szumilas, P.; Dziedziejko, V.; Pawlik, A. Role of leptin and adiponectin in the pathogenesis of post-transplant diabetes mellitus. Prostaglandins Other Lipid Mediat. 2024, 174, 106876. [Google Scholar] [CrossRef]
- Pham Vu, T.; Can Van, M.; Dang Thanh, C.; Nguyen Minh, T.; Nguyen Trung, K.; Nguyen Duy, T.; Do, Q.; Tran Viet, T.; Le Viet, T. Association of serum adiponectin and leptin levels with renal function in kidney transplant recipients with or without new-onset diabetes after transplantation. J. Clin. Lab. Anal. 2021, 35, e24000. [Google Scholar] [CrossRef]
- Marchelek-Myśliwiec, M.; Dziedziejko, V.; Nowosiad-Magda, M.; Wiśniewska, M.; Safranow, K.; Pawlik, A.; Domański, L.; Dołęgowska, K.; Dołęgowska, B.; Stępniewska, J.; et al. Bone Metabolism Parameters in Hemodialysis Patients with Chronic Kidney Disease and in Patients After Kidney Transplantation. Physiol. Res. 2019, 68, 947–954. [Google Scholar] [CrossRef]
- Graňák, K.; Vnučák, M.; Beliančinová, M.; Kleinová, P.; Pytliaková, M.; Mokáň, M.; Dedinská, I. Adiponectin/leptin ratio as a predictor of acute rejection in early post-transplant period in patients after kidney transplantation. Front. Med. (Lausanne) 2023, 10, 1117819. [Google Scholar] [CrossRef]
- Dedinská, I.; Kleinová, P.; Macháleková, K.; Graňák, K.; Vnučák, M.; Beliančinová, M. The role of hyperleptinaemia and low values of interleukin 10 in de novo DSA production after kidney transplantation. Transpl. Immunol. 2024, 83, 101982. [Google Scholar] [CrossRef]
- Przybyciński, J.; Dziedziejko, V.; Puchałowicz, K.; Domański, L.; Pawlik, A. Adiponectin in Chronic Kidney Disease. Int. J. Mol. Sci. 2020, 21, 9375. [Google Scholar] [CrossRef]
- Jing, H.; Tang, S.; Lin, S.; Liao, M.; Chen, H.; Fan, Y.; Zhou, J. Adiponectin in renal fibrosis. Aging (Albany NY) 2020, 12, 4660. [Google Scholar] [CrossRef]
- Tumminia, A.; Vinciguerra, F.; Parisi, M.; Graziano, M.; Sciacca, L.; Baratta, R.; Frittitta, L. Adipose Tissue, Obesity and Adiponectin: Role in Endocrine Cancer Risk. Int. J. Mol. Sci. 2019, 20, 2863. [Google Scholar] [CrossRef]
- Zhao, S.; Kusminski, C.M.; Scherer, P.E. Adiponectin, Leptin and Cardiovascular Disorders. Circ. Res. 2021, 128, 136. [Google Scholar] [CrossRef]
- Choi, H.M.; Doss, H.M.; Kim, K.S. Multifaceted Physiological Roles of Adiponectin in Inflammation and Diseases. Int. J. Mol. Sci. 2020, 21, 1219. [Google Scholar] [CrossRef]
- Teplan, V.; Schück, O.; Stollova, M.; Vitko, S. Obesity and adiponectin after kidney transplantation. Acta Physiol. Hung. 2007, 94, 149–157. [Google Scholar] [CrossRef] [PubMed]
- Mota-Zamorano, S.; Luna, E.; Garcia-Pino, G.; González, L.M.; Gervasini, G. Combined donor-recipient genotypes of leptin receptor and adiponectin gene polymorphisms affect the incidence of complications after renal transplantation. Mol. Genet. Metab. Rep. 2020, 25, 100648. [Google Scholar] [CrossRef]
- Peng, A.; Li, J.; Xing, J.; Yao, Y.; Niu, X.; Zhang, K. The function of nicotinamide phosphoribosyl transferase (NAMPT) and its role in diseases. Front. Mol. Biosci. 2024, 11, 1480617. [Google Scholar] [CrossRef]
- Erten, M. Visfatin as a Promising Marker of Cardiometabolic Risk. Acta Cardiol. Sin. 2021, 37, 464. [Google Scholar]
- Zhang, Y.; Huo, Y.; He, W.; Liu, S.; Li, H.; Li, L. Visfatin is regulated by interleukin-6 and affected by the PPAR-γ pathway in BeWo cells. Mol. Med. Rep. 2019, 19, 400–406. [Google Scholar] [CrossRef]
- Radzicka, S.; Pietryga, M.; Iciek, R.; Brazert, J. The role of visfatin in pathogenesis of gestational diabetes (GDM). Ginekol. Pol. 2018, 89, 518–521. [Google Scholar] [CrossRef]
- Lin, T.C. The role of visfatin in cancer proliferation,, angiogenesis, metastasis, drug resistance and clinical prognosis. Cancer Manag. Res. 2019, 11, 3481. [Google Scholar] [CrossRef]
- Nagy, K.; Nagaraju, S.P.; Rhee, C.M.; Mathe, Z.; Molnar, M.Z. Adipocytokines in renal transplant recipients. Clin. Kidney J. 2016, 9, 359–373. [Google Scholar] [CrossRef]
- Dan, S.; Aditya, P.; Banerjee, P.; Bal, C.; Roy, H.; Banerjee, I. Effect of chronic kidney disease on serum resistin level. Niger. J. Clin. Pract. 2014, 17, 735–738. [Google Scholar] [CrossRef]
- Zhang, H.; Li, X.; Kan, Y.; Yang, F.; Hou, Y.; Du, Y. Analysis of the correlation between serum resistin and the variability of erythropoietin responsiveness in patients with chronic kidney disease. Exp. Ther. Med. 2015, 10, 1925–1930. [Google Scholar] [CrossRef]
- Heleniak, Z.; Illersperger, S.; Brakemeier, S.; Dębska-Ślizień, A.; Budde, K.; Halleck, F. Obesity, Fat Tissue Parameters, and Arterial Stiffness in Renal Transplant Recipients. Transplant. Proc. 2020, 52, 2341–2346. [Google Scholar] [CrossRef]
- Susilo, H.; Thaha, M.; Pikir, B.S.; Alsagaff, M.Y.; Suryantoro, S.D.; Wungu, C.D.K.; Pratama, N.R.; Pakpahan, C.; Oceandy, D. The Role of Plasma Interleukin-6 Levels on Atherosclerotic Cardiovascular Disease and Cardiovascular Mortality Risk Scores in Javanese Patients with Chronic Kidney Disease. J. Pers. Med. 2022, 12, 1122. [Google Scholar] [CrossRef]
- Fonseca, I.; Oliveira, J.C.; Santos, J.; Malheiro, J.; Martins, L.S.; Almeida, M.; Dias, L.; Pedroso, S.; Lobato, L.; Henriques, A.C.; et al. Leptin and adiponectin during the first week after kidney transplantation: Biomarkers of graft dysfunction? Metabolism 2015, 64, 202–207. [Google Scholar] [CrossRef]
- Sukackiene, D.; Laucyte-Cibulskiene, A.; Badaras, I.; Rimsevicius, L.; Banys, V.; Vitkus, D.; Miglinas, M. Early Post-Transplant Leptin Concentration Changes in Kidney Transplant Recipients. Medicina 2021, 57, 834. [Google Scholar] [CrossRef]
- Cumin, F.; Baum, H.P.; Levens, N. Mechanism of leptin removal from the circulation by the kidney. J. Endocrinol. 1997, 155, 577–585. [Google Scholar] [CrossRef] [PubMed]
- Małgorzewicz, S.; Dębska-Slizień, A.; Czajka, B.; Rutkowski, B. Adipokines and nutritional status in kidney transplant recipients. Transplant. Proc. 2014, 46, 2622–2626. [Google Scholar] [CrossRef]
- Pofi, R.; Caratti, G.; Ray, D.W.; Tomlinson, J.W. Treating the Side Effects of Exogenous Glucocorticoids; Can We Separate the Good from the Bad? Endocr. Rev. 2023, 44, 975–1011. [Google Scholar] [CrossRef] [PubMed] [PubMed Central]
- Kokot, F.; Adamczak, M.; Wiecek, A. Plasma leptin concentration in kidney transplant patients during the early post-transplant period. Nephrol. Dial. Transplant. 1998, 13, 2276–2280. [Google Scholar] [CrossRef] [PubMed]
- Kagan, A.; Haran, N.; Leschinsky, L.; Sarafian, R.; Aravot, D.; Dolberg, J.; Ben-Ary, Z.; Rapoport, J. Serum concentrations of leptin in heart, liver and kidney transplant recipients. Isr. Med. Assoc. J. 2002, 4, 213–217. [Google Scholar] [PubMed]
- Ahsan, S.; Ahmed, S.; Ahmed, S.D.; Nauman, K. Status of serum adiponectin related to insulin resistance in prediabetics. J. Pak. Med. Assoc. 2014, 64, 184–188. [Google Scholar] [PubMed]
- Song, S.H.; Oh, T.R.; Choi, H.S.; Kim, C.S.; Ma, S.K.; Oh, K.H.; Ahn, C.; Kim, S.W.; Bae, E.H. High serum adiponectin as a biomarker of renal dysfunction: Results from the KNOW-CKD study. Sci. Rep. 2020, 10, 5598. [Google Scholar] [CrossRef]
- Idorn, T.; Hornum, M.; Bjerre, M.; Jørgensen, K.A.; Nielsen, F.T.; Hansen, J.M.; Flyvbjerg, A.; Feldt-Rasmussen, B. Plasma adiponectin before and after kidney transplantation. Transpl. Int. 2012, 25, 1194–1203. [Google Scholar] [CrossRef]
- Sahin, G.; Akay, O.M.; Uslu, S.; Bal, C.; Yalcin, A.U.; Gulbas, Z. Association between endothelial and platelet function markers and adiponectin in renal transplanted recipients on cyclosporine and tacrolimus immunosuppression-based therapy. Nephrology (Carlton) 2015, 20, 392–398. [Google Scholar] [CrossRef]
- Serwin, N.; Adamiak, D.; Wiśniewska, M.; Marchelek-Myśliwiec, M.; Serwin, K.; Cecerska-Heryć, E.; Grygorcewicz, B.; Roszak, M.; Miądlicki, K.; Dołęgowska, B. Adiponectin is unrelated to kidney function or injury markers in renal transplant recipients: A one-year follow-up study. Prostaglandins Other Lipid Mediat. 2022, 159, 106618. [Google Scholar] [CrossRef]
- Coyne, D.W.; Fleming, R. Will Targeting Interleukin-6 in the Anemia of CKD Change Our Treatment Paradigm? J. Am. Soc. Nephrol. 2021, 32, 6. [Google Scholar] [CrossRef]
- Cueto-Manzano, A.M.; Morales-Buenrostro, L.E.; González-Espinoza, L.; González-Tableros, N.; Martín-del-Campo, F.; Correa-Rotter, R.; Valera, I.; Alberú, J. Markers of inflammation before and after renal transplantation. Transplantation 2005, 80, 47–51. [Google Scholar] [CrossRef]
- Omrani, H.; Jasemi, S.V.; Sadeghi, M.; Golmohamadi, S. Evaluation of Serum Interleukin-6 Levels in the Renal Transplant Recipients: A Systematic Review and Meta-Analysis of Case-Control Studies. Open Access Maced. J. Med. Sci. 2019, 7, 174–178. [Google Scholar] [CrossRef]
- Miller, C.L.; Madsen, J.C. IL-6 Directed Therapy in Transplantation. Curr. Transplant. Rep. 2021, 8, 191–204. [Google Scholar] [CrossRef]
- Zhang, H.; Xu, Z.; Zhao, H.; Wang, X.; Pang, J.; Li, Q.; Yang, Y.; Ling, W. Anthocyanin supplementation improves anti-oxidative and anti-inflammatory capacity in a dose–response manner in subjects with dyslipidemia. Redox Biol. 2020, 32, 101474. [Google Scholar] [CrossRef]
- Nagy, K.; Ujszaszi, A.; Czira, M.E.; Remport, A.; Kovesdy, C.P.; Mathe, Z.; Rhee, C.M.; Mucsi, I.; Molnar, M.Z. Association between serum resistin level and outcomes in kidney transplant recipients. Transpl. Int. 2016, 29, 352–361. [Google Scholar] [CrossRef]
- Kunjathoor, V.V.; Febbraio, M.; Podrez, E.A.; Moore, K.J.; Andersson, L.; Koehn, S.; Rhee, J.S.; Silverstein, R.; Hoff, H.F.; Freeman, M.W. Scavenger receptors class A-I/II and CD36 are the principal receptors responsible for the uptake of modified low-density lipoprotein leading to lipid loading in macrophages. J. Biol. Chem. 2002, 277, 49982–49988. [Google Scholar] [CrossRef]
- Fadel, F.; Bazraa, H.M.; Abdelrahman, S.M.; Shouman, M.G.; Sayed, M.K.; Salah, D.M.; Wahby, A.A.; Elgebaly, H.F. Visfatin versus Flow-Mediated Dilatation as a Marker of Endothelial Dysfunction in Pediatric Renal Transplant Recipients. Open Access Maced. J. Med. Sci. 2017, 5, 222–227. [Google Scholar] [CrossRef]
- Nicholson, T.; Church, C.; Baker, D.J.; Jones, S.W. The role of adipokines in skeletal muscle inflammation and insulin sensitivity. J. Inflamm. 2018, 15, 9. [Google Scholar] [CrossRef]
- Baum, C.L. Weight gain and cardiovascular risk after organ transplantation. J. Parenter. Enter. Nutr. 2001, 25, 114–119. [Google Scholar] [CrossRef]
- Shu, K.-H.; Wu, M.-J.; Cheng, C.-H.; Yu, T.-M.; Chuang, Y.-W.; Huang, S.-T.; Tsai, S.-F.; Lo, Y.-C.; Weng, S.-C.; Wen, M.-C.; et al. Serum Adipokine Levels in Renal Transplant Recipients. Transplant. Proc. 2014, 46, 381–384. [Google Scholar] [CrossRef]
- Gao, M.; Cui, D.; Xie, J. The role of adiponectin for immune cell function in metabolic diseases. Diabetes Obes. Metab. 2023, 25, 2427–2438. [Google Scholar] [CrossRef] [PubMed]
- Casillas-Ramírez, A.; Maroto-Serrat, C.; Sanus, F.; Micó-Carnero, M.; Rojano-Alfonso, C.; Cabrer, M.; Peralta, C. Regulation of Adiponectin and Resistin in Liver Transplantation Protects Grafts from Extended-Criteria Donors. Am. J. Pathol. 2025, 195, 494–527. [Google Scholar] [CrossRef] [PubMed]
- Jiménez-Castro, M.B.; Casillas-Ramírez, A.; Mendes-Braz, M.; Massip-Salcedo, M.; Gracia-Sancho, J.; Elias-Miró, M.; Rodés, J.; Peralta, C. Adiponectin and resistin protect steatotic livers undergoing transplantation. J. Hepatol. 2013, 59, 1208–1214. [Google Scholar] [CrossRef] [PubMed]
- Szczurek, W.; Gąsior, M.; Skrzypek, M.; Szyguła-Jurkiewicz, B. Visfatin serum concentration is associated with cardiac allograft vasculopathy in heart transplant recipients. Am. J. Transplant. 2020, 20, 2857–2866. [Google Scholar] [CrossRef] [PubMed]
- Watt, K.D.; Fan, C.; Therneau, T.; Heimbach, J.K.; Seaberg, E.C.; Charlton, M.R. Serum adipokine and inflammatory markers before and after liver transplantation in recipients with major cardiovascular events. Liver Transpl. 2014, 20, 791–797. [Google Scholar] [CrossRef] [PubMed] [PubMed Central]
- Ochman, M.; Maruszewski, M.; Wojarski, J.; Żegleń, S.; Karolak, W.; Stanjek-Cichoracka, A.; Przybyłowski, P.; Zembala, M.; Kukla, M. Serum Levels of Visfatin, Omentin and Irisin in Patients with End-Stage Lung Disease Before and After Lung Transplantation. Ann. Transplant. 2017, 22, 761–768. [Google Scholar] [CrossRef] [PubMed] [PubMed Central]
- Zaza, G.; Leventhal, J.; Signorini, L.; Gambaro, G.; Cravedi, P. Effects of antirejection drugs on innate immune cells after kidney transplantation. Front. Immunol. 2019, 10, 2978. [Google Scholar] [CrossRef]
- Dashti-Khavidaki, S.; Saidi, R.; Lu, H. Current status of glucocorticoid usage in solid organ transplantation. World J. Transplant. 2021, 11, 443–465. [Google Scholar] [CrossRef] [PubMed] [PubMed Central]
- Li, J.X.; Cummins, C.L. Fresh insights into glucocorticoid-induced diabetes mellitus and new therapeutic directions. Nat. Rev. Endocrinol. 2022, 18, 540–557. [Google Scholar] [CrossRef] [PubMed] [PubMed Central]
- Hjelmesæth, J.; Flyvbjerg, A.; Jenssen, T.; Frystyk, J.; Ueland, T.; Hagen, M.; Hartmann, A. Hypoadiponectinemia is associated with insulin resistance and glucose intolerance after renal transplantation: Impact of immunosuppressive and antihypertensive drug therapy. Clin. J. Am. Soc. Nephrol. 2006, 1, 575–582. [Google Scholar] [CrossRef]
- Pullerits, R.; Oltean, S.; Flodén, A.; Oltean, M. Circulating resistin levels are early and significantly increased in deceased brain dead organ donors, correlate with inflammatory cytokine response and remain unaffected by steroid treatment. J. Transl. Med. 2015, 13, 201. [Google Scholar] [CrossRef] [PubMed] [PubMed Central]
- Oltean, S.; Pullerits, R.; Flodén, A.; Olausson, M.; Oltean, M. Increased resistin in brain dead organ donors is associated with delayed graft function after kidney transplantation. J. Transl. Med. 2013, 11, 233. [Google Scholar] [CrossRef] [PubMed] [PubMed Central]
- Son, J.W.; Han, B.D.; Bennett, J.P.; Heymsfield, S.; Lim, S. Development and clinical application of bioelectrical impedance analysis method for body composition assessment. Obes. Rev. 2025, 26, e13844. [Google Scholar] [CrossRef] [PubMed]

| Parameter | Study Group (B) (n = 25, M/F = 14/9) | Control Group (K) (n = 22, M/F = 7/15) | p | ||||||
| Mean ± SD | Me LQ, UQ | Min | Max | Mean ± SD | Me LQ UQ | Min | Max | ||
| Age [years] | 49.43 ± 10.88 | 51.00 43.00 57.00 | 26.00 | 64.00 | 37.00 ± 11.20 | 33.50 27.25 44.75 | 23.00 | 58.00 | 0.0005 |
| Height [cm] | 170.09 ± 10.69 | 170.00 162.00 180.50 | 150.00 | 188.00 | 169.64 ± 8.39 | 168.00 165.00 173.75 | 155.00 | 189.00 | 0.88 |
| Weight [kg] | 82.13 ± 16.58 | 90.00 67.60 94.75 | 49.50 | 108.50 | 69.99 ± 15.66 | 64.13 58.03 78.50 | 52.60 | 113.00 | 0.02 |
| Waist circumference [cm] | 95.22 ± 12.87 | 94.00 89.00 103.00 | 68.00 | 125.00 | 80.09 ± 11.14 | 80.00 70.00 87.25 | 68.00 | 105.00 | 0.0001 |
| Hip circumference [cm] | 103.78 ± 8.91 | 101.00 99.50 104.00 | 92.00 | 125.00 | 99.09 ± 8.45 | 98.00 93.00 103.75 | 87.00 | 125.00 | 0.08 |
| WHR | 0.92 ± 0.09 | 0.91 0.86 1.00 | 0.73 | 1.08 | 0.81 ± 0.07 | 0.81 0.75 0.83 | 0.73 | 1.02 | 0.00003 |
| BMI [kg/m2] | 28.11 ± 3.98 | 26.88 25.87 31.25 | 20.61 | 35.40 | 24.21 ± 4.91 | 22.52 20.97 26.21 | 18.45 | 39.80 | 0.005 |
| Type | Detection Range | Sensitivity | Intra-Assay Precision | Inter-Assay Precision |
|---|---|---|---|---|
| Human Leptin ELISA Kit | 0.16–10 ng/mL | 0.06 ng/mL | CV% < 8% | CV% < 10% |
| Human Adiponectin ELISA Kit | 0.47–30 ng/mL | 75 pg/mL | CV% < 8% | CV% < 10% |
| Human Resistin ELISA Kit | 0.16–10 ng/mL | 0.058 ng/mL | CV% < 8% | CV% < 10% |
| Human Visfatin ELISA Kit | 0.16–10 ng/mL | 0.059 ng/mL | CV% < 8% | CV% < 10% |
| Parameter | Study Group (SG) | Control lk | p | ||||||
|---|---|---|---|---|---|---|---|---|---|
| Mean ± SD | Me LQ, UQ | Min | Max | Mean ± OS | Me LQ, UQ | Min | Max | ||
| Glucose [mg/dL] | 99.50 ± 12.94 | 99.00 96.00 102.00 | 72.00 | 141.00 | 93.82 ± 10.75 | 93.30 88.6 99.1 | 76.30 | 129.50 | 0.018 |
| Insulin [µU/mL] | 5.41 ± 5.20 | 3.15 1.67 7.63 | 0.34 | 19.78 | 8.38 ± 5.65 | 7.55 5.02 10.00 | 2.00 | 30.00 | 0.013 |
| HOMA-IR | 2.83 ± 1.22 | 2.63 2.13 3.45 | 0.98 | 6.55 | 1.93 ± 1.16 | 1.71 1.22 2.45 | 0.44 | 5.91 | 0.003 |
| Total cholesterol [mg/dL] | 210.76 ± 72.09 | 182.00 171.00 242.00 | 146.00 | 483.00 | 184.50 ± 25.09 | 184.00 166.00 200.00 | 140.00 | 247.00 | 0.388 |
| HDL [mg/dL] | 61.08 ± 23.93 | 52.00 45.00 77.00 | 22.00 | 113.00 | 59.91 ± 17.54 | 62.00 43.00 71.00 | 30.00 | 102.00 | 0.890 |
| LDL [mg/dL] | 135.68 ± 70.14 | 114.00 94.00 168.00 | 71.00 | 407.00 | 118.86 ± 27.74 | 113.00 99.00 131.00 | 68.00 | 176.00 | 0.765 |
| TG [mg/dL] | 135.48 ± 56.60 | 148.00 85.00 166.00 | 47.00 | 286.00 | 89.14 ± 38.50 | 85.50 64.00 95.00 | 31.00 | 196.00 | 0.005 |
| Non-HDL cholesterol [mg/dL] | 149.52 ± 67.84 | 139.00 115.00 167.00 | 71.00 | 414.00 | 124.36 ± 28.06 | 124.00 102.00 139.00 | 84.00 | 180.00 | 0.166 |
| Creatinine [mg/dL] | 1.49 ± 0.65 | 1.50 1.02 1.74 | 0.69 | 3.28 | 0.84 ± 0.12 | 0.80 0.77 0.92 | 0.64 | 1.06 | 0.000 |
| eGFR [mL/min/1.73] | 58.88 ± 26.72 | 54.00 40.00 81.00 | 16.00 | 116.00 | 100.00 ± 13.65 | 103.00 89.00 107.00 | 72.00 | 121.00 | 0.000 |
| CRP [mg/l] | 11.65 ± 4.54 | 11.10 8.09 14.10 | 4.40 | 19.00 | 1.75 ± 2.56 | 1.12 0.39 1.25 | 0.12 | 11.16 | 0.000 |
| Parameter | Study Group (SG) | Control Group (C) | p | ||||||
|---|---|---|---|---|---|---|---|---|---|
| Mean ± SD | Me LQ, UQ | Min | Max | Mean ± SD | Me LQ, UQ | Min | Max | ||
| Leptin [ng/mL] | 16.16 ± 24.83 | 7.40 3.54 10.74 | 0.11 | 91.80 | 3.86 ± 2.93 | 3.25 1.96 4.66 | 0.52 | 12.87 | 0.014 |
| Adiponectin [ng/mL] | 2.66 ± 1.89 | 2.39 1.45 3.17 | 0.32 | 8.63 | 1.62 ± 0.81 | 1.71 1.04 1.94 | 0.31 | 3.10 | 0.031 |
| Resistin [ng/mL] | 0.41 ± 0.22 | 0.38 0.28 0.51 | 0.03 | 0.96 | 0.54 ± 0.38 | 0.43 0.27 0.81 | 0.02 | 1.49 | 0.370 |
| Visfatin [ng/mL] | 1.94 ± 0.62 | 2.04 1.71 2.34 | 0.38 | 2.82 | 1.99 ± 0.63 | 2.19 1.74 2.42 | 0.71 | 2.89 | 0.693 |
| IL6 [pg/mL] | 6.19 ± 5.34 | 4.60 2.90 6.10 | 1.40 | 23.50 | 2.94 ± 4.71 | 1.40 1.40 2.30 | 1.40 | 22.90 | 0.000 |
| Parameter | Study Group (SG) | Control Group (C) | p | ||||||
|---|---|---|---|---|---|---|---|---|---|
| Mean ± OS | Me QD, QG | Min | Max | Mean ± OS | Me QD, QG | Min | Max | ||
| TBW [L] | 43.46 ± 11.72 | 44.60 34.10 48.80 | 24.60 | 64.50 | 37.57 ± 7.26 | 35.90 32.00 44.55 | 27.70 | 51.30 | 0.161 |
| ECW [L] | 19.00 ± 4.67 | 19.50 15.80 19.80 | 11.30 | 27.50 | 16.13 ± 2.62 | 15.80 14.25 18.05 | 12.60 | 21.10 | 0.063 |
| ECW/TBW [%] | 43.62 ± 3.74 | 43.40 40.30 45.80 | 38.80 | 52.80 | 43.23 ± 2.31 | 43.20 41.25 44.60 | 39.90 | 49.00 | 0.912 |
| Resistance | 465.13 ± 97.35 | 476.65 382.50 512.05 | 313.90 | 655.70 | 543.70 ± 74.74 | 550.40 484.80 604.75 | 423.20 | 676.70 | 0.023 |
| Reactance | 48.98 ± 13.04 | 48.00 36.20 62.25 | 30.10 | 67.90 | 59.88 ± 8.07 | 60.75 55.05 65.35 | 41.60 | 75.30 | 0.031 |
| VAT [l] | 2.93 ± 2.18 | 2.80 0.80 3.60 | 0.40 | 8.20 | 1.27 ± 1.28 | 1.00 0.40 1.45 | 0.10 | 5.30 | 0.023 |
| WC [m] | 0.98 ± 0.15 | 1.02 0.86 1.07 | 0.68 | 1.25 | 0.81 ± 0.13 | 0.84 0.70 0.87 | 0.66 | 1.14 | 0.006 |
| FM [kg] | 25.40 ± 10.92 | 27.25 17.90 29.94 | 1.95 | 42.75 | 18.94 ± 9.76 | 15.71 13.32 23.24 | 8.83 | 50.43 | 0.028 |
| FMI [kg/m2] | 8.75 ± 3.59 | 8.50 7.30 10.00 | 0.60 | 14.80 | 6.65 ± 3.64 | 5.05 4.50 8.45 | 3.20 | 18.10 | 0.034 |
| FFM [kg] | 59.49 ± 16.31 | 62.05 47.10 67.05 | 33.06 | 88.05 | 50.94 ± 10.09 | 48.07 43.64 61.09 | 37.03 | 69.73 | 0.146 |
| FFMI [kg/m2] | 20.25 ± 3.72 | 20.30 17.80 23.00 | 14.70 | 26.30 | 17.44 ± 2.32 | 17.15 15.75 18.70 | 14.20 | 22.80 | 0.027 |
| Pair of Variables | Spearman’s Correlation Coefficient | p |
|---|---|---|
| Study Group | ||
| Adiponectin [ng/mL] and insulin [µU/mL] | 0.480 | 0.015 |
| Resistin [ng/mL] and total cholesterol [mg/dL] | 0.463 | 0.020 |
| Control Group | ||
| IL6 [pg/mL] and total cholesterol [mg/dL] | 0.440 | 0.040 |
| IL6 [pg/mL] and triglycerides [mg/dL] | 0.493 | 0.020 |
| IL6 [pg/mL] and non-HDL cholesterol [mg/dL] | 0.476 | 0.025 |
| Leptin [ng/mL] and FM [kg] | 0.493 | 0.027 |
| Resistin [ng/mL] and visfatin [ng/mL] | −0.605 | 0.003 |
| Visfatin [ng/mL] and FM [kg] | −0.497 | 0.026 |
| Parameter | Leptin | p-Value | Adiponectin | p Value | Resistin | p Value | Visfatin | p-Value | IL-6 | p-Value |
|---|---|---|---|---|---|---|---|---|---|---|
| HOMA-IR | 0.13 | 0.52 | −0.12 | 0.53 | −0.21 | 0.31 | 0.04 | 0.82 | 0.05 | 0.80 |
| VAT [L] | −0.30 | 0.32 | −0.30 | 0.32 | −0.14 | 0.63 | 0.05 | 0.87 | −0.03 | 0.91 |
| WC [m] | −0.27 | 0.36 | −0.50 | 0.08 | −0.25 | 0.41 | 0.11 | 0.71 | −0.08 | 0.78 |
| FM [kg] | −0.31 | 0.30 | −0.24 | 0.42 | −0.30 | 0.31 | 0.36 | 0.23 | −0.04 | 0.90 |
| FMI [kg/m2] | −0.27 | 0.38 | −0.37 | 0.22 | −0.21 | 0.48 | 0.39 | 0.19 | 0.05 | 0.86 |
| CH mg/dL | 0.03 | 0.90 | 0.19 | 0.36 | 0.46 | 0.02 | −0.12 | 0.54 | −0.08 | 0.70 |
| HDL cholesterol mg/dL | 0.22 | 0.29 | 0.26 | 0.20 | 0.37 | 0.06 | 0.03 | 0.90 | 0.22 | 0.29 |
| LDL cholesterol mg/dL | −0.16 | 0.43 | 0.08 | 0.70 | 0.25 | 0.21 | −0.24 | 0.24 | −0.28 | 0.17 |
| TG mg/dL | −0.16 | 0.45 | −0.14 | 0.50 | 0.09 | 0.65 | −0.06 | 0.75 | −0.07 | 0.72 |
| Adipocytokines | ||||||||||
| Leptin [ng/mL] | 0.20 | 0.32 | 0.12 | 0.56 | 0.15 | 0.46 | −0.16 | 0.42 | ||
| Adiponectin [ng/mL] | 0.20 | 0.32 | 0.05 | 0.80 | −0.02 | 0.92 | −0.21 | 0.31 | ||
| Resistin [ng/mL] | 0.12 | 0.56 | 0.05 | 0.80 | −0.27 | 0.19 | 0.07 | 0.72 | ||
| Visfatin [ng/mL] | 0.15 | 0.46 | −0.02 | 0.92 | −0.27 | 0.19 | 0.35 | 0.09 | ||
| IL-6 [pg/mL] | −0.16 | 0.42 | −0.21 | 0.31 | 0.07 | 0.72 | 0.35 | 0.09 | ||
| Parameter | Leptin | p-Value | Adiponectin | p Value | Resistin | p Value | Visfatin | p-Value | IL-6 | p-Value |
|---|---|---|---|---|---|---|---|---|---|---|
| HOMA-IR | 0.30 | 0.17 | −0.32 | 0.14 | 0.09 | 0.70 | −0.02 | 0.92 | −0.04 | 0.86 |
| VAT [L] | 0.11 | 0.65 | 0.33 | 0.15 | 0.08 | 0.75 | −0.19 | 0.42 | 0.10 | 0.67 |
| WC [m] | 0.26 | 0.27 | 0.25 | 0.29 | 0.05 | 0.82 | −0.23 | 0.33 | 0.42 | 0.07 |
| FM [kg] | 0.49 | 0.02 | 0.24 | 0.30 | 0.12 | 0.60 | −0.50 | 0.03 | 0.24 | 0.31 |
| FMI [kg/m2] | 0.43 | 0.06 | 0.20 | 0.39 | 0.02 | 0.42 | −0.43 | 0.06 | 0.1 | 0.66 |
| Cholesterol mg/dL | 0.10 | 0.66 | −0.10 | 0.64 | 0.02 | 0.93 | −0.15 | 0.50 | 0.44 | 0.04 |
| HDL cholesterol mg/dL | −0.31 | 0.15 | −0.20 | 0.38 | −0.28 | 0.20 | 0.19 | 0.40 | −0.23 | 0.30 |
| LDL cholesterol mg/dL | 0.21 | 0.36 | 0.19 | 0.4 | 0.05 | 0.81 | −0.27 | 0.22 | 0.38 | 0.08 |
| TG mg/dL | 0.35 | 0.11 | −0.05 | 0.40 | −0.12 | 0.60 | 0.13 | 0.55 | 0.49 | 0.02 |
| Adipocytokines | ||||||||||
| Leptin [ng/mL] | −0.05 | 0.82 | −0.107 | 0.64 | −0.045 | 0.46 | 0.33 | 0.14 | ||
| Adiponectin [ng/mL] | −0.053 | 0.33 | −0.26 | 0.81 | −0.09 | 0.70 | −0.09 | 0.71 | ||
| Resistin [ng/mL] | −0.107 | 0.64 | −0.26 | 0.81 | −0.60 | 0.002 | 0.12 | 0.60 | ||
| Visfatin [ng/mL] | −0.04 | 0.84 | −0.09 | 0.70 | −0.60 | 0.002 | 0.06 | 0.80 | ||
| IL-6 [pg/mL] | 0.33 | 0.14 | −0.09 | 0.71 | 0.12 | 0.60 | 0.06 | 0.80 | ||
Disclaimer/Publisher’s Note: The statements, opinions and data contained in all publications are solely those of the individual author(s) and contributor(s) and not of MDPI and/or the editor(s). MDPI and/or the editor(s) disclaim responsibility for any injury to people or property resulting from any ideas, methods, instructions or products referred to in the content. |
© 2025 by the authors. Licensee MDPI, Basel, Switzerland. This article is an open access article distributed under the terms and conditions of the Creative Commons Attribution (CC BY) license (https://creativecommons.org/licenses/by/4.0/).
Share and Cite
Śleboda-Taront, D.; Stępniewska, J.; Dołęgowska, B.; Marchelek, E.; Dołęgowska, K.; Marchelek-Myśliwiec, M. The Effect of Kidney Transplantation and Immunosuppressive Therapy on Adipose Tissue Content and Adipocytokine Plasma Concentration—Preliminary Study. Curr. Issues Mol. Biol. 2025, 47, 255. https://doi.org/10.3390/cimb47040255
Śleboda-Taront D, Stępniewska J, Dołęgowska B, Marchelek E, Dołęgowska K, Marchelek-Myśliwiec M. The Effect of Kidney Transplantation and Immunosuppressive Therapy on Adipose Tissue Content and Adipocytokine Plasma Concentration—Preliminary Study. Current Issues in Molecular Biology. 2025; 47(4):255. https://doi.org/10.3390/cimb47040255
Chicago/Turabian StyleŚleboda-Taront, Daria, Joanna Stępniewska, Barbara Dołęgowska, Emilia Marchelek, Katarzyna Dołęgowska, and Małgorzata Marchelek-Myśliwiec. 2025. "The Effect of Kidney Transplantation and Immunosuppressive Therapy on Adipose Tissue Content and Adipocytokine Plasma Concentration—Preliminary Study" Current Issues in Molecular Biology 47, no. 4: 255. https://doi.org/10.3390/cimb47040255
APA StyleŚleboda-Taront, D., Stępniewska, J., Dołęgowska, B., Marchelek, E., Dołęgowska, K., & Marchelek-Myśliwiec, M. (2025). The Effect of Kidney Transplantation and Immunosuppressive Therapy on Adipose Tissue Content and Adipocytokine Plasma Concentration—Preliminary Study. Current Issues in Molecular Biology, 47(4), 255. https://doi.org/10.3390/cimb47040255