Abstract
Genetic and epigenetic alterations of various biomolecules at the molecular level can contribute to the pathogenesis of hepatocellular carcinoma (HCC) and negative impact prognosis. In this study, we aimed to investigate the effects of von Willebrand factor (VWF) and ADAMTS13 on HCC prognosis, using bioinformatics tools. “These tools included GEPIA2, TIMER2, UALCAN database, KM-Plotter, TNM-plot, STRING, ENCORI, Human Protein Atlas, Targetscan 8.0, miRDB, Enrichr-KG, lncRNADisease and, GEO”. VWF expression levels were significantly upregulated in liver hepatocellular carcinoma (LIHC) tissues compared to healthy adjacent tissues. Conversely, ADAMTS13 expression levels were significantly downregulated in LIHC tissues compared with healthy adjacent tissues in GEPIA2 database. The upregulated expression of VWF was significantly associated with longer overall survival (OS). However, the downregulated expression of ADAMTS13 was not significantly related to OS. The promoter regions of VWF and ADAMTS13 were significantly hypomethylated. While a significant negative correlation was observed between VWF with CD4 + T cells, there was a positive correlation between VWF with CD8+ T cells. ADAMTS13 expression positively correlated with CD4+ T cells. Additionally, a positive correlation was observed between ADAMTS13 expression and long non-coding RNAs (lncRNAs) (H19, HOTAIR, MALAT1, and UCA1). Conversely, a negative correlation was observed between VWF expression and lncRNAs (H19, HOTAIR, MALAT1, and UCA1). Although these results are promising, they highlight the complexity of the interplay between VWF and ADAMTS13 in HCC progression. According to microarray data, while VWF expression levels were significantly downregulated, ADAMTS13 expression levels were significantly upregulated in HCC compared with the control in the GEO database. Further studies are needed to elucidate the mechanisms underlying these markers.
1. Introduction
Hepatocellular carcinoma (HCC) is the most common form of liver cancer and it is associated with high mortality rates [1]. HCC is the third leading cause of cancer-related mortality globally, with a 5-year survival rate of approximately 18% [2].The mechanisms underlying HCC development are still not fully understood [3].
Rapid advancements in epigenetics have introduced a new perspective for uncovering the mechanisms underlying hepatocarcinogenesis, including DNA methylation, histone modifications, and chromatin remodeling [4,5]. These epigenetic alterations, which are linked to HCC progression and metastasis, are promising targets for biomarker development because of their reversible nature [6]. Understanding these mechanisms is essential to improve survival rates and predict treatment outcomes [6,7].
Recent studies have suggested a potential link between von Willebrand factor (VWF) and A disintegrin and metalloproteinase with a thrombospondin type 1 motif, member 13 (ADAMTS13) in the development and progression of HCC [8,9,10]. VWF is a glycoprotein that plays a crucial role in hemostasis, whereas ADAMTS13 is a metalloproteinase involved in the regulation of extracellular matrix components. These two proteins have been implicated in various cellular processes including angiogenesis, cell migration, and tumor growth [11,12]. Angiogenesis plays a crucial role in the progression of HCC. An imbalance in the VWF antigen (VWF:Ag)/ADAMTS13 activity (ADAMTS13:AC) ratio was reported to be associated with angiogenesis and hypercoagulability as well as prognosis in patients with various types of cancer, especially those receiving chemotherapy [8,13].
Understanding the relationship between VWF and ADAMTS13 in HCC could provide valuable insights into the mechanisms underlying tumor development and progression [9]. Several findings suggest that the expression levels of both VWF and ADAMTS13 are altered in HCC [14,15]. For example, high levels of VWF have been detected in HCC tissues compared to non-cancerous liver tissues, while elevated levels of ADAMTS13 may be observed following hepatic arterial infusion chemotherapy (HAIC) [8]. Factors such as impaired liver function, chronic liver inflammation, fibrosis, cirrhosis, increased systemic inflammation, tumor-associated cytokines (e.g., IL-6, TNF-α), tumor hypoxia, and elevated VWF levels in HCC may also contribute to a relative deficiency of ADAMTS13. This deficiency can lead to the development of a prothrombotic and immunosuppressive tumor microenvironment [16].
Long non-coding RNAs (lncRNAs) and microRNAs (miRNAs) are critical regulators of gene expression and play pivotal roles in the pathogenesis of HCC [17]. lncRNAs, typically longer than 200 nucleotides, function through diverse mechanisms such as acting as molecular scaffolds, sponges, or guides for chromatin remodeling complexes [17]. Their dysregulation in HCC has been associated with key processes such as tumor growth, metastasis, angiogenesis, and immune evasion [17]. miRNAs are small non-coding RNAs that regulate gene expression by binding to the target mRNAs, undergoing a multistep biogenesis processes involving transcription, processing, nuclear export, and incorporation into the RNA-induced silencing complex (RISC) for mRNA degradation or translational repression. miRNAs play a crucial role in HCC by regulating gene expressions involved in tumor initiation, progression, metastasis, and drug resistance. Dysregulated miRNAs can function as oncogenes (e.g., miR-21, miR-221) or tumor suppressors (e.g., miR-122, miR-199a) in HCC by modulating key signaling pathways such as Wnt/β-catenin, PI3K/AKT, and TGF-β. Moreover, extracellular vesicle-associated miRNAs serve as potential noninvasive biomarkers for HCC diagnosis, prognosis, and therapy response prediction [18,19]. ADAMTS13 has been recognized as a tumor-suppressive circular RNA that functions as a sponge for miR-484, though its specific target gene remains unidentified [20]. Among the mRNAs, ADAMTS13, which was upregulated, showed a correlation with the majority of lncRNAs [21]. The KCNQ1OT1-hsa-miR-24-3p-VWF competitive endogenous RNA (ceRNA) network was identified as a significant factor in the development of acute traumatic coagulopathy [22]. Nevertheless, the roles of lncRNA and miRNAs in gene regulation remain enigmatic.
Considering the above information, in this study, the possible imbalance between VWF and ADAMTS13 in HCC was investigated using bioinformatics databases and microarray data, and the potential of the spectacular imbalance between VWF and ADAMTS13 in HCC as a therapeutic agent was evaluated.
2. Materials and Methods
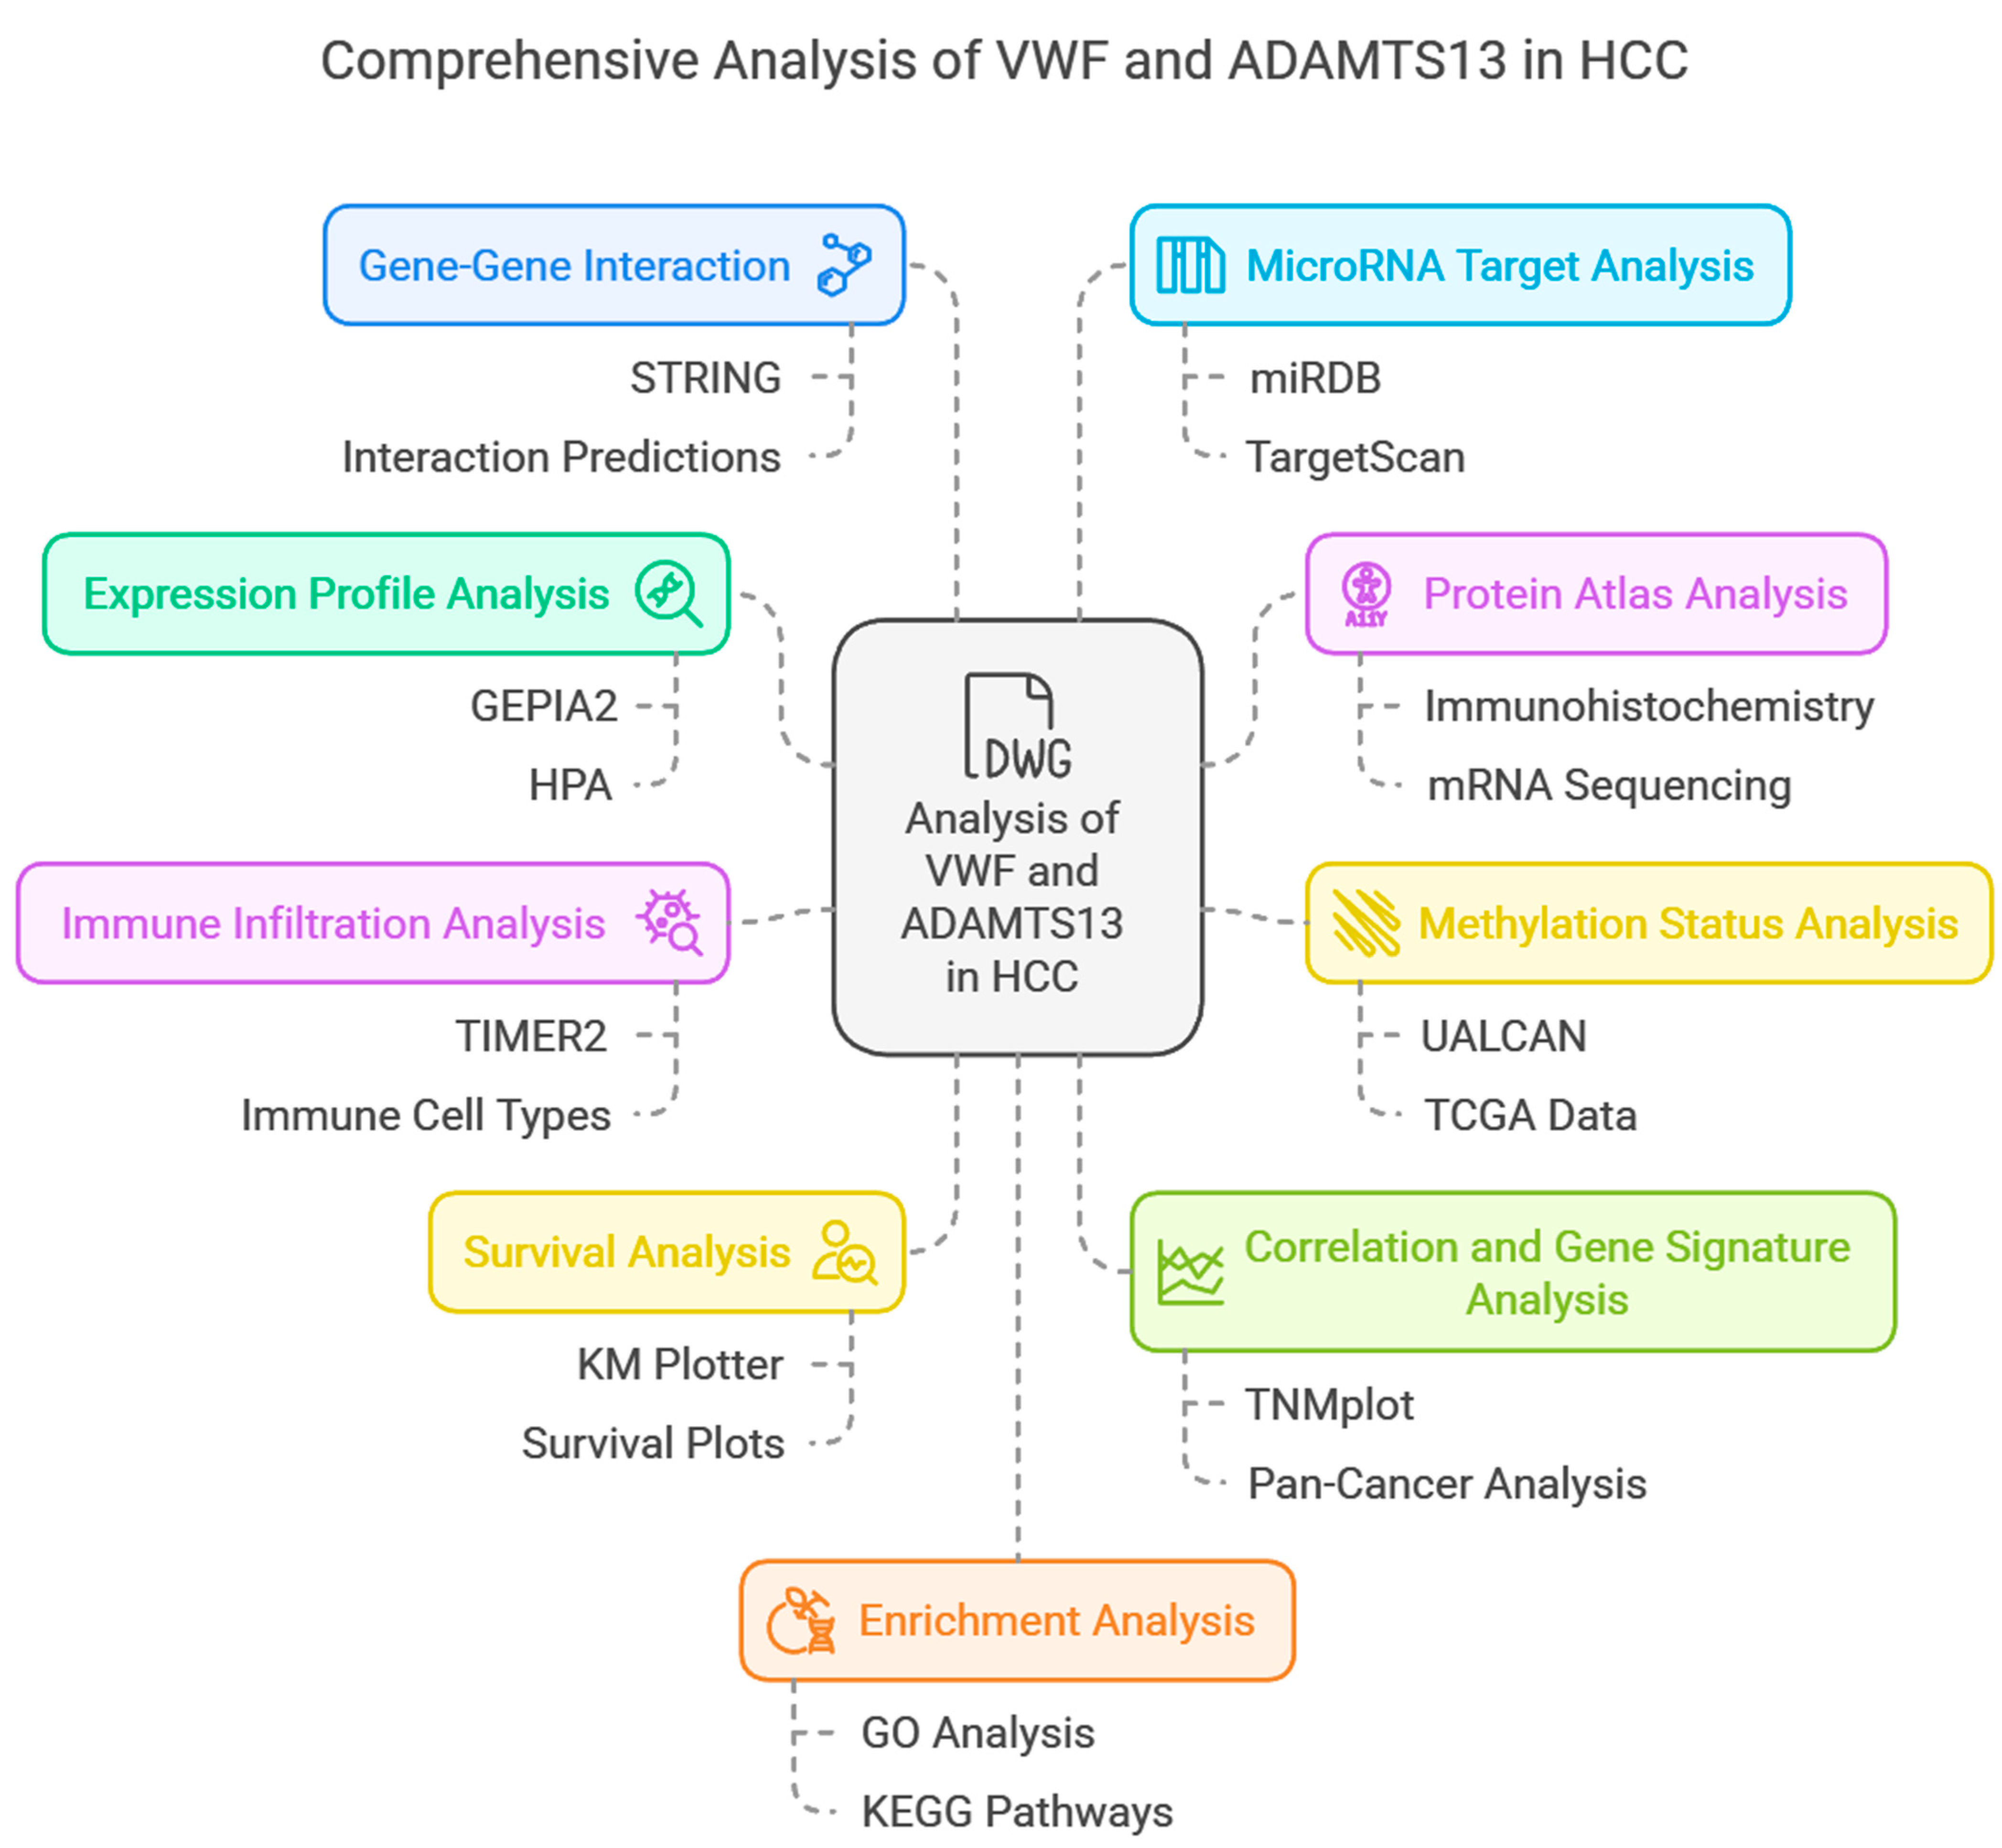
The flowchart of the current study using bioinformatics databases is shown in Figure 1.
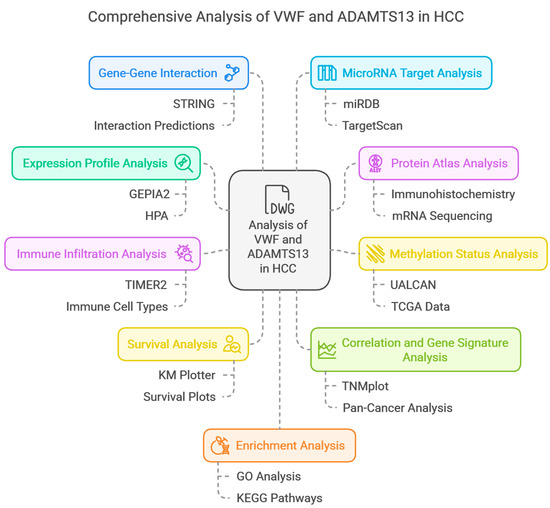
Figure 1.
Flowchart of comprehensive analysis of VWF and ADAMTS13 in HCC.
2.1. The Expression Profile Analysis of VWF and ADAMTS13
The access date: 1 December 2024
Purpose: To investigate expression profile analysis of VWF and ADAMTS13 in HCC.
Process: The Gene Expression Profiling Interactive Analysis2 (GEPIA2) web database was used for expression profile analysis. GEPIA2 is an enhanced portion of the web server that offers more detailed gene expression analysis including transcription level quantification, analysis of specific cancer subtypes, and the ability of users to upload their own RNA-seq fragments to separate them from existing datasets [23]. Using the GEPIA2 web server, it was possible to compare the expression levels of genes examined in both tumoral tissues and adjacent normal tissues. It is also possible to compare the expression levels of genes examined in cancer subtypes according to the type of cancer. In our HCC cohort, we compared the expression levels of VWF and ADAMTS13 genes between the adjacent normal tissue (n = 160) and the tumor tissue (n = 369). We also compared the expression levels of VWF and ADAMTS13 genes in the iCluster1 (Proliferative/Stem Cell-Like) (n = 63), iCluster2 (Intermediate/Immune-Active) (n = 55), and iCluster3 (Non-Proliferative/Metabolic) (n = 63) subtypes of LIHC (GEPIA2; there were only 181 patients classified according to liver hepatocellular carcinoma (LIHC) subtypes with adjacent normal tissue (n = 160). We also evaluated the expression levels of VWF and ADAMTS13 genes according to HCC stage (stage I, stage II, stage III, and stage IV).
2.2. Human Protein Atlas (HPA) Analysis
The access date: 1 December 2024
Purpose: The Human Protein Atlas (HPA) project is a comprehensive effort focused on mapping the entire human proteome using antibody-based proteomic techniques.
Process: Tissue resource features protein expression profiles based on immunohistochemistry (IHC) for 44 normal tissues, along with mRNA expression data from 54 tissues, primarily obtained through deep mRNA sequencing. Additionally, fluorescent multiplex IHC (mIHC/IF) was used to analyze 1021 proteins in specific cell types and tissues, including ciliated cells, kidneys, testes, and salivary glands [24].
2.3. The Methylation Status Analysis of VWF and ADAMTS13
The access date: 1 December 2024
Purpose: To investigate the promotor region methylation status of VWF and ADAMTS13 in HCC.
Process: University of Alabama at Birmingham Cancer data analysis (UALCAN) is a comprehensive, user-friendly, interactive web resource for analyzing cancer transcriptomic data. It aims to facilitate the exploration of The Cancer Genome Atlas (TCGA) data and enable researchers to analyze gene expression profiles and perform in-depth analyses of various cancer types. UALCAN provides insights into the methylation status of gene promoters, where users can compare methylation levels between tumor and normal samples. This allowed us to study the correlation between the expression levels of these two genes. This server is useful for identifying potential gene interactions and pathways [25]. We performed promoter region methylation analyses [tumor tissue (n = 377), normal tissue (n = 50)] with the UALCAN web server and examined the expression profiles of other input genes in LIHC, including VWF and ADAMTS13.
2.4. Immune Infiltration Analysis of VWF and ADAMTS13
The access date: 1 December 2024
Purpose: To investigate immune infiltration of VWF and ADAMTS13 in HCC.
Process: TIMER2 (Tumor Immune Estimation Resource 2.0) is an advanced web server that enables comprehensive analysis of tumor-infiltrating immune cells. It builds on the functionality of its predecessor, TIMER, but provides more powerful features and an expanded dataset. TIMER2 was primarily designed to investigate the relationship between immune infiltration and various clinical and genomic features of cancer. TIMER2 provides multiple algorithms to estimate the abundance of six types of immune cells in tumor tissues: B cells, CD4+ T cells, CD8+ T cells, neutrophils, macrophages, and dendritic cells. Users can compare immune cell infiltration levels between different types of cancer and between tumor and normal tissues. TIMER2 integrates data from various sources, including The Cancer Genome Atlas (TCGA) and other large-scale cancer genomic projects. This ensured a comprehensive and up-to-date dataset for analysis [26].
2.5. The Survival Analysis of VWF and ADAMTS13
The access date: 1 December 2024
Purpose: To investigate overall survival (OS) status of VWF and ADAMTS13 in HCC.
Process: The KM Plotter (Kaplan–Meier Plotter) is an online tool designed to assess the effect of genes on survival in various cancers using clinical data. This enables researchers to conduct meta-analyses of gene expression data to identify potential prognostic biomarkers. Users can generate Kaplan–Meier survival plots to visualize the relationship between gene expression levels and patient survival outcomes. It integrates data from several high-quality sources such as the Gene Expression Omnibus (GEO), European Genome-phenome Archive (EGA), and TCGA and combines clinical data with gene expression profiles to provide a comprehensive analysis [27].
2.6. The Correlation, Targetgram, and Gene Signature Analysis of VWF and ADAMTS13
The access date: 1 December 2024
Purpose: To investigate the correlation, Targetgram, and gene signature of VWF and ADAMTS13 in HCC.
Process: The TNMplot database allows users to compare gene expression changes in real-time across tumor, normal, and metastatic tissues for all genes using various platforms. The analysis portal is accessible without registration at its original website (www.tnmplot.com accessed on 1 December 2024) and offers three distinct analysis options. One of these, the pan-cancer analysis tool, enables the simultaneous comparison of normal and tumor samples across 22 different tissue types [28].
2.7. The Gene–Gene Interaction
The access date: 1 December 2024
Process: We used the STRING database to reveal the interactions and possible mechanisms of VWF and ADAMTS13 with other related proteins. The STRING database systematically predicts protein–protein interactions including both physical and functional associations. Data were provided from sources such as automated text mining of the scientific literature, computational interaction predictions from co-expression, conserved genomic context, and databases of interaction experiments. All these interactions are critically evaluated and scored and then automatically transferred to less-studied organisms using hierarchical orthology information [29].
2.8. MicroRNA Target Analysis
The access date: 1 December 2024
URL: https://mirdb.org/
Purpose: To investigate target miRNAs of VWF and ADAMTS13 in HCC. By identifying miRNAs associated with these genes, the study aimed to uncover regulatory networks that could provide further insights into their roles in HCC pathogenesis and progression.
Process: We used the MicroRNA Target Prediction Database (miRDB) [30] and TargetScan 8.0 to identify and predict the target genes of differentially expressed miRNAs [31,32].
2.9. Enrichment Analysis of ADAMTS13 and VWF (Enrichr-KG)
The access date: 1 December 2024
Purpose: To investigate gene enrichment of ADAMTS13 and VWF.
Process: Differentially expressed gene (DEG) analysis was conducted using the Enrichr-KG web tool across several categories: Gene Ontology (GO) biological process (https://geneontology.org/ accessed on 1 December 2024), Kyoto Encyclopedia of Genes and Genomes (KEGG) (https://www.genome.jp/kegg/ accessed on 1 December 2024), Jensen_DISEASES (https://diseases.jensenlab.org/Search accessed on 1 December 2024) for exploring disease–gene associations, and DisGeNET (https://disgenet.com/) for compiling data on genes and variants linked to diseases. The analysis was limited to the top 20 terms, with statistical significance defined as p < 0.05 [33].
2.10. Association of HCC-Associated Long Non-Coding RNAs (LncRNAs) with VWF and ADAMTS13
The access date: 20 January 2025
Purpose: To predict HCC-associated long non-coding RNAs.
Process: We used the LncRNADisease database to find long non-coding RNAs associated with HCC. The lncRNADisease database serves as both a repository of experimentally validated lncRNA–disease association data and a platform offering tools to predict potential novel lncRNA–disease associations. Furthermore, it compiles data on lncRNA interactions across multiple levels including proteins, RNAs, miRNAs, and DNA [34].
Purpose: To investigate the association of LncRNAs with VWF and ADAMTS13.
Process: We used the ENCORI database to examine the relationship between long non-coding RNAs with VWF and ADAMTS13. The ENCORI Pan-Cancer Analysis Platform was developed to unravel pan-cancer networks involving lncRNAs, miRNAs, pseudogenes, snoRNAs, RNA-binding proteins (RBPs), and all protein-coding genes. This was achieved by analyzing the expression profiles from approximately 10,000 RNA-seq and 9900 miRNA-seq samples across 32 cancer types, integrated from TCGA project [35].
2.11. Detection of Differentially Expressed Genes (DEGs)
The access date: 25 February 2025
Purpose: To evaluate differential gene expression analysis of VWF and ADAMTS13.
Process: The Gene Expression Omnibus (GEO) datasets were used in this study. The datasets analyzed were GSE14520 [36,37,38,39,40,41,42,43,44,45,46,47,48] using the GPL10558 [HCC (n = 222), control (n = 212)] platform Affymetrix HT Human Genome U133A Array, Bethesda, MD, USA.
For gene expression profiling, tumors and paired non-tumor tissues were profiled separately using a single channel array platform. Tumor and paired non-tumor samples of 22 patients of cohort1 and the normal liver pool were carried out on Affymetrix GeneChip HG-U133A 2.0 arrays (Affymetrix, Santa Clara, CA, USA) according to the manufacturer’s protocol.
Analyses were conducted using the GEO2R tool (https://www.ncbi.nlm.nih.gov/geo/geo2r/ accessed on 25 February 2025) to identify differentially expressed genes (DEGs) in both datasets. This tool operates using GEOquery and limma to process microarray data and detect DEGs. In this study, multiple testing corrections were applied using the Benjamini and Hochberg false discovery rate method to compute the adjusted p-values. A log2 fold change threshold of 1 was used, and the significance level for the adjusted p-value was maintained at 0.05 by default. Genes with an adjusted p-value below 0.05 and Log2(FC) < −1 were classified as downregulated, while those with an adjusted p-value below 0.05 and Log2(FC) > 1 were identified as upregulated [49].
2.12. Statistical Analysis Methods
VWF and ADAMTS13 expression profiles were compared between HCC tumors and adjacent normal tissues. A t-test was used to determine statistical significance. The protein expression levels were examined using IHC and mRNA expression data. This was supported by visual analysis. Promoter methylation status was compared between tumor and normal tissues. Differences between methylation levels were analyzed using the Mann–Whitney U test. Immune cell infiltration of tumor tissue was analyzed. The relationships between VWF and ADAMTS13 expression and immune cell subgroups were calculated using the Pearson correlation coefficient. The Kaplan–Meier method was used for survival analyses. The effects of VWF and ADAMTS13 expression on OS were evaluated using the log-rank test. Changes in VWF and ADAMTS13 expression were compared among tumor, normal, and metastatic tissues. Statistical significance was determined using the Mann–Whitney U test. Gene–gene interaction networks were constructed, and functional relationships were evaluated by combined scores. The Spearman correlation coefficients were used to assess correlations among miRNA, lncRNA, and other genes associated with VWF and ADAMTS13.
3. Results
3.1. Expression Profile of VWF and ADAMTS13
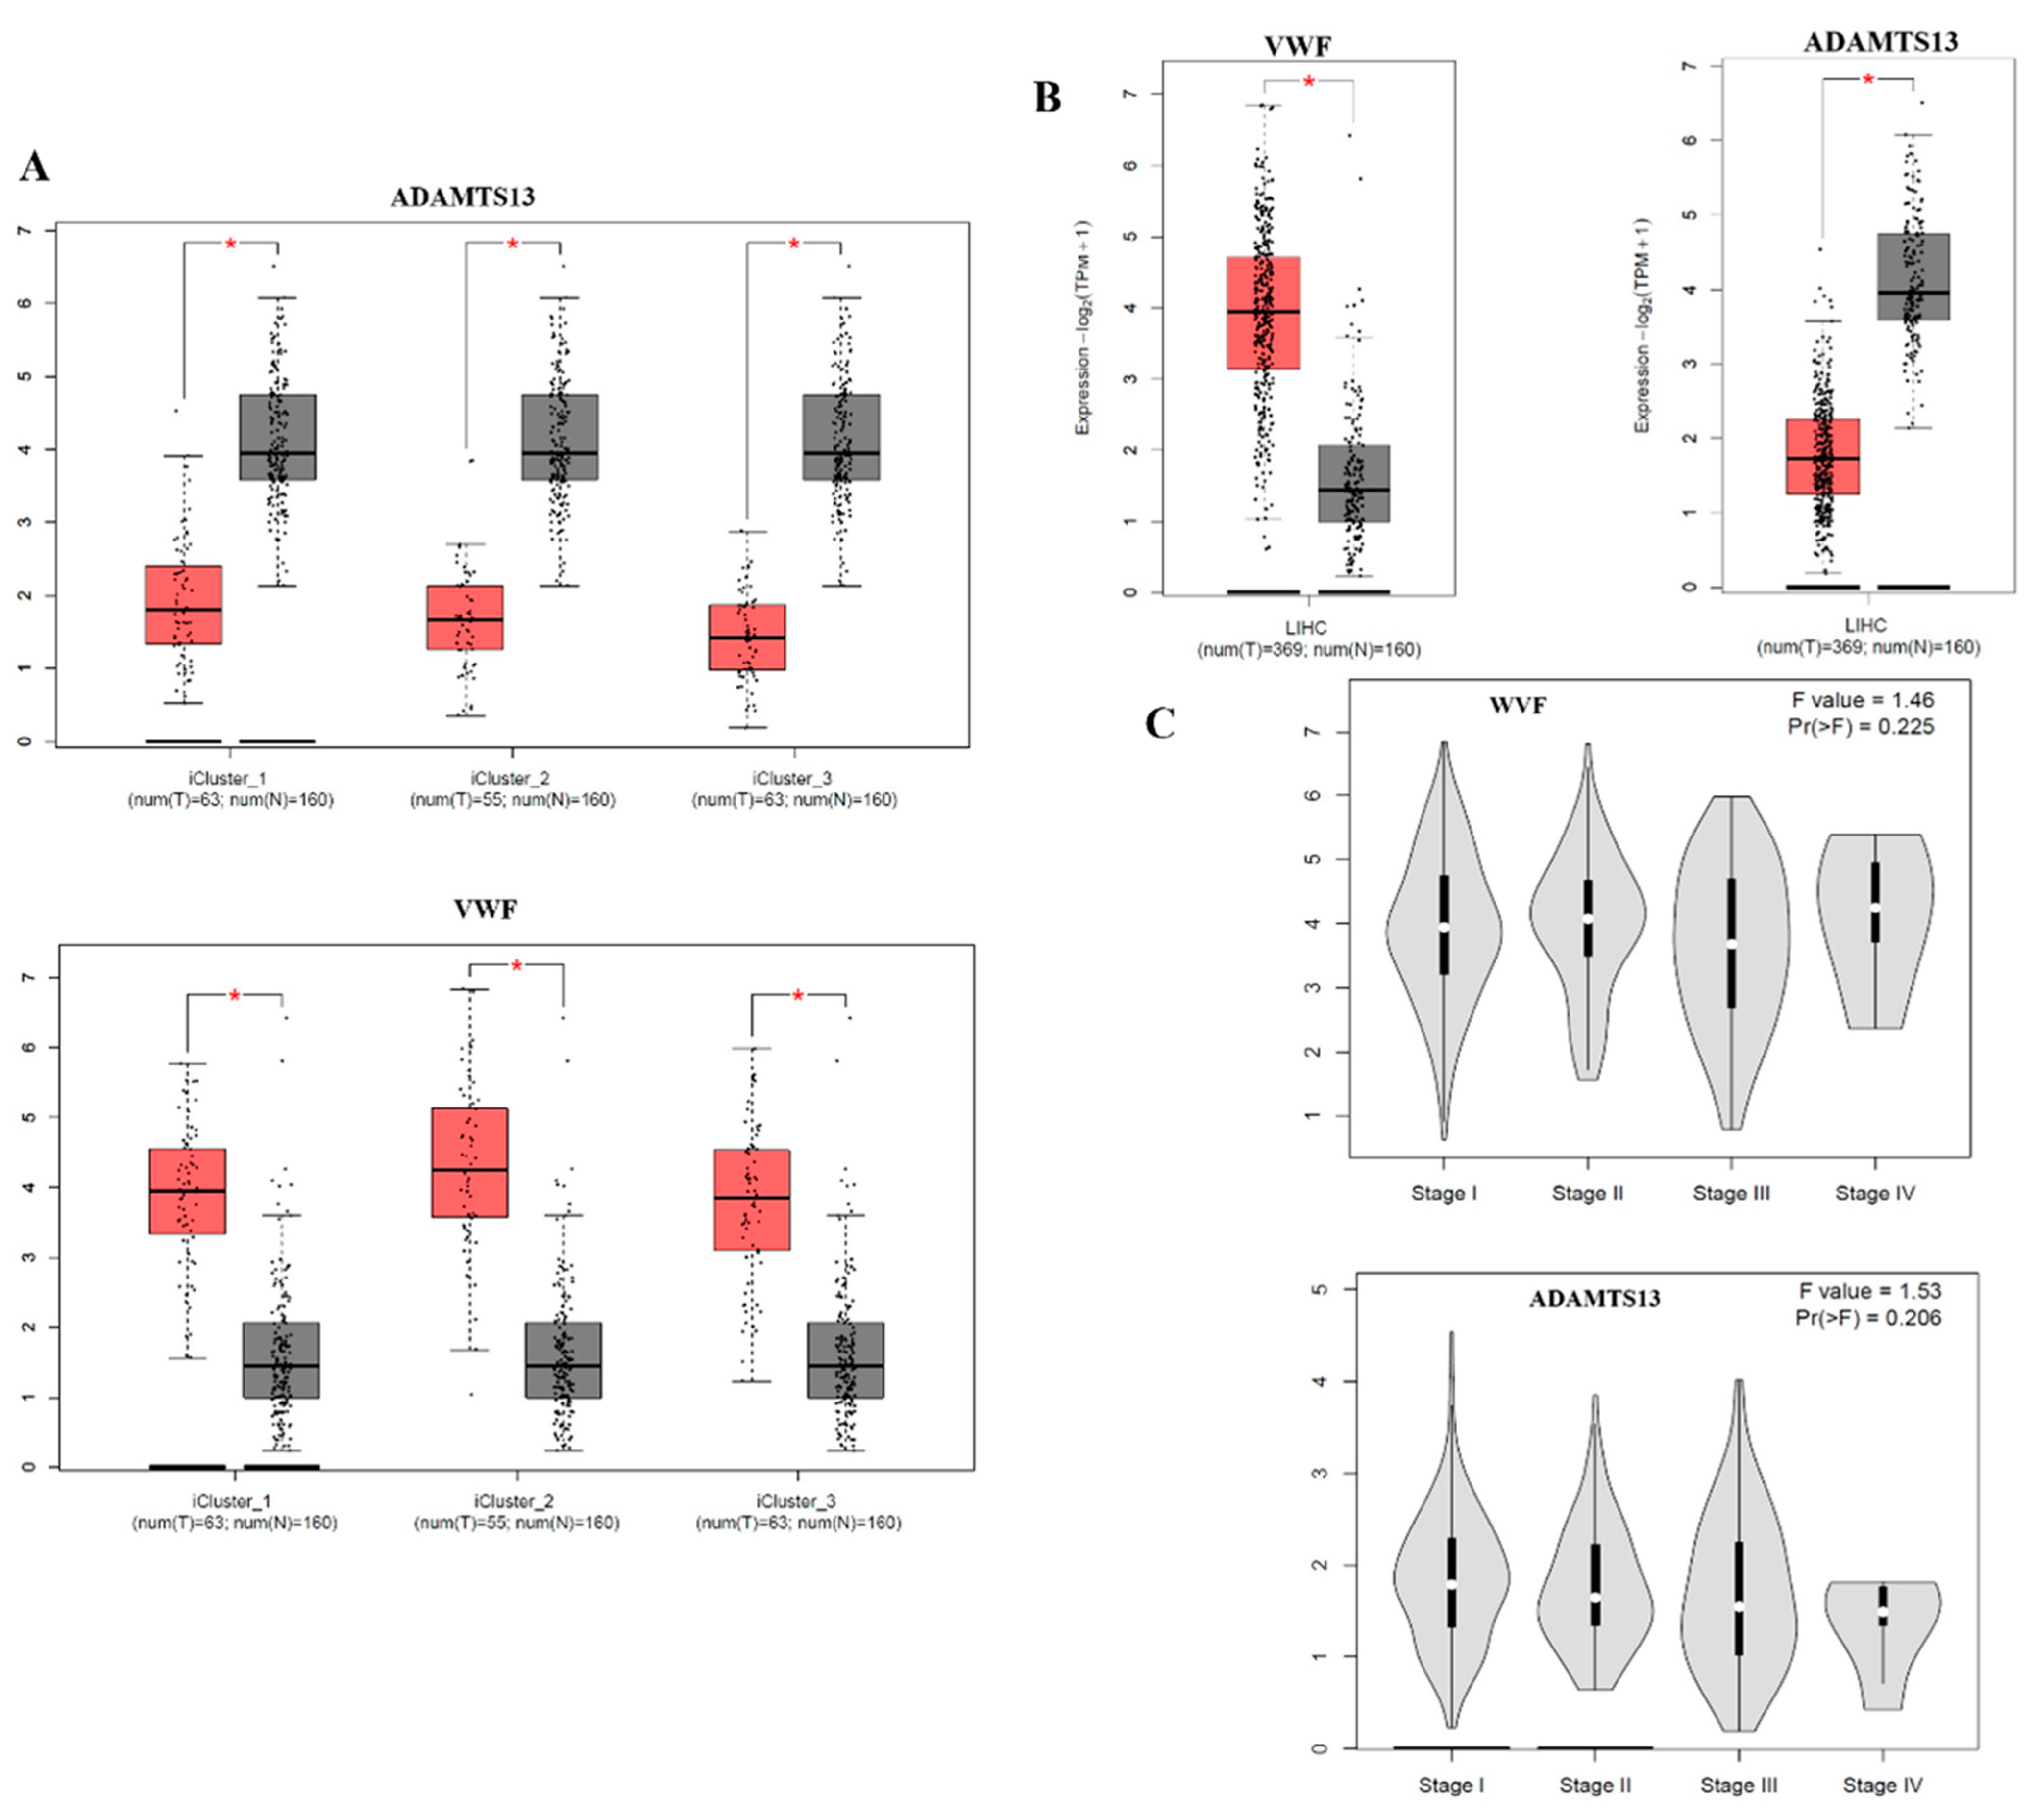
According to the subtype analysis of LIHC, the VWF expression level was significantly upregulated in all subtypes of LIHC compared to the adjacent normal tissue. In contrast, the expression level of ADAMTS13 was statistically downregulated in all subtypes of LIHC compared to adjacent normal tissue (Figure 2A).

Figure 2.
(A) The VWF and ADAMTS13 expression results in LIHC subtypes are demonstrated using the GEPIA2 webtool. (B) VWF and ADAMTS13 expression results in LIHC are shown in the GEPIA2 webtool. (C) Changes in VWF and ADAMTS13 expression according to LIHC stage. * p < 0.05 is statistically significant.
When the expression profiles of VWF and ADAMTS13 in LIHC patients were investigated, the VWF expression level was significantly upregulated in LIHC tissue (n = 369) compared to that in adjacent normal tissue (n = 160) (p < 0.05). In contrast, ADAMTS13 expression was significantly downregulated in LIHC tissues (n = 369) compared to adjacent normal tissues (n = 160) (p < 0.05) (Figure 2B).
Neither VWF nor ADAMTS13 expression levels were statistically significant at the LIHC stage (p > 0.05) (Figure 2C).
Additionally, the expression verification of VWF and ADAMTS13 was performed using HPA (Figure 3). Accordingly, there was high, medium, and low tumor staining in LIHC tumor tissues for ADAMTS13. However, this was not the case for VWF.
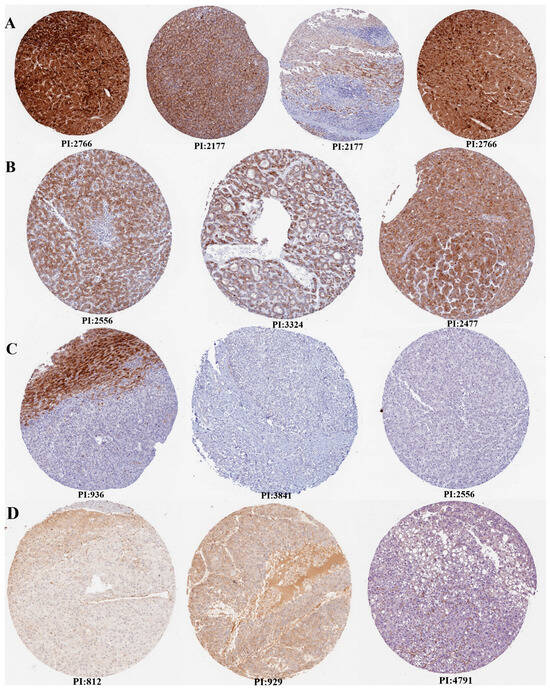
Figure 3.
Expression verification of ADAMTS13 and VWF by Human Protein Atlas (HPA). (A) High tumor staining for ADAMTS13, (B) medium tumor staining for ADAMTS13, (C) not detected tumor staining for ADAMTS13, (D) not detected tumor staining for VWF (there is no high, medium, or low level tumor staining in HPA for VWF). Scale bar = 200 µm.
3.2. Promoter Methylation Status of VWF and ADAMTS13
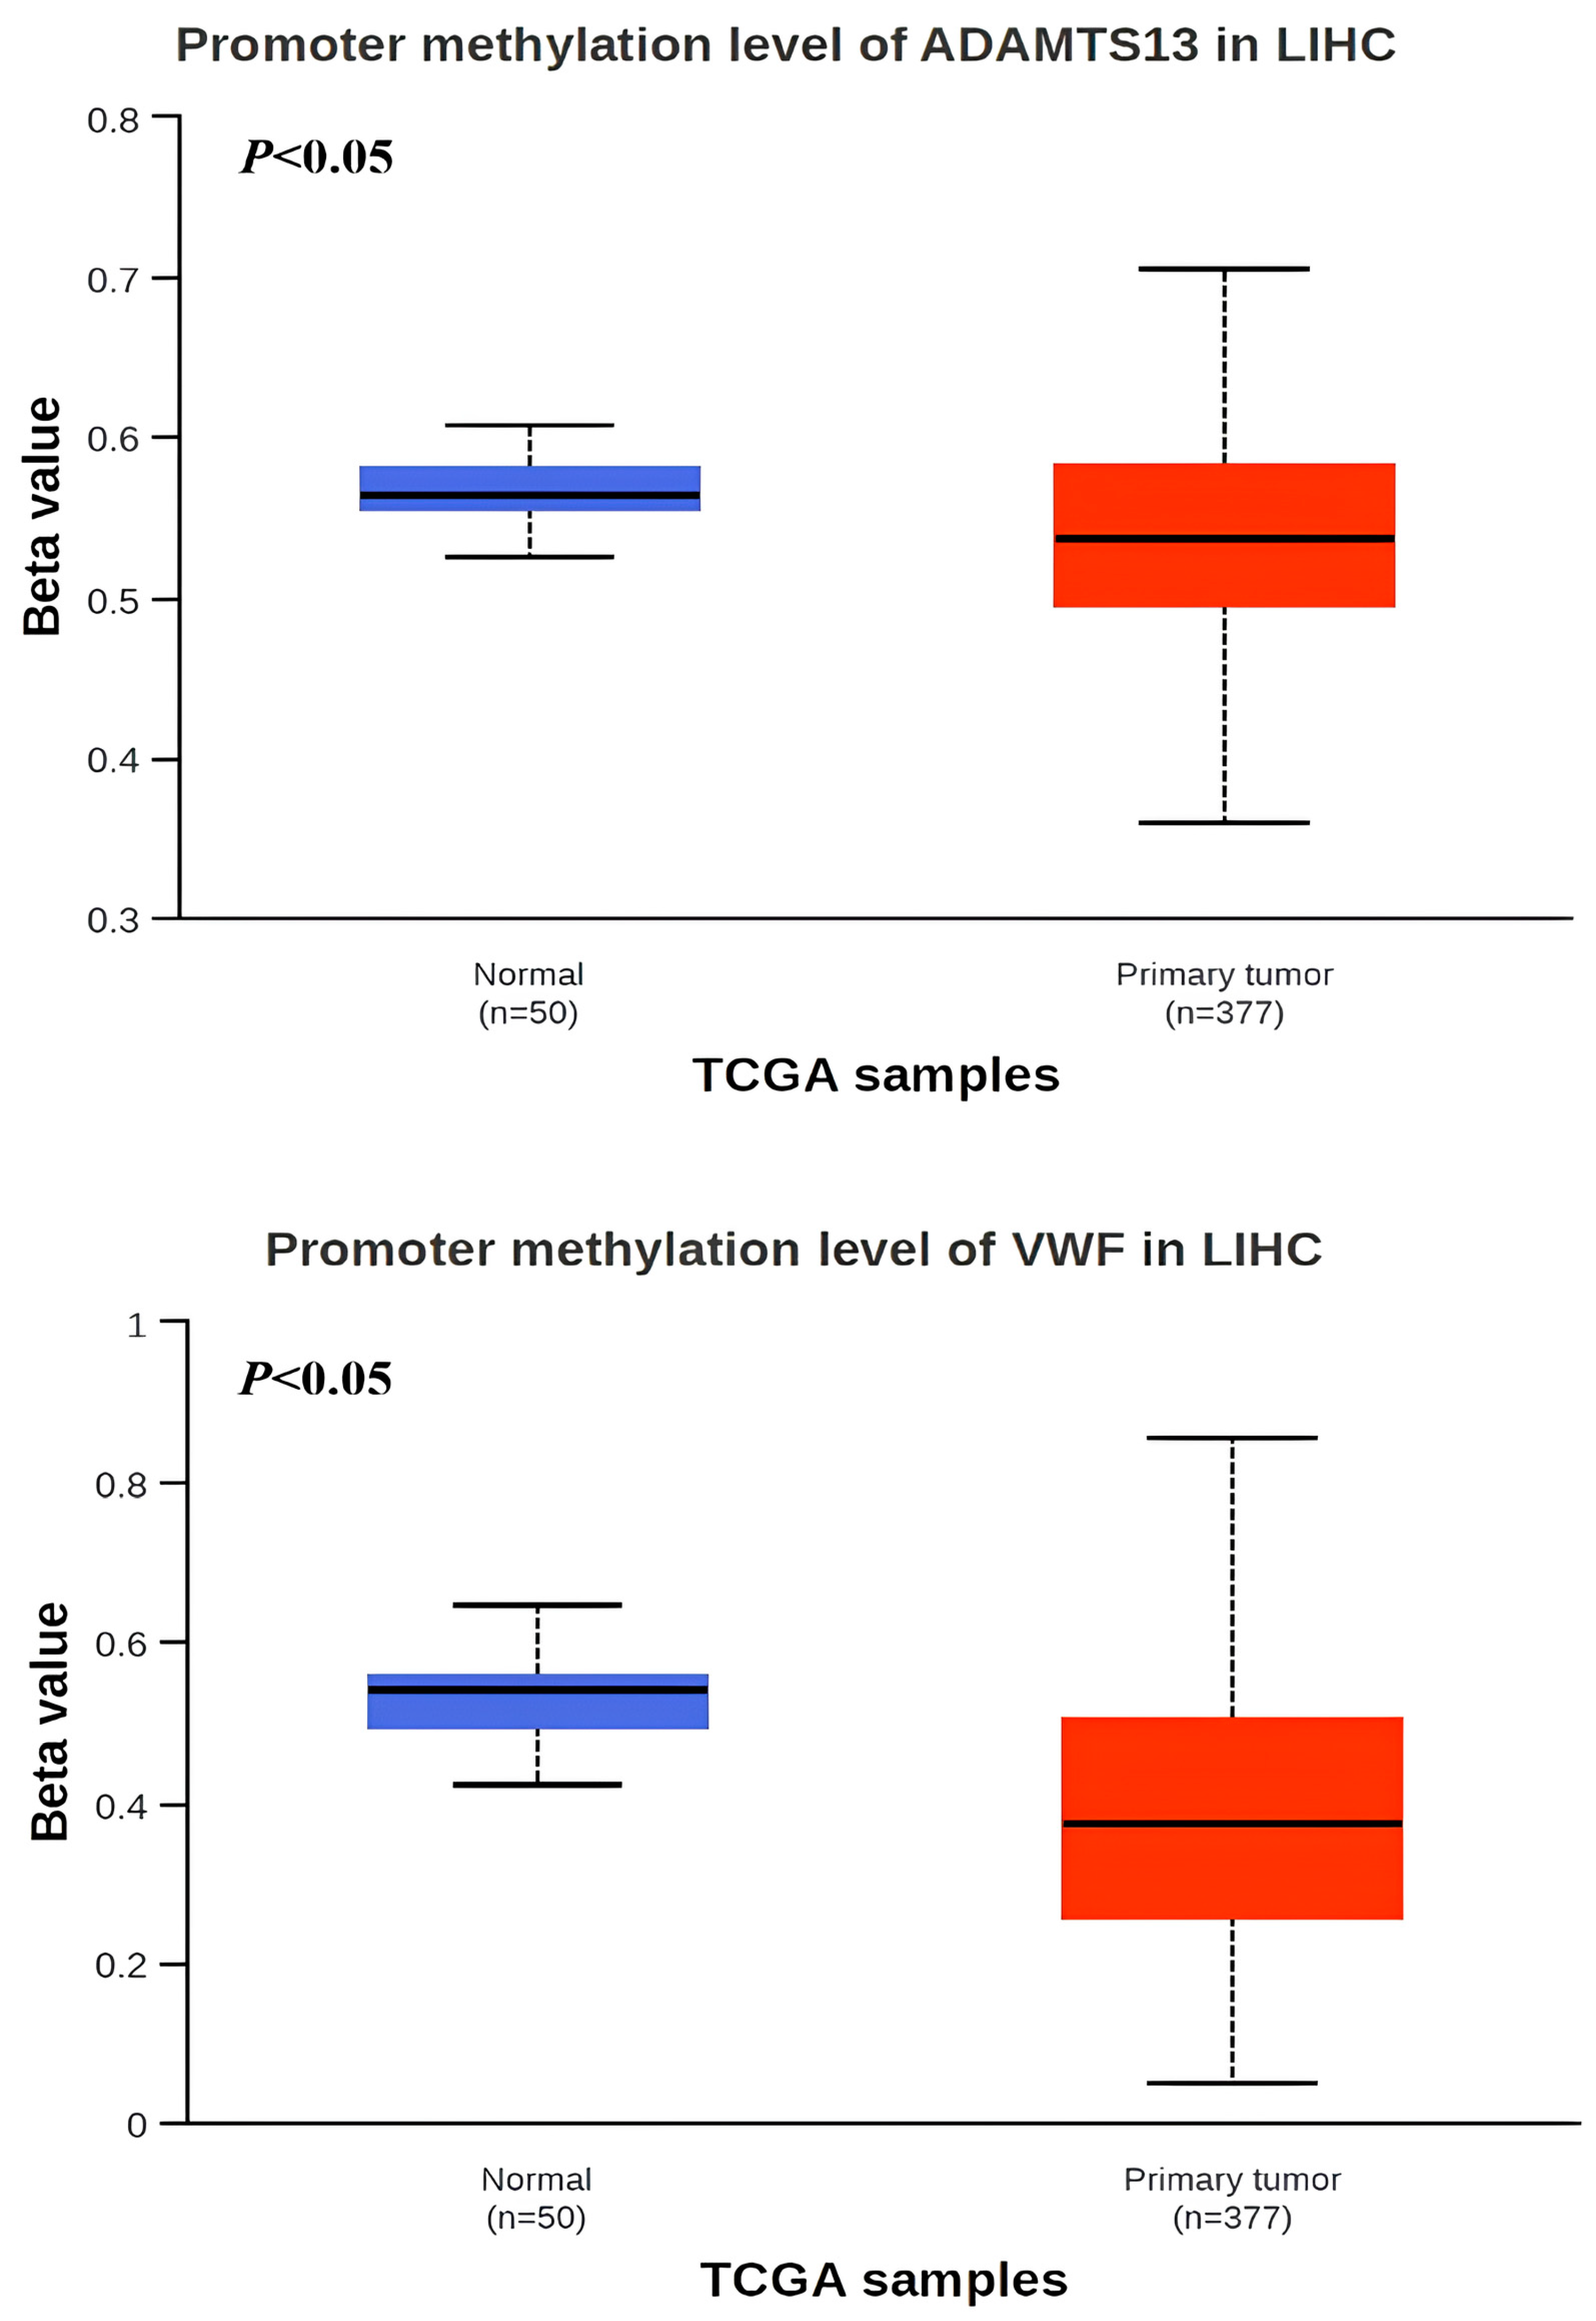
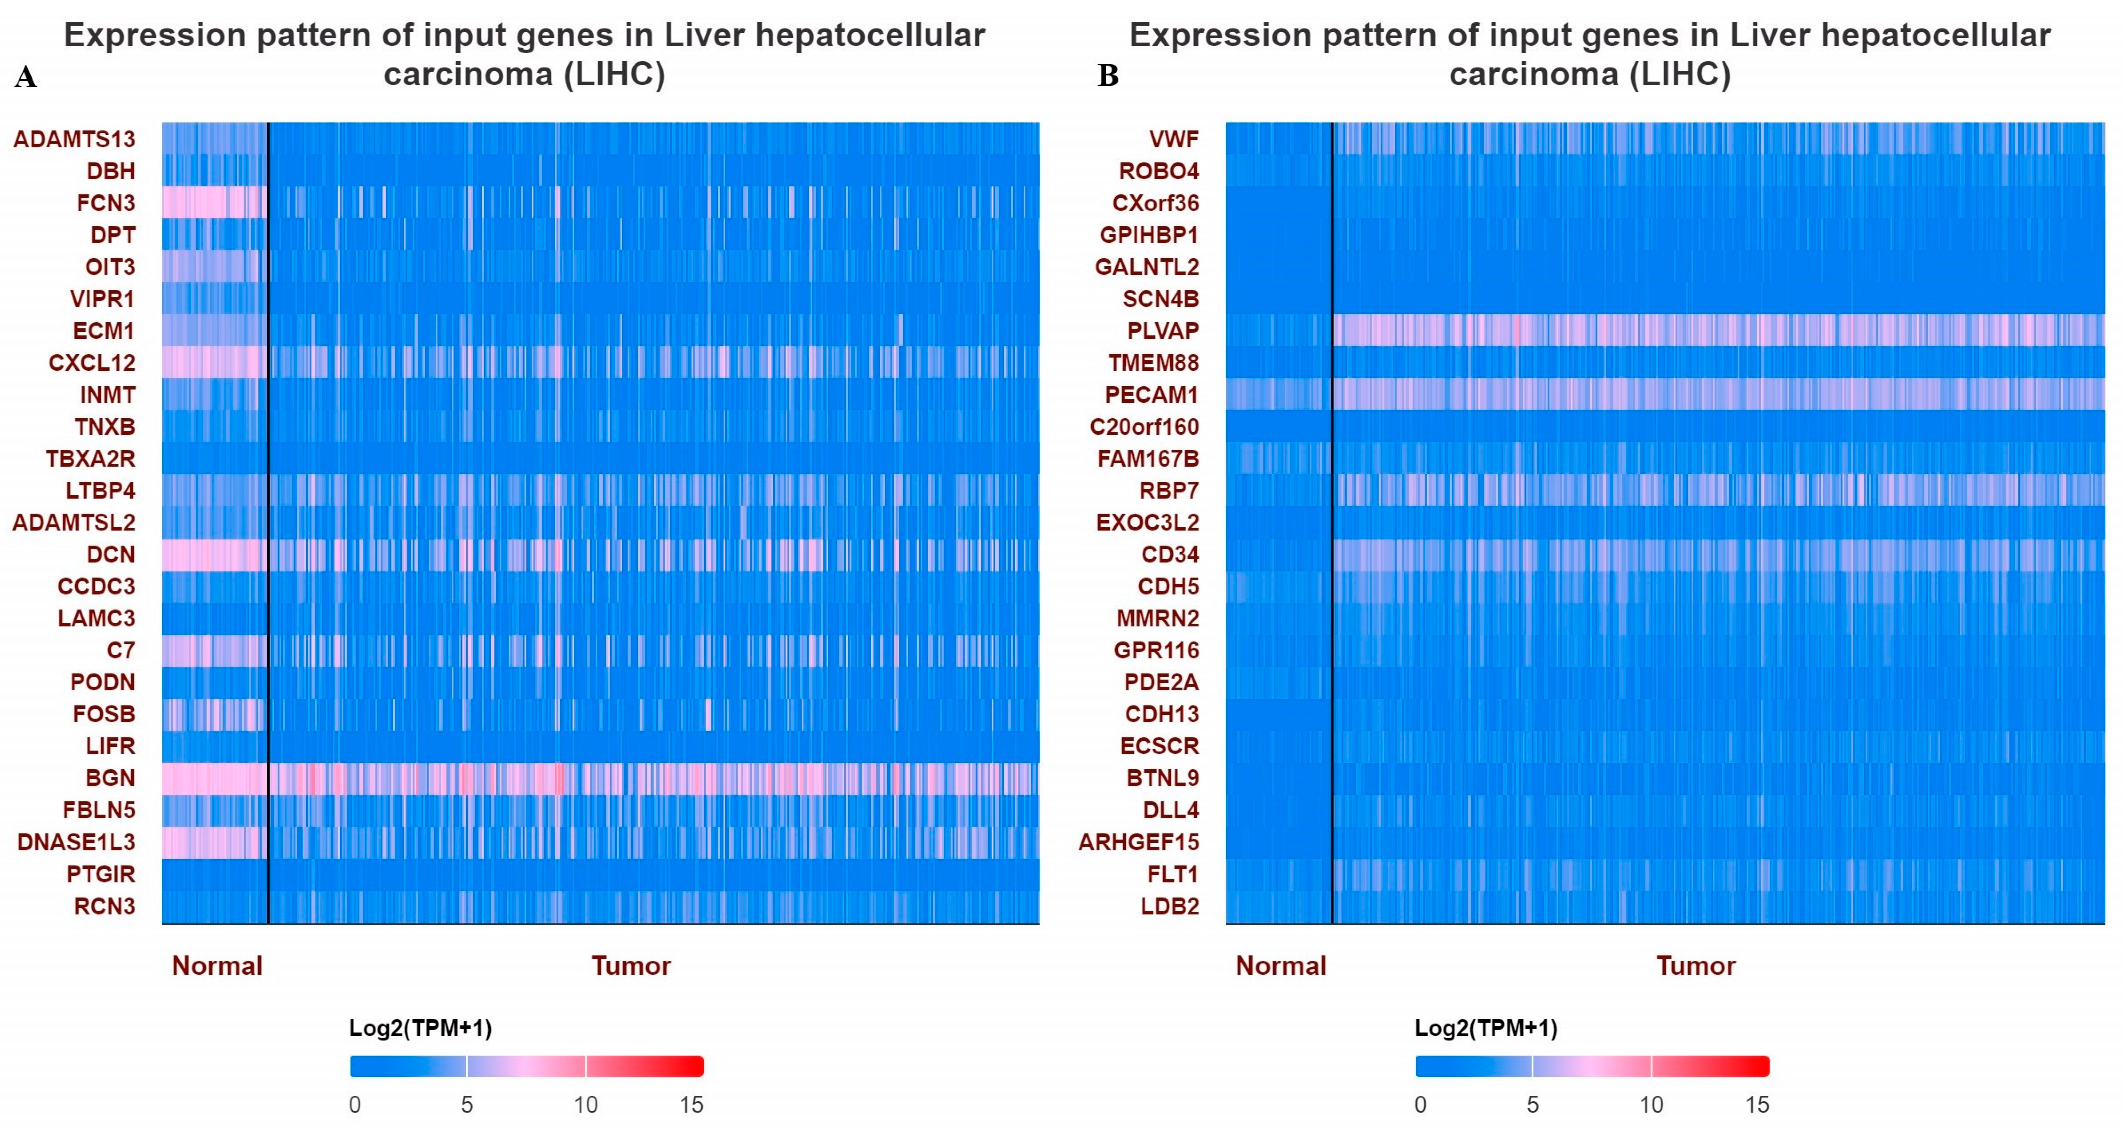
When the methylation status of VWF and ADAMTS13 in LIHC patients was investigated, the VWF methylation level was significantly hypomethylated in LIHC tissue (n = 377) compared to adjacent normal tissue (n = 50) (p < 0.05). Similarly, the ADAMTS13 methylation level was significantly hypomethylated in LIHC tissue (n = 377) compared to adjacent normal tissue (n = 50) (Figure 4). In addition, the expression pattern of the input genes in LIHC is shown in Figure 5A,B.

Figure 4.
Promotor region methylation of VWF and ADAMTS13 in LIHC.

Figure 5.
Heatmaps showing top differentially expressed genes in LIHC. (A) Expression pattern of top 25 input genes with VWF in LIHC, (B) expression pattern of top 25 input genes with ADAMTS13 in LIHC.
3.3. Survival Analysis Results of VWF and ADAMTS13
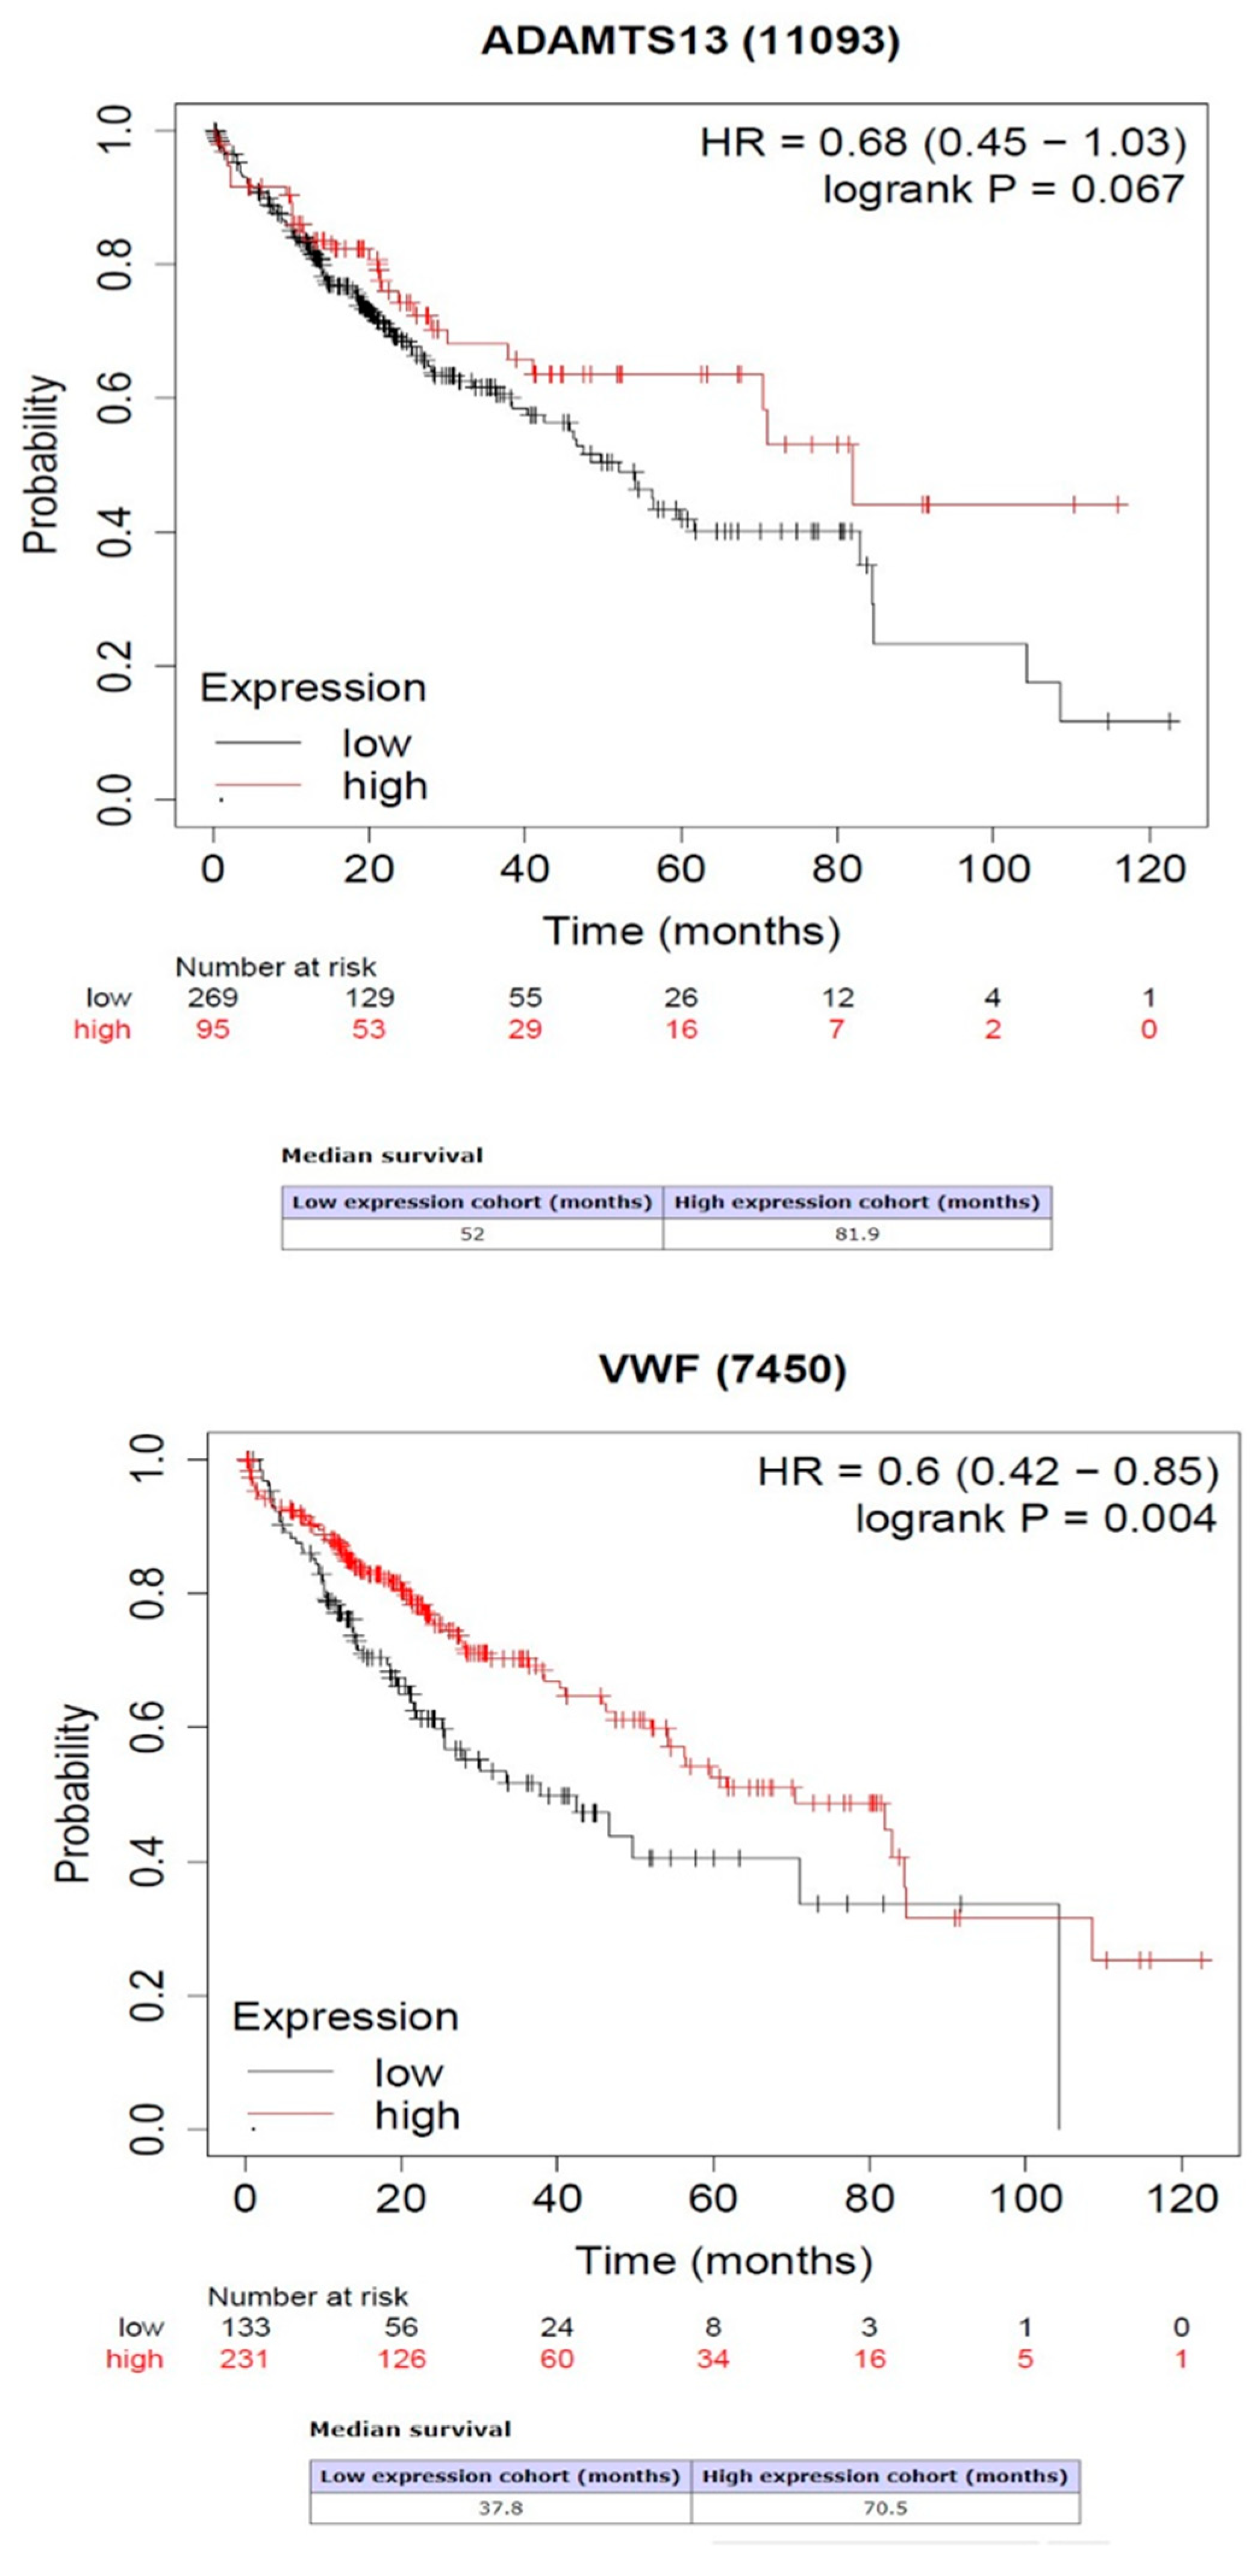
Kaplan–Meier survival analysis showed that the high expression of VWF predicted high rates of overall survival (OS) (p = 0.004). However, the high or low expression of ADAMTS13 was not related to OS prediction (p = 0.064) (Figure 6).
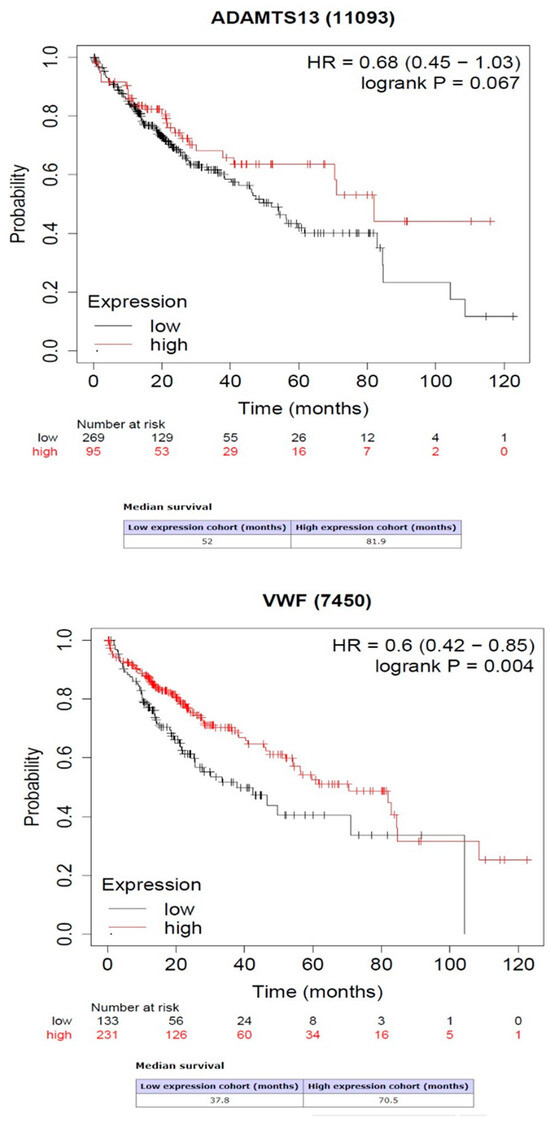
Figure 6.
Association between gene expression of ADAMTS13 and VWF with overall survival.
3.4. Immune Infiltrates and Gene Expression of ADAMTS13 and VWF
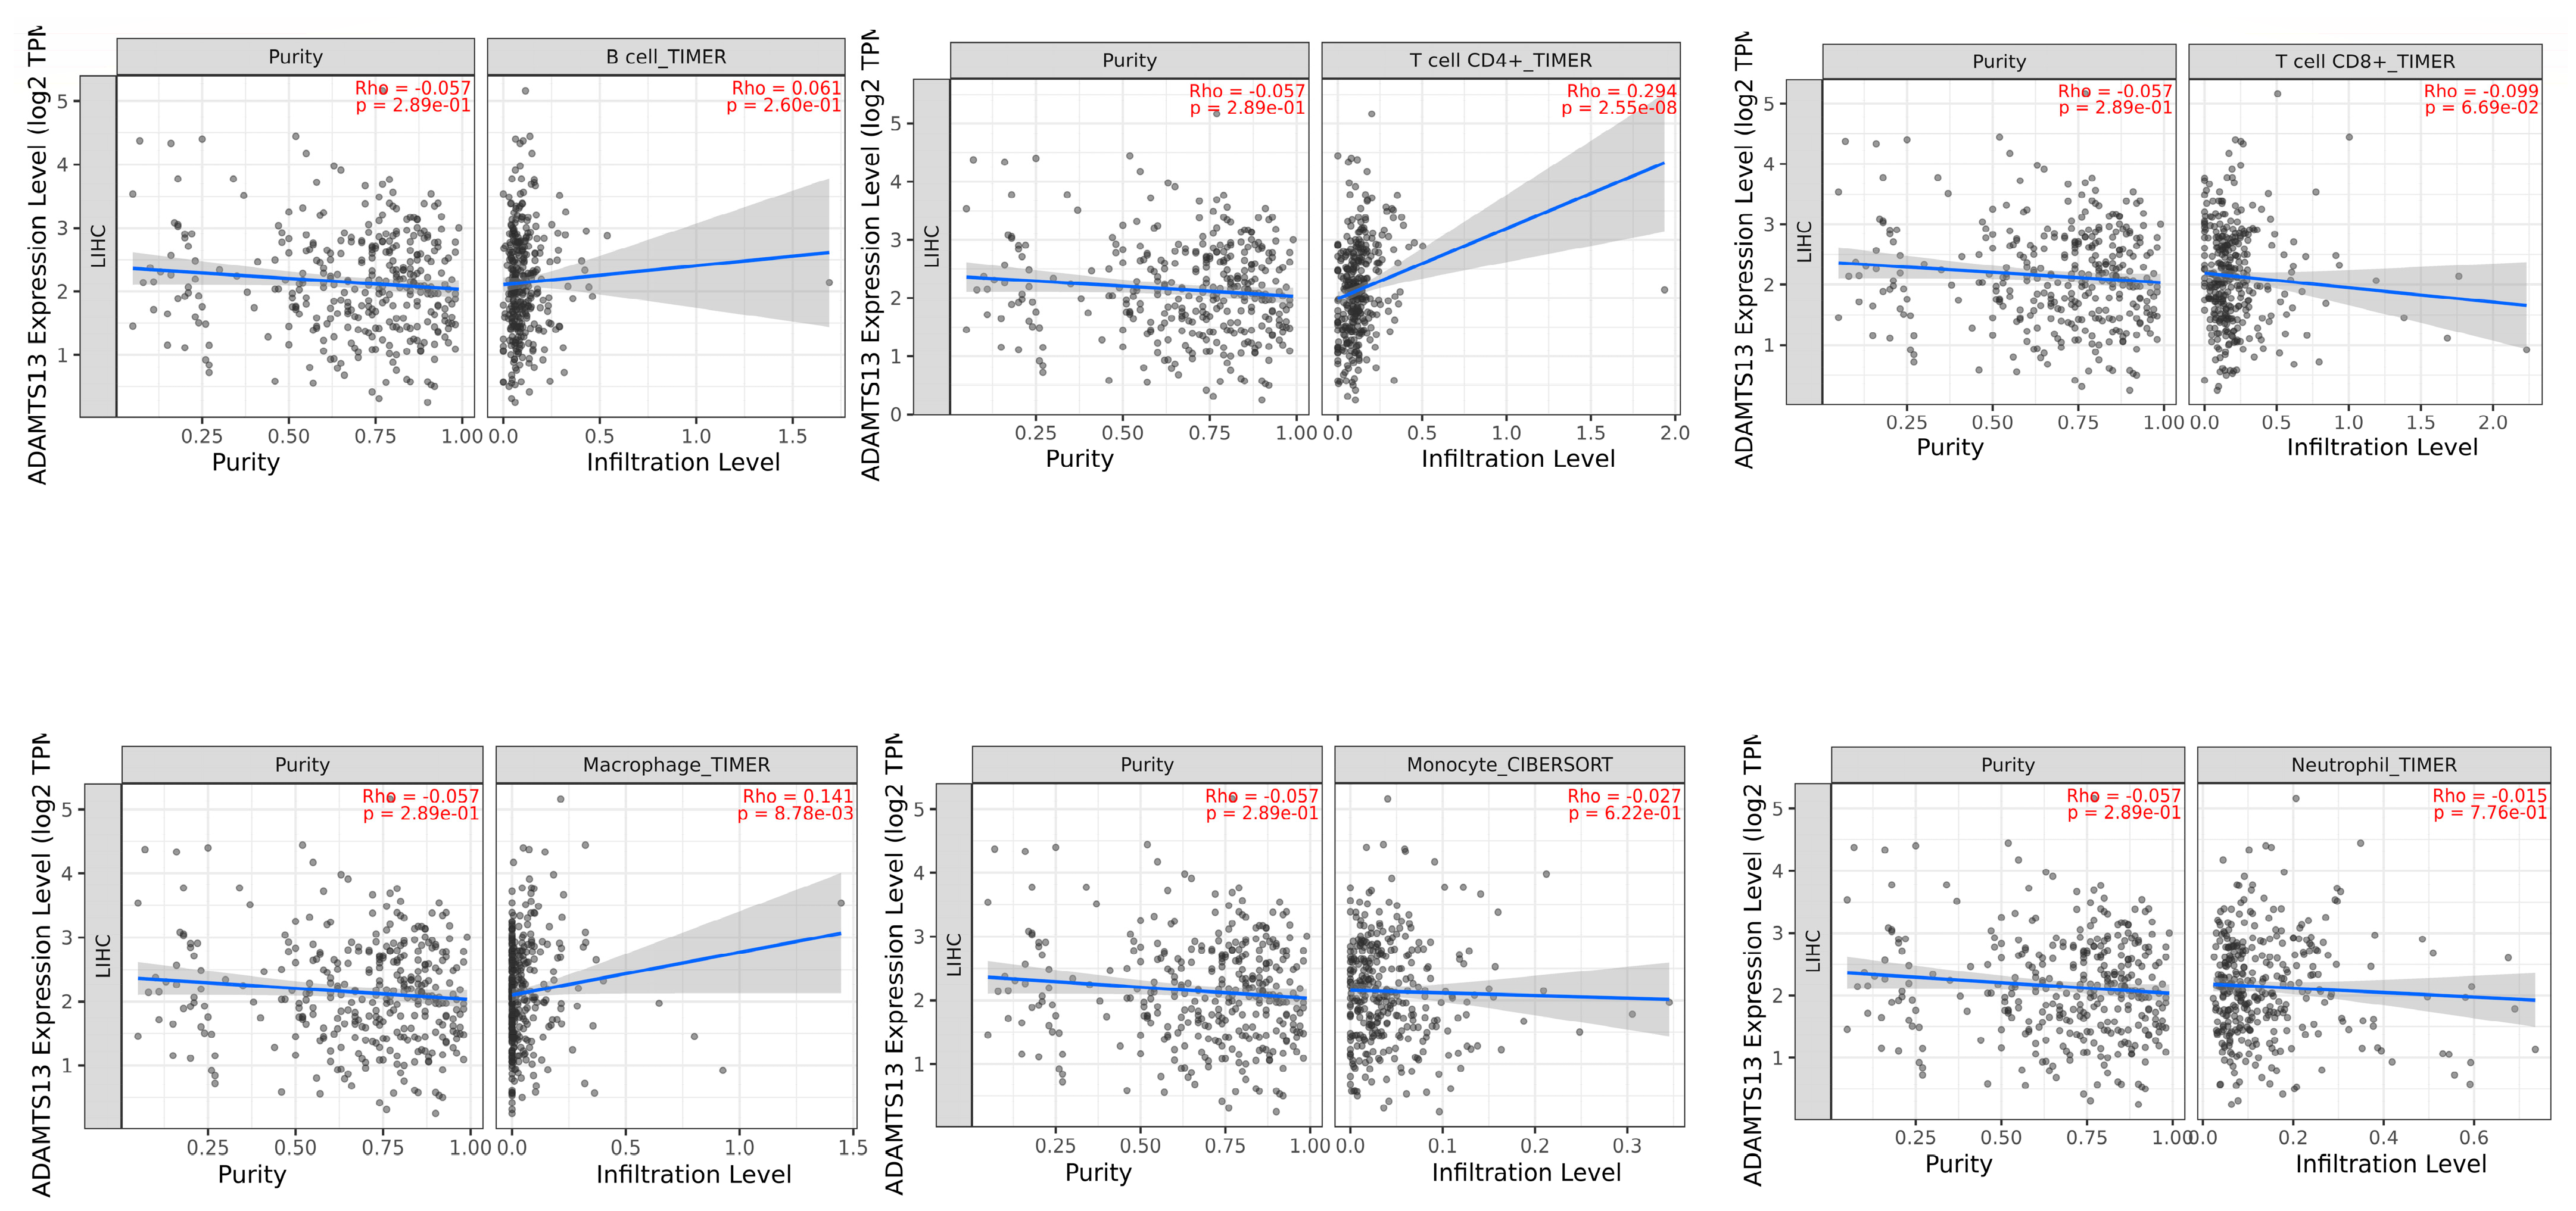
A significant positive correlation was observed between ADAMTS13 with CD4+ T cells (r = 0.294, p = 2.55 × 10⁻⁸) and macrophages (r = 0.141, p = 8.78 × 10⁻³). (Figure 7).
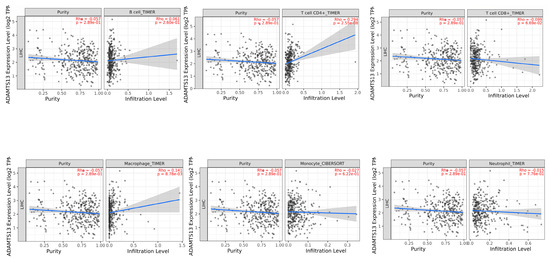
Figure 7.
Association of tumor-infiltrating immune cells (TIICs) with ADAMTS13 expression.
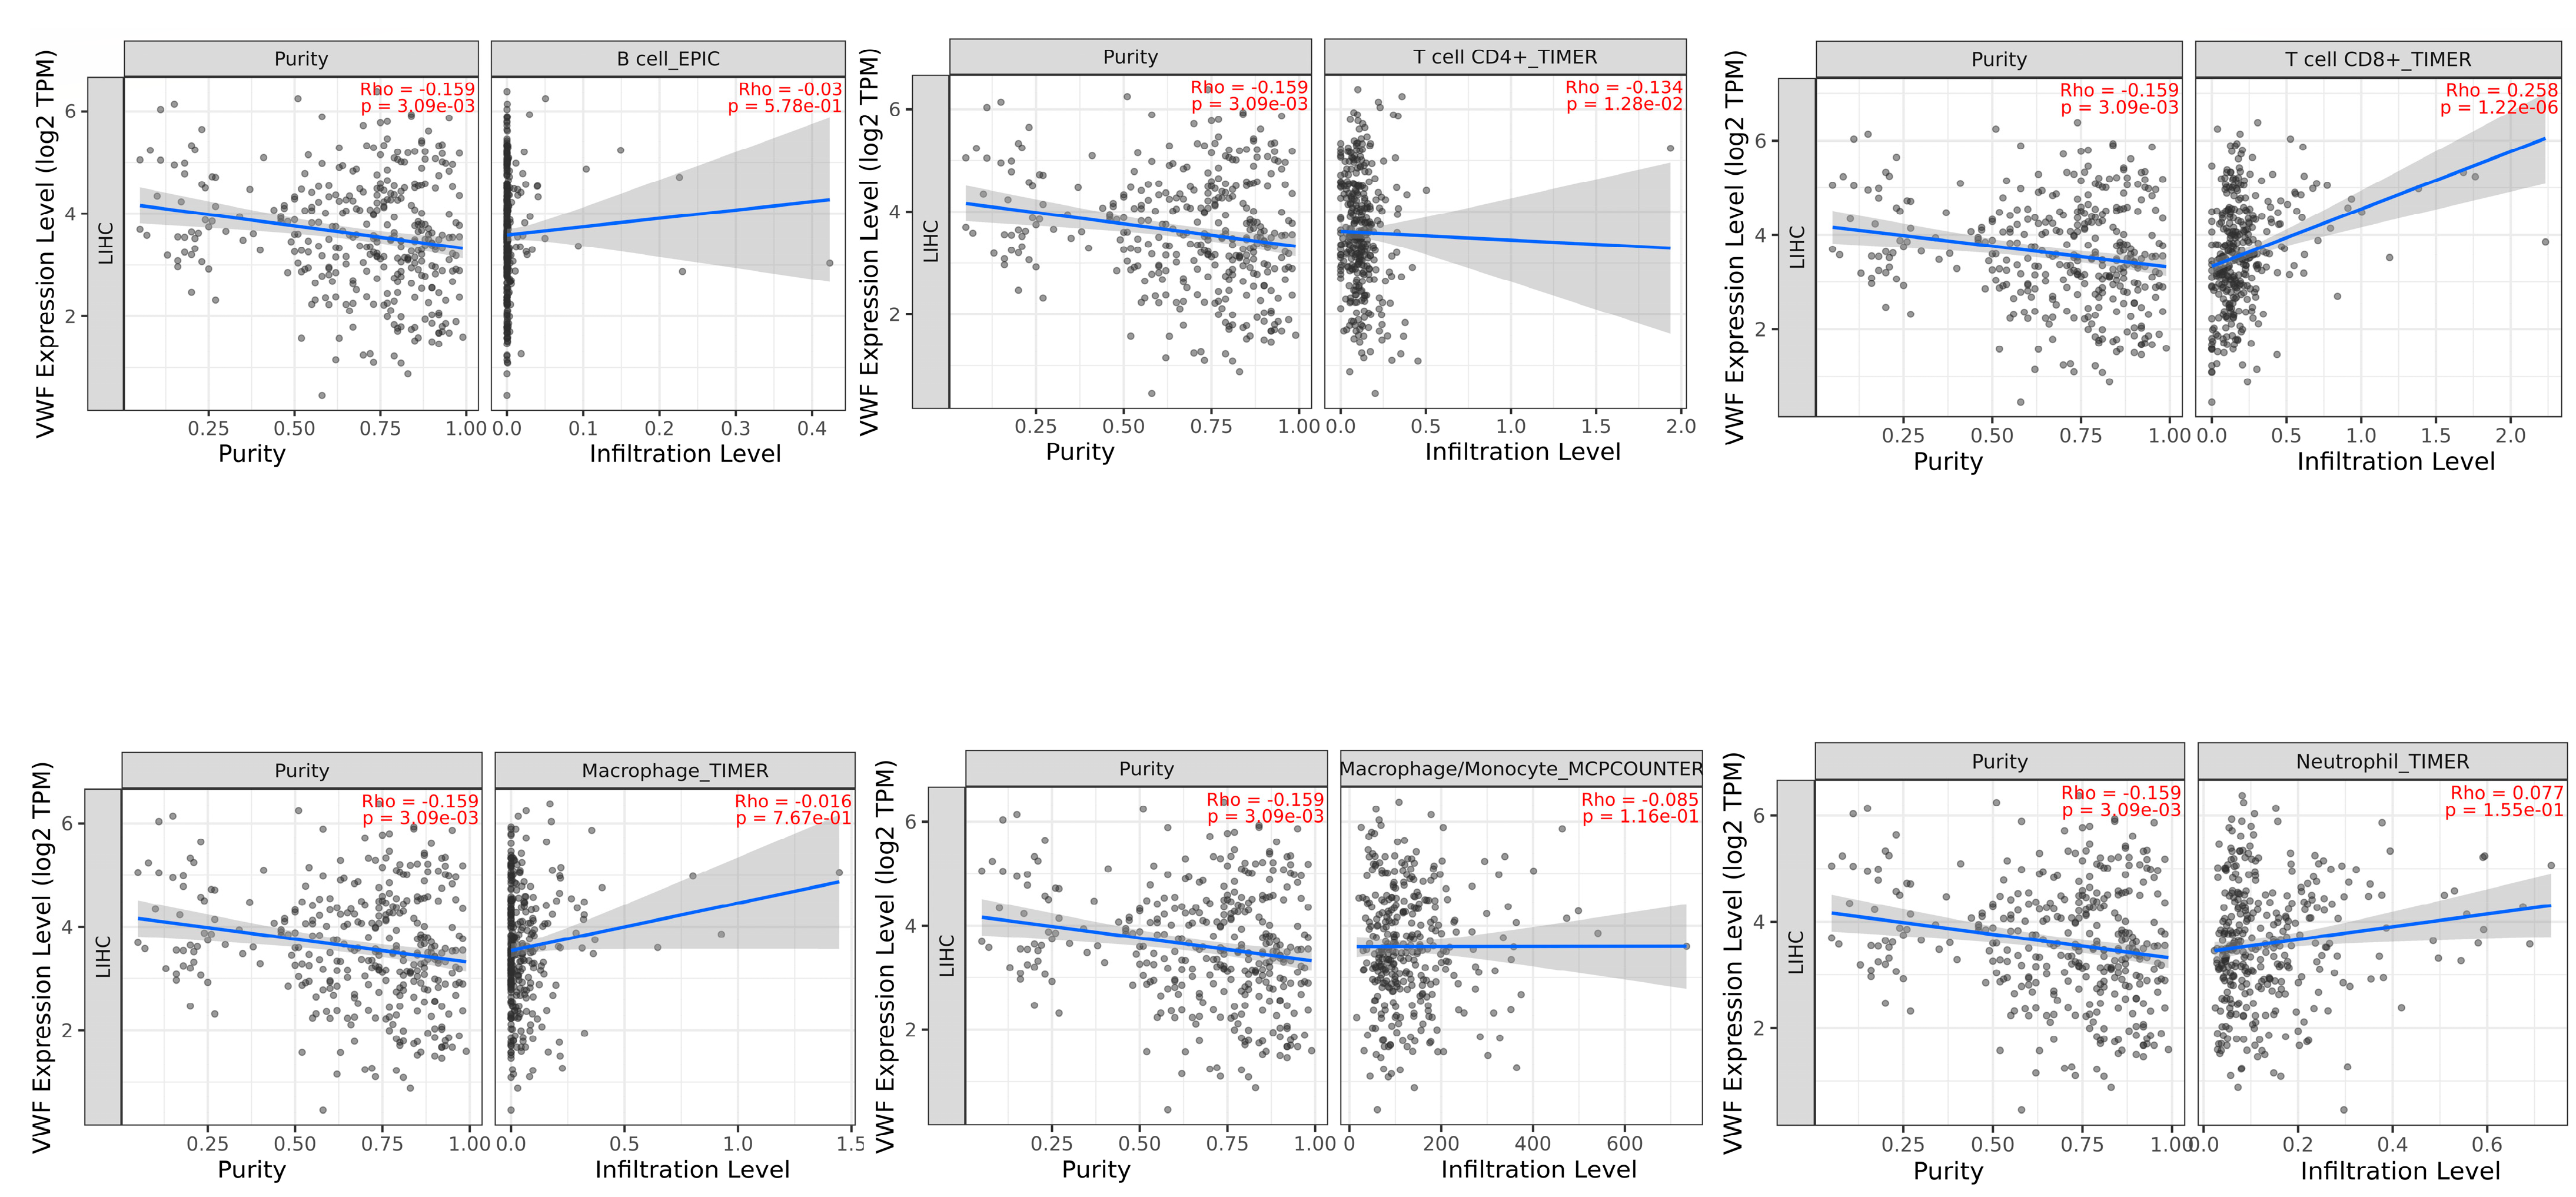
TIMER2 immune association analysis showed a significant negative correlation between VWF and tumor purity (proportion of tumor cells in the tumor microenvironment) (r = −0.159, p = 3.09 × 10⁻³) and CD4 + T cells (r = −0.134, p = 1.28 × 10⁻²). In contrast, a significant positive correlation was observed between VWF and CD8 + T cells (r = 0.258, p = 1.22 × 10⁻⁶), whereas there was a significant negative correlation between VWF and tumor purity (r = −0.159, p = 3.09 × 10⁻³) (Figure 8).
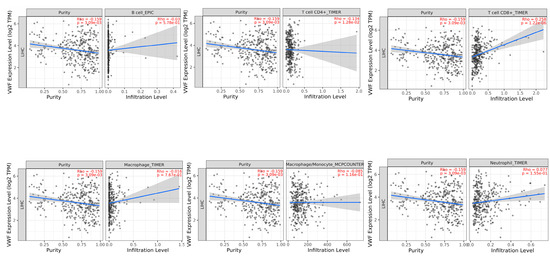
Figure 8.
Association of tumor-infiltrating immune cells (TIICs) with VWF expression in LIHC.
3.5. TNMplot Analysis of VWF and ADAMTS13
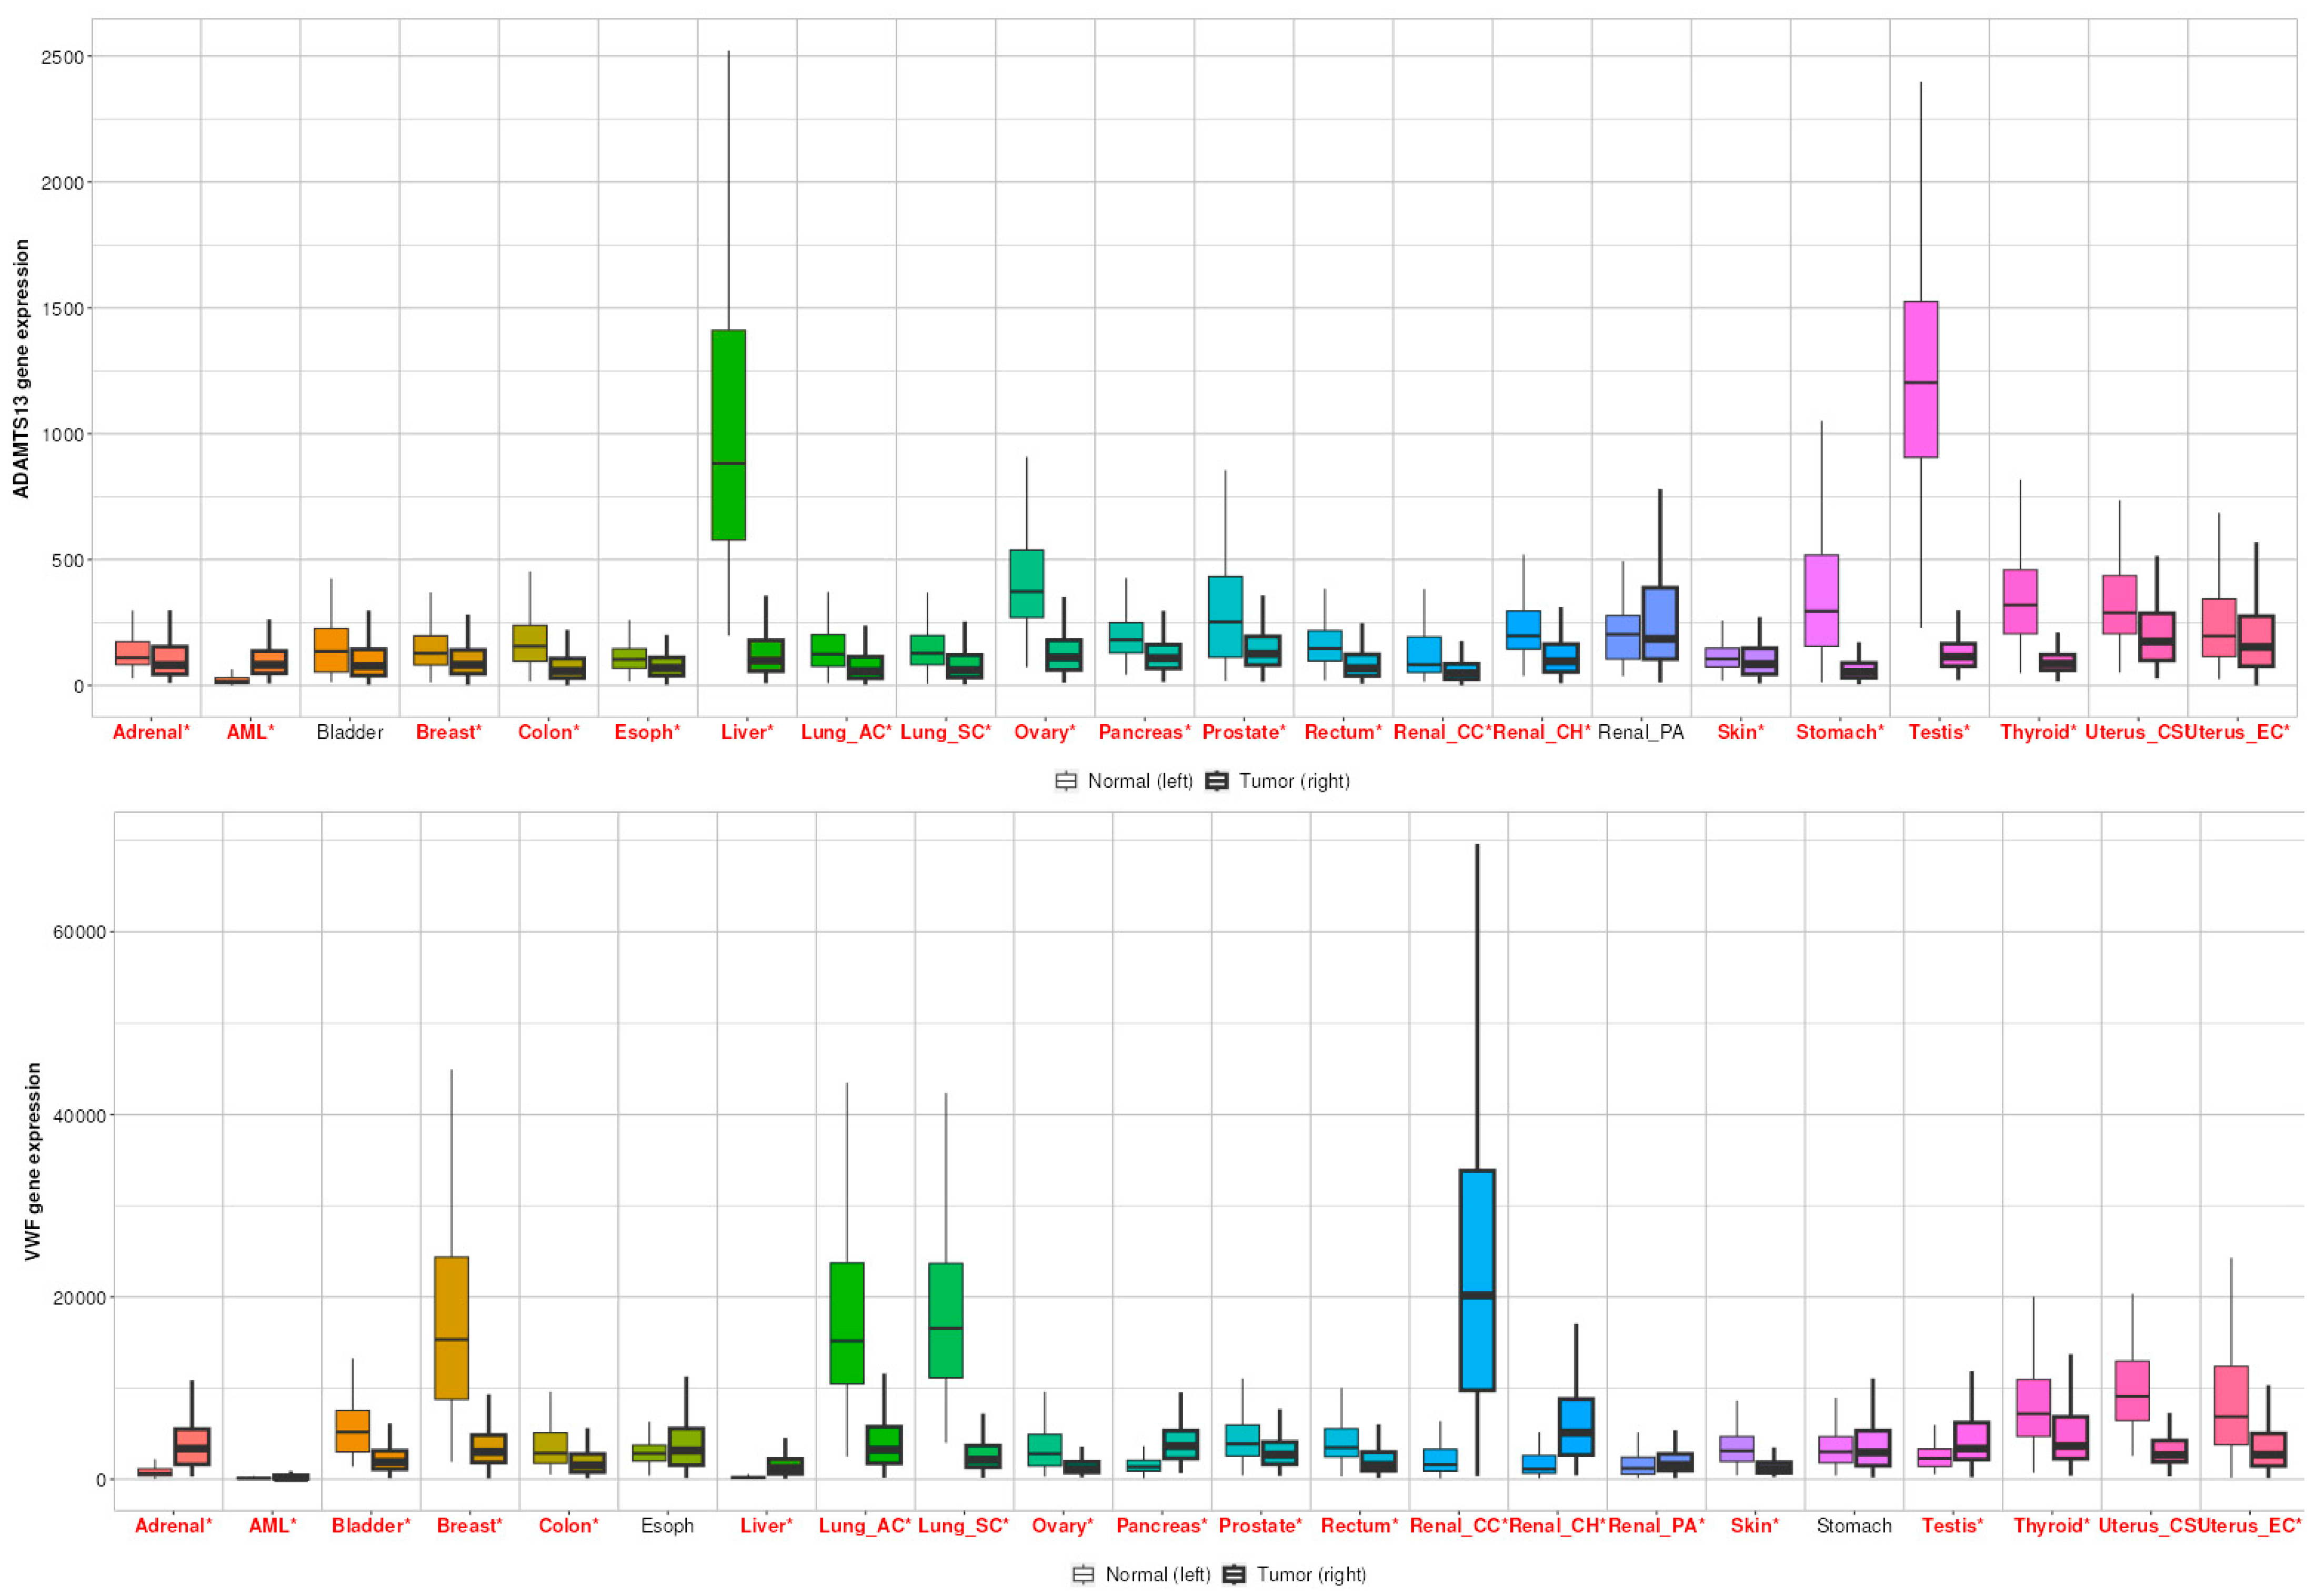
When all cancer types were examined, ADAMTS13 expression was significantly altered in all cancer types, except bladder and renal PA (Figure 9). In contrast, VWF expression was significantly altered in other cancer types, except esophageal and gastric cancer (Figure 9).

Figure 9.
Differential gene expression results of VWF and ADAMTS13 in all cancer types. Red ones represent statistically significant level (p < 0.05).
According to the results, the difference in gene signature analysis between tumor and normal tissues was statistically different in the direction of upregulation in the tumor tissue (p = 0.024) (Figure 10A). In addition, according to the multigene analysis results, there was an inverse relationship between VWF and ADAMTS13 expression in LIHC tissues (Figure 10B). Changes in the expression of ADAMTS13 and VWF in normal, tumor, and metastatic tissues are shown in Figure 10C. Gene signature analysis calculates the averages of the selected gene signatures for each patient and presents a summary graph using RNA-Seq-based data. The Targetgram page provides an overview of the selected gene set in the selected tissue using gene chip-based data; the size of the segments represents the mean values, and the length of the dashed lines represents the median values of each type. According to the results of this analysis, the median VWF was the highest in tumor tissue (Figure 10D).
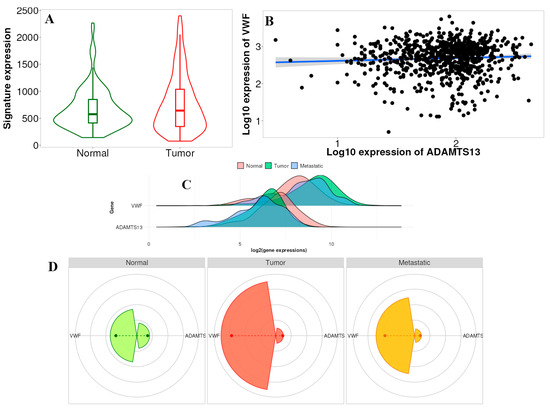
Figure 10.
(A) Gene signature result of ADAMTS13 and VWF in normal tissue vs. tumor tissue (p < 0.05). (B) Comparison of correlation between VWF and ADAMTS13 using multiple correlation methods in selected tissue type based on RNA-Seq data (r = −0.15, p = 0.02, Spearman correlation). (C) Multigene analysis showed expressions of VWF and ADAMTS13 in normal, tumor, and metastatic tissues. (D) Targetgram analysis of VWF and ADAMTS13 in normal, tumor, and metastatic tissues.
3.6. Gene–Gene Interaction Combined Score Results
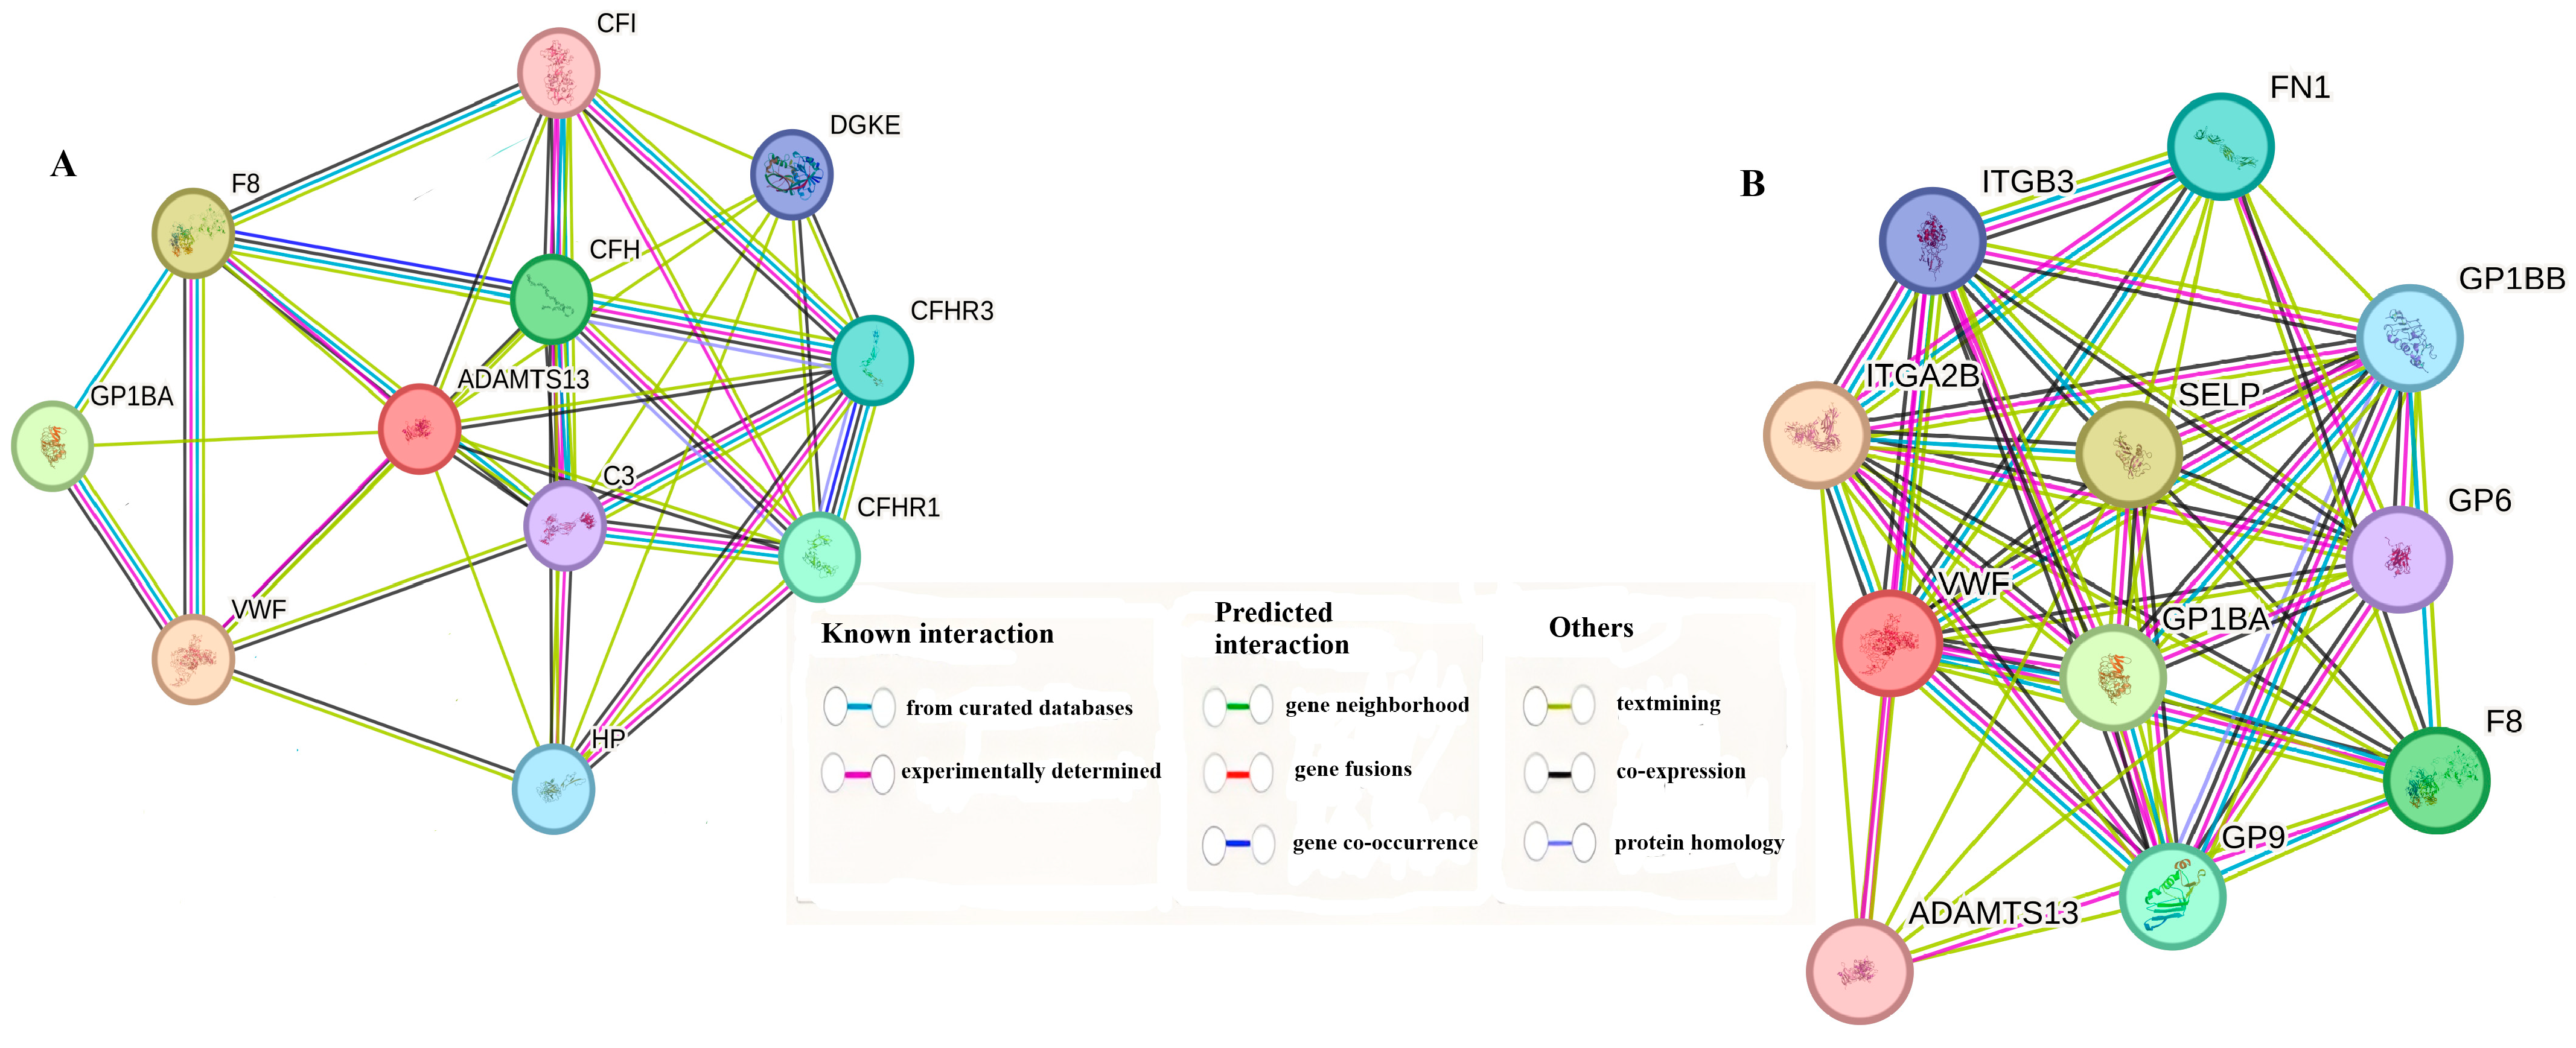
The 10 genes that interacted most with both VWF and ADAMTS13 are shown in Table 1 according to their combined scores. In addition, a schematic representation of the interactions of the same genes is given in Figure 11A,B.

Table 1.
Combined score results of gene–gene interactions.
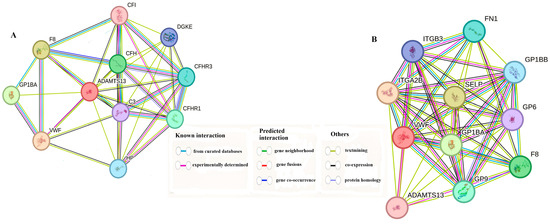
Figure 11.
(A) Genes associated with ADAMTS13. (B) Genes associated with VWF gene.
3.7. MicroRNA Target Analysis Result
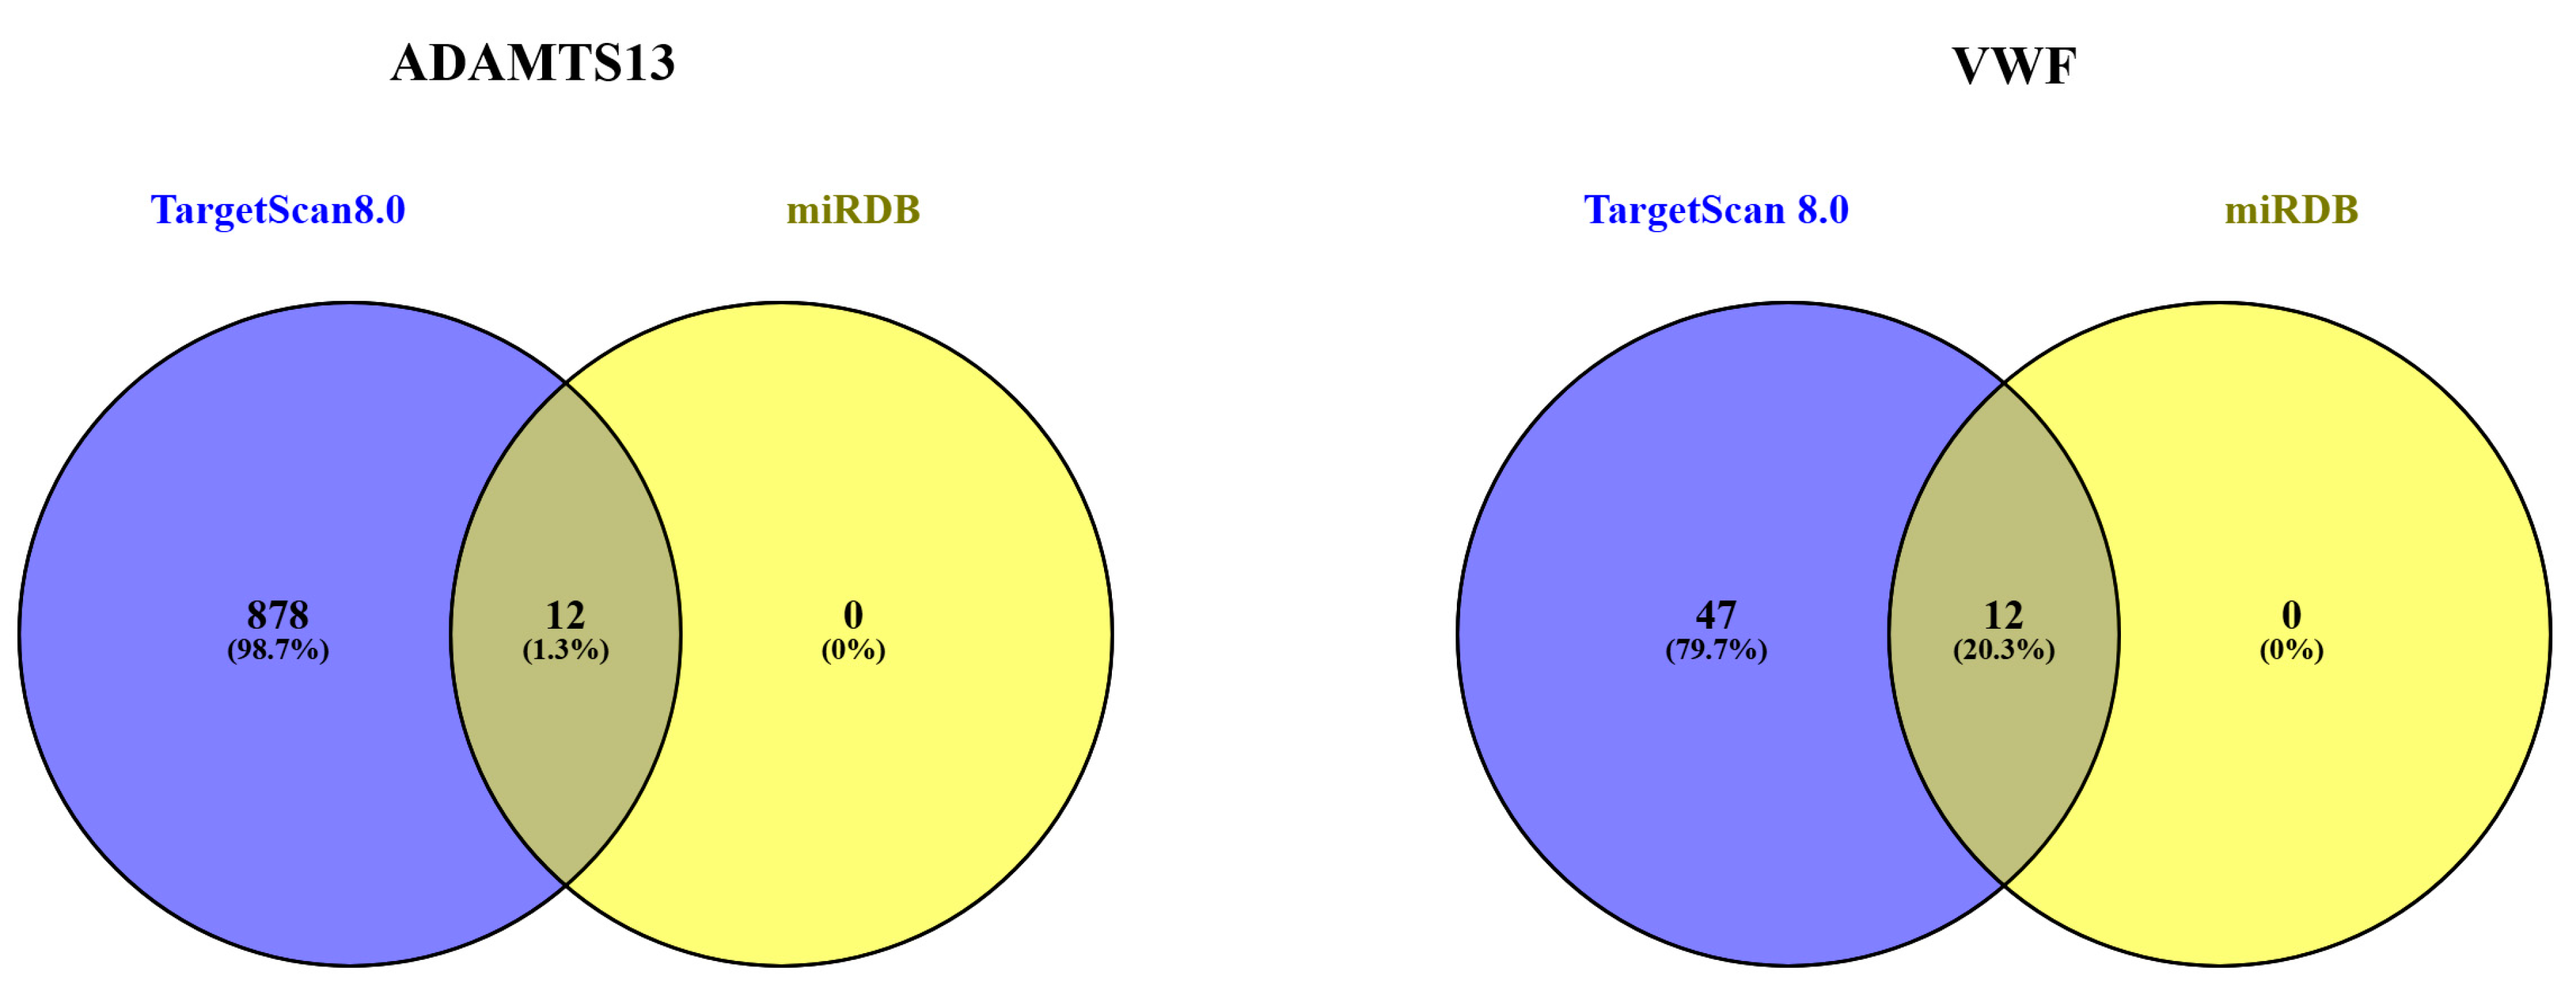
The miRNAs associated with ADAMTS13 and VWF are listed in Table 2. Accordingly, the miRNAs were grouped as a combination of TargetScan Human 8.0 and miRDB databases (Figure 12).
Table 2.
The miRNAs associated with ADAMTS13 and VWF with a combination of TargetScanHuman8.0 and miRDB databases.
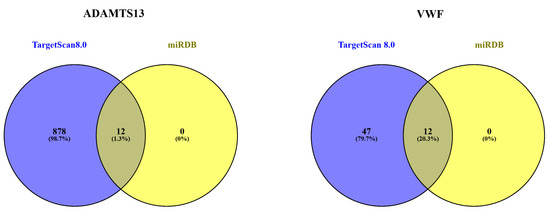
Figure 12.
Separate and overlapping numbers of miRNAs that are potential targets of ADAMTS13 and VWF according to miRDB and TargetScanHuman8.0.
3.8. Enrichment Analysis of ADAMTS13 and VWF
3.8.1. Association of ADAMTS13 with Physiopathological Processes
According to Gene Ontology, ADAMTS13 is involved in the catabolic process of organonitrogen compounds (GO:1901565), proteolysis (GO:0006508), protein maturation (GO:0051604), protein processing (GO:0016485), extracellular matrix organization (GO:0030198), glycoprotein metabolic process (GO:0009100), extracellular structure organization (GO:0043062), peptide metabolic process (GO:0006518), cell–matrix adhesion (GO:0007160), integrin-mediated signaling pathway (GO:0007229), external encapsulating structure organization (GO:0045229), and peptide catabolic process (GO:0043171).
Data from FANTOM6 shows that the knockdown of certain lncRNAs can regulate ADAMTS13 expression. The lncRNAs AC017048.3-ASO_G0163364_AD_01-DEGs, RP11-458D21.1-ASO_G0233396_07-DEGs, MEG3-ASO_G0214548_AD_09-DEGs, and ERVK3-1-ASO_G0142396_AD_07-DEGs upregulated ADAMTS13 expression, whereas the lncRNAs RAB30-AS1-ASO_G0246067_AD_06-DEGs, CD27-AS1-ASO_G0215039_01-DEGs, RP11-473M20.14-ASO_G0263072_06-DEGs, and RP11-395B7.4-ASO_G0227053_04-DEGs downregulated its expression.
Jensen Lab data links ADAMTS13 to several diseases, including thrombotic thrombocytopenic purpura, thrombocytopenia, Weill–Marchesani syndrome, hypertension, cerebrovascular disease, carcinoma, and diarrhea.
According to the Human Gene Atlas, ADAMTS13 is upregulated in CD71+ early erythroid and liver cells, as shown in Figure 13A and Table 3.
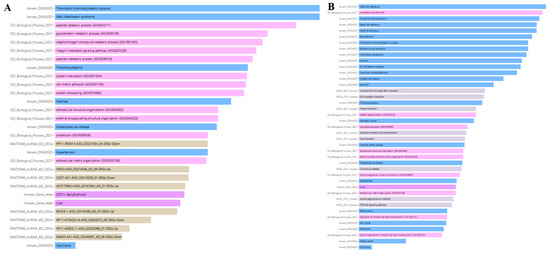
Figure 13.
Enrichment analysis results of ADAMTS13 (A) and VWF (B).
Table 3.
ADAMTS13 enrichment analysis result.
3.8.2. Association of VWF with Physiopathological Processes
Gene Ontology analysis indicates that VWF is involved in the following biological processes: regulated exocytosis (GO:0045055), positive regulation of signal transduction (GO:0009967), hemostasis (GO:0007599), extracellular structure organization (GO:0043062), regulation of intracellular signal transduction (GO:1902531), platelet degranulation (GO:0002576), positive regulation of intracellular signal transduction (GO:1902533), extracellular matrix organization (GO:0030198), and external encapsulating structure organization (GO:0045229).
According to KEGG pathway analysis, VWF is involved in the following pathways: neutrophil extracellular trap formation, ECM-receptor interaction, complement and coagulation cascades, human papillomavirus infection, focal adhesion, PI3K-Akt signaling pathway, coronavirus disease, and platelet activation.
Jensen Lab data associates VWF with several diseases, including pancreatic cancer, thrombotic thrombocytopenic purpura, hemophilia B, intermittent claudication, Von Willebrand’s disease, purpura, coronary artery disease, diabetic retinopathy, Factor VIII deficiency, thrombocytopenia, kidney cancer, breast cancer, Bernard–Soulier syndrome, vasculitis, Factor XIII deficiency, hypertension, Glanzmann’s thrombasthenia, cerebrovascular disease, carcinoma, melanoma, skin cancer, congenital afibrinogenemia, and Factor XI deficiency.
The Human Gene Atlas shows that VWF is upregulated in lung cells, as shown in Figure 13B and Table 4.
Table 4.
VWF enrichment analysis result.
3.8.3. LncRNAs Associated with HCC and Their Association with VWF and ADAMST13
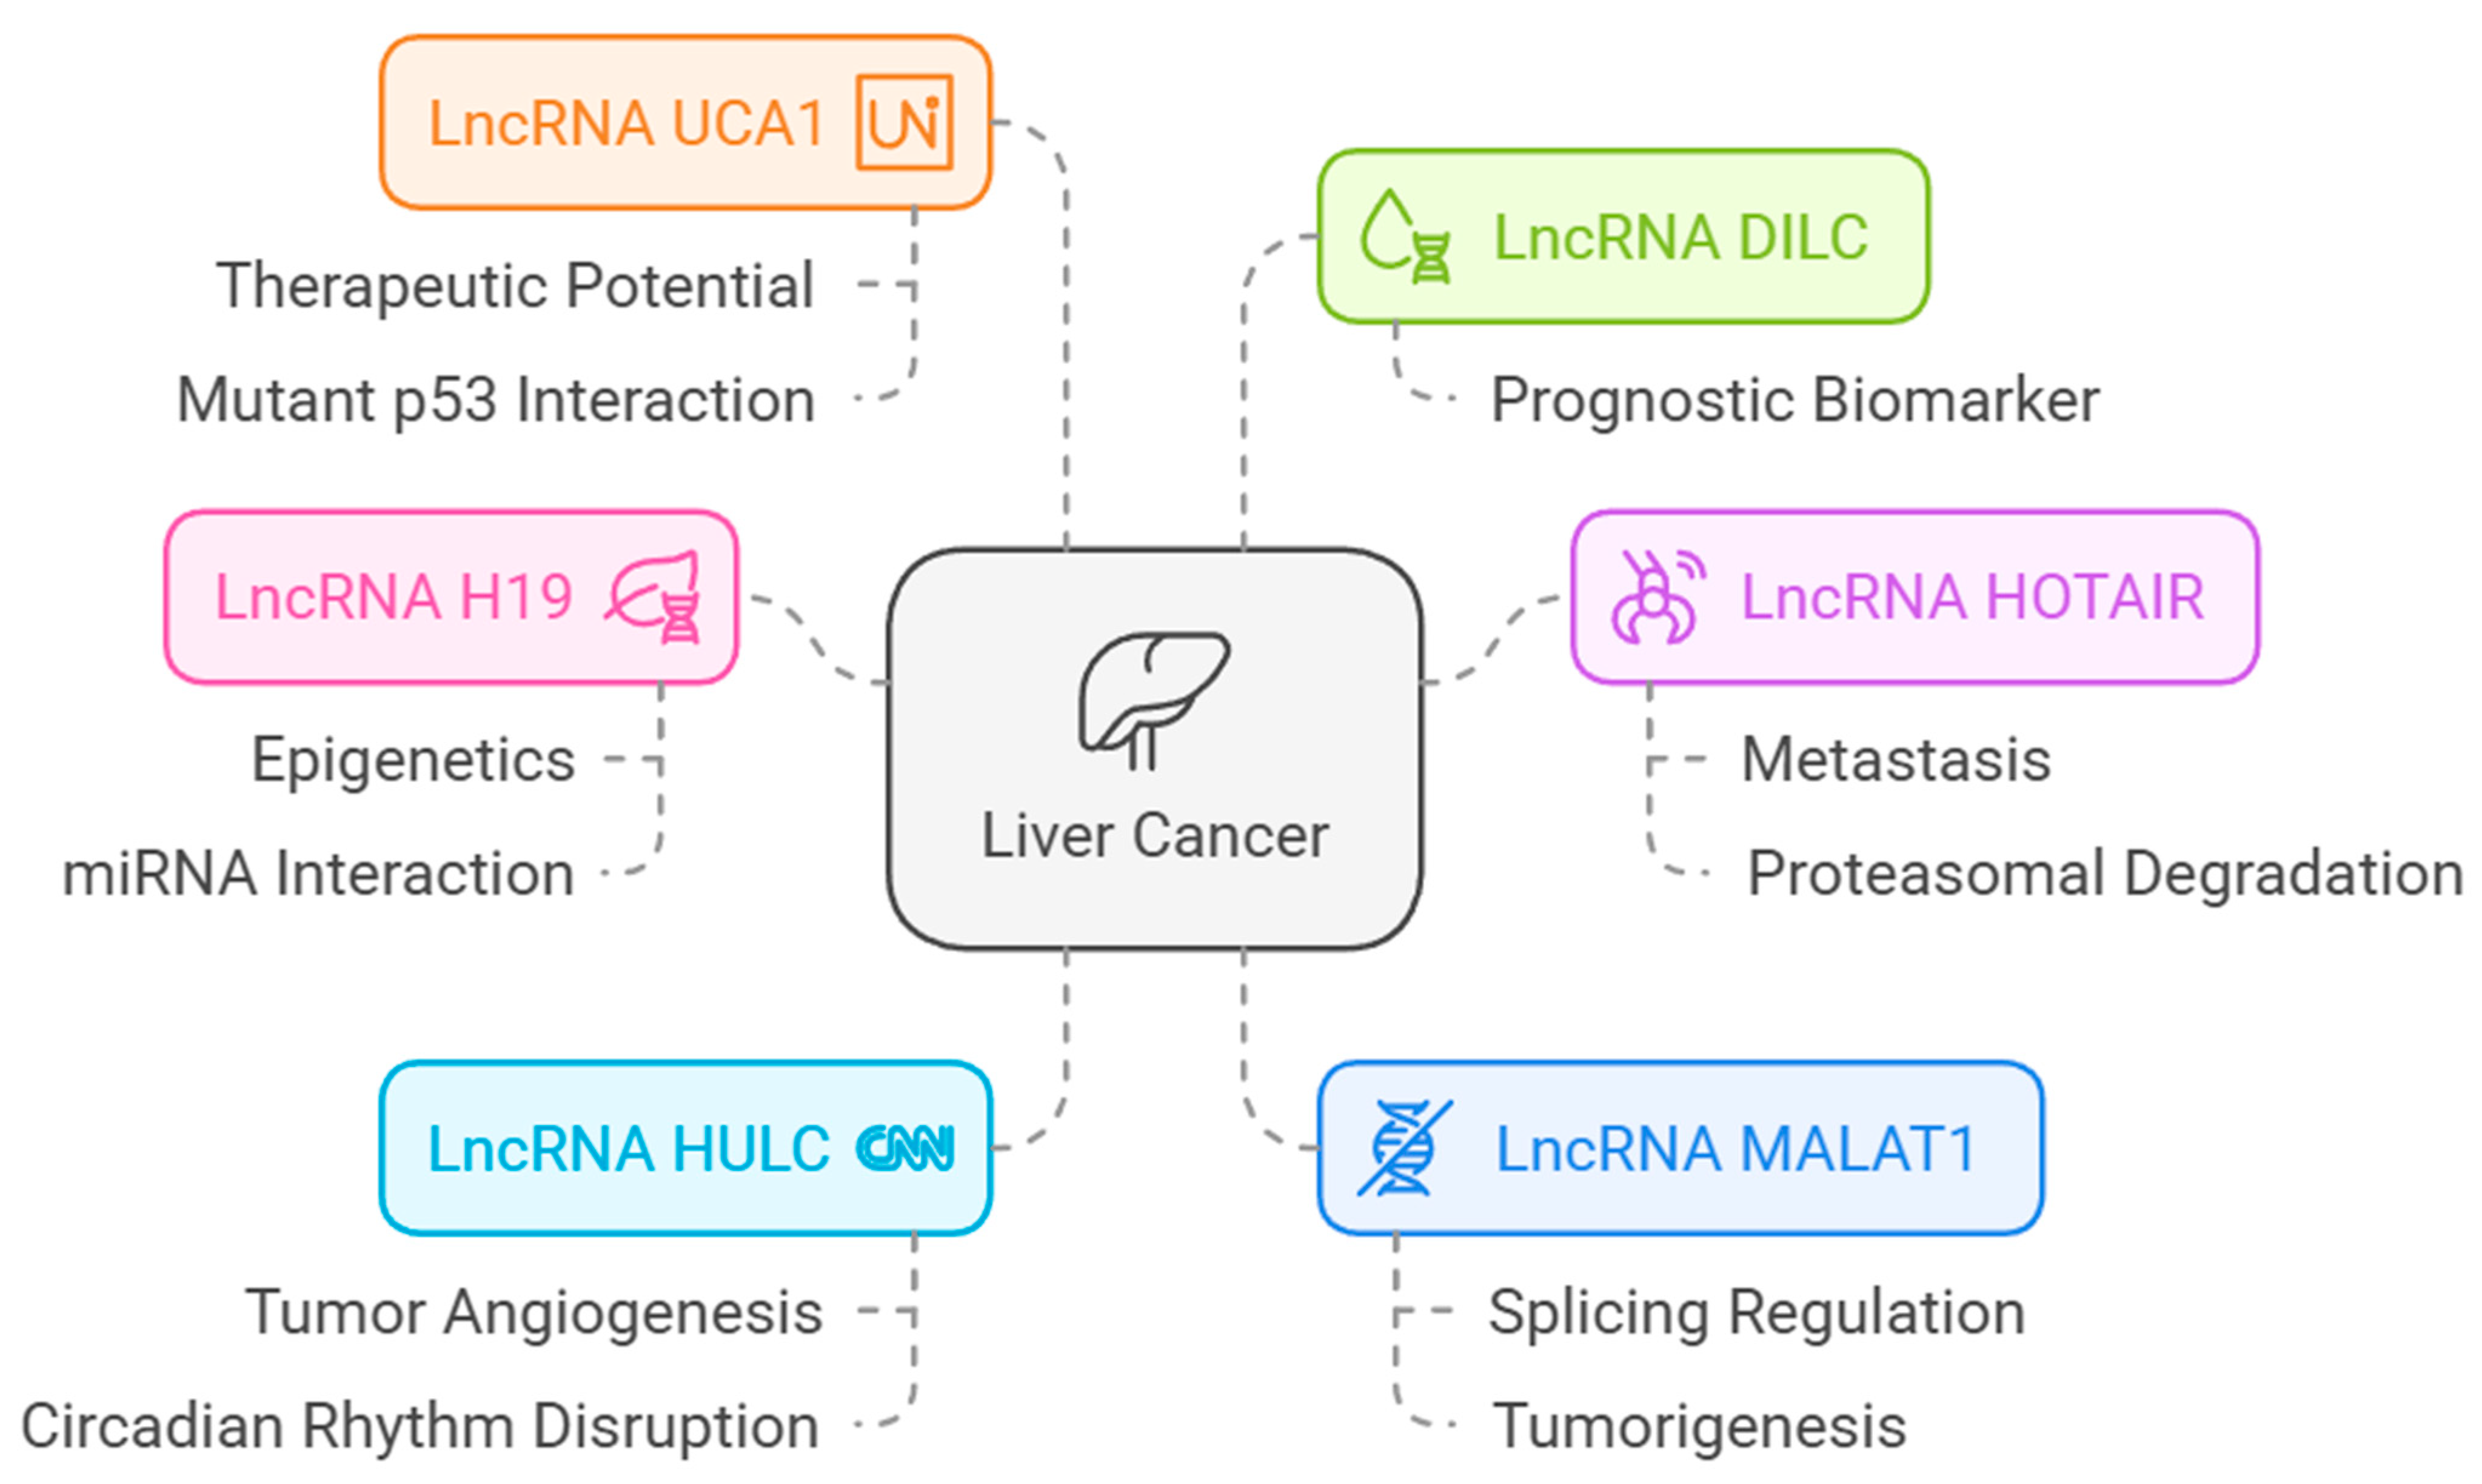
The lncRNAs associated with HCC are shown in Figure 14.
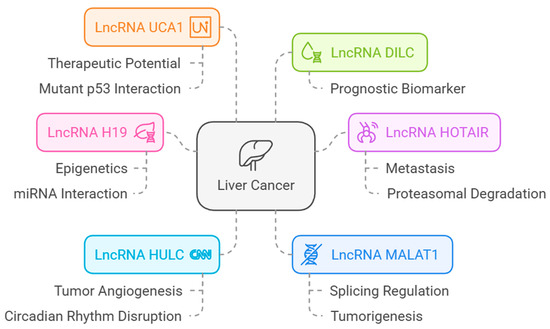
Figure 14.
LncRNAs associated with HCC [from LncRNADisease database (http://www.cuilab.cn/lncrnadisease accessed on 25 February 2025)].
3.8.4. Correlation of lncRNAs with ADAMTS13 and VWF
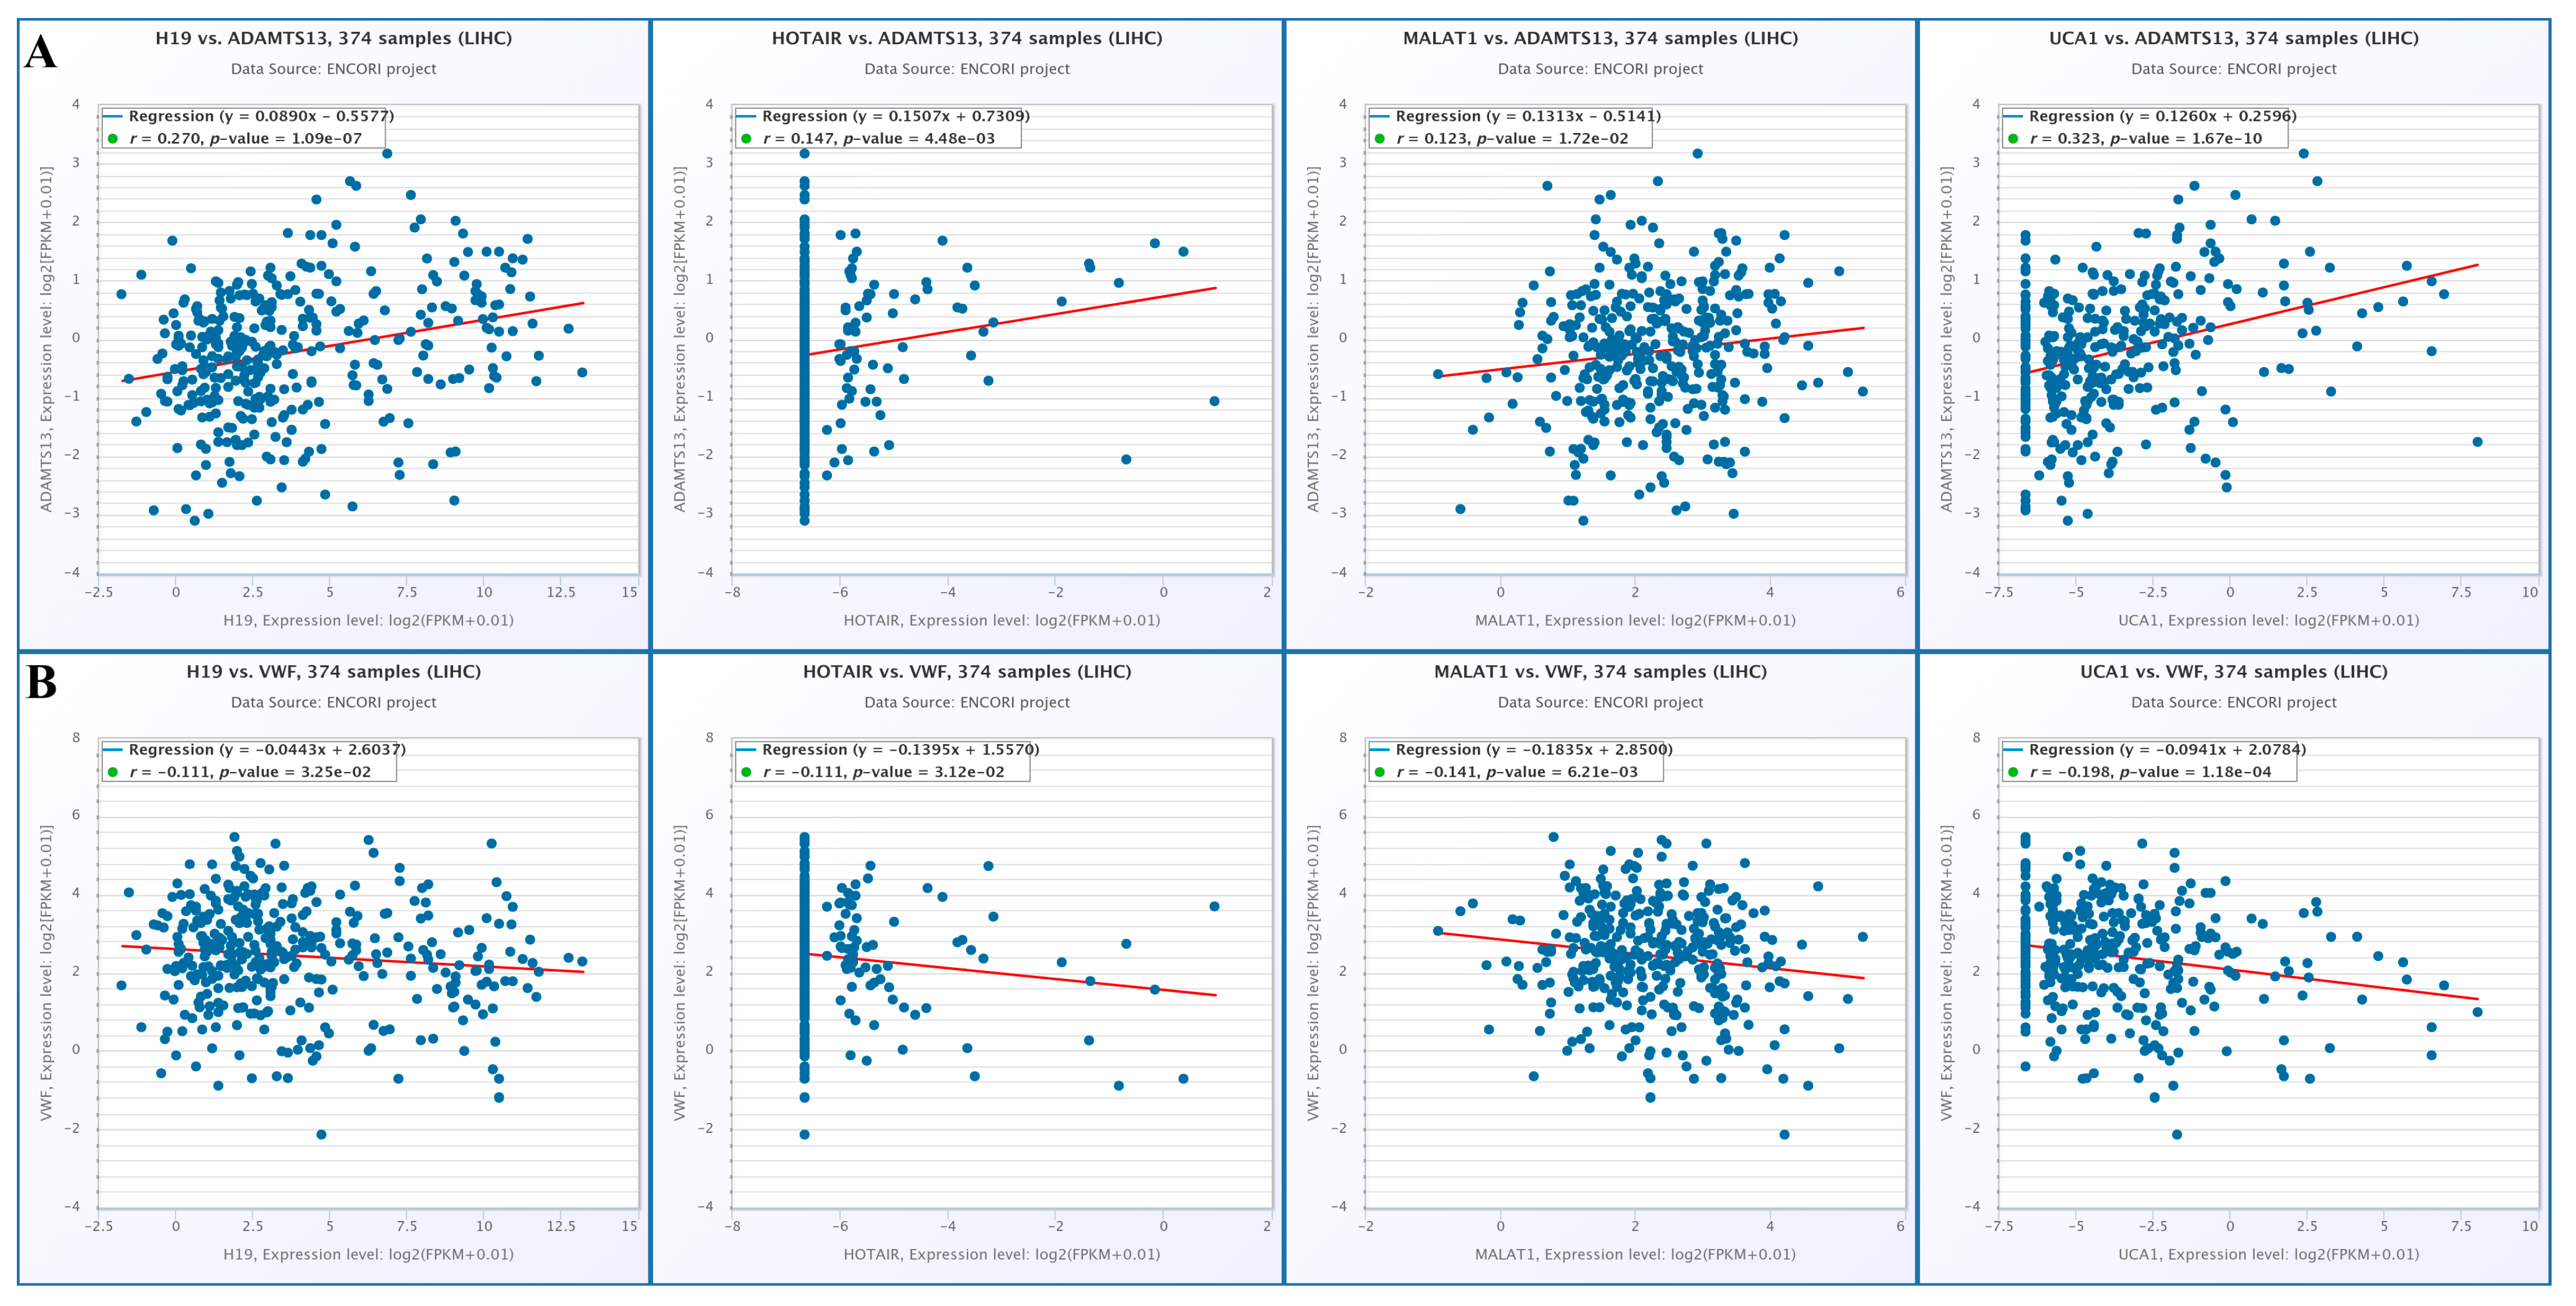
When the changes in lncRNA expression with VWF and ADAMTS13 expression were examined, there was a positive correlation among ADAMTS13 expression and H19, HOTAIR, MALAT1, and UCA1 expression (r = 0.270, p = 1.09 × 10⁻⁷, r = 0.147, p = 4.48 × 10⁻³, r = 0.123, p = 1.72 × 10⁻², r = 0.323, p = 1.67 × 10⁻¹⁰, respectively) (Figure 15A). In contrast, there was a negative correlation among VWF expression and H19, HOTAIR, MALAT1, and UCA1 expression (r = −0.111, p = 3.25 × 10⁻², r = −0.111, p = 3.12 × 10⁻², r = −0.141, p = 6.21 × 10⁻³, r = −0.198, p = 1.18 × 10⁻⁴, respectively) (Figure 15B).
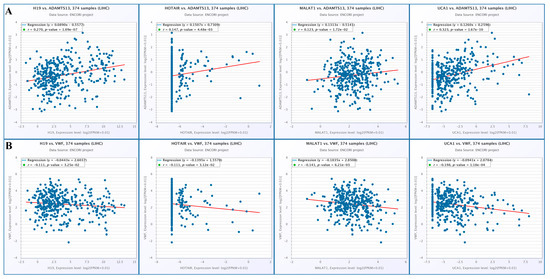
Figure 15.
(A) Changes in lncRNA and ADAMTS13 expression. (B) Changes in LncRNAs expressions and VWF expressions (from Encori database, no data were found in Encori database for HULC and DILC).
3.9. Analysis Results of DEGs
In the GSE14520 dataset, 12.298 genes were upregulated and 9.970 genes were downregulated (Figure 16A,B). The expression density and mean variance trend of the GSE14220 dataset are shown in Figure 16C,D.
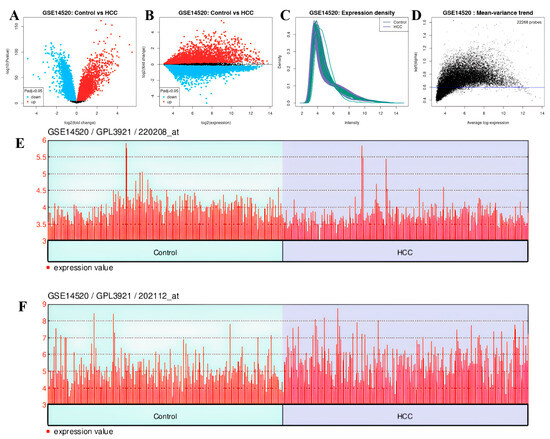
Figure 16.
In GSE14520 dataset: (A) volcano plot and (B) mean difference plot views of data distribution, (C) expression density, (D) mean variance trend, (E) expression value plot of VWF (control vs. HCC), (F) expression value plot of ADAMTS13 (control vs. HCC).
The downregulated genes were VWF (adjp = 3.87 × 10⁻⁷, logFC = −0.606) with gene ID: 202112 (Figure 16E) and ADAMTS13 (adjp = 1.01 × 10⁻⁶, log = 0.214) with gene ID: 220208 (Figure 16F). Genes showing separate and common upregulation in the datasets are listed in Supplementary Table S1.
4. Discussion
Our current study is the first to compare the role of VWF and ADAMTS13 in HCC using different bioinformatic databases and microarray data. To our knowledge, there is no such large-scale study in the literature. Based on the correlations we have made and the data we have gathered, we believe that our study will enable the further elucidation of such physiopathological associations and serve as an impetus for further research.
VWF is a large multimeric glycoprotein that is synthesized by endothelial cells and megakaryocytes. Its main function is to ensure the binding of platelets to areas of vascular damage in the first stage of homeostasis [50]. ADAMTS13 is a metalloproteinase that cleaves large multimers of VWF and thus regulates the hemostatic activity of VWF. Increased VWF levels and decreased ADAMTS13 activity have also been observed in HCC. This imbalance is associated with tumor angiogenesis and metastasis [20]. VWF may facilitate tumor cell adhesion to the endothelium and subsequent metastasis [20]. At the same time, low levels of ADAMTS13 may enhance the pro-tumor effects of VWF. Several studies have suggested that VWF and ADAMTS13 levels may have prognostic value in patients with HCC. For example, high VWF levels and low ADAMTS13 activity have been associated with poorer prognosis and shorter survival times in the advanced stages of the disease. These biomarkers could potentially be used to monitor patients with HCC and to determine treatment strategies [8,15]. While the effects of VWF and ADAMTS13 expression levels on prognosis in advanced-stage HCC are in this direction, VWF was upregulated, while ADAMTS13 levels were downregulated in our HCC cohort. However, when the markers were evaluated in terms of OS, it was observed that ADAMTS13 gene expression levels had no effect on OS, whereas increasing VWF expression levels were associated with longer OS. Elevated VWF expression, identified as a positive prognostic marker, could be developed into a routine biomarker to stratify patients with HCC based on their survival probabilities. This stratification can help identify patients who may benefit from more aggressive therapies or closer monitoring. The VWF and ADAMTS13 pathways can be explored as potential therapeutic targets. Modulating VWF expression may enhance tumor suppression, and addressing the imbalance between VWF and ADAMTS13 may reduce angiogenesis and metastasis. Contrary to previous studies, we can say that only high VWF expression levels were a positive prognostic factor for patients in our HCC cohort. This may be because the cohort we examined included patients from all stages, not only advanced patients.
Other mechanisms may explain the upregulation of VWF gene expression levels. The first is hypomethylation of the promoter region, which is an epigenetic mechanism. Hypomethylation was observed in the VWF promoter region of our HCC cohort. This hypomethylation may have resulted in the upregulation of the VWF gene. A recent study showed that the overexpression of VWF in breast cancer cells leads to an increase in VEGF-A-related angiogenesis [51]. Second, evidence suggests that in certain cancer patients, VWF is released not only from typical sources, such as endothelial cells and megakaryocytes, but also from tumor cells and the surrounding tumor microenvironment.
The contradiction between hypomethylation and the downregulation of ADAMTS13 gene levels in our HCC cohort can be explained by global DNA methylation. Global DNA hypomethylation in HCC may be associated with the formation of repressive chromatin domains and gene silencing. Global DNA hypomethylation, which is frequently observed in cancer, is believed to activate potential oncogenes and cause chromosomal changes, thereby playing a role in carcinogenesis. Chromosomal abnormalities suggest that global hypomethylation may significantly contribute to chromosomal instability [52]. In addition to this, miRNAs or RNA-binding proteins may inhibit the translation of ADAMTS13, even in the presence of hypomethylation. Hypomethylation alone does not ensure transcriptional activation, as specific transcription factors must be both present and active. Furthermore, histone modifications or chromatin remodeling may counteract the effects of DNA hypomethylation, thereby restricting gene expression. Additionally, cytokines, inflammatory signals, or hypoxia within the tumor microenvironment may regulate ADAMTS13 levels independently of methylation status. However, the relationship between these features during the development of HCC remains uncertain, owing to the HCC having multiple reasons and mechanisms. The downregulation of the ADAMTS13 gene versus promoter region hypermethylation may be only one of the epigenetic reasons or mechanisms contributing to the pathogenesis of HCC.
In addition, in the analysis of DEGs using microarray data, we obtained results that were exactly the opposite of those obtained in other bioinformatic databases. While VWF was downregulated in the DEGs analysis, ADAMTS13 levels were upregulated. These results may be due to working in different populations. Different results obtained from different databases (TCGA database and microarray data) regarding VWF and ADAMTS13 draw attention to the imbalance between VWF:Ag/ADAMTS13:AC in HCC. There may be many reasons for this imbalance (such as methylation profile change, effects of miRNAs and lncRNAs). Therefore, the mechanisms need to be evaluated carefully. This reason may be due to HAIC applied in the treatment of HCC. It was also shown that HAIC treatment reduces VEGF levels in patients with advanced HCC [8,53]. Moreover, the VWF:Ag/ADAMTS13:AC ratio was reported to be lower in HCC patients treated with HAIC. Therefore, the expression levels of low VWF and high ADAMTS13 in the GEO dataset may be linked to the response to HAIC via their effects on VEGF and angiogenesis.
The tumor microenvironment (TME) is integral to the development of hepatocellular carcinoma (HCC), influencing key processes such as cell proliferation, migration, invasion, epithelial–mesenchymal transition (EMT), immune evasion, angiogenesis, and treatment resistance [54]. Critical components of the HCC microenvironment, including blood vessels, hepatic non-parenchymal cells (e.g., Kupffer cells, hepatic stellate cells, and liver sinusoidal endothelial cells), and various lymphocyte populations, significantly affect tumor initiation and progression [55]. Among these, CD8+ T cells are pivotal for tumor control due to their capacity to recognize cancer-specific antigens and exert cytotoxic effects through the release of perforin and granzyme B [56]. Although the increased infiltration of CD8+ T cells is generally associated with improved survival in many cancers, its prognostic significance in HCC remains contentious [57,58]. In the present study, elevated VWF expression was correlated with longer overall survival (OS) in HCC patients and showed a significant positive association with CD8+ T cell levels. Conversely, VWF expression demonstrated a negative correlation with CD4+ T cells. CD4+ T lymphocytes play a dual role in cancer by activating cytotoxic CD8+ T cells through cytokine release, but under certain conditions, they may also impair CD8+ T cell functionality, contributing to disease progression in HBV-related HCC [58]. This imbalance between CD4+ and CD8+ T cells may accelerate tumor progression and serve as a valuable prognostic indicator [59,60]. Notably, patients with HBV-related HCC exhibit higher CD4+ T cell levels than those with chronic hepatitis or healthy individuals, although these levels decline in advanced stages, particularly within the tumor core and peritumoral regions, potentially due to selective recruitment aimed at immune evasion [61]. Reduced tumor-infiltrating CD4+ T lymphocytes (CD4+ TILs) are associated with poor prognosis in HCC [61]. Furthermore, findings in the HCC cohort demonstrated an inverse relationship between VWF and CD4+ T lymphocytes, while ADAMTS13 expression showed a positive correlation with CD4+ T cells. Given the observed downregulation of ADAMTS13 and the upregulation of VWF, the expected immune profile includes decreased CD4+ T cell levels and increased CD8+ T cell levels. This suggests that CD4+ TILs are not only reduced in number but also functionally impaired within the tumor microenvironment. Over time, this deterioration may lead to compromised activation of CD8+ TILs in advanced disease stages, potentially contributing to a poorer prognosis in HCC. The upregulation of VWF in HCC appears to serve as a negative prognostic indicator, as it is correlated with a reduction in CD4+ TILs and a potential impairment in the activation of CD8+ TILs. This phenomenon may facilitate immune evasion and contribute to poorer long-term outcomes in HCC.
Enrichment analysis of ADAMTS13 and VWF adds significant value to the discussion by providing deeper insights into their roles in HCC. It links these genes to critical cancer-related processes such as angiogenesis, extracellular matrix organization, and immune regulation, explaining how their dysregulation may influence tumor progression. Additionally, the identification of key pathways, including PI3K-Akt signaling and ECM-receptor interactions, which are critical for tumor growth, metastasis, and immune evasion, highlights mechanisms that could be targeted therapeutically [62]. Our enrichment analysis findings indicate that VWF and ADAMTS13 are integral to coagulation, extracellular matrix organization, and disease pathogenesis. The involvement of VWF in various cancers and cardiovascular diseases underscores its potential as a biomarker or therapeutic target. Similarly, the regulation of ADAMTS13 by lncRNAs presents new opportunities for exploring gene regulation mechanisms in coagulation disorders. Further research could investigate whether analogous regulatory mechanisms are applicable to other coagulation-related factors and metalloproteinases. This integration may ensure that the enrichment analysis aligns with the study objectives and may enhance the overall understanding of ADAMTS13 and VWF in HCC.
These lncRNAs play significant roles in cancer progression by promoting angiogenesis, epithelial–mesenchymal transition (EMT), and immune evasion [63]. In the cohort we examined, ADAMTS13 was downregulated, while VWF was upregulated. In addition, H19, HOTAIR, MALAT1, and UCA1 expression levels showed a negative correlation with ADAMTS13 expression levels, while they showed a positive correlation with VWF expression levels. According to these results, considering the relationship between both ADAMTS13 and VWF and lncRNAs, we expect H19, HOTAIR, MALAT1, and UCA1 to be downregulated. Downregulation of these lncRNAs (H19, HOTAIR, MALAT1, and UCA1) may lead to an imbalance between ADAMTS13 and VWF. Studies suggest that the imbalance between ADAMTS13 and VWF is associated with angiogenesis and hypercoagulability and that this is important for cancer prognosis [10,20]. It is reported in the literature that increased levels of H19, HOTAIR, MALAT1, and UCA1, which have oncogenic characteristics, are associated with HCC [64]. A study reported that MALAT1 can be downregulated through autophagy inhibition, which suppresses cell proliferation and tumor growth in HCC [65]. Another study reported that MALAT1 upregulation promoted HCC cell proliferation, while MALAT1 downregulation promoted HCC apoptosis and autophagy [66].
Investigations concerning UCA1 and HOTAIR, analogous to those on MALAT1, have primarily concentrated on the downregulation of these lncRNAs and the subsequent diminution in cancer progression [67,68]. Consequently, while investigations are ongoing regarding the potential of these three lncRNAs as therapeutic targets, the function of H19 in HCC remains complex and subject to debate. Some studies have suggested that H19 acts as an oncogene, promoting cell proliferation, migration, and invasion. Other studies have indicated that H19 may have tumor suppressor functions in HCC [69,70,71]. Cancer is a disease with a very complex nature, and angiogenesis has a very important role in cancer progression [72]. From this perspective, we may consider that H19, HOTAIR, MALAT1, and UCA1 may be downregulated to support angiogenesis by creating an imbalance between ADAMTS13 and VWF, but these need to be supported by further studies. These findings underscore the complexity of the regulatory networks involving lncRNAs, VWF, and ADAMTS13. Future studies should explore the functional roles of these lncRNAs in modulating the expression or activity of VWF and ADAMTS13. Experimental validation using knockdown or overexpression models of these lncRNAs could elucidate their direct impact on tumor behavior and clarify their contribution to HCC pathogenesis. This analysis may provide a foundation for the identification of novel therapeutic targets. Targeting specific lncRNAs, such as H19 or HOTAIR, may indirectly influence VWF and ADAMTS13 expression, thereby offering new strategies for intervention in HCC. Moreover, integrating these insights with the existing knowledge of the tumor microenvironment and epigenetic regulation could enhance our understanding of HCC progression and improve therapeutic outcomes.
VWF and ADAMTS13 levels may serve as prognostic and monitoring biomarkers in HCC across various therapeutic modalities. Surgical resection remains a primary curative approach, and these biomarkers could assist in predicting recurrence and vascular complications [73]. The outcomes of radiotherapy may be affected by VWF’s involvement in endothelial function and thrombosis [74]. Somatostatin analogs may influence angiogenesis through VWF modulation, presenting potential combination strategies [75]. Immunotherapy, particularly checkpoint inhibitors, may be informed by VWF and ADAMTS13 levels due to their association with immune cell dynamics [76]. Further research is warranted to incorporate these biomarkers into personalized treatment strategies.
This study may provide significant insights into the roles of VWF and ADAMTS13 in HCC; however, there are several limitations of this study that warrant consideration. The findings were derived from a limited cohort with restricted geographic and demographic diversity, potentially compromising generalizability. The heavy reliance on public bioinformatics databases, which may introduce inherent biases, and the absence of comprehensive clinical variables, such as comorbidities and treatment histories, constrain the depth of the analysis. Experimental validation was not conducted and other regulatory mechanisms, including post-translational modifications, were not explored. Moreover, the study’s cross-sectional design and limited focus on tumor microenvironment complexity and functional miRNA/lncRNA interactions restrict its scope.To enhance the robustness and clinical relevance of the findings, future research should address these limitations through experimental studies, particularly those utilizing real-time polymer chain reaction (PCR) methodologies, as well as through the inclusion of diverse cohorts and longitudinal analyses.
5. Conclusions
The discrepant results obtained from the TCGA and GEO databases regarding VWF and ADAMTS13 highlight the imbalance between VWF and ADAMTS13 in hepatocellular carcinoma (HCC). Multiple factors may contribute to this imbalance, including alterations in methylation profiles tumor microenvironment and the effects of miRNAs and lncRNAs. Consequently, a thorough evaluation of these mechanisms is necessary. Although these findings are promising, they underscore the complexity of the interaction between VWF and ADAMTS13 in HCC progression. Further research should aim to validate these results in diverse and larger cohorts, as well as investigate the therapeutic potential of targeting these pathways. This study provides a foundation for the development of novel biomarkers and treatment strategies to advance the understanding of this challenging malignancy.
Supplementary Materials
The following supporting information can be downloaded at: https://www.mdpi.com/article/10.3390/cimb47040270/s1.
Author Contributions
Conceptualization, D.A., Ş.B.B.P. and F.E.A.; Methodology, D.A. and E.Ö.; Software, D.A., E.B. and S.E.; Validation, D.A., E.B. and S.E.; Formal Analysis, D.A., F.E.A. and S.E.; Investigation, D.A., Ş.B.B.P. and E.Ö.; Resources, E.Ö.; Data curation, D.A., Ş.B.B.P., E.B. and F.E.A.; Writing—Original Draft, D.A.; Writing—Review and Editing, D.A. All authors have read and agreed to the published version of the manuscript.
Funding
This research received no external funding.
Institutional Review Board Statement
Not applicable.
Informed Consent Statement
Not applicable.
Data Availability Statement
The data used in this study were obtained from the public database TCGA and others.
Conflicts of Interest
The authors declare no conflict of interest.
References
- Ganesan, P.; Kulik, L.M. Hepatocellular Carcinoma: New Developments. Clin. Liver Dis. 2023, 27, 85–102. [Google Scholar] [CrossRef] [PubMed]
- Kim, D.Y. Changing etiology and epidemiology of hepatocellular carcinoma: Asia and worldwide. J. Liver Cancer 2024, 24, 62–70. [Google Scholar] [CrossRef]
- Pan, F.; Lin, X.R.; Hao, L.P.; Chu, X.Y.; Wan, H.J.; Wang, R. The Role of RNA Methyltransferase METTL3 in Hepatocellular Carcinoma: Results and Perspectives. Front. Cell Dev. Biol. 2021, 9, 674919. [Google Scholar] [CrossRef] [PubMed]
- Xu, R.H.; Wei, W.; Krawczyk, M.; Wang, W.; Luo, H.; Flagg, K.; Yi, S.; Shi, W.; Quan, Q.; Li, K.; et al. Circulating tumour DNA methylation markers for diagnosis and prognosis of hepatocellular carcinoma. Nat. Mater. 2017, 16, 1155–1161. [Google Scholar] [CrossRef] [PubMed]
- Villanueva, A.; Portela, A.; Sayols, S.; Battiston, C.; Hoshida, Y.; Méndez-González, J.; Imbeaud, S.; Letouzé, E.; Hernandez-Gea, V.; Cornella, H.; et al. DNA methylation-based prognosis and epidrivers in hepatocellular carcinoma. Hepatol. Baltim. Md. 2015, 61, 1945–1956. [Google Scholar] [CrossRef]
- Nagaraju, G.P.; Dariya, B.; Kasa, P.; Peela, S.; El-Rayes, B.F. Epigenetics in hepatocellular carcinoma. Semin. Cancer Biol. 2022, 86 Pt 3, 622–632. [Google Scholar] [CrossRef]
- Wahid, B.; Ali, A.; Rafique, S.; Idrees, M. New Insights into the Epigenetics of Hepatocellular Carcinoma. BioMed Res. Int. 2017, 2017, 1609575. [Google Scholar] [CrossRef]
- Takaya, H.; Namisaki, T.; Moriya, K.; Shimozato, N.; Kaji, K.; Ogawa, H.; Ishida, K.; Tsuji, Y.; Kaya, D.; Takagi, H.; et al. Association between ADAMTS13 activity–VWF antigen imbalance and the therapeutic effect of HAIC in patients with hepatocellular carcinoma. World J. Gastroenterol. 2020, 26, 7232–7241. [Google Scholar] [CrossRef]
- Takaya, H.; Namisaki, T.; Kitade, M.; Kaji, K.; Nakanishi, K.; Tsuji, Y.; Shimozato, N.; Moriya, K.; Seki, K.; Sawada, Y.; et al. VWF/ADAMTS13 ratio as a potential biomarker for early detection of hepatocellular carcinoma. BMC Gastroenterol. 2019, 19, 167. [Google Scholar] [CrossRef]
- Takaya, H.; Namisaki, T.; Shimozato, N.; Kaji, K.; Kitade, M.; Moriya, K.; Sato, S.; Kawaratani, H.; Akahane, T.; Matsumoto, M.; et al. ADAMTS13 and von Willebrand factor are useful biomarkers for sorafenib treatment efficiency in patients with hepatocellular carcinoma. World J. Gastrointest. Oncol. 2019, 11, 424–435. [Google Scholar] [CrossRef]
- Sonneveld, M.A.H.; de Maat, M.P.M.; Leebeek, F.W.G. Von Willebrand factor and ADAMTS13 in arterial thrombosis: A systematic review and meta-analysis. Blood Rev. 2014, 28, 167–178. [Google Scholar] [PubMed]
- Colonne, C.K.; Favaloro, E.J.; Pasalic, L. The Intriguing Connections between von Willebrand Factor, ADAMTS13 and Cancer. Healthcare 2022, 10, 557. [Google Scholar] [CrossRef] [PubMed]
- Randi, A.M. Angiogenesis and the ADAMTS13-VWF balance. Blood 2017, 130, 1–2. [Google Scholar] [PubMed]
- Théret, N.; Bouezzeddine, F.; Azar, F.; Diab-Assaf, M.; Legagneux, V. ADAM and ADAMTS Proteins, New Players in the Regulation of Hepatocellular Carcinoma Microenvironment. Cancers 2021, 13, 1563. [Google Scholar] [CrossRef]
- Obermeier, H.L.; Riedl, J.; Ay, C.; Koder, S.; Quehenberger, P.; Bartsch, R.; Kaider, A.; Zielinski, C.C.; Pabinger, I. The role of ADAMTS-13 and von Willebrand factor in cancer patients: Results from the Vienna Cancer and Thrombosis Study. Res. Pract. Thromb. Haemost. 2019, 3, 503–514. [Google Scholar]
- Uemura, M.; Fujimura, Y.; Ko, S.; Matsumoto, M.; Nakajima, Y.; Fukui, H. Determination of ADAMTS13 and Its Clinical Significance for ADAMTS13 Supplementation Therapy to Improve the Survival of Patients with Decompensated Liver Cirrhosis. Int. J. Hepatol. 2011, 2011, 759047. [Google Scholar]
- Niu, Z.S.; Niu, X.J.; Wang, W.H. Long non-coding RNAs in hepatocellular carcinoma: Potential roles and clinical implications. World J. Gastroenterol. 2017, 23, 5860–5874. [Google Scholar] [CrossRef]
- Morishita, A.; Oura, K.; Tadokoro, T.; Fujita, K.; Tani, J.; Masaki, T. MicroRNAs in the Pathogenesis of Hepatocellular Carcinoma: A Review. Cancers 2021, 13, 514. [Google Scholar] [CrossRef]
- Koustas, E.; Trifylli, E.M.; Sarantis, P.; Papadopoulos, N.; Papanikolopoulos, K.; Aloizos, G.; Damaskos, C.; Garmpis, N.; Garmpi, A.; Matthaios, D.; et al. An Insight into the Arising Role of MicroRNAs in Hepatocellular Carcinoma: Future Diagnostic and Therapeutic Approaches. Int. J. Mol. Sci. 2023, 24, 7168. [Google Scholar] [CrossRef]
- Tang, Z.; Kang, B.; Li, C.; Chen, T.; Zhang, Z. GEPIA2: An enhanced web server for large-scale expression profiling and interactive analysis. Nucleic Acids Res. 2019, 47, W556–W560. [Google Scholar] [CrossRef]
- Qiu, L.; Huang, Y.; Li, Z.; Dong, X.; Chen, G.; Xu, H.; Zeng, Y.; Cai, Z.; Liu, X.; Liu, J. Circular RNA profiling identifies circADAMTS13 as a miR-484 sponge which suppresses cell proliferation in hepatocellular carcinoma. Mol. Oncol. 2019, 13, 441–455. [Google Scholar] [CrossRef] [PubMed]
- Han, S.; Zhang, X.L.; Jiang, X.; Li, X.; Ding, J.; Zuo, L.J.; Duan, S.S.; Chen, R.; Sun, B.B.; Hu, X.Y.; et al. Long Non-Coding RNA and mRNA Expression Analysis in Liver of Mice With Clonorchis sinensis Infection. Front. Cell. Infect. Microbiol. 2022, 11, 754224. [Google Scholar] [CrossRef] [PubMed]
- Luo, Y.; Fu, Y.; Tan, T.; Hu, J.; Li, F.; Liao, Z.; Peng, J. Screening of lncRNA-miRNA-mRNA Coexpression Regulatory Networks Involved in Acute Traumatic Coagulation Dysfunction Based on CTD, GeneCards, and PharmGKB Databases. Oxid. Med. Cell Longev. 2022, 2022, 7280312. [Google Scholar] [CrossRef]
- Uhlen, M.; Zhang, C.; Lee, S.; Sjöstedt, E.; Fagerberg, L.; Bidkhori, G.; Benfeitas, R.; Arif, M.; Liu, Z.; Edfors, F.; et al. A pathology atlas of the human cancer transcriptome. Science 2017, 357, eaan2507. [Google Scholar] [CrossRef] [PubMed]
- Chandrashekar, D.S.; Bashel, B.; Balasubramanya, S.A.H.; Creighton, C.J.; Ponce-Rodriguez, I.; Chakravarthi, B.V.S.K.; Varambally, S. UALCAN: A Portal for Facilitating Tumor Subgroup Gene Expression and Survival Analyses. Neoplasia 2017, 19, 649–658. [Google Scholar] [CrossRef]
- Li, T.; Fu, J.; Zeng, Z.; Cohen, D.; Li, J.; Chen, Q.; Li, B.; Liu, X.S. TIMER2.0 for analysis of tumor-infiltrating immune cells. Nucleic Acids Res. 2020, 48, W509–W514. [Google Scholar] [CrossRef]
- Nagy, Á.; Lánczky, A.; Menyhárt, O.; Győrffy, B. Validation of miRNA prognostic power in hepatocellular carcinoma using expression data of independent datasets. Sci. Rep. 2018, 8, 9227. [Google Scholar]
- Bartha, Á.; Győrffy, B. TNMplot.com: A Web Tool for the Comparison of Gene Expression in Normal, Tumor and Metastatic Tissues. Int. J. Mol. Sci. 2021, 22, 2622. [Google Scholar] [CrossRef]
- Szklarczyk, D.; Kirsch, R.; Koutrouli, M.; Nastou, K.; Mehryary, F.; Hachilif, R.; Gable, A.L.; Fang, T.; Doncheva, N.T.; Pyysalo, S.; et al. The STRING database in 2023: Protein-protein association networks and functional enrichment analyses for any sequenced genome of interest. Nucleic Acids Res. 2023, 51, D638–D646. [Google Scholar] [CrossRef]
- Chen, Y.; Wang, X. miRDB: An online database for prediction of functional microRNA targets. Nucleic Acids Res. 2020, 48, D127–D131. [Google Scholar] [CrossRef] [PubMed]
- McGeary, S.E.; Lin, K.S.; Shi, C.Y.; Pham, T.M.; Bisaria, N.; Kelley, G.M.; Bartel, D.P. The biochemical basis of microRNA targeting efficacy. Science 2019, 366, eaav1741. [Google Scholar] [CrossRef]
- Agarwal, V.; Bell, G.W.; Nam, J.W.; Bartel, D.P. Predicting effective microRNA target sites in mammalian mRNAs. eLife 2015, 4, e05005. [Google Scholar] [CrossRef] [PubMed]
- Evangelista, J.E.; Xie, Z.; Marino, G.B.; Nguyen, N.; Clarke, D.J.B.; Ma’ayan, A. Enrichr-KG: Bridging enrichment analysis across multiple libraries. Nucleic Acids Res. 2023, 51, W168–W179. [Google Scholar] [CrossRef]
- Chen, G.; Wang, Z.; Wang, D.; Qiu, C.; Liu, M.; Chen, X.; Zhang, Q.; Yan, G.; Cui, Q. LncRNADisease: A database for long-non-coding RNA-associated diseases. Nucleic Acids Res. 2013, 41, D983–D986. [Google Scholar] [CrossRef] [PubMed]
- Li, J.H.; Liu, S.; Zhou, H.; Qu, L.H.; Yang, J.H. starBase v2.0: Decoding miRNA-ceRNA, miRNA-ncRNA and protein–RNA interaction networks from large-scale CLIP-Seq data. Nucleic Acids Res. 2014, 42, D92–D97. [Google Scholar] [CrossRef]
- Roessler, S.; Jia, H.L.; Budhu, A.; Forgues, M.; Ye, Q.-H.; Lee, J.-S.; Thorgeirsson, S.S.; Sun, Z.; Tang, Z.-Y.; Qin, L.-X.; et al. A unique metastasis gene signature enables prediction of tumor relapse in early-stage hepatocellular carcinoma patients. Cancer Res. 2010, 70, 10202–10212. [Google Scholar] [CrossRef]
- Roessler, S.; Long, E.L.; Budhu, A.; Chen, Y.; Zhao, X.; Ji, J.; Walker, R.; Jia, H.; Ye, Q.; Qin, L.; et al. Integrative genomic identification of genes on 8p associated with hepatocellular carcinoma progression and patient survival. Gastroenterology 2012, 142, 957–966.e12. [Google Scholar] [CrossRef]
- Zhao, X.; Parpart, S.; Takai, A.; Roessler, S.; Budhu, A.; Yu, Z.; Blank, M.; Zhang, Y.E.; Jia, H.-L.; Ye, Q.-H.; et al. Integrative genomics identifies YY1AP1 as an oncogenic driver in EpCAM(+) AFP(+) hepatocellular carcinoma. Oncogene 2015, 34, 5095–5104. [Google Scholar] [CrossRef]
- Wang, Y.; Gao, B.; Tan, P.Y.; Handoko, Y.A.; Sekar, K.; Deivasigamani, A.; Seshachalam, V.P.; Ouyang, H.; Shi, M.; Xie, C.; et al. Genome-wide CRISPR knockout screens identify NCAPG as an essential oncogene for hepatocellular carcinoma tumor growth. FASEB J. 2019, 33, 8759–8770. [Google Scholar] [CrossRef]
- Sun, Y.; Ji, F.; Kumar, M.R.; Zheng, X.; Xiao, Y.; Liu, N.; Shi, J.; Wong, L.; Forgues, M.; Qin, L.-X.; et al. Transcriptome integration analysis in hepatocellular carcinoma reveals discordant intronic miRNA-host gene pairs in expression. Int. J. Biol. Sci. 2017, 13, 1438–1449. [Google Scholar] [PubMed]
- Lu, Y.; Xu, W.; Ji, J.; Feng, D.; Sourbier, C.; Yang, Y.; Qu, J.; Zeng, Z.; Wang, C.; Chang, X.; et al. Alternative splicing of the cell fate determinant Numb in hepatocellular carcinoma. Hepatology 2015, 62, 1122–1131. [Google Scholar]
- Chen, S.; Fang, H.; Li, J.; Shi, J.; Zhang, J.; Wen, P.; Wang, Z.; Yang, H.; Cao, S.; Zhang, H.; et al. Microarray Analysis For Expression Profiles of lncRNAs and circRNAs in Rat Liver after Brain-Dead Donor Liver Transplantation. BioMed Res. Int. 2019, 2019, 5604843. [Google Scholar] [CrossRef]
- Chen, S.L.; Zhu, Z.X.; Yang, X.; Liu, L.L.; He, Y.-F.; Yang, M.-M.; Guan, X.-Y.; Wang, X.; Yun, J.-P. Cleavage and Polyadenylation Specific Factor 1 Promotes Tumor Progression via Alternative Polyadenylation and Splicing in Hepatocellular Carcinoma. Front. Cell Dev. Biol. 2021, 9, 616835. [Google Scholar]
- Wang, C.; Liao, Y.; He, W.; Zhang, H.; Zuo, D.; Liu, W.; Yang, Z.; Qiu, J.; Yuan, Y.; Li, K.; et al. Elafin promotes tumour metastasis and attenuates the anti-metastatic effects of erlotinib via binding to EGFR in hepatocellular carcinoma. J. Exp. Clin. Cancer Res. 2021, 40, 113. [Google Scholar] [CrossRef] [PubMed]
- Li, Z.; Kwon, S.M.; Li, D.; Li, L.; Peng, X.; Zhang, J.; Sueyoshi, T.; Raufman, J.-P.; Negishi, M.; Wang, X.W.; et al. Human constitutive androstane receptor represses liver cancer development and hepatoma cell proliferation by inhibiting erythropoietin signaling. J. Biol. Chem. 2022, 298, 101885. [Google Scholar]
- Zhao, N.; Dang, H.; Ma, L.; Martin, S.P.; Forgues, M.; Ylaya, K.; Hewitt, S.M.; Wang, X.W. Intratumoral γδ T-Cell Infiltrates, Chemokine (C-C Motif) Ligand 4/Chemokine (C-C Motif) Ligand 5 Protein Expression and Survival in Patients With Hepatocellular Carcinoma. Hepatology 2021, 73, 1045–1060. [Google Scholar] [CrossRef]
- Wu, B.; Liu, D.A.; Guan, L.; Myint, P.K.; Chin, L.; Dang, H.; Xu, Y.; Ren, J.; Li, T.; Yu, Z.; et al. Stiff matrix induces exosome secretion to promote tumour growth. Nat. Cell Biol. 2023, 25, 415–424. [Google Scholar]
- Long, Y.; Wang, W.; Liu, S.; Wang, X.; Tao, Y. The survival prediction analysis and preliminary study of the biological function of YEATS2 in hepatocellular carcinoma. Cell. Oncol. 2024, 47, 2297–2316. [Google Scholar]
- Davis, S.; Meltzer, P.S. GEOquery: A bridge between the Gene Expression Omnibus (GEO) and BioConductor. Bioinformatics 2007, 23, 1846–1847. [Google Scholar]
- Avtaeva, Y.N.; Melnikov, I.S.; Vasiliev, S.A.; Gabbasov, Z.A. The role of von Willebrand factor in hemostasis pathology. Атерoтрoмбoз 2023, 12, 79–102. [Google Scholar] [CrossRef]
- Tao, Q.; Qi, Y.; Gu, J.; Yu, D.; Lu, Y.; Liu, J.; Liang, X. Breast cancer cells-derived Von Willebrand Factor promotes VEGF-A-related angiogenesis through PI3K/Akt-miR-205-5p signaling pathway. Toxicol. Appl. Pharmacol. 2022, 440, 115927. [Google Scholar] [CrossRef]
- Nishida, N.; Kudo, M.; Nishimura, T.; Arizumi, T.; Takita, M.; Kitai, S.; Yada, N.; Hagiwara, S.; Inoue, T.; Minami, Y.; et al. Unique association between global DNA hypomethylation and chromosomal alterations in human hepatocellular carcinoma. PLoS ONE 2013, 8, e72312. [Google Scholar] [CrossRef]
- Matsui, D.; Nagai, H.; Mukozu, T.; Ogino, Y.U.; Sumino, Y. VEGF in patients with advanced hepatocellular carcinoma receiving intra-arterial chemotherapy. Anticancer. Res. 2015, 35, 2205–2210. [Google Scholar]
- Li, Z.; Zhang, Z.; Fang, L.; Zhao, J.; Niu, Z.; Chen, H.; Cao, G. Tumor Microenvironment Composition and Related Therapy in Hepatocellular Carcinoma. J. Hepatocell. Carcinoma 2023, 10, 2083–2099. [Google Scholar] [CrossRef]
- Bian, J.; Lin, J.; Long, J.; Yang, X.; Yang, X.; Lu, X.; Sang, X.; Zhao, H. T lymphocytes in hepatocellular carcinoma immune microenvironment: Insights into human immunology and immunotherapy. Am. J. Cancer Res. 2020, 10, 4585–4606. [Google Scholar] [PubMed]
- Fridman, W.H.; Pagès, F.; Sautès-Fridman, C.; Galon, J. The immune contexture in human tumours: Impact on clinical outcome. Nat. Rev. Cancer 2012, 12, 298–306. [Google Scholar] [CrossRef]
- Zheng, X.; Jin, W.; Wang, S.; Ding, H. Progression on the Roles and Mechanisms of Tumor-Infiltrating T Lymphocytes in Patients With Hepatocellular Carcinoma. Front. Immunol. 2021, 12, 729705. [Google Scholar] [CrossRef]
- Fu, J.; Xu, D.; Liu, Z.; Shi, M.; Zhao, P.; Fu, B.; Zhang, Z.; Yang, H.; Zhang, H.; Zhou, C.; et al. Increased regulatory T cells correlate with CD8 T-cell impairment and poor survival in hepatocellular carcinoma patients. Gastroenterology 2007, 132, 2328–2339. [Google Scholar] [CrossRef]
- Fisicaro, P.; Barili, V.; Rossi, M.; Montali, I.; Vecchi, A.; Acerbi, G.; Laccabue, D.; Zecca, A.; Penna, A.; Missale, G.; et al. Pathogenetic Mechanisms of T Cell Dysfunction in Chronic HBV Infection and Related Therapeutic Approaches. Front. Immunol. 2020, 11, 849. [Google Scholar] [CrossRef] [PubMed]
- Ramzan, M.; Sturm, N.; Decaens, T.; Bioulac-Sage, P.; Bancel, B.; Merle, P.; Tran Van Nhieu, J.; Slama, R.; Letoublon, C.; Zarski, J.P.; et al. Liver-infiltrating CD8(+) lymphocytes as prognostic factor for tumour recurrence in hepatitis C virus-related hepatocellular carcinoma. Liver Int. Off. J. Int. Assoc. Study Liver 2016, 36, 434–444. [Google Scholar]
- Fu, J.; Zhang, Z.; Zhou, L.; Qi, Z.; Xing, S.; Lv, J.; Shi, J.; Fu, B.; Liu, Z.; Zhang, J.-Y.; et al. Impairment of CD4+ cytotoxic T cells predicts poor survival and high recurrence rates in patients with hepatocellular carcinoma. Hepatol. Baltim. Md. 2013, 58, 139–149. [Google Scholar]
- Pal, I.; Mandal, M. PI3K and Akt as molecular targets for cancer therapy: Current clinical outcomes. Acta Pharmacol. Sin. 2012, 33, 1441–1458. [Google Scholar] [CrossRef]
- Mallela, V.R.; Rajtmajerová, M.; Trailin, A.; Liška, V.; Hemminki, K.; Ambrozkiewicz, F. miRNA and lncRNA as potential tissue biomarkers in hepatocellular carcinoma. Non-Coding RNA Res. 2024, 9, 24–32. [Google Scholar] [CrossRef] [PubMed]
- Abbastabar, M.; Sarfi, M.; Golestani, A.; Khalili, E. lncRNA involvement in hepatocellular carcinoma metastasis and prognosis. EXCLI J. 2018, 17, 900–913. [Google Scholar]
- Hou, Z.; Xu, X.; Zhou, L.; Fu, X.; Tao, S.; Zhou, J.; Tan, D.; Liu, S. The long non-coding RNA MALAT1 promotes the migration and invasion of hepatocellular carcinoma by sponging miR-204 and releasing SIRT1. Tumour Biol. 2017, 39, 1010428317718135. [Google Scholar]
- Peng, N.; He, J.; Li, J.; Huang, H.; Huang, W.; Liao, Y.; Zhu, S. Long noncoding RNA MALAT1 inhibits the apoptosis and autophagy of hepatocellular carcinoma cell by targeting the microRNA-146a/PI3K/Akt/mTOR axis. Cancer Cell Int. 2020, 20, 165. [Google Scholar]
- Cantile, M.; Belli, V.; Scognamiglio, G.; Martorana, A.; De Pietro, G.; Tracey, M.; Budillon, A. The role of HOTAIR in the modulation of resistance to anticancer therapy. Front. Mol. Biosci. 2024, 11, 1414651. [Google Scholar]
- Wang, F.; Ying, H.Q.; He, B.S.; Pan, Y.Q.; Deng, Q.W.; Sun, H.L.; Chen, J.; Liu, X.; Wang, S.K. Upregulated lncRNA-UCA1 contributes to progression of hepatocellular carcinoma through inhibition of miR-216b and activation of FGFR1/ERK signaling pathway. Oncotarget 2015, 6, 7899–7917. [Google Scholar] [CrossRef] [PubMed]
- Tietze, L.; Kessler, S.M. The Good, the Bad, the Question-H19 in Hepatocellular Carcinoma. Cancers 2020, 12, 126. [Google Scholar] [CrossRef]
- Wu, B.; Zhang, Y.; Yu, Y.; Zhong, C.; Lang, Q.; Liang, Z.; Lv, C.; Xu, F.; Tian, Y. Long Noncoding RNA H19: A Novel Therapeutic Target Emerging in Oncology Via Regulating Oncogenic Signaling Pathways. Front. Cell Dev. Biol. 2021, 9, 796740. [Google Scholar] [CrossRef] [PubMed]
- Xu, Y.; Liu, Y.; Li, Z.; Li, H.; Li, X.; Yan, L.; Mao, J.; Shen, J.; Chen, W.; Xue, F. Long non-coding RNA H19 is involved in sorafenib resistance in hepatocellular carcinoma by upregulating miR-675. Oncol. Rep. 2020, 44, 165–173. [Google Scholar] [CrossRef]
- Lugano, R.; Ramachandran, M.; Dimberg, A. Tumor angiogenesis: Causes, consequences, challenges and opportunities. Cell. Mol. Life Sci. 2020, 77, 1745–1770. [Google Scholar] [CrossRef] [PubMed]
- Belghiti, J.; Kianmanesh, R. Surgical treatment of hepatocellular carcinoma. HPB 2005, 7, 42–49. [Google Scholar] [CrossRef] [PubMed]
- Kim, D.; Kim, J.S. Current perspectives on radiotherapy in hepatocellular carcinoma management: A comprehensive review. J. Liver Cancer 2024, 24, 33–46. [Google Scholar] [CrossRef]
- Periferakis, A.; Tsigas, G.; Periferakis, A.T.; Badarau, I.A.; Scheau, A.E.; Tampa, M.; Georgescu, S.R.; Didilescu, A.C.; Scheau, C.; Caruntu, C. Antitumoral and Anti-inflammatory Roles of Somatostatin and Its Analogs in Hepatocellular Carcinoma. Anal. Cell Pathol. 2021, 2021, 1840069. [Google Scholar] [CrossRef]
- Mandlik, D.S.; Mandlik, S.K.; Choudhary, H.B. Immunotherapy for hepatocellular carcinoma: Current status and future perspectives. World J. Gastroenterol. 2023, 29, 1054–1075. [Google Scholar] [CrossRef]


Disclaimer/Publisher’s Note: The statements, opinions and data contained in all publications are solely those of the individual author(s) and contributor(s) and not of MDPI and/or the editor(s). MDPI and/or the editor(s) disclaim responsibility for any injury to people or property resulting from any ideas, methods, instructions or products referred to in the content. |
© 2025 by the authors. Licensee MDPI, Basel, Switzerland. This article is an open access article distributed under the terms and conditions of the Creative Commons Attribution (CC BY) license (https://creativecommons.org/licenses/by/4.0/).