
Personalized Ventilation as a Possible Strategy for Reducing Airborne Infectious Disease Transmission on Commercial Aircraft

 , ,
, ,  and
and
Abstract
:Featured Application
Abstract
1. Introduction
2. Materials and Methods
2.1. Experimental Setup
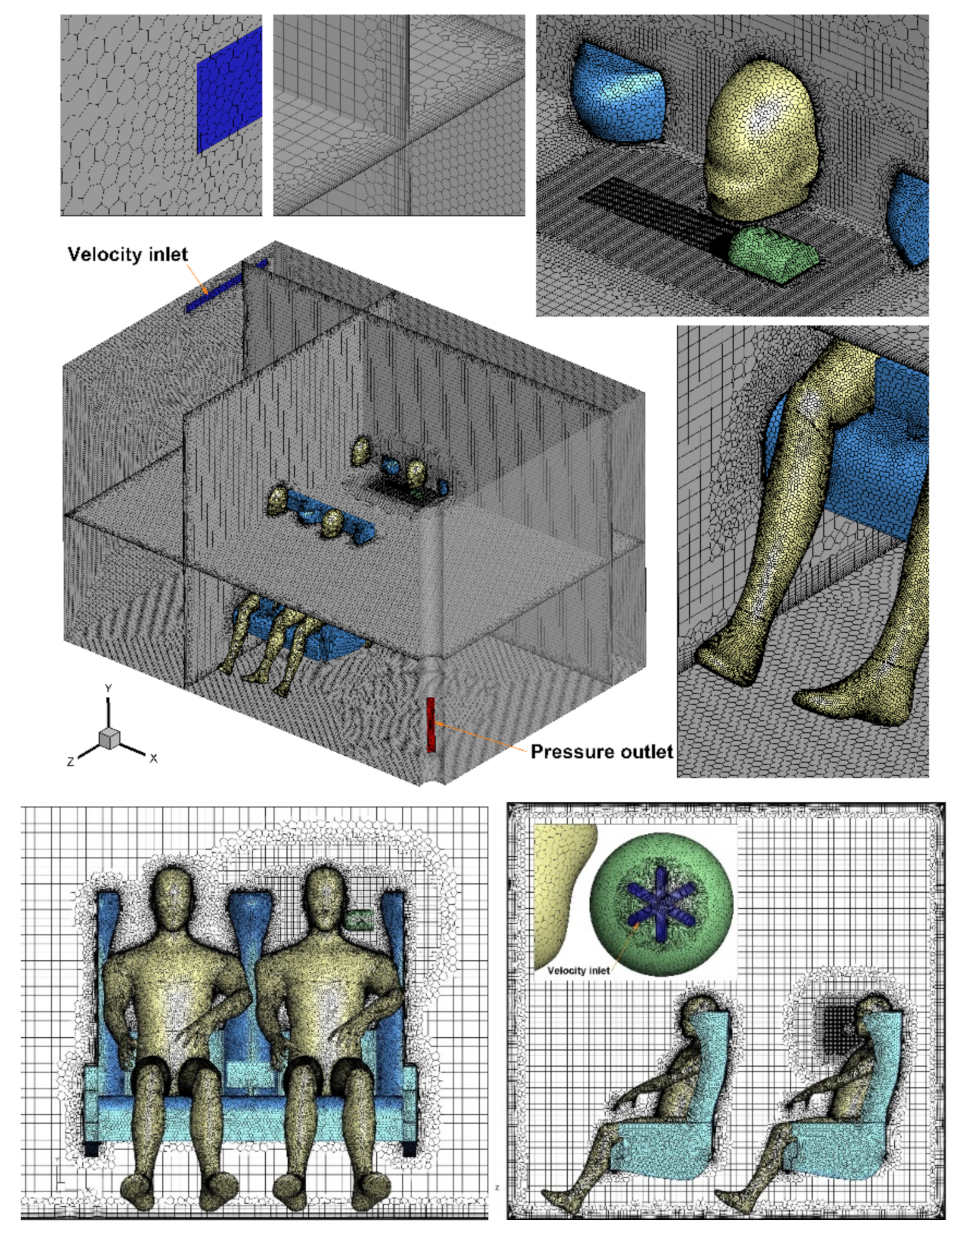
2.2. Numerical Simulation
3. Results and Discussion
3.1. Validation of Thermal Plumes
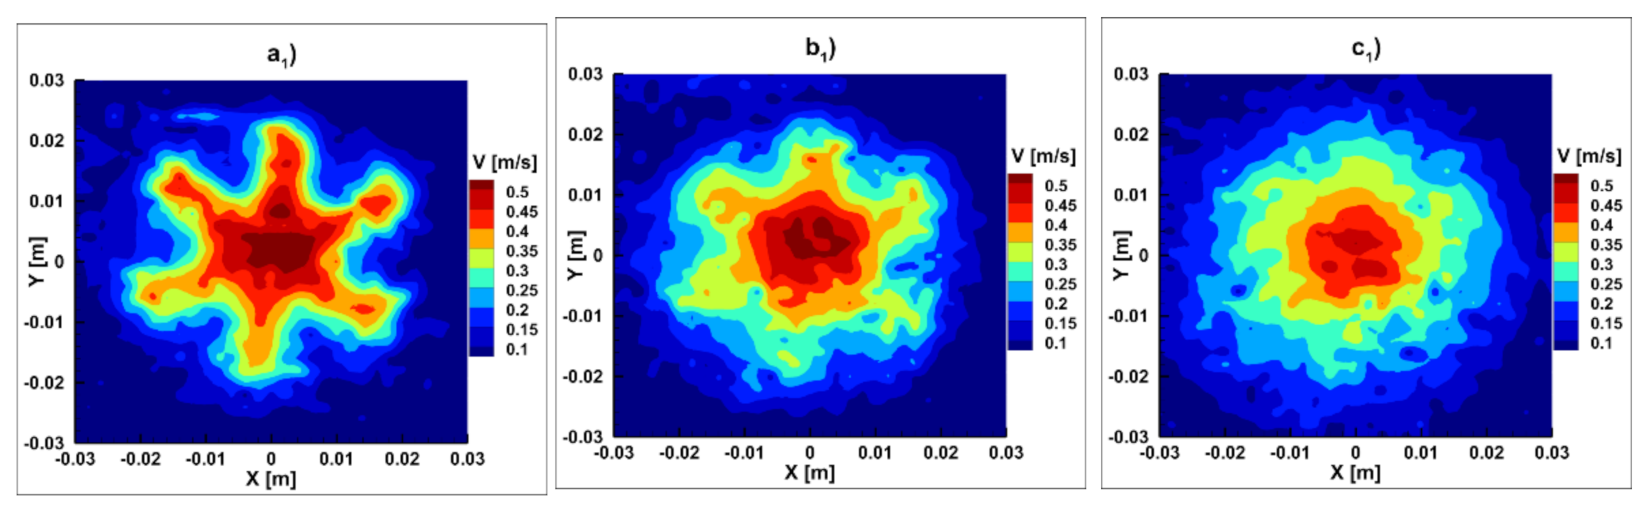
3.1.1. Particle Image Velocimetry
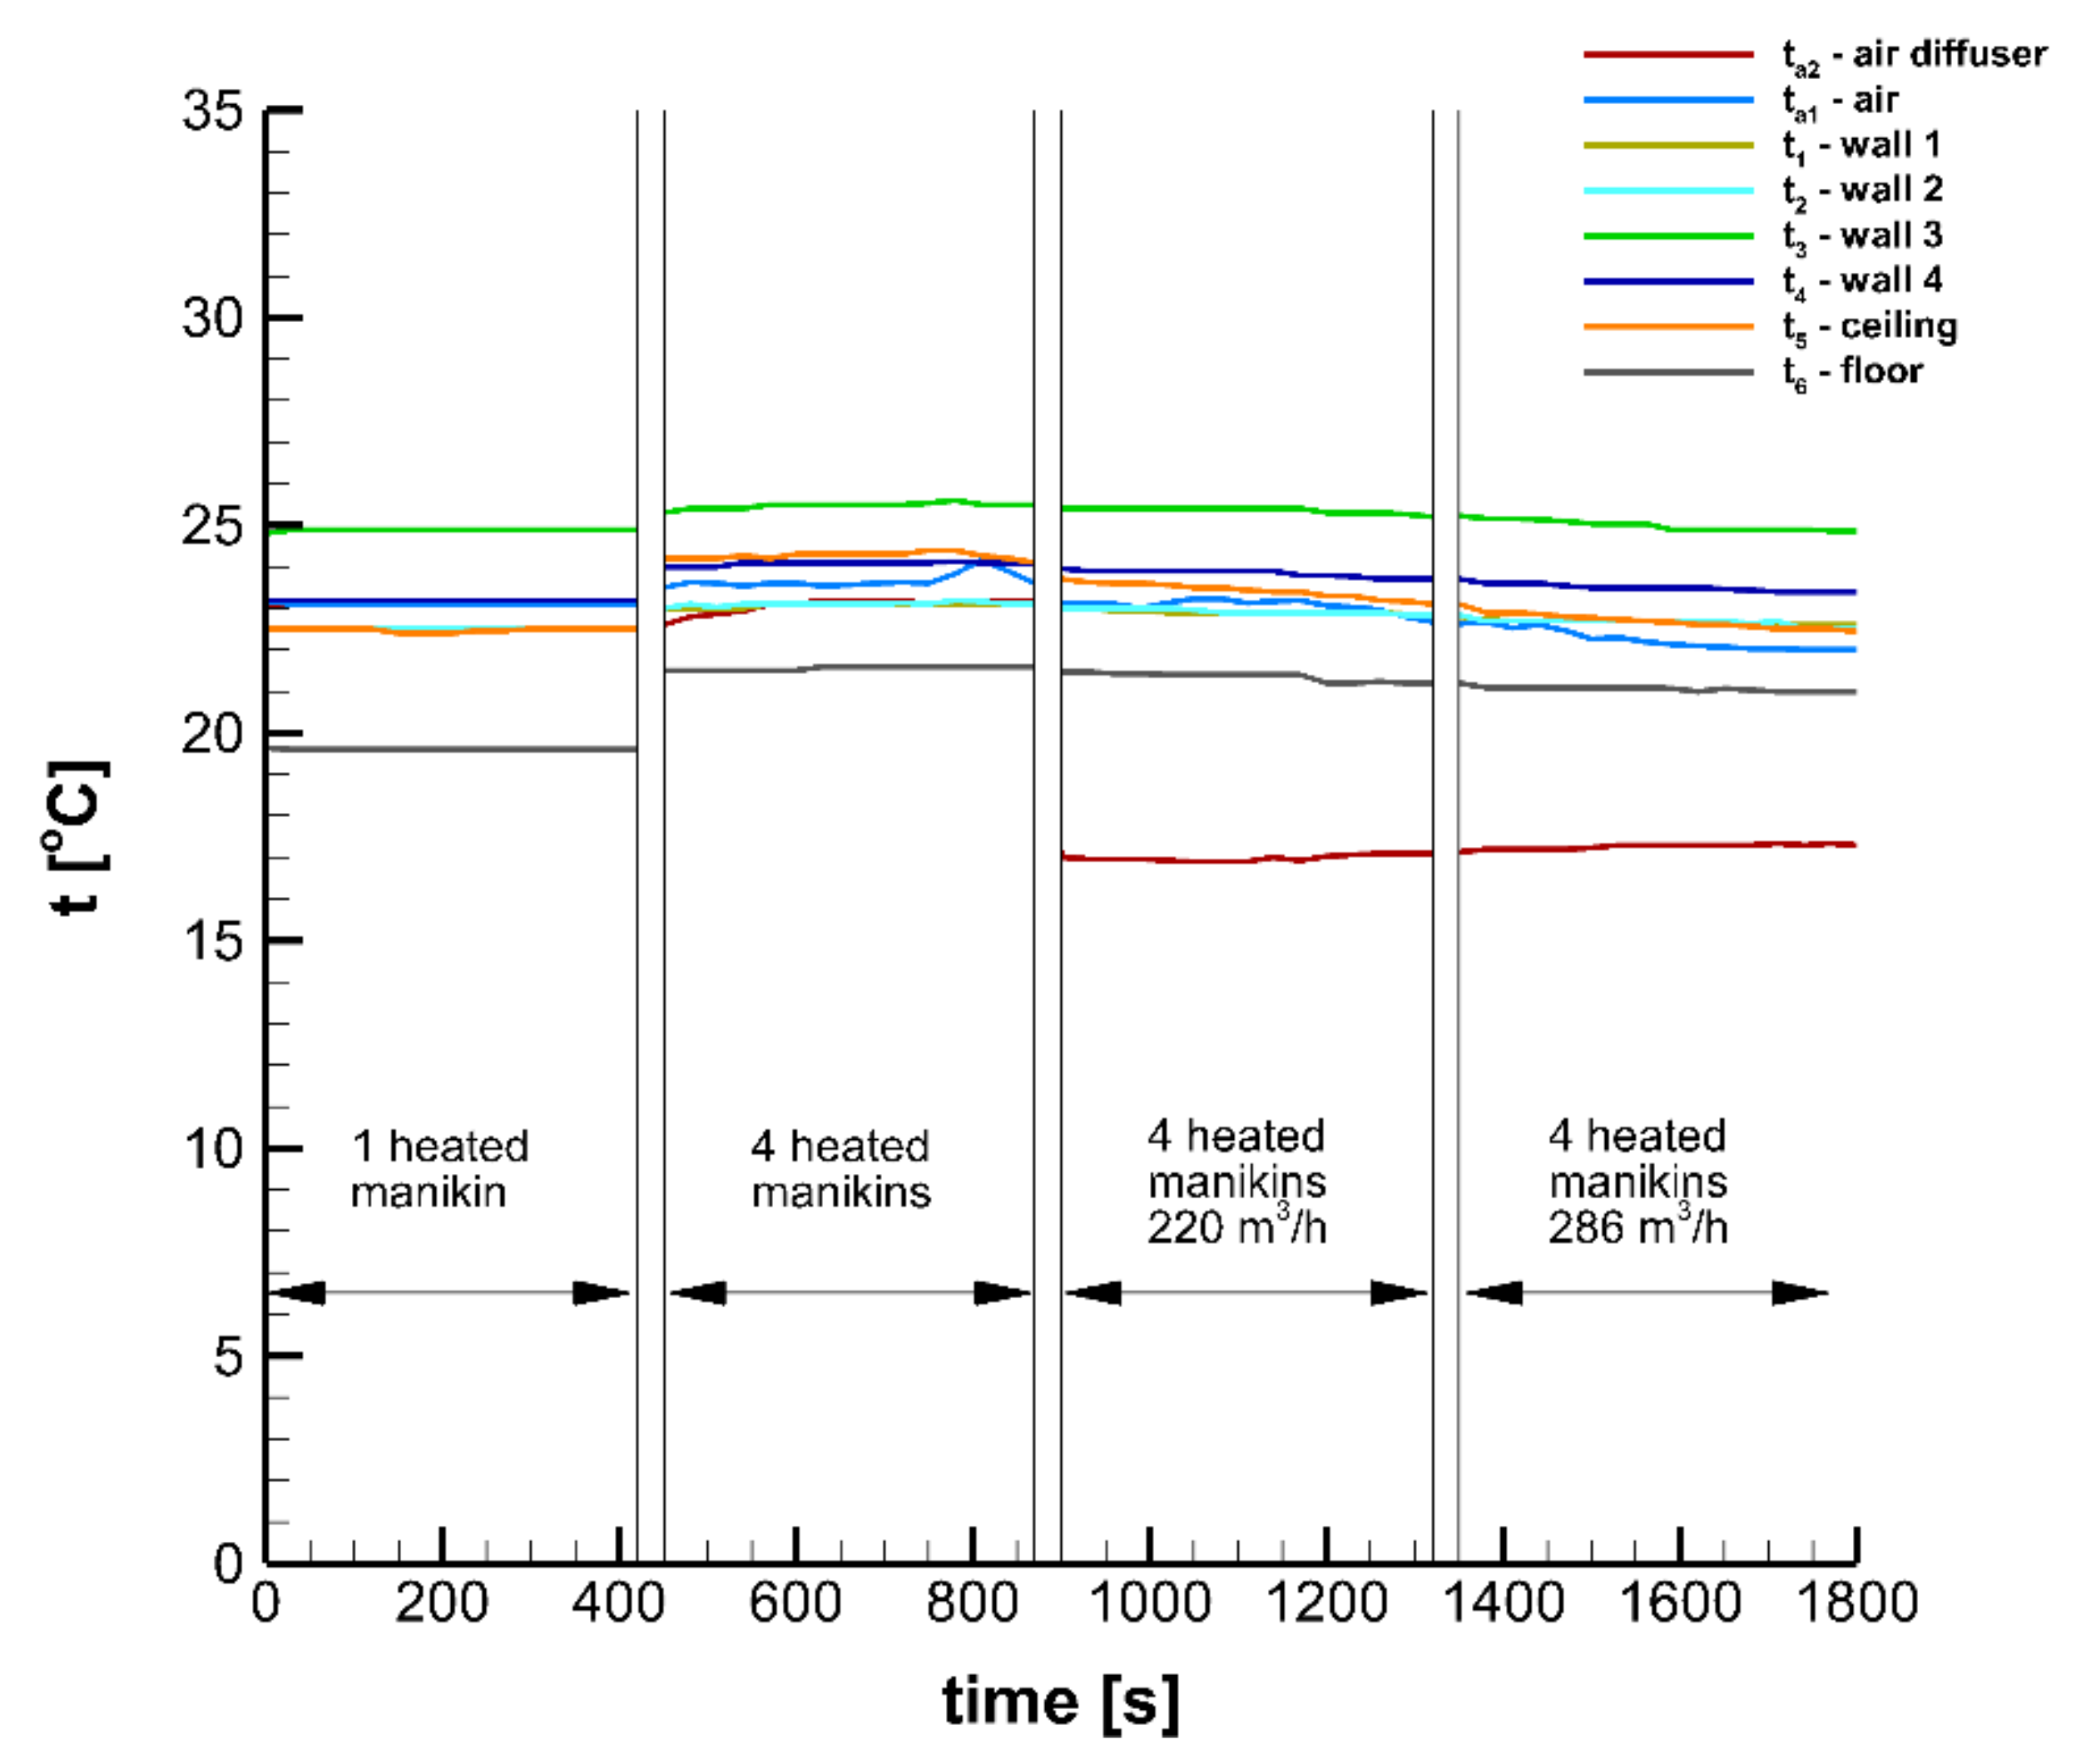
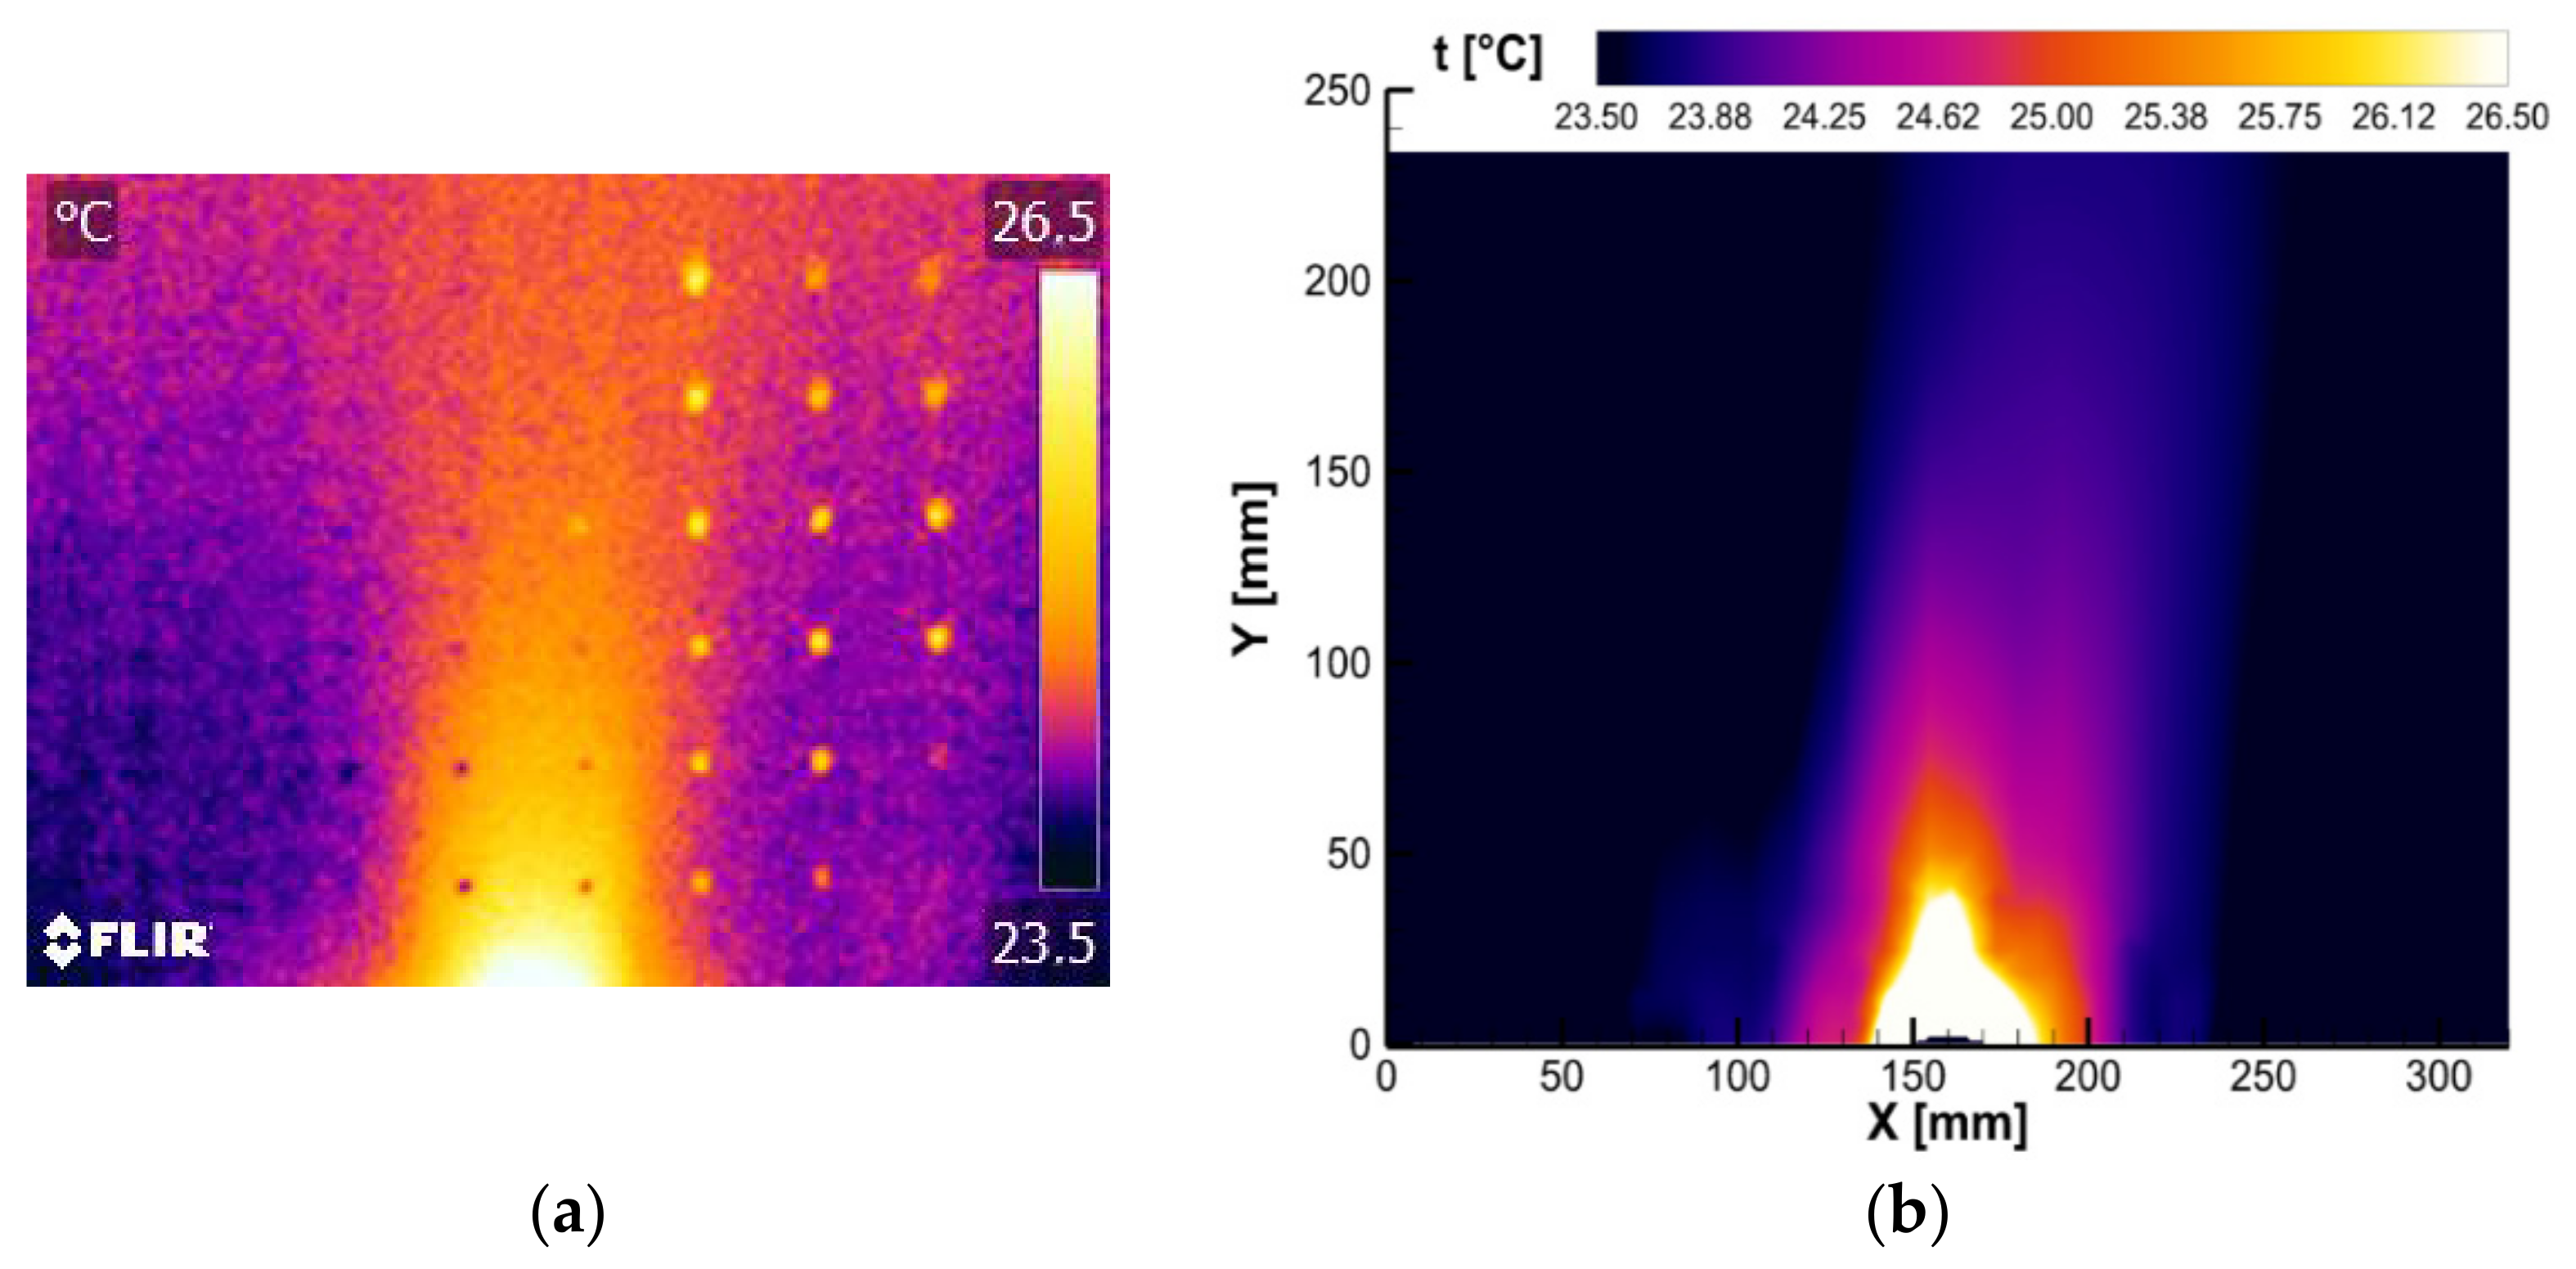
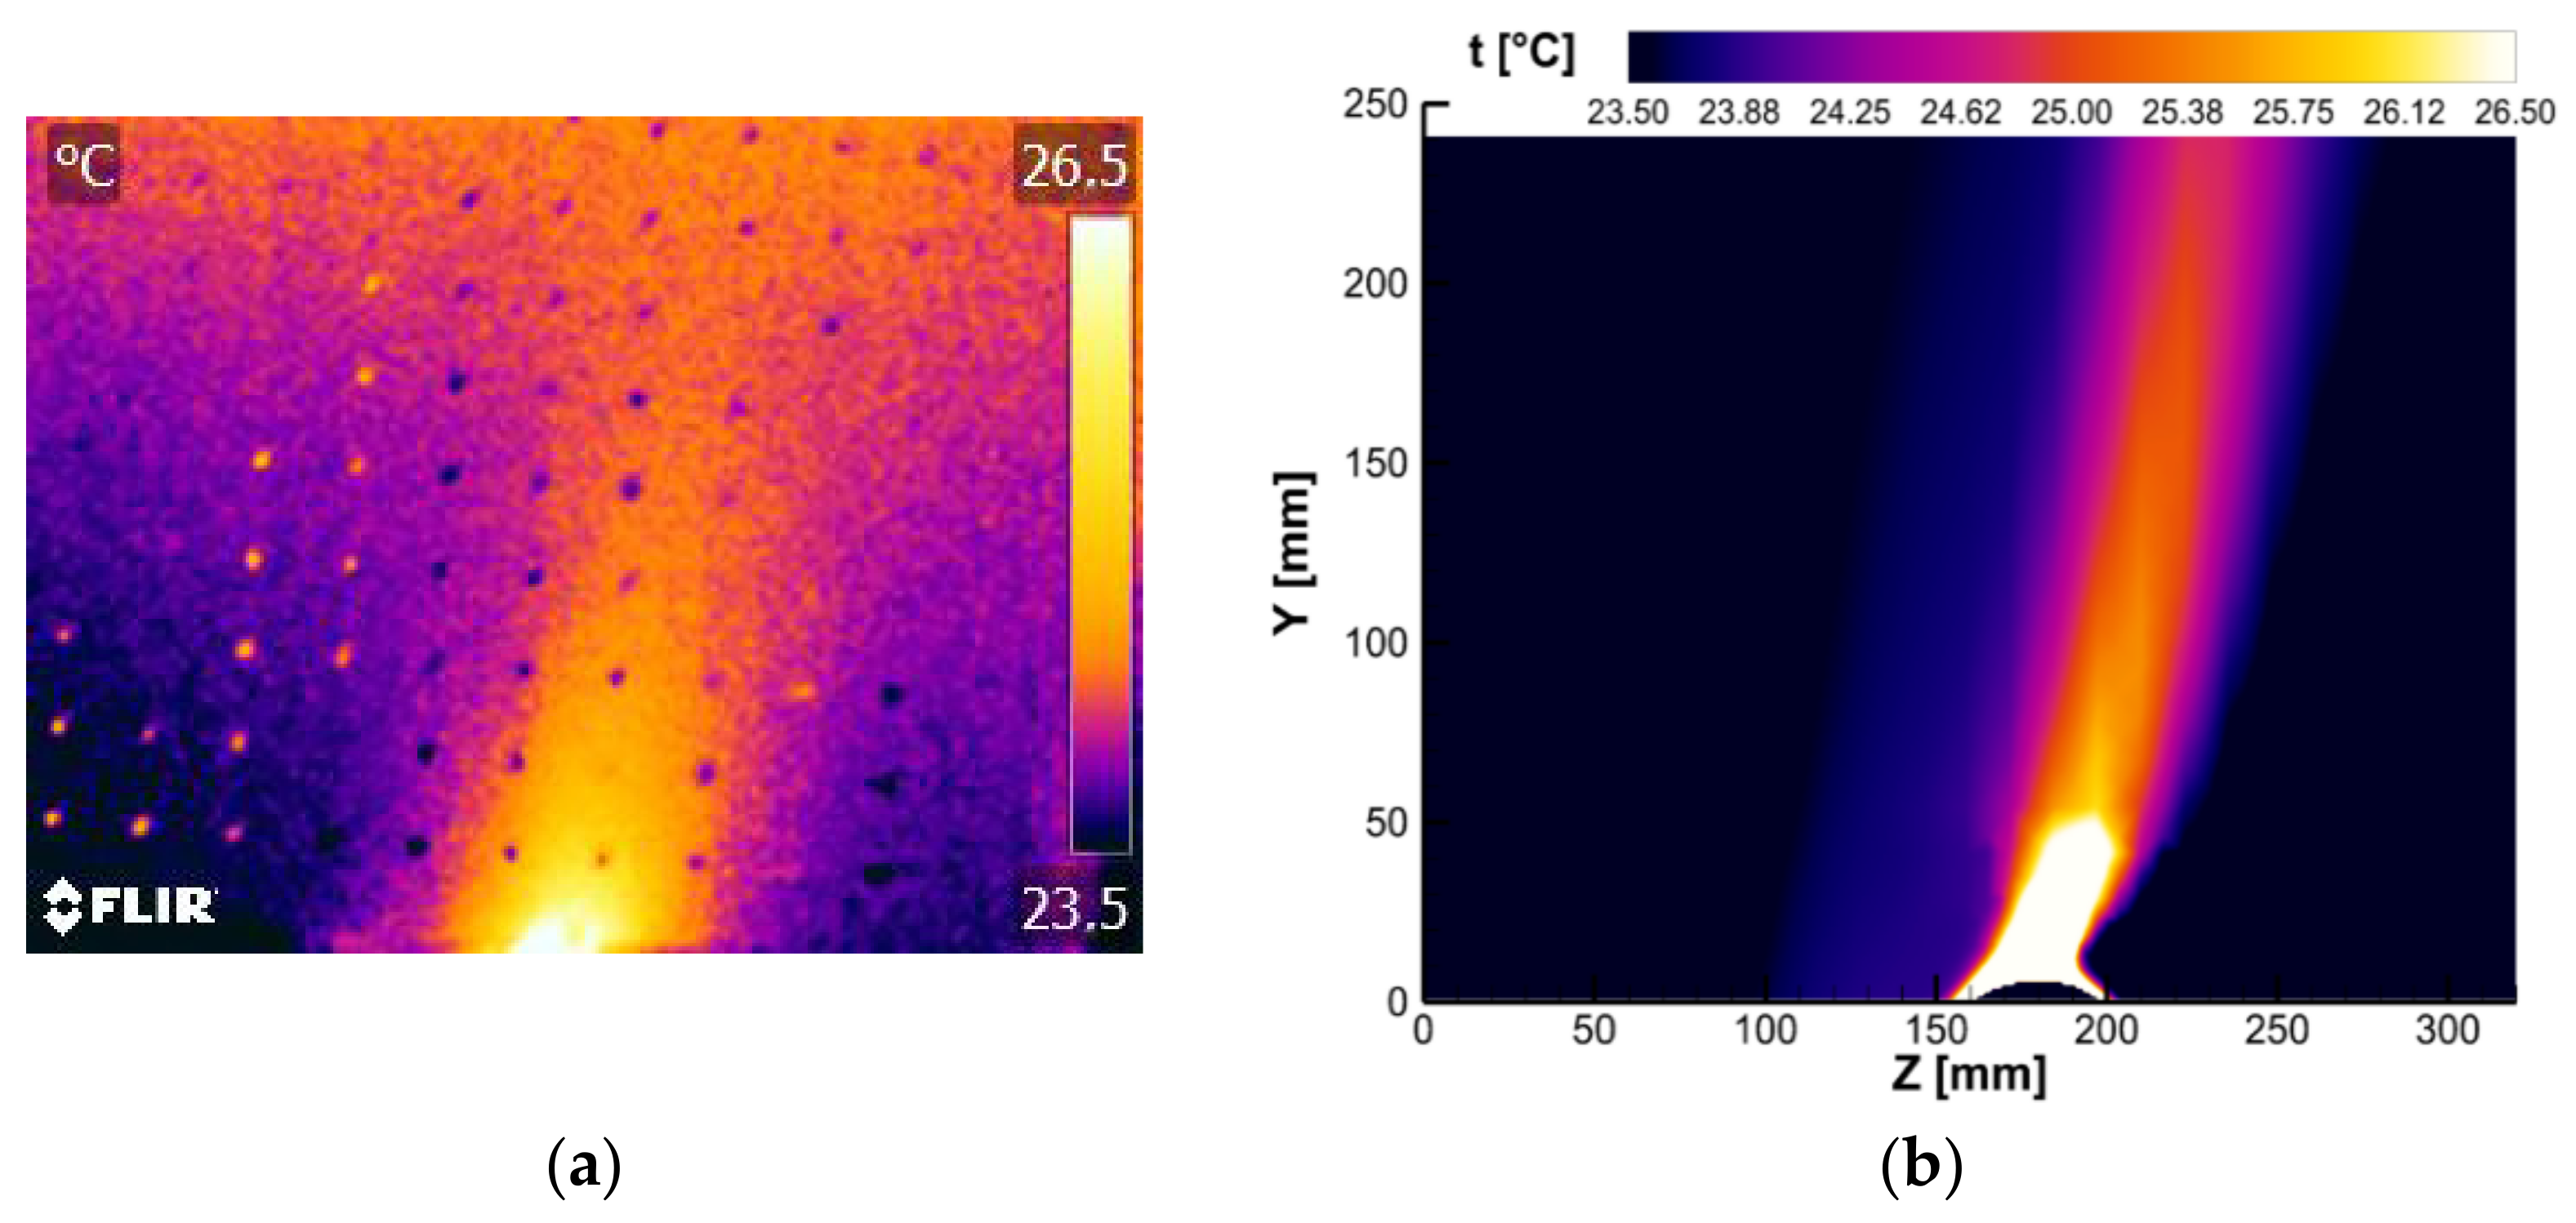
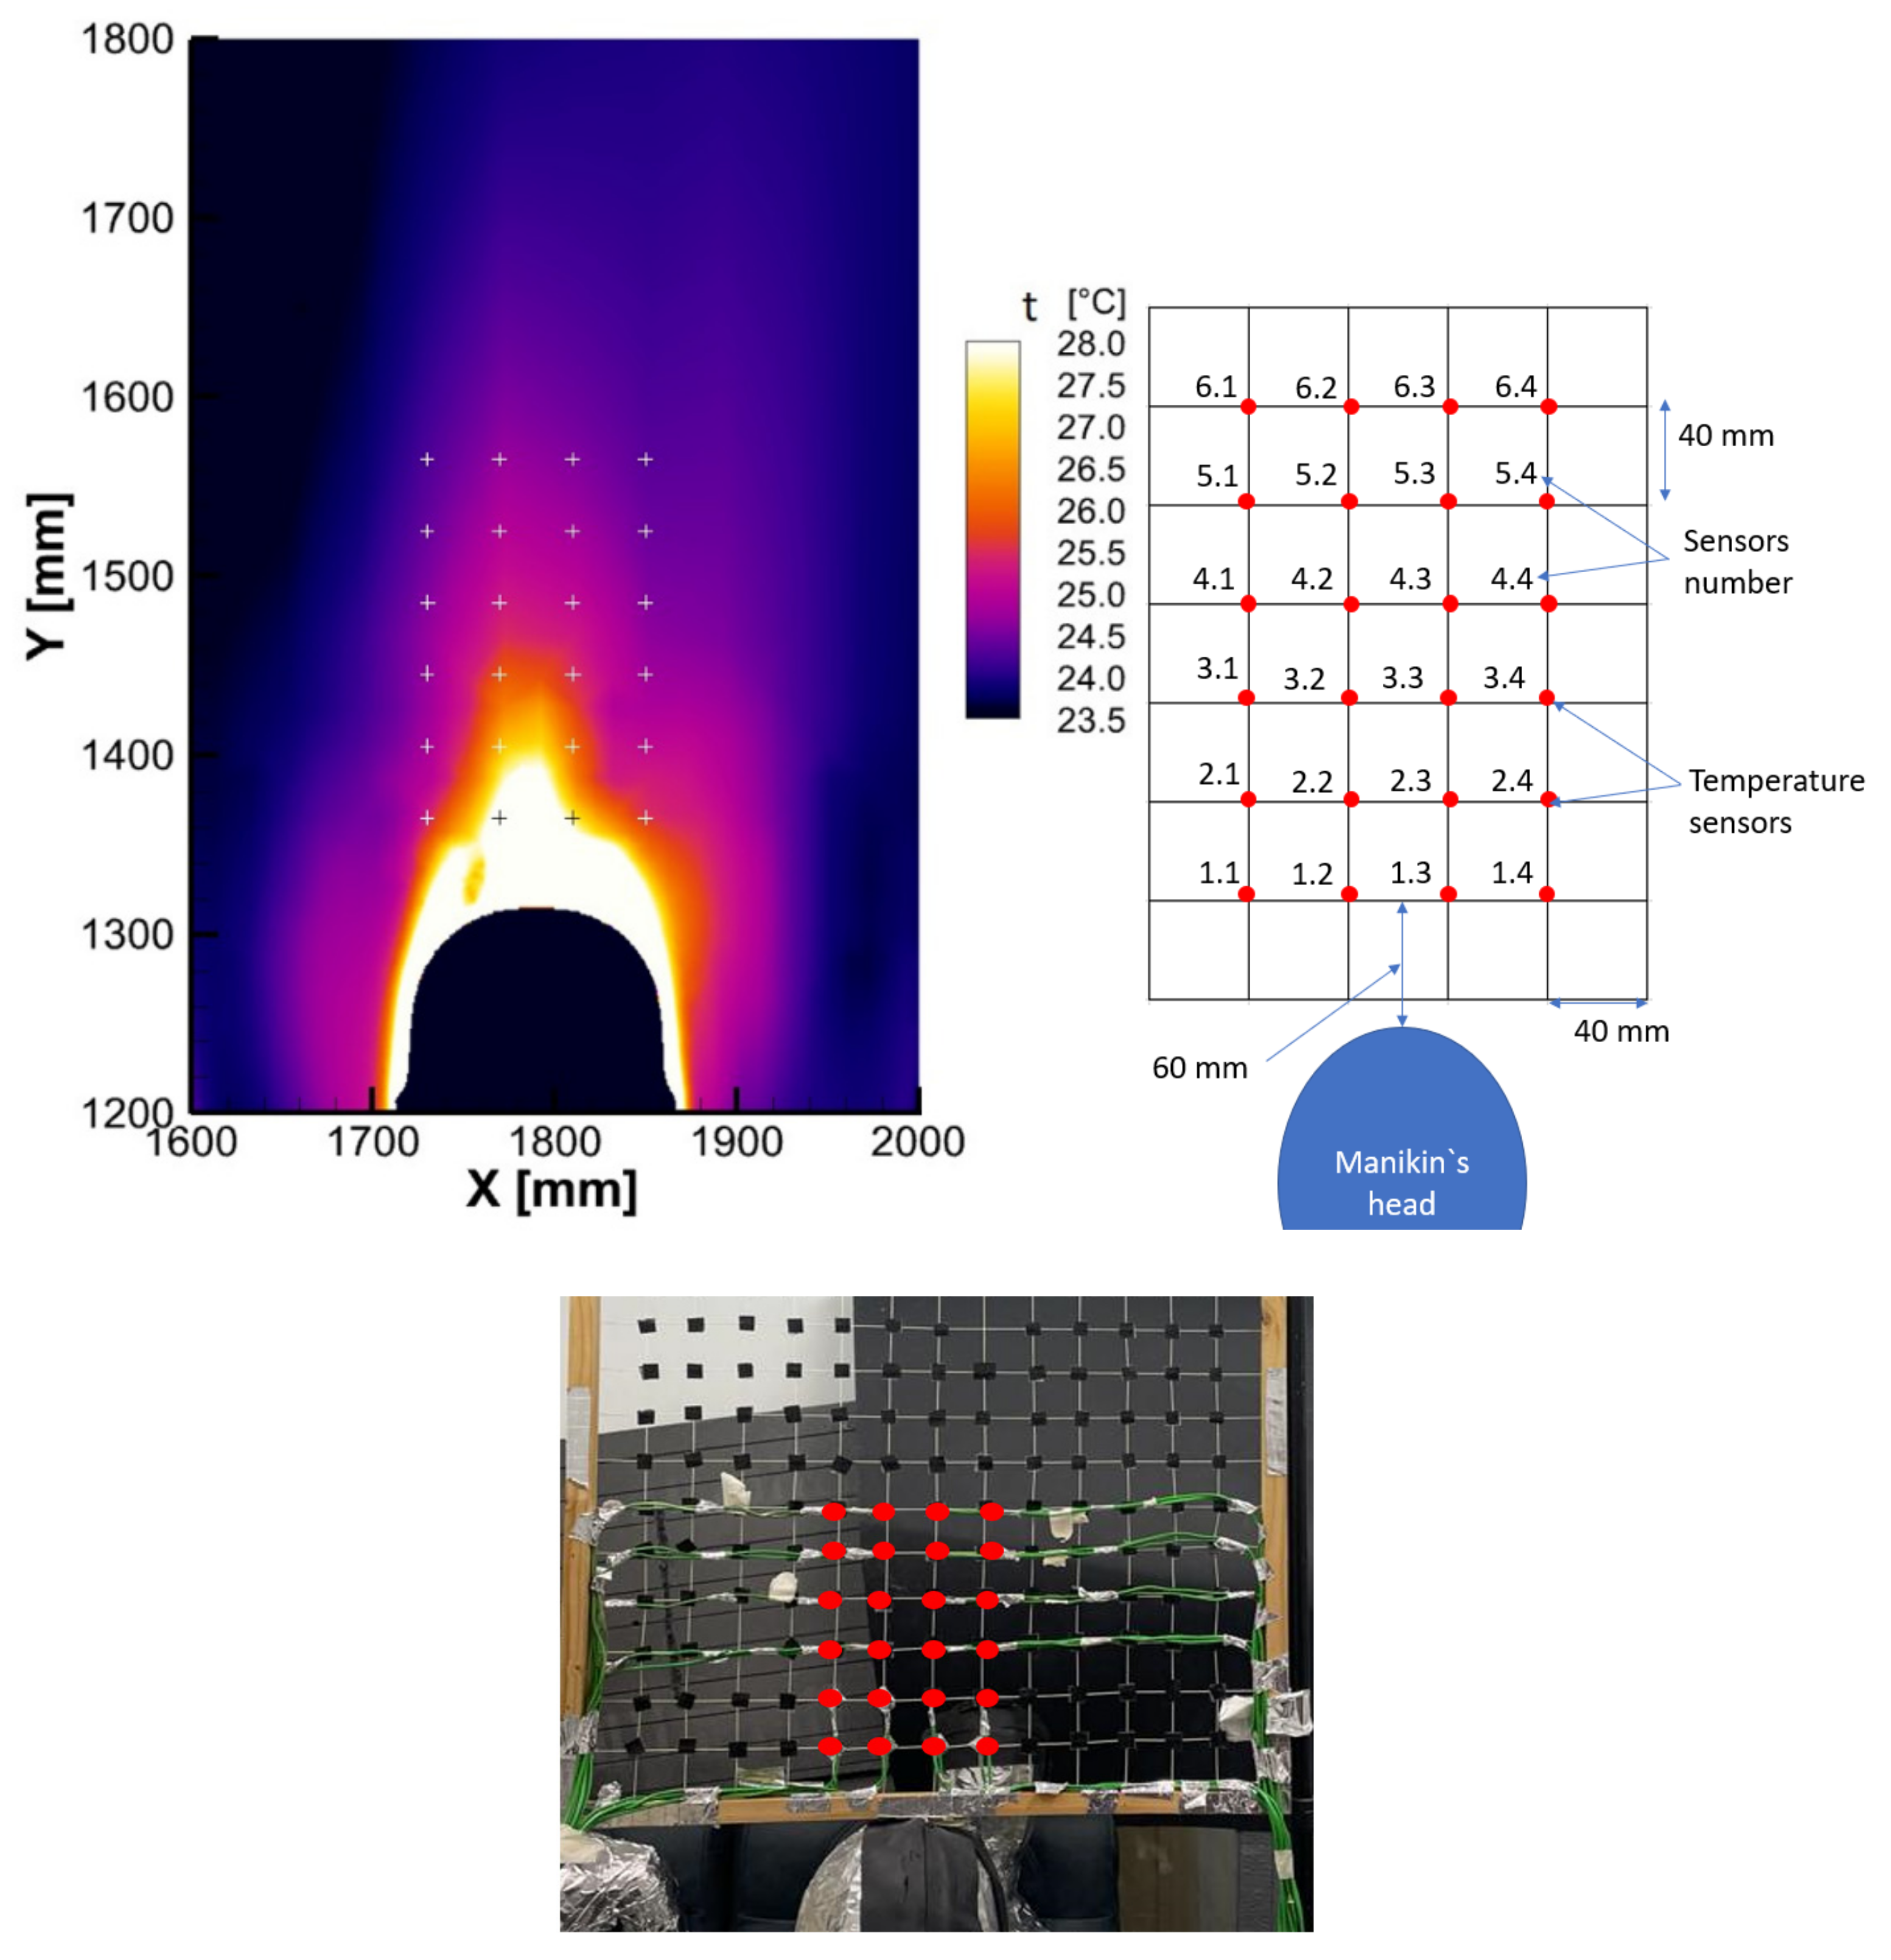
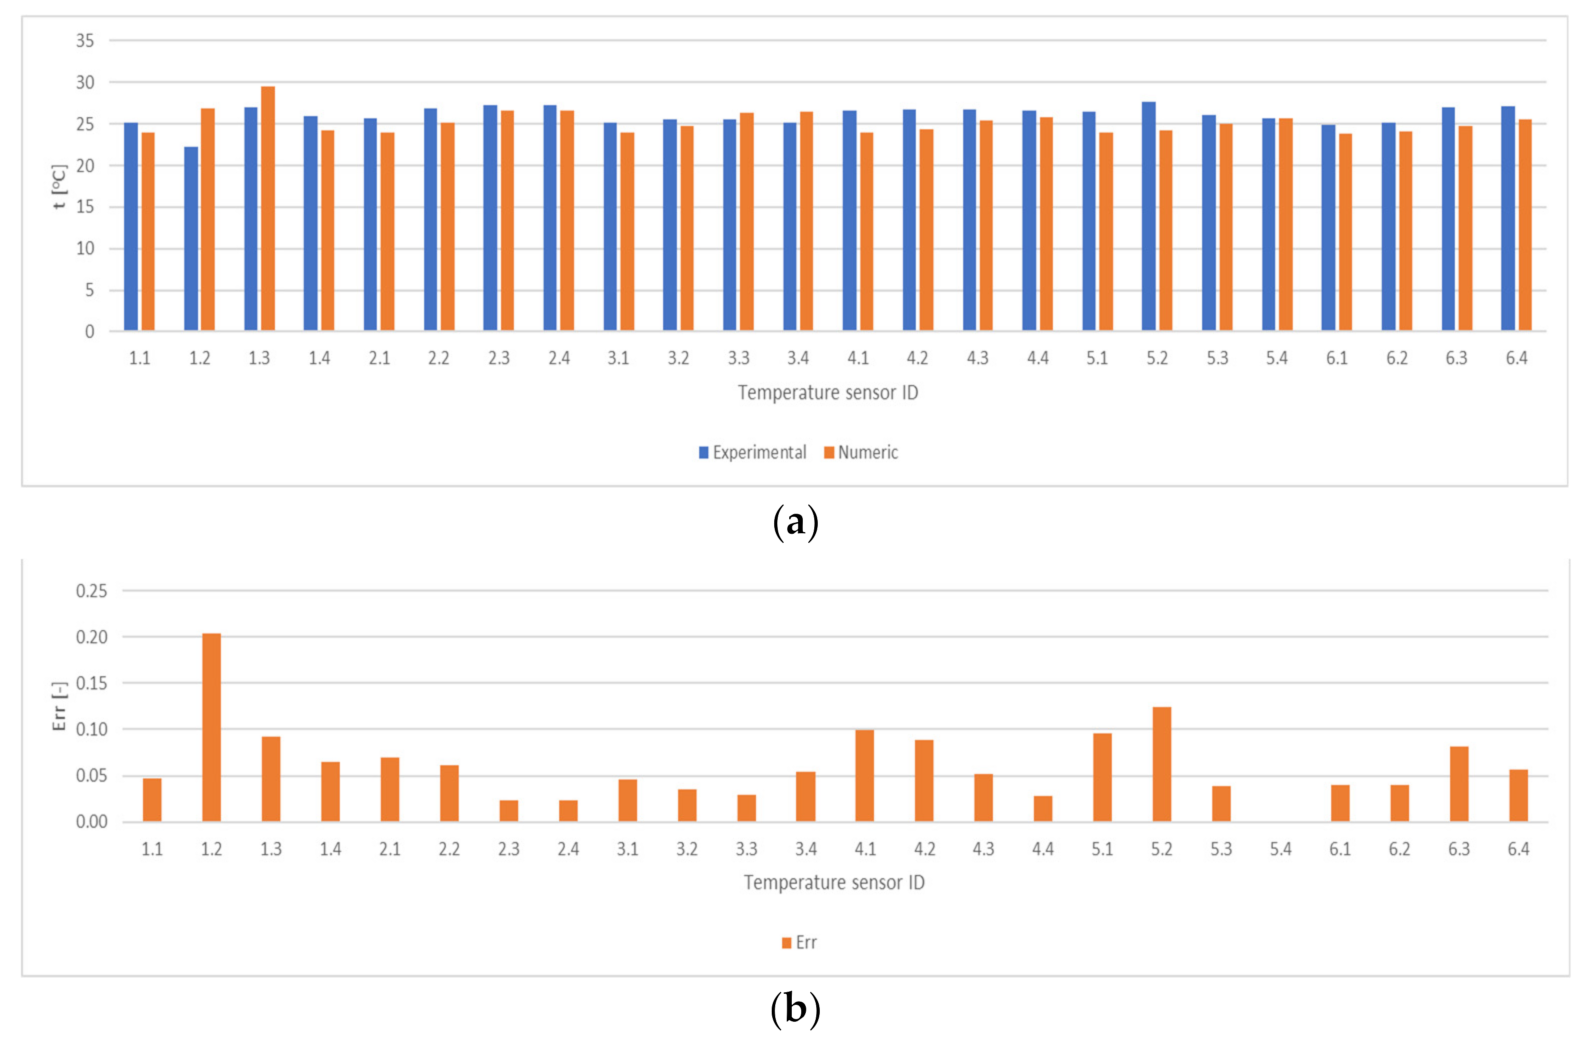
3.1.2. Thermal Measurements
3.2. Validation of PV Fields
3.3. Numerical Results
4. Conclusions
Author Contributions
Funding
Conflicts of Interest
References
- WHO. Available online: https://www.who.int/emergencies/diseases/novel-coronavirus-2019/events-as-theyhappen (accessed on 28 October 2021).
- WHO. Available online: https://www.who.int/emergencies/diseases/novel-coronavirus-2019/situation-reports (accessed on 28 October 2021).
- Tian, H.; Liu, Y.; Li, Y.; Wu, C.-H.; Chen, B.; Kraemer, M.U.G.; Li, B.; Cai, J.; Xu, B.; Yang, Q.; et al. An investigation of transmission control measures during the first 50 days of the COVID-19 epidemic in China. Science 2020, 368, 638–642. [Google Scholar] [CrossRef] [Green Version]
- International Air Transport Association, Traveler Numbers Reach New Heights. Available online: https://www.iata.org/pressroom/pr/Pages/2018-09-06-01.aspx (accessed on 3 November 2021).
- IATA. Available online: https://www.statista.com/statistics/564717/airline-industry-passenger-traffic-globally/ (accessed on 3 November 2021).
- International Air Transport Association, IATA Forecast Predicts 8.2 billion Air Travelers in 2037. Available online: https://www.iata.org/pressroom/pr/Pages/2018-10-24-02.aspx (accessed on 3 November 2021).
- IATA. Available online: https://www.iata.org/en/pressroom/pr/2020-03-05-01/ (accessed on 3 November 2021).
- IATA. Available online: https://www.iata.org/en/pressroom/pr/2021-04-21-01/ (accessed on 3 November 2021).
- Mangili, A.; Vindenes, T.; Gendreau, M. Infectious Risks of Air Travel. Microbiol. Spectr. 2015, 3, 333–344. [Google Scholar] [CrossRef] [PubMed] [Green Version]
- European Centre for Disease Prevention and Control. Available online: https://www.ecdc.europa.eu/sites/default/files/media/en/publications/Publications/0911_GUI_Risk_Assessment_Guidelines_for_Diseases_Transmitted_on_Aircraft.pdf (accessed on 3 November 2021).
- Morawska, L.; Cao, J. Airborne transmission of SARS-CoV-2: The world should face the reality. Environ. Int. 2020, 139, 105730. [Google Scholar] [CrossRef]
- Greenhalgh, T.; Jimenez, J.L.; Prather, K.A.; Tufekci, Z.; Fisman, D.; Schooley, R. Ten scientific reasons in support of airborne transmission of SARS-CoV-2. Lancet 2021, 397, 1603–1605. [Google Scholar] [CrossRef]
- Wei, J.; Li, Y. Airborne spread of infectious agents in the indoor environment. Am. J. Infect. Control 2016, 44, S102–S108. [Google Scholar] [CrossRef] [PubMed]
- ISO/TC 159/SC 5, ISO 14505-1:2007; Ergonomics of the Thermal Environment—Evaluation of Thermal Environments in Vehicles Part 1: Principles and Methods for Assessment of Thermal Stress. ISO: Geneva, Switzerland, 2007.
- Hertzberg, V.S.; Weiss, H.; Elon, L.; Si, W.; Norris, S.L. The FlyHealthy Research Team Behaviors, movements, and transmission of droplet-mediated respiratory diseases during transcontinental airline flights. Proc. Natl. Acad. Sci. USA 2018, 115, 3623–3627. [Google Scholar] [CrossRef] [PubMed] [Green Version]
- Olsen, S.J.; Chang, H.-L.; Cheung, T.Y.-Y.; Tang, A.F.-Y.; Fisk, T.L.; Ooi, S.P.-L.; Kuo, H.-W.; Jiang, D.D.-S.; Chen, K.-T.; Lando, J.; et al. Transmission of the Severe Acute Respiratory Syndrome on Aircraft. N. Engl. J. Med. 2003, 349, 2416–2422. [Google Scholar] [CrossRef]
- AvioInteriors. Available online: http://aviointeriors.it/prodotti/janus/ (accessed on 3 November 2021).
- CNN. Available online: https://edition.cnn.com/travel/article/socially-distanced-airplane-seat-interspace-lite/index.html (accessed on 3 November 2021).
- Leitmeyer, K.; Adlhoch, C. Review Article: Influenza Transmission on Aircraft: A Systematic Literature Review. Epidemiology 2016, 27, 743–751. [Google Scholar] [CrossRef]
- Morawska, L.J.G.R.; Johnson, G.R.; Ristovski, Z.D.; Hargreaves, M.; Mengersen, K.; Corbett, S.; Chao, C.Y.H.; Li, Y.; Katoshevski, D. Size distribution and sites of origin of droplets expelled from the human respiratory tract during expiratory activities. J. Aerosol Sci. 2009, 40, 256–259. [Google Scholar] [CrossRef] [Green Version]
- Sterling, E.M.; Arundel, A.; Sterling, T.D. Criteria for Human Exposure to Humidity in Occupied Buildings. Ashrae Trans. 1985, 91, 611–622. [Google Scholar]
- Yang, W.; Elankumaran, S.; Marr, L.C. Relationship between Humidity and Influenza A Viability in Droplets and Implications for Influenza’s Seasonality. PLoS ONE 2012, 7, e46789. [Google Scholar] [CrossRef] [PubMed] [Green Version]
- Metz, J.A.; Finn, A. Influenza and humidity—Why a bit more damp may be good for you! J. Infect. 2015, 71 (Suppl. 1), S54–S58. [Google Scholar] [CrossRef] [PubMed]
- Hunt, E. Commercial Airliner Environmental Control System. 1995. Available online: http://www.boeingteam.net/commercial/cabinair/ecs.pdf (accessed on 28 October 2021).
- Hinninghofen, H.; Enck, P. Passenger well-being in airplanes. Auton. Neurosci. 2006, 129, 80–85. [Google Scholar] [CrossRef] [PubMed]
- Liu, W.; Mazumdar, S.; Zhang, Z.; Poussou, S.B.; Liu, J.; Lin, C.-H.; Chen, Q. State-of-the-art methods for studying air distributions in commercial airliner cabins. Build. Environ. 2012, 47, 5–12. [Google Scholar] [CrossRef] [PubMed]
- Breugelmans, J.G.; Zucs, P.; Porten, K.; Broll, S.; Niedrig, M.; Ammon, A.; Krause, G. SARS Transmission and Commercial Aircraft. Emerg. Infect. Dis. 2004, 10, 1502–1503. [Google Scholar] [CrossRef] [PubMed] [Green Version]
- Cheng, Y.; Niu, J.; Gao, N. Thermal comfort models: A review and numerical investigation. Build. Environ. 2012, 47 (Suppl. C), 13–22. [Google Scholar] [CrossRef]
- Veselý, M.; Zeiler, W. Personalized conditioning and its impact on thermal comfort and energy performance—A review. Renew. Sustain. Energy Rev. 2014, 34, 401–408. [Google Scholar] [CrossRef] [Green Version]
- Cao, G.; Awbi, H.; Yao, R.; Fan, Y.; Sirén, K.; Kosonen, R.; Zhang, J. A review of the performance of different ventilation and airflow distribution systems in buildings. Build. Environ. 2014, 73, 171–186. [Google Scholar] [CrossRef]
- ASHRAE Position Document on Airborne Infectious Diseases. Available online: https://www.ashrae.org/file%20library/about/position%20documents/airborne-infectious-diseases.pdf (accessed on 28 October 2021).
- Alahmer, A.; Mayyas, A.; Mayyas, A.A.; Omar, M.; Shan, D. Vehicular thermal comfort models; a comprehensive review. Appl. Therm. Eng. 2011, 31, 995–1002. [Google Scholar] [CrossRef]
- Pantelic, J.; Sze-To, G.N.; Tham, K.W.; Chao, C.Y.; Khoo, Y.C.M. Personalized ventilation as a control measure for airborne transmissible disease spread. J. R. Soc. Interface 2009, 6 (Suppl. 6), S715–S726. [Google Scholar] [CrossRef] [Green Version]
- Schmidt, M.; Muller, D.; Markwart, M. Numerical study of different air distribution systems for aircraft cabins. In Proceedings of the 11th International Conference on Indoor Air Quality and Climate, Copenhagen, Denmark, 17–22 August 2008. [Google Scholar]
- Müller, D.; Schmidt, M.; Müller, B. Application of a displacement ventilation system for air distribution in aircraft cabins. In Proceedings of the 3rd International Workshop on Aircraft System Technologies, Hamburg, Germany, 31 March–1 April 2011; pp. 279–288. [Google Scholar]
- Zhang, T.; Yin, S.; Wang, S. An under-aisle air distribution system facilitating humidification of commercial aircraft cabins. Build. Environ. 2010, 45, 907–915. [Google Scholar] [CrossRef] [PubMed]
- Zhang, T.; Li, P.; Wang, S. A personal air distribution system with air terminals embedded in chair armrests on commercial airplanes. Build. Environ. 2012, 47, 89–99. [Google Scholar] [CrossRef]
- Xu, C.; Nielsen, P.V.; Liu, L.; Jensen, R.L.; Gong, G. Impacts of airflow interactions with thermal boundary layer on performance of personalized ventilation. Build. Environ. 2018, 135, 31–41. [Google Scholar] [CrossRef]
- Meslem, A.; Nastase, I.; Allard, F. Passive mixing control for innovative air diffusion terminal devices for buildings. Build. Environ. 2010, 45, 2679–2688. [Google Scholar] [CrossRef]
- Nastase, I.; Meslem, A. Vortex Dynamics and mass entrainement in turbulent lobed jets with and without lobe deflection angles. Exp. Fluids 2010, 48, 693–714. [Google Scholar] [CrossRef]
- Meslem, A.; El-Hassan, M.; Nastase, I. Analysis of jet entrainment mechanism in the transitional regime by time-resolved PIV. J. Vis. 2010, 14, 41–52. [Google Scholar] [CrossRef]
- Nastase, I.; Meslem, A.; Gervais, P. Primary and secondary vortical structures contribution in the entrainement of low Reynolds number jet flows. Exp. Fluids 2008, 44, 1027–1033. [Google Scholar] [CrossRef]
- Bolashikov, Z.; Melikov, A.K.; Spilak, M.; Nastase, I.; Meslem, A. Improved inhaled air quality at reduced ventilation rate by control of airflow interaction at the breathing zone with lobed jets. Hvac&R Res. 2014, 20, 238–250. [Google Scholar]
- Melikov, A.K.; Cermak, R.; Majer, M. Personalized ventilation: Evaluation of different air terminal devices. Energy Build. 2002, 34, 829–836. [Google Scholar] [CrossRef]
- Nastase, I. Analyse des jets lobés en vue de leur intégration dans les Unités Terminales de Diffusion d’air. Ph.D. Thesis, Université de La Rochelle, La Rochelle, France, 2007. [Google Scholar]
- Nastase, I.; Meslem, A. Lobed jets for improving air diffusion performance in buildings. In Proceedings of the 29th AIVC Conference, Kyoto, Japan, 14–16 October 2008. [Google Scholar]
- Nastase, I.; Meslem, A. Vortex dynamics and entrainment mechanisms in low Reynolds orifice jets. J. Vis. 2008, 11, 309–318. [Google Scholar] [CrossRef]
- Nastase, I.; Meslem, A.; Bowmans, T. Vortical structures analysis in jet flows using a classical 2D-PIV system and time resolved visualization image processing. J. Flow Vis. Image Process. 2008, 15, 275–300. [Google Scholar] [CrossRef]
- Nastase, I.; Meslem, A.; Vlad, I.; Colda, I. Lobed grilles for high mixing ventilation—An experimental analysis in a full scale model room. Build. Environ. 2011, 46, 547–555. [Google Scholar] [CrossRef]
- Junjing, Y.; Sekhar, C.; Cheong, D.; Raphael, B. Performance evaluation of an integrated Personalized Ventilation–Personalized Exhaust system in conjunction with two background ventilation systems. Build. Environ. 2014, 78, 103–110. [Google Scholar] [CrossRef]
- Ursu, I.; Croitoru, D.G.C.; Danca, P.; Nastase, I. Advanced Thermal Manikin Prototype with Neuro-fuzzy Control System. In Proceedings of the 4th International Conference On Building Energy Environment, Melbourne, Australia, 5–9 February 2018. [Google Scholar]
- Georgescu, M.R.; Meslem, A.; Nastase, I.; Bode, F. Personalized ventilation solutions for reducing CO2 levels in the crew quarters of the International Space Station. Build. Environ. 2021, 204, 108150. [Google Scholar] [CrossRef]
- Danca, P.; Bode, F.; Năstase, I.; Croitoru, C.V.; Meslem, A. Experimental and numerical study of the air distribution inside a car cabin. In Proceedings of the 1st Conference of the UTCB Doctoral School, Bucharest, Romania, 26 October 2018. [Google Scholar]
- Danca, P.; Bode, F.; Dogeanu, A.; Croitoru, C.V.; Sandu, M.; Meslem, A.; Nastase, I. Experimental study of thermal comfort in a vehicle cabin during the summer season. E3S Web Conf. 2019, 111, 01048. [Google Scholar] [CrossRef] [Green Version]
- Danca, P.; Bode, F.; Nastase, I.; Meslem, A. On the Possibility of CFD Modeling of the Indoor Environment in a Vehicle. Energy Procedia 2017, 112, 656–663. [Google Scholar] [CrossRef]
- Danca, P.; Bode, F.; Nastase, I.; Meslem, A. CFD simulation of a cabin thermal environment with and without human body—thermal comfort evaluation. E3S Web Conf. 2018, 32, 111–118. [Google Scholar] [CrossRef]
- Tacutu, L.; Bode, F.; Năstase, I.; Croitoru, C.; Dogeanu, A. Experimental and numerical study on the thermal plumes of a standing and lying human in an operating room. Sci. Technol. Built Environ. 2021, 1–19. [Google Scholar] [CrossRef]
- Bode, F.; Meslem, A.; Patrascu, C.; Nastase, I. Flow and wall shear rate analysis for a cruciform jet impacting on a plate at short distance. Prog. Comput. Fluid Dyn. 2020, 20, 16. [Google Scholar] [CrossRef]
- Voelker, C.; Maempel, S.; Kornadt, O. Measuring the human body’s microclimate using a thermal manikin. Indoor Air 2014, 24, 567–579. [Google Scholar] [CrossRef]
- Licina, D. Human Convective Boundary Layer and Its Impact on Personal Exposure. Ph.D. Thesis, Technical University of Denmark, Department of Civil Engineering, Lyngby, Denmark, 2015. [Google Scholar]
- Arinami, Y.; Akabayashi, S.-I.; Mizutani, K.; Sakaguchi, J. Airflow Distribution Measurements around the Human Body Using a Thermal Manikin by Particle Image Velocimetry. J. Flow Control. Meas. Vis. 2017, 5, 65–72. [Google Scholar] [CrossRef] [Green Version]
- Georgescu, M.R.; Meslem, A.; Nastase, I. Accumulation and spatial distribution of CO2 in the astronaut’s crew quarters on the International Space Station. Build. Environ. 2020, 185, 107278. [Google Scholar] [CrossRef]


| Climatic Chamber Walls [cm] | Manikin and Chair Surfaces [cm] | Climatic Chamber Velocity Inlet, Pressure Outlet [cm] | PV System Velocity Inlet [cm] | System Walls [cm] | PV Jet Zone [cm] | Field [cm] | |||||
|---|---|---|---|---|---|---|---|---|---|---|---|
| Min | Max | Min | Max | Min | Max | Min | Max | Min | Max | ||
| 1 | 2 | 0.1 | 0.5 | 1 | 0.1 | 0.1 | 0.5 | 0.1 | 0.5 | 0.1 | 5 |
| Parameters | Boundaries | |||||||
|---|---|---|---|---|---|---|---|---|
| Surface Temperature [°C] | ta1-Air | ta2-Air Diffuser | t1-Wall 1 | t2-Wall 2 | t3-Wall 3 | t4-Wall 4 | t5-Ceiling | t6-Floor |
| 17.3 | 22.2 | 22.7 | 22.7 | 25.0 | 23.5 | 22.7 | 21.1 | |
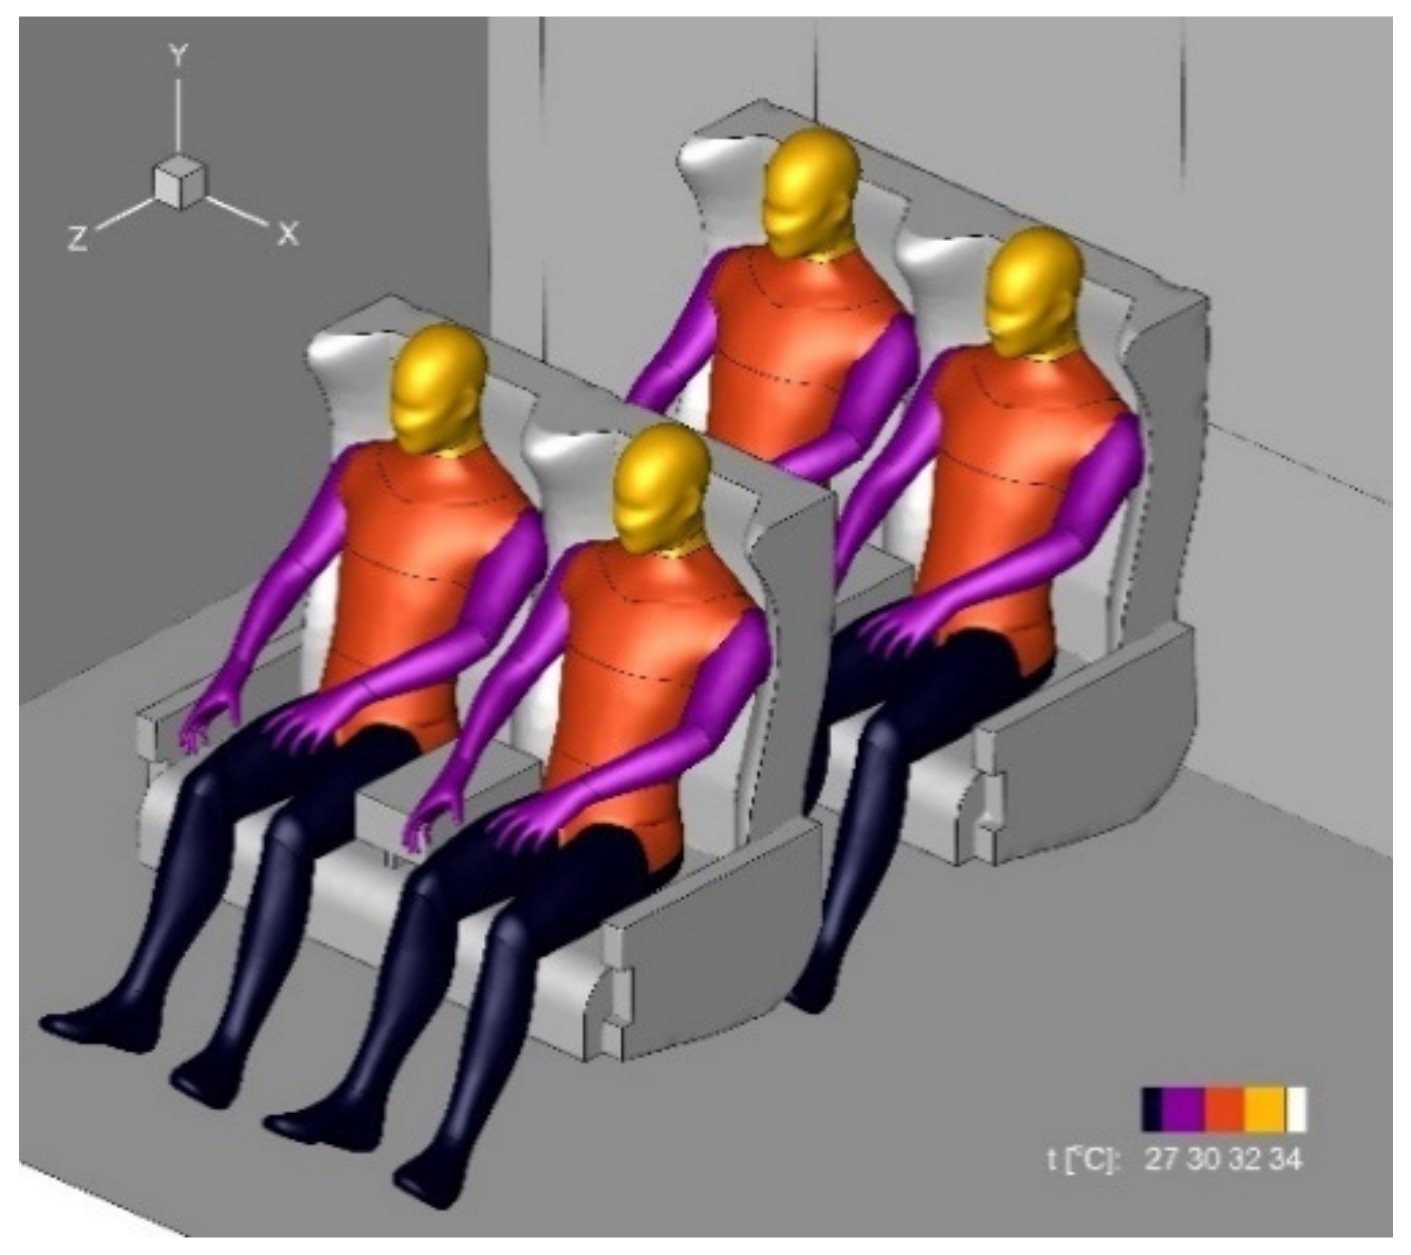
| Manikin temperature [°C] | torso | head and neck | hands | legs | ||||
| 32 | 34 | 30 | 27 | |||||
| Air-diffuser flow rate [m3/h] | 286 | |||||||
Publisher’s Note: MDPI stays neutral with regard to jurisdictional claims in published maps and institutional affiliations. |
© 2022 by the authors. Licensee MDPI, Basel, Switzerland. This article is an open access article distributed under the terms and conditions of the Creative Commons Attribution (CC BY) license (https://creativecommons.org/licenses/by/4.0/).
Share and Cite
Danca, P.; Coşoiu, C.I.; Nastase, I.; Bode, F.; Georgescu, M.R. Personalized Ventilation as a Possible Strategy for Reducing Airborne Infectious Disease Transmission on Commercial Aircraft. Appl. Sci. 2022, 12, 2088. https://doi.org/10.3390/app12042088
Danca P, Coşoiu CI, Nastase I, Bode F, Georgescu MR. Personalized Ventilation as a Possible Strategy for Reducing Airborne Infectious Disease Transmission on Commercial Aircraft. Applied Sciences. 2022; 12(4):2088. https://doi.org/10.3390/app12042088
Chicago/Turabian StyleDanca, Paul, Costin Ioan Coşoiu, Ilinca Nastase, Florin Bode, and Matei Razvan Georgescu. 2022. "Personalized Ventilation as a Possible Strategy for Reducing Airborne Infectious Disease Transmission on Commercial Aircraft" Applied Sciences 12, no. 4: 2088. https://doi.org/10.3390/app12042088