
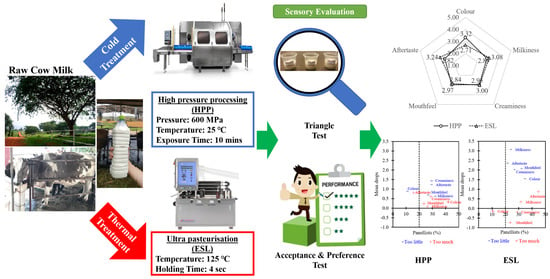
Sensory Analysis for Cow Milk Product Development Using High Pressure Processing (HPP) in the Dairy Industry

 , ,
, ,  ,
,
Abstract
:
1. Introduction
2. Materials and Methods
2.1. Processing of Milk
2.2. Sensory Analysis
2.2.1. Triangle Test
2.2.2. Acceptance and Preference Test
2.3. Data Analysis
3. Results
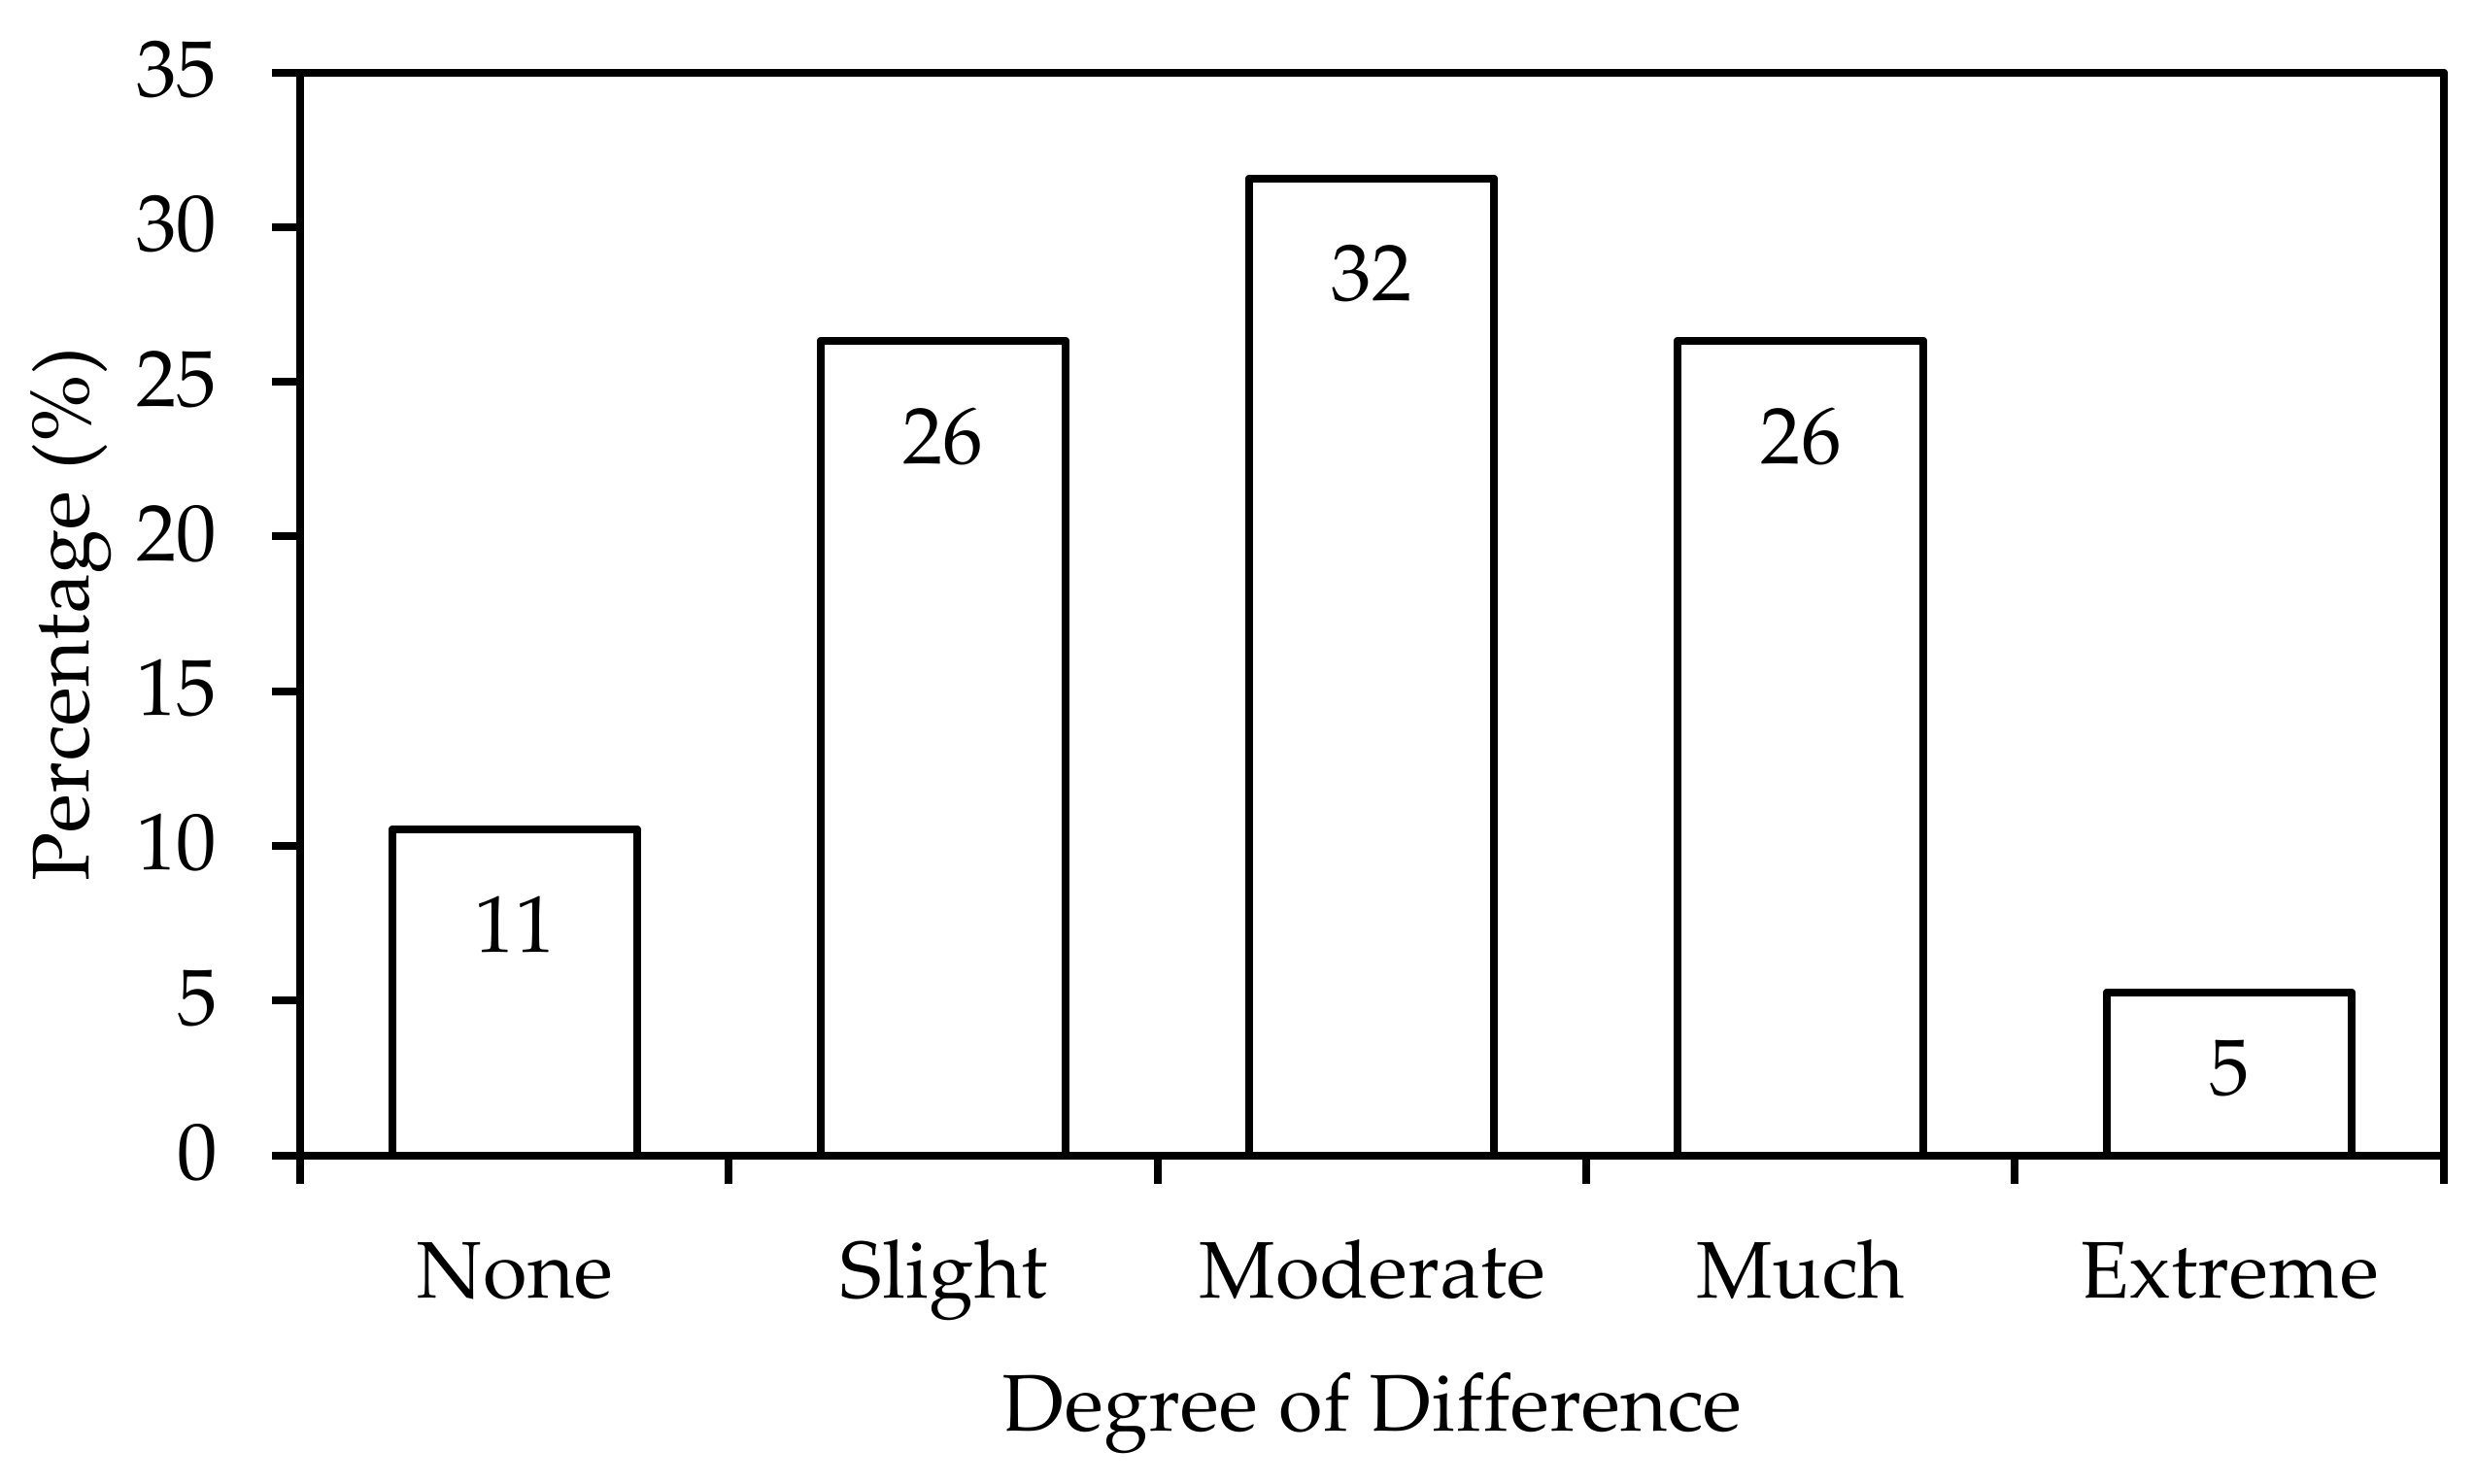
3.1. Triangle Test
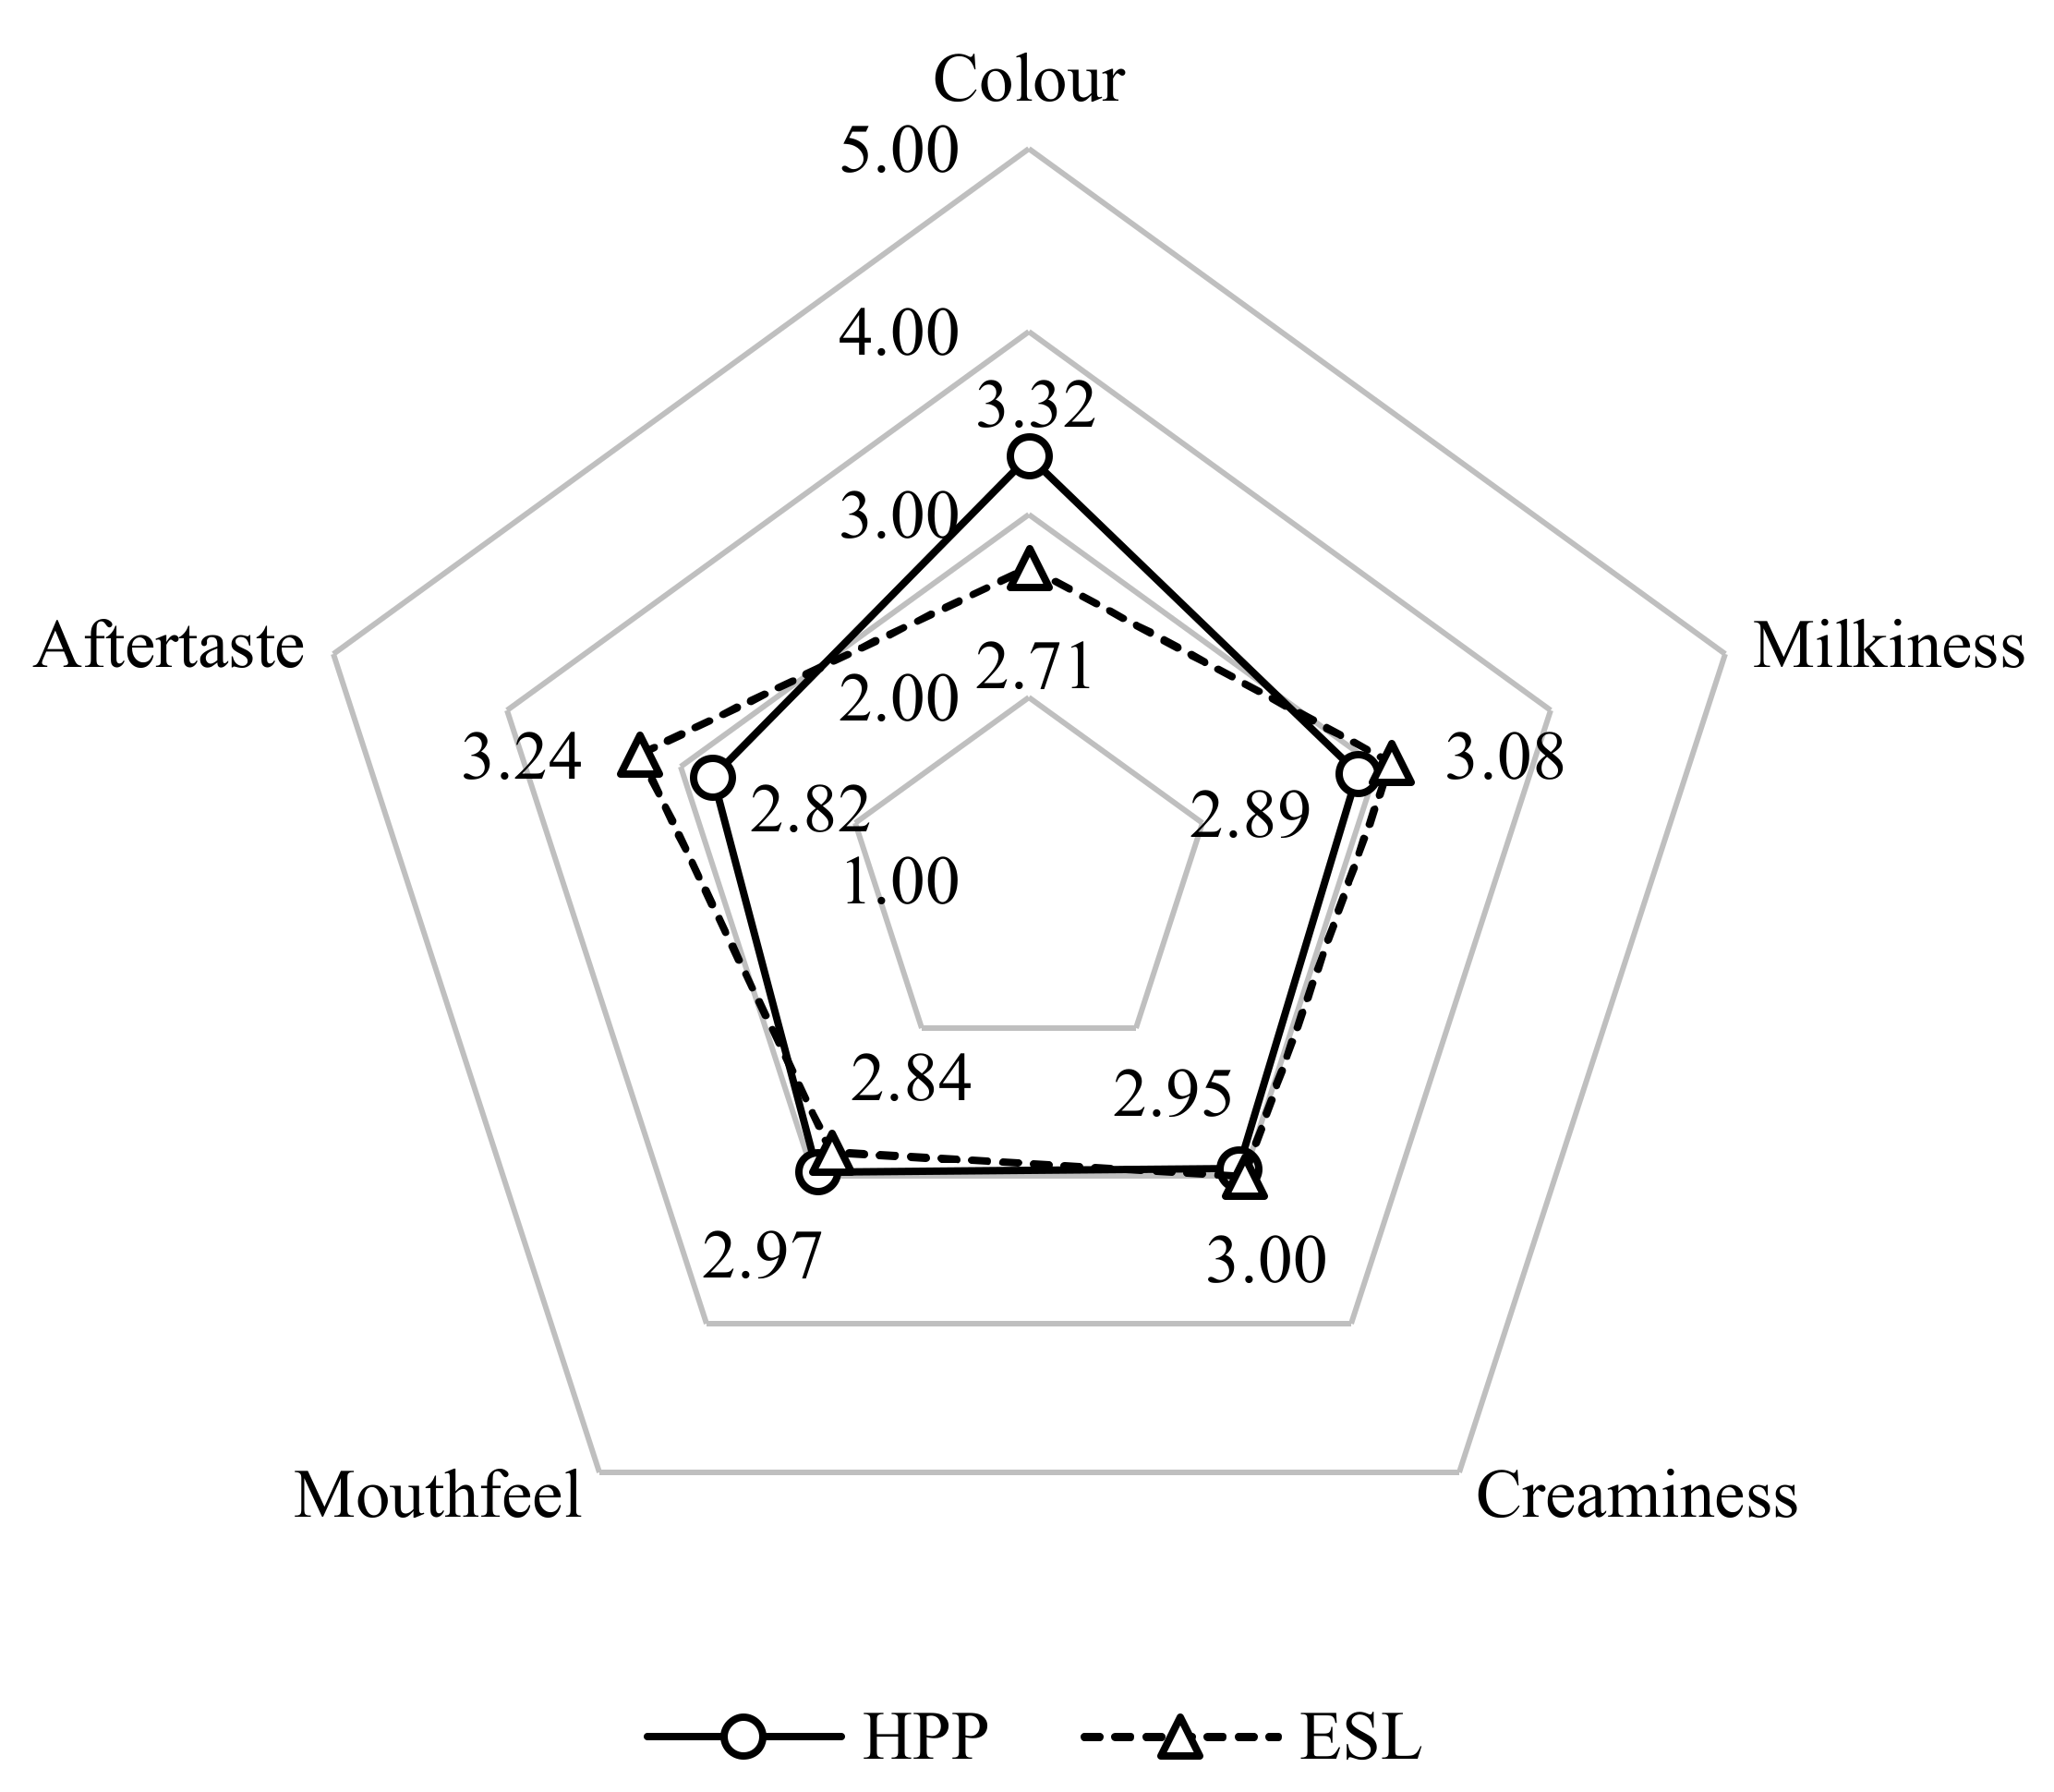
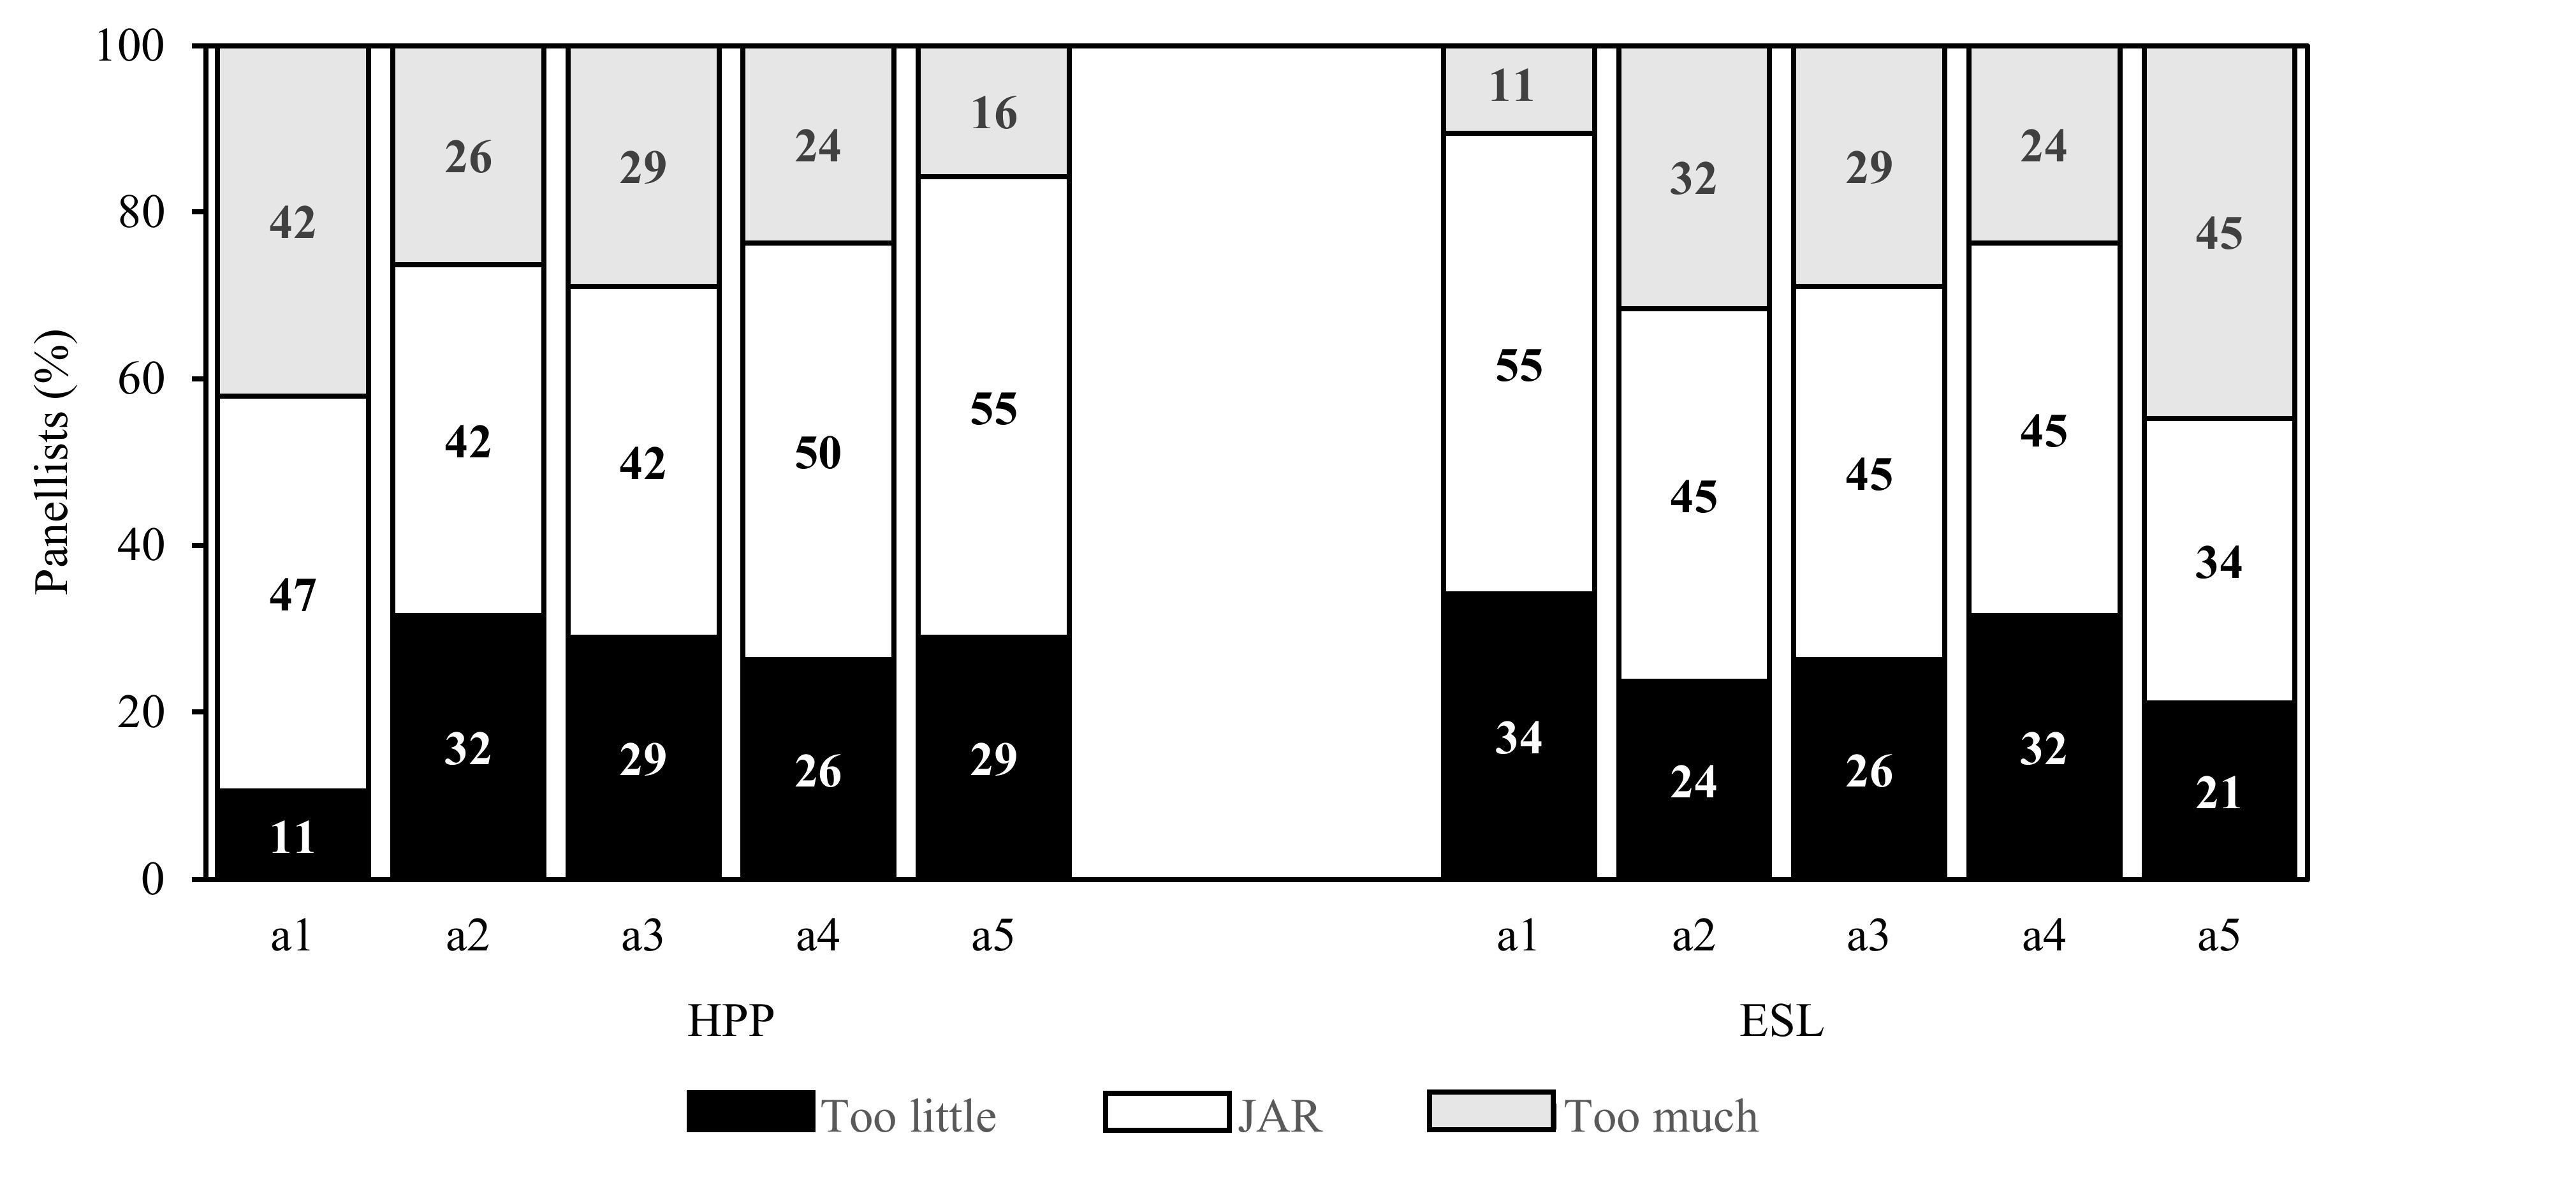
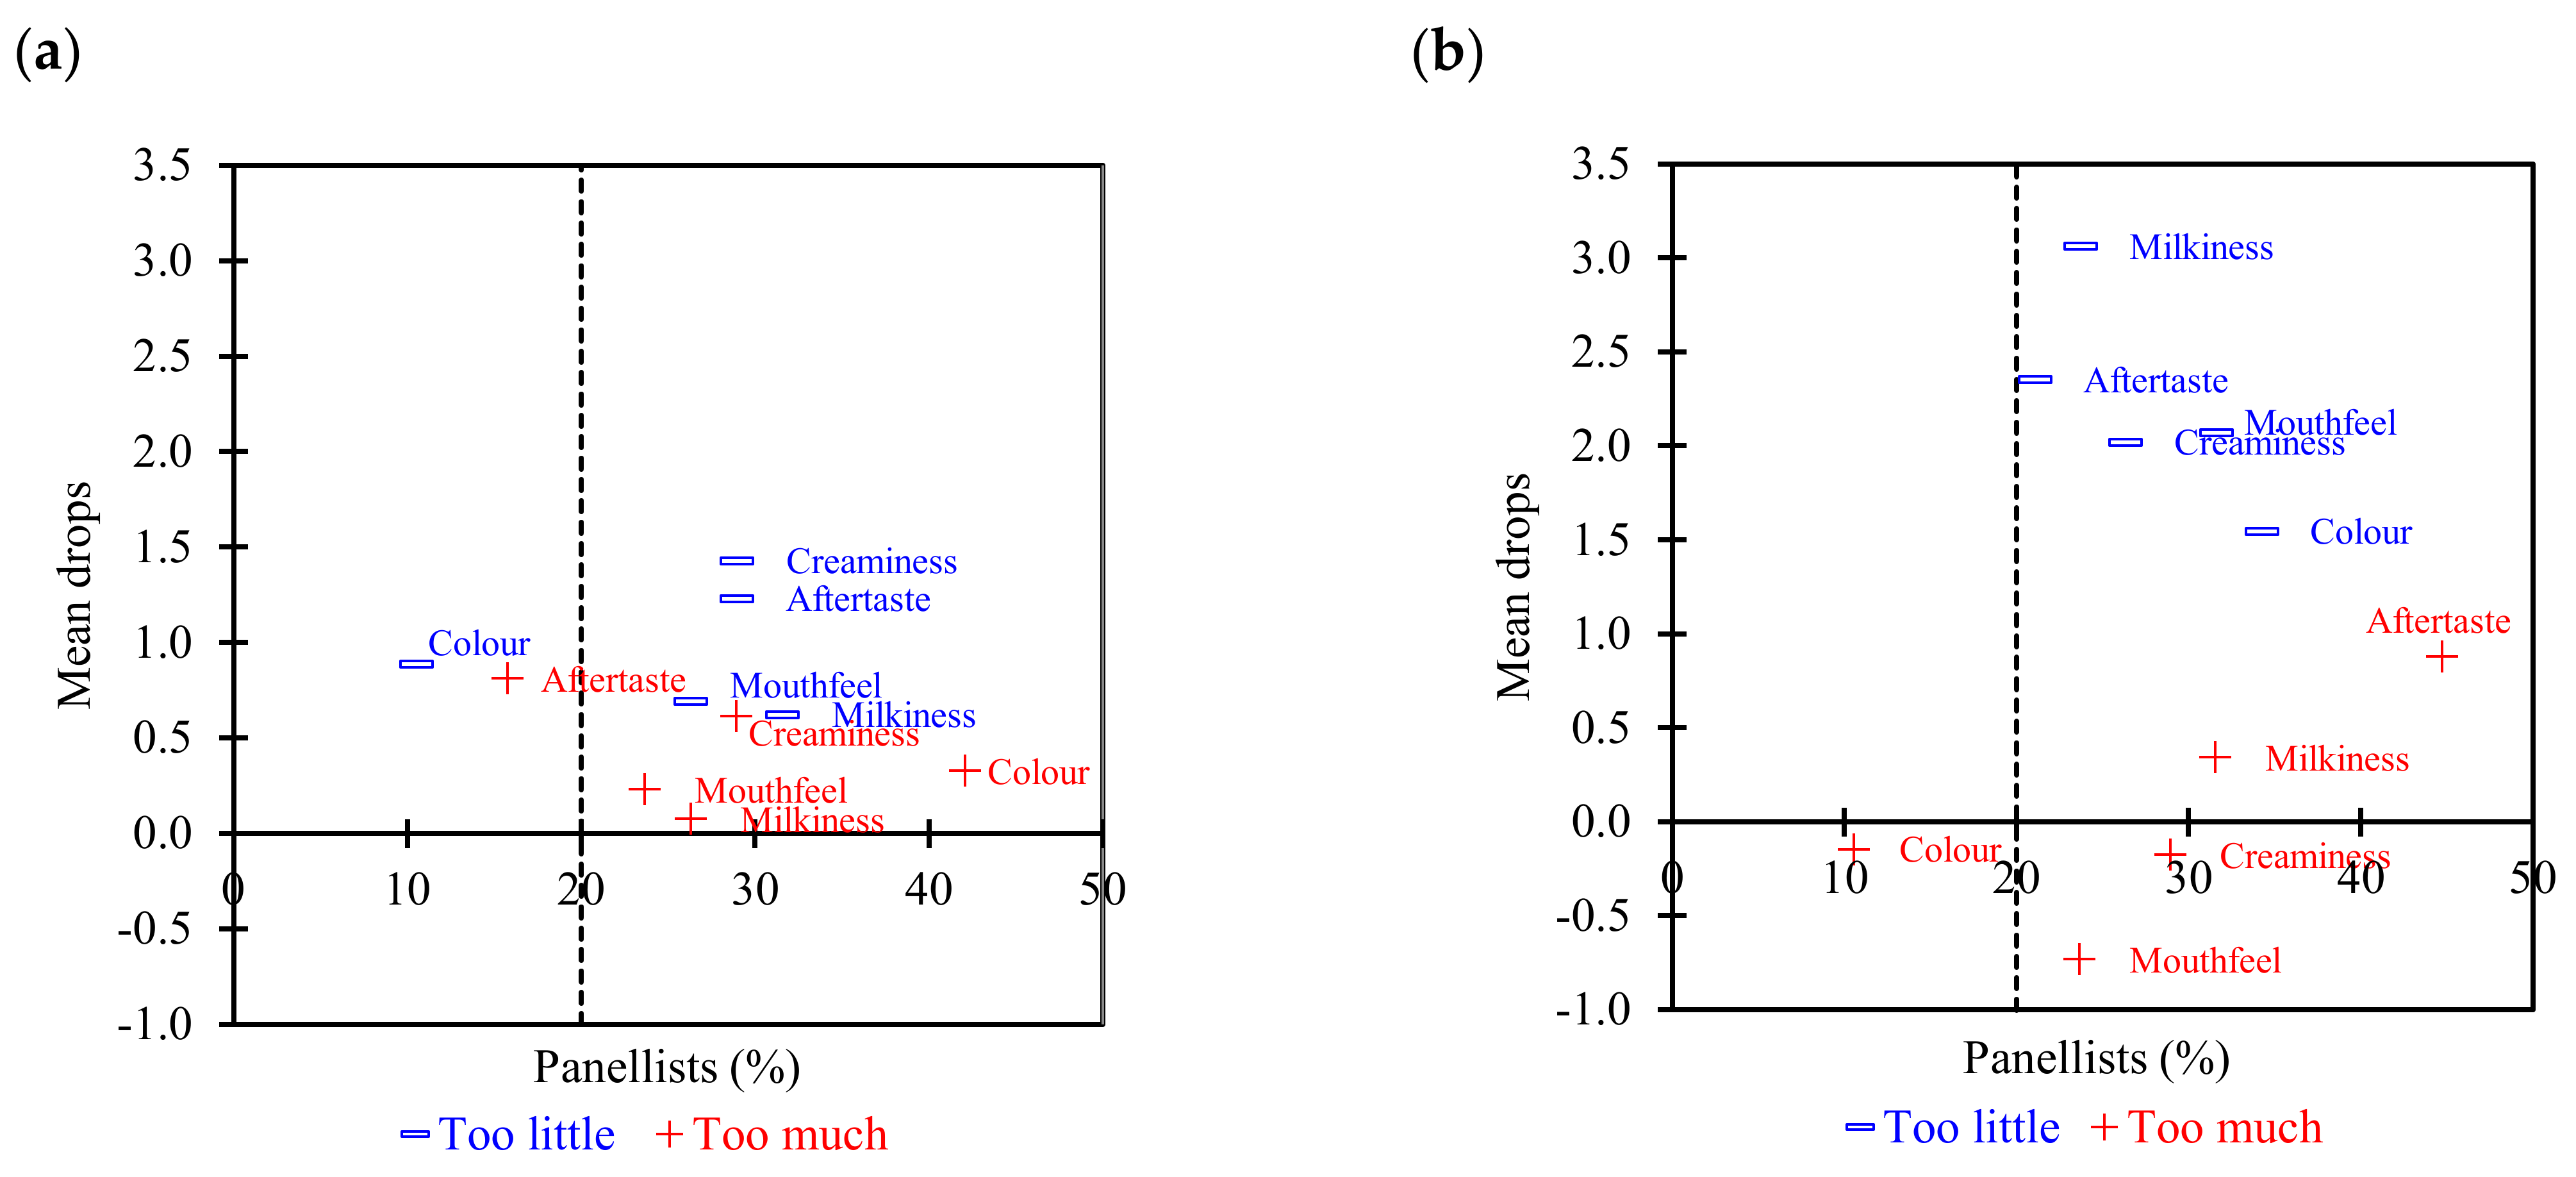
3.2. Acceptance and Preference Test
4. Discussion
5. Conclusions
Author Contributions
Funding
Institutional Review Board Statement
Informed Consent Statement
Data Availability Statement
Conflicts of Interest
Appendix A
References
- Chugh, A.; Khanal, D.; Walkling-Ribeiro, M.; Corredig, M.; Duizer, L.; Griffiths, M.W. Change in Color and Volatile Composition of Skim Milk Processed with Pulsed Electric Field and Microfiltration Treatments or Heat Pasteurization. Foods 2014, 3, 250–268. [Google Scholar] [CrossRef] [PubMed] [Green Version]
- Hw, W.; Am, A. Microbial and Physicochemical Qualities of Pasteurized Milk. J. Food Process. Technol. 2017, 8, 651. [Google Scholar] [CrossRef]
- Lejeune, J.T.; Rajala-Schultz, P.J. Unpasteurized Milk: A Continued Public Health Threat. Clin. Infect. Dis. 2009, 48, 93–100. [Google Scholar] [CrossRef] [PubMed]
- Barraquio, V.L. Which Milk is Fresh? Int. J. Dairy Sci. Processing 2014, 6, 1–6. [Google Scholar] [CrossRef]
- Watts, S. A mini review on technique of milk pasteurization. J. Pharmacogn. Phytochem. 2016, 5, 99–101. [Google Scholar]
- Karlsson, M.A.; Langton, M.; Innings, F.; Malmgren, B.; Höjer, A.; Wikström, M.; Lundh, Å. Changes in stability and shelf-life of ultra-high temperature treated milk during long term storage at different temperatures. Heliyon 2019, 5, e02431. [Google Scholar] [CrossRef] [Green Version]
- Sun, D.W. Thermal Food Processing: New Technologies and Quality Issues; Taylor & Francis Group: Boca Raton, FL, USA, 2006. [Google Scholar]
- Chavan, R.S.; Chavan, S.R.; Khedkar, C.D.; Jana, A.H. UHT Milk Processing and Effect of Plasmin Activity on Shelf Life: A Review. Compr. Rev. Food Sci. Food Saf. 2011, 10, 251–268. [Google Scholar] [CrossRef]
- Lewis, M. Improvements in the pasteurisation and sterilisation of milk. In Dairy Processing: Improving Quality; CRC Press: Boca Raton, FL, USA, 2003; pp. 81–103. [Google Scholar] [CrossRef]
- Deeth, H. Optimum Thermal Processing for Extended Shelf-Life (ESL) Milk. Foods 2017, 6, 102. [Google Scholar] [CrossRef] [Green Version]
- Walstra, P.; Wouters, T.M.; Geurts, T.J. Dairy Science and Technology, 1st ed.; CRC Press: Boca Raton, FL, USA, 2005; pp. 641–676. [Google Scholar]
- Gandy, A.; Schilling, M.; Coggins, P.; White, C.; Yoon, Y.; Kamadia, V. The Effect of Pasteurization Temperature on Consumer Acceptability, Sensory Characteristics, Volatile Compound Composition, and Shelf-Life of Fluid Milk. J. Dairy Sci. 2008, 91, 1769–1777. [Google Scholar] [CrossRef] [Green Version]
- Lee, A.; Barbano, D.; Drake, M. The influence of ultra-pasteurization by indirect heating versus direct steam injection on skim and 2% fat milks. J. Dairy Sci. 2017, 100, 1688–1701. [Google Scholar] [CrossRef] [Green Version]
- Perkins, M.L.; Deeth, H.C. A survey of Australian consumers’ attitudes towards UHT milk. Aust. J. Dairy Technol. 2001, 56, 28–34. [Google Scholar]
- Liepa, M.; Zagorska, J.; Galoburda, R.; Straumite, E.; Kruma, Z.; Sabovics, M. Sensory properties of high-pressure-treated milk. FoodBalt 2017, 22, 86–90. [Google Scholar] [CrossRef]
- Tao, Y.; Sun, D.W.; Hogan, E.; Kelly, A.L. High pressure processing of foods. An Overview. In Emerging Technologies for Food Processing; Elsevier Ltd.: Amsterdam, The Netherlands, 2005; pp. 3–32. [Google Scholar]
- Tan, S.F.; Chin, N.L.; Tee, T.P.; Chooi, S.K. Physico-Chemical Changes, Microbiological Properties, and Storage Shelf Life of Cow and Goat Milk from Industrial High-Pressure Processing. Processes 2020, 8, 697. [Google Scholar] [CrossRef]
- Singh, A.K.; Borad, S.; Meena, G.S.; Sharma, H.; Arora, S. High-Pressure Processing of Milk and Milk Products. In Non-thermal Processing of Foods; CRC Press: Boca Raton, FL, USA, 2019; pp. 69–88. [Google Scholar] [CrossRef]
- Muntean, M.-V.; Marian, O.; Barbieru, V.; Cătunescu, G.M.; Ranta, O.; Drocas, I.; Terhes, S. High Pressure Processing in Food Industry—Characteristics and Applications. Agric. Agric. Sci. Procedia 2016, 10, 377–383. [Google Scholar] [CrossRef] [Green Version]
- Stratakos, A.C.; Inguglia, E.S.; Linton, M.; Tollerton, J.; Murphy, L.; Corcionivoschi, N.; Koidis, A.; Tiwari, B.K. Effect of high pressure processing on the safety, shelf life and quality of raw milk. Innov. Food Sci. Emerg. Technol. 2019, 52, 325–333. [Google Scholar] [CrossRef] [Green Version]
- Butz, P.; Tauscher, B. Emerging technologies: Chemical aspects. Food Res. Int. 2002, 35, 279–284. [Google Scholar] [CrossRef]
- Mandal, R.; Kant, R. High-Pressure Processing and Its Applications in the Dairy Industry. Food Sci. Technol. 2017, 1, 33–45. [Google Scholar]
- Wgiorgis, G.A.; Yildiz, F. Review on high-pressure processing of foods. Cogent Food Agric. 2019, 5, 1568725. [Google Scholar] [CrossRef]
- Liepa, M.; Zagorska, J.; Galoburda, R.; Kostascuka, S. Effect of High-Pressure Processing on Microbial Quality of Skimmed Milk. Proc. Latv. Acad. Sci. Sect. B Nat. Exact Appl. Sci. 2018, 72, 118–122. [Google Scholar] [CrossRef] [Green Version]
- Li, Y.; Zheng, Z.; Zhu, S.; Ramaswamy, H.S.; Yu, Y. Effect of Low-Temperature-High-Pressure Treatment on the Reduction of Escherichia coli in Milk. Foods 2020, 9, 1742. [Google Scholar] [CrossRef]
- Ruiz-Capillas, C.; Herrero, A. Sensory Analysis and Consumer Research in New Product Development. Foods 2021, 10, 582. [Google Scholar] [CrossRef]
- Świąder, K.; Marczewska, M. Trends of Using Sensory Evaluation in New Product Development in the Food Industry in Countries That Belong to the EIT Regional Innovation Scheme. Foods 2021, 10, 446. [Google Scholar] [CrossRef]
- Schiano, A.; Harwood, W.; Drake, M. A 100-Year Review: Sensory analysis of milk. J. Dairy Sci. 2017, 100, 9966–9986. [Google Scholar] [CrossRef]
- Xu, Y.; Li, X.; Xie, J. Methods for Statistical Inference of Triangle Taste Tests Data and Their Applications. Open J. Bus. Manag. 2014, 02, 79–84. [Google Scholar] [CrossRef] [Green Version]
- ISO 16820; 2019 Sensory Analysis—Methodology—Sequential Analysis. ISO: Geneva, Switzerland, 2019.
- Meilgaard, M.C.; Carr, B.T.; Civille, G.V. Sensory Evaluation Techniques, 4th ed.; CRC Press: Boca Raton, FL, USA, 2007. [Google Scholar]
- Sipos, L.; Nyitrai, Á.; Hitka, G.; Friedrich, L.F.; Kókai, Z. Sensory Panel Performance Evaluation—Comprehensive Review of Practical Approaches. Appl. Sci. 2021, 11, 11977. [Google Scholar] [CrossRef]
- Lynch, J.; Lock, A.; Dwyer, D.; Noorbakhsh, R.; Barbano, D.; Bauman, D. Flavor and Stability of Pasteurized Milk with Elevated Levels of Conjugated Linoleic Acid and Vaccenic Acid. J. Dairy Sci. 2005, 88, 489–498. [Google Scholar] [CrossRef] [Green Version]
- Hanson, A.; Metzger, L. Evaluation of increased vitamin D fortification in high-temperature, short-time–processed 2% milk, UHT-processed 2% fat chocolate milk, and low-fat strawberry yogurt. J. Dairy Sci. 2010, 93, 801–807. [Google Scholar] [CrossRef] [Green Version]
- Bandla, S.; Choudhary, R.; Watson, D.G.; Haddock, J. Impact of UV-C processing of raw cow milk treated in a continuous flow coiled tube ultraviolet reactor. Agric. Eng. Int. CIGR J. 2012, 14, 86–93. [Google Scholar]
- Bottiroli, R.; Troise, A.D.; Aprea, E.; Fogliano, V.; Vitaglione, P.; Gasperi, F. Chemical and sensory changes during shelf-life of UHT hydrolyzed-lactose milk produced by “in batch” system employing different commercial lactase preparations. Food Res. Int. 2020, 136, 109552. [Google Scholar] [CrossRef]
- Lawless, H.T.; Heymann, H. Acceptance and Preference Testing. In Sensory Evaluation of Food; Springer: Boston, MA, USA, 1999. [Google Scholar] [CrossRef]
- Hein, K.A.; Jaeger, S.R.; Carr, B.T.; Delahunty, C.M. Comparison of five common acceptance and preference methods. Food Qual. Prefer. 2008, 19, 651–661. [Google Scholar] [CrossRef]
- Lim, J. Hedonic scaling: A review of methods and theory. Food Qual. Prefer. 2011, 22, 733–747. [Google Scholar] [CrossRef]
- Villanueva, N.D.; Da Silva, M.A. Comparative performance of the nine-point hedonic, hybrid and self-adjusting scales in the generation of internal preference maps. Food Qual. Prefer. 2009, 20, 1–12. [Google Scholar] [CrossRef]
- Zhi, R.; Zhao, L.; Shi, J. Improving the sensory quality of flavored liquid milk by engaging sensory analysis and consumer preference. J. Dairy Sci. 2016, 99, 5305–5317. [Google Scholar] [CrossRef] [PubMed]
- Rothman, L. The use of just-about-right (JAR) scales in food product development and reformulation. In Consumer-Led Food Product Development; Elsevier Ltd.: Amsterdam, The Netherlands, 2007; pp. 407–433. [Google Scholar]
- Plaehn, D.; Horne, J. A regression-based approach for testing significance of “just-about-right” variable penalties. Food Qual. Prefer. 2008, 19, 21–32. [Google Scholar] [CrossRef]
- Song, J.; Xia, Y.; Zhong, F. Consumers with high frequency of ‘just about right’ in JAR scales may use lower cognitive effort: Evidence from the concurrent 9-point hedonic scale and CATA question. Food Res. Int. 2021, 143, 110285. [Google Scholar] [CrossRef] [PubMed]
- Tribst, A.A.L.; Falcade, L.T.P.; Carvalho, N.S.; Júnior, B.R.D.C.L.; de Oliveira, M.M. Are stirring and homogenisation processes capable of improving physicochemical and sensory characteristics of stirred yoghurt produced with fresh, refrigerated and frozen/thawed sheep milk? Int. Dairy J. 2020, 109, 104778. [Google Scholar] [CrossRef]
- Dong, Y.; Sharma, C.; Mehta, A.; Torrico, D. Application of Augmented Reality in the Sensory Evaluation of Yogurts. Fermentation 2021, 7, 147. [Google Scholar] [CrossRef]
- Garía-Risco, M.; Olano, A.; Ramos, M.; López-Fandiño, R. Micelar Changes Induced by High Pressure. Influence in the Proteolytic Activity and Organoleptic Properties of Milk. J. Dairy Sci. 2000, 83, 2184–2189. [Google Scholar] [CrossRef]
- Andrés, V.; Villanueva, M.-J.; Tenorio, M.-D. Influence of high pressure processing on microbial shelf life, sensory profile, soluble sugars, organic acids, and mineral content of milk- and soy-smoothies. LWT Food Sci. Technol. 2016, 65, 98–105. [Google Scholar] [CrossRef]
- Liu, G.; Carøe, C.; Qin, Z.; Munk, D.M.; Crafack, M.; Petersen, M.A.; Ahrné, L. Comparative study on quality of whole milk processed by high hydrostatic pressure or thermal pasteurization treatment. LWT Food Sci. Technol. 2020, 127, 109370. [Google Scholar] [CrossRef]
- ISO 8586; 2012 Sensory Analysis—General Guidelines for the Selection, Training and Monitoring of Selected Assessors and Expert Sensory Assessors. ISO: Geneva, Switzerland, 2014; Volume 2012.
- ISO 4120; 2004 Sensory Analysis—Methodology—Triangle Test. ISO: Geneva, Switzerland, 2004; Volume 2004. Available online: https://www.iso.org (accessed on 25 January 2022).
- ISO 6685; 2017 Sensory Analysis—Methodology—General Guidance. ISO: Geneva, Switzerland, 2017; Volume 2017.
- Plaehn, D. What’s the real penalty in penalty analysis? Food Qual. Prefer. 2013, 28, 456–469. [Google Scholar] [CrossRef]
- Ortega-Heras, M.; Gómez, I.; De Pablos-Alcalde, S.; González-Sanjosé, M.L. Application of the Just-About-Right Scales in the Development of New Healthy Whole-Wheat Muffins by the Addition of a Product Obtained from White and Red Grape Pomace. Foods 2019, 8, 419. [Google Scholar] [CrossRef] [Green Version]
- Lawless, H.T.; Heymann, H. Sensory Evaluation of Food: Principles and Practices; Springer: New York, NY, USA, 2010; Volume 2. [Google Scholar]
- Christensen, R.H.B. Statistical Methodology for Sensory Discrimination Tests and Its Implementation in sensR. 2020, pp. 1–24. Available online: https://rdrr.io/cran/sensR/f/inst/doc/methodology.pdf (accessed on 27 January 2022).
- Grabowski, N.T.; Ahlfeld, B.; Brix, A.; Hagemann, A.; Von Münchhausen, C.; Klein, G. Similarities and differences among fluid milk products: Traditionally produced, extended shelf life and ultrahigh-temperature processed. Food Sci. Technol. Int. 2013, 19, 235–241. [Google Scholar] [CrossRef]
- Jo, Y.; Benoist, D.; Barbano, D.; Drake, M. Flavor and flavor chemistry differences among milks processed by high-temperature, short-time pasteurization or ultra-pasteurization. J. Dairy Sci. 2018, 101, 3812–3828. [Google Scholar] [CrossRef]
- Van Boekel, M. Effect of heating on Maillard reactions in milk. Food Chem. 1998, 62, 403–414. [Google Scholar] [CrossRef]
- Andersson, R.; Danielsson, G.; Hedlund, C.; Svensson, S. Effect of a Heat-Resistant Microbial Lipase on Flavor of Ultra-High-Temperature Sterilized Milk. J. Dairy Sci. 1981, 64, 375–379. [Google Scholar] [CrossRef]
- Calvo, M.M. Flavour of Heated Milks. A Review. Int. Dairy J. 1992, 2, 69–81. [Google Scholar] [CrossRef]
- Iserliyska, D.; Dzhivoderova, M.; Nikovska, K. Application of Penalty Analysis to Interpret Jar Data—A Case Study on Orange Juices. Curr. Trends Nat. Sci. 2017, 6, 6–12. [Google Scholar]
- Kim, H.; Kim, S.; Choi, M.; Min, S.; Kwak, H. The Effect of High Pressure–Low Temperature Treatment on Physicochemical Properties in Milk. J. Dairy Sci. 2008, 91, 4176–4182. [Google Scholar] [CrossRef]
- Goyal, A.; Sharma, V.; Upadhyay, N.; Sihag, M.; Kaushik, R. High Pressure Processing and Its Impact on Milk Proteins: A Review. J. Dairy Sci. Technol. 2013, 2, 2319–3409. [Google Scholar]
- Kiełczewska, K.; Jankowska, A.; Dąbrowska, A.; Wachowska, M.; Ziajka, J. The effect of high pressure treatment on the dispersion of fat globules and the fatty acid profile of caprine milk. Int. Dairy J. 2019, 102, 104607. [Google Scholar] [CrossRef]
- Serna-Hernandez, S.O.; Escobedo-Avellaneda, Z.; García-García, R.; Rostro-Alanis, M.D.J.; Welti-Chanes, J. High Hydrostatic Pressure Induced Changes in the Physicochemical and Functional Properties of Milk and Dairy Products: A Review. Foods 2021, 10, 1867. [Google Scholar] [CrossRef]
- Orlien, V.; Knudsen, J.C.; Colon, M.; Skibsted, L.H. Dynamics of casein micelles in skim milk during and after high pressure treatment. Food Chem. 2006, 98, 513–521. [Google Scholar] [CrossRef]
- Kirkmeyer, S.V. Understanding Creaminess Perception of Dairy Products Using Free-Choice Profiling and Genetic Responsivity to 6-n-Propylthiouracil. Chem. Senses 2003, 28, 527–536. [Google Scholar] [CrossRef] [Green Version]
- Phillips, L.G.; Mcgiff, M.L.; Barbano, D.M.; Lawless, H.T. The Influence of Fat on the Sensory Properties, Viscosity, and Color of Lowfat Milk. J. Dairy Sci. 1995, 78, 1258–1266. [Google Scholar] [CrossRef]
- Rodríguez-Alcalá, L.; Castro-Gómez, P.; Felipe, X.; Noriega, L.; Fontecha, J. Effect of processing of cow milk by high pressures under conditions up to 900 MPa on the composition of neutral, polar lipids and fatty acids. LWT Food Sci. Technol. 2015, 62, 265–270. [Google Scholar] [CrossRef]
- Raynal-Ljutovac, K.; Park, Y.; Gaucheron, F.; Bouhallab, S. Heat stability and enzymatic modifications of goat and sheep milk. Small Rumin. Res. 2007, 68, 207–220. [Google Scholar] [CrossRef]
- Frøst, M.B.; Dijksterhuis, G.; Martens, M. Sensory perception of fat in milk. Food Qual. Prefer. 2001, 12, 327–336. [Google Scholar] [CrossRef]
- Porubcan, A.R.; Vickers, Z.M. Characterizing milk aftertaste: The effects of salivation rate, PROP taster status, or small changes in acidity, fat, or sucrose on acceptability of milk to milk dislikers. Food Qual. Prefer. 2005, 16, 608–620. [Google Scholar] [CrossRef]

| Composition (Per 100 g or mL) | Milk | ||
|---|---|---|---|
| Raw | HPP | ESL | |
| Fat (g) | 3.57 ± 0.12 a | 3.70 ± 0.15 a | 3.60 ± 0.06 a |
| Protein (g) | 3.10 ± 0.00 a | 3.27 ± 0.03 a | 3.27 ± 0.09 a |
| Total Solids (mL) | 12.07 ± 0.12 a | 12.27 ± 0.22 a | 12.13 ± 0.09 a |
| Non-Fat Milk Solids (g) | 8.40 ± 0.15 a | 8.50 ± 0.15 a | 8.33 ± 0.09 a |
| Calcium (mL) | 119.7 ± 3.2 a | 118.9 ± 0.7 a | 114.7 ± 2.3 a |
| Phosphorus (mL) | 73.6 ± 0.6 a | 73.2 ± 1.0 a | 71.0 ± 0.3 a |
| Sensory Attributes | Rating Description |
|---|---|
| Colour | 1. Too Light 2. Slightly Light 3. Just Right 4. Slightly Dark 5. Too Dark |
| Milkiness | 1. Not Milky Enough 2. Slightly Not Milky 3. Just Right 4. Slightly Milky 5. Too Milky |
| Creaminess | 1. Not Creamy Enough 2. Slightly Not Creamy 3. Just Right 4. Slightly Creamy 5. Too Creamy |
| Mouthfeel | 1. Too Thin 2. Slightly Thin 3. Just Right 4. Slightly Thick 5. Too Thick |
| Aftertaste | 1. Too Weak 2. Slightly Weak 3. Just Right 4. Slightly Strong 5. Too Strong |
| Test | Triangle Test |
|---|---|
| Number of panellists | 38 |
| Probability of correct answers, pc | 0.895 |
| Guessing probability, pg | 0.333 |
| Proportion of discrimination, pd | 0.842 |
| Statistic | 33.0 |
| p-value | <0.0001 |
| alpha | 0.05 |
| Mean | 1.895 |
| Standard Error | 0.176 |
| Median | 2 |
| Mode | 2 |
| Standard Deviation | 1.085 |
| Sample Variance | 1.178 |
| Kurtosis | −0.689 |
| Skewness | −0.049 |
| Range | 4 |
| Sum | 72 |
| Count | 38 |
| Confidence Level (95.0%) | 0.357 |
| Overall Liking and Preference (7-Point Hedonic Scale) | Milk Samples | |
|---|---|---|
| HPP | ESL | |
| B3B Overall Liking (Bottom 3 Box Rating) | 21% | 26% |
| Neutral Overall Liking (Neutral) | 18% | 21% |
| T3B Overall Liking (Top 3 Box Rating) | 61% | 53% |
| Preference | 47% | 53% |
| Average Mean Score | 4.66 a | 4.34 a |
| Milk Type | Variable | Level | Selection a (%) | Sum (Overall Liking) b | Mean (Overall Liking) c | Mean Drops d | Penalty e |
|---|---|---|---|---|---|---|---|
| HPP Milk | Too light | 10.53 | 16.0 | 4.000 | 0.889 | ||
| Colour | JAR | 47.37 | 88.0 | 4.889 | 0.439 | ||
| Too dark | 42.11 | 73.0 | 4.563 | 0.326 | |||
| Not milky | 31.58 | 51.0 | 4.250 | 0.625 | |||
| Milkiness | JAR | 42.11 | 78.0 | 4.875 | 0.375 | ||
| Too milky | 26.32 | 48.0 | 4.800 | 0.075 | |||
| Not creamy | 28.95 | 42.0 | 3.818 | 1.432 | |||
| Creaminess | JAR | 42.11 | 84.0 | 5.250 | 1.023 | ||
| Too creamy | 28.95 | 51.0 | 4.636 | 0.614 | |||
| Too thin | 26.32 | 42.0 | 4.200 | 0.695 | |||
| Mouthfeel | JAR | 50.00 | 93.0 | 4.895 | 0.474 | ||
| Too thick | 23.68 | 42.0 | 4.667 | 0.228 | |||
| Too weak | 28.95 | 43.0 | 3.909 | 1.234 | |||
| Aftertaste | JAR | 55.26 | 108.0 | 5.143 | 1.084 | ||
| Too strong | 15.79 | 26.0 | 4.333 | 0.810 | |||
| ESL Milk | Too light | 34.21 | 43.0 | 3.308 | 1.549 | ||
| Colour | JAR | 55.26 | 102.0 | 4.857 | 1.151 | ||
| Too dark | 10.53 | 20.0 | 5.000 | −0.143 | |||
| Not milky | 23.68 | 19.0 | 2.111 | 3.065 | |||
| Milkiness | JAR | 44.74 | 88.0 | 5.176 | 1.510 | ||
| Too milky | 31.58 | 58.0 | 4.833 | 0.343 | |||
| Not creamy | 26.32 | 28.0 | 2.800 | 2.024 | |||
| Creaminess | JAR | 44.74 | 82.0 | 4.824 | 0.871 | ||
| Too creamy | 28.95 | 55.0 | 5.000 | −0.176 | |||
| Too thin | 31.58 | 33.0 | 2.750 | 2.074 | |||
| Mouthfeel | JAR | 44.74 | 82.0 | 4.824 | 0.871 | ||
| Too thick | 23.68 | 50.0 | 5.556 | −0.732 | |||
| Too weak | 21.05 | 23.0 | 2.875 | 2.356 | |||
| Aftertaste | JAR | 34.21 | 68.0 | 5.231 | 1.351 | ||
| Too strong | 44.74 | 74.0 | 4.353 | 0.878 |
Publisher’s Note: MDPI stays neutral with regard to jurisdictional claims in published maps and institutional affiliations. |
© 2022 by the authors. Licensee MDPI, Basel, Switzerland. This article is an open access article distributed under the terms and conditions of the Creative Commons Attribution (CC BY) license (https://creativecommons.org/licenses/by/4.0/).
Share and Cite
Lim, S.H.; Chin, N.L.; Sulaiman, A.; Tay, C.H.; Wong, T.H. Sensory Analysis for Cow Milk Product Development Using High Pressure Processing (HPP) in the Dairy Industry. Foods 2022, 11, 1233. https://doi.org/10.3390/foods11091233
Lim SH, Chin NL, Sulaiman A, Tay CH, Wong TH. Sensory Analysis for Cow Milk Product Development Using High Pressure Processing (HPP) in the Dairy Industry. Foods. 2022; 11(9):1233. https://doi.org/10.3390/foods11091233
Chicago/Turabian StyleLim, Shu Huey, Nyuk Ling Chin, Alifdalino Sulaiman, Cheow Hwang Tay, and Tak Hiong Wong. 2022. "Sensory Analysis for Cow Milk Product Development Using High Pressure Processing (HPP) in the Dairy Industry" Foods 11, no. 9: 1233. https://doi.org/10.3390/foods11091233