Abstract
Coffee is rich in phenolic acids, such as caffeic acid and chlorogenic acid (CGA). Polyphenol-rich diets were shown to reduce the risk of metabolic syndrome (MeTS). Background and Objectives: This systematic review and meta-analysis discusses the effects of coffee consumption and its dose-response on MeTS parameters. Materials and Methods: PubMed and Scopus® were searched for relevant articles published between 2015 and 2020. This review focused on randomised controlled trials (RCTs) investigating the effect of coffee consumption on anthropometric measurements, glycaemic indices, lipid profiles, and blood pressure. Data from relevant studies were extracted and analysed using random, fixed, or pooled effects models with 95% confidence intervals (CIs). Results: Green coffee extract (GCE) supplementation (180 to 376 mg) was found to reduce waist circumference (weighted mean difference (WMD) = −0.39; 95% CI: −0.68, −0.10), triglyceride levels (WMD = −0.27; 95% CI: −0.43, −0.10), high−density lipoprotein−cholesterol levels (WMD = 0.62; 95% CI: 0.34, 0.90), systolic blood pressure (WMD = −0.44; 95% CI: −0.57, −0.32), and diastolic blood pressure (WMD = −0.83; 95% CI: −1.40, −0.26). Decaffeinated coffee (510.6 mg) reduced fasting blood glucose levels (WMD = −0.81; 95% CI: −1.65, 0.03). The meta-analysis showed that the intake of GCE containing 180 to 376 mg of CGA (administered in a capsule) and liquid decaffeinated coffee containing 510.6 mg of CGA improved the MeTS outcomes in study participants. Conclusions: The findings of the review suggested that the effect of coffee on MeTS parameters varies depending on the types and doses of coffee administered. A more detailed RCT on specific coffee doses (with adjustment for energy and polyphenol intake) and physical activity is needed to further confirm the observed outcomes.
1. Introduction
Metabolic syndrome (MeTS) is a cluster of complex metabolic disorders [1] characterised by the presence of any three of the following five medical conditions: abdominal obesity, high serum triglyceride (TG) levels, low high-density lipoprotein cholesterol (HDL-c) levels, elevated blood pressure, and elevated fasting blood glucose (FBG) levels [2]. The global prevalence of MeTS is approximately 3.3% (range, 0%–19.2%), with a prevalence of 11.9% (range, 2.8%–29.3%) in children with obesity and 29.2% (range, 10%–66%) in adults with obesity [3]. According to estimates, 12%–37% and 12%–26% of the population in Asia and Europe, respectively, are affected by MeTS [4]. Genetic and lifestyle-related factors, such as alcohol intake, smoking, sedentary habits, and poor dietary habits, such as intake of sugar-sweetened beverages, were identified as risk factors in MeTS development. Dietary interventions have helped control and improve MeTS parameters and, hence, are considered to be the most effective preventive strategy for MeTS [5].
Coffee (Coffea spp., Coffea arabica, Coffea robusta, and Coffea liberica) is one of the most popular beverages worldwide, with an estimated consumption of 500 billion cups per year [5]. Bioactive compounds in coffee, such as chlorogenic acid (CGA), caffeine, niacin, and magnesium, may play a role in reducing the risk of type 2 diabetes mellitus (T2DM) and liver disease [6]. A previous study suggested that CGA may improve the antioxidant status and reduce low-density lipoprotein cholesterol oxidation, whereas caffeine may slow the inflammation process, thereby providing protection against free radical formation and preventing endothelial damage [7]. Meanwhile, a study showed inconsistent results on the association between coffee consumption and the risk of MeTS. The study suggested that CGA may increase the total plasma homocysteine content, whereas caffeine may increase blood pressure by stimulating the sympathetic nervous system [8].
However, even though coffee consumption and chronic diseases (e.g., T2DM and cardiovascular diseases) were investigated in several studies, the association between the intake of either caffeinated or decaffeinated coffee and MeTS remains inconclusive. Previous studies showed that ground and instant caffeinated coffees significantly increased energy expenditure (3 to 12 h post ingestion) compared with decaffeinated coffee or placebo [9,10]. Early studies showed that caffeine, ground caffeinated coffee, and instant caffeinated coffee increased lipolysis compared with decaffeinated coffee [11,12,13,14]. Another study showed that acute caffeine ingestion increased glucose tolerance, while regular decaffeinated coffee decreased glucose tolerance compared with placebo (dextrose) [15]. However, there is limited evidence to suggest a link between caffeinated and decaffeinated coffee intake and disease outcomes in patients with MeTS in an experimental study design. This systematic review investigated the dose-dependent effects of caffeinated and decaffeinated coffee consumption on MeTS outcomes. The review will provide new empirical evidence on the effect of regular caffeinated and decaffeinated coffee consumption on metabolic syndrome parameters.
2. Materials and Methods
2.1. Eligibility Criteria
Free-living men and women (aged from 18 to 70 years) with MeTS, who did not take any medications, vitamins, and/or supplements during the study period, were selected. Participants with dietary restrictions or conditions other than MeTS and women who were pregnant or lactating were excluded.
The data from randomised controlled trials (RCTs) that investigated the effects of coffee consumption were reviewed. RCTs were chosen as they are considered to form the foundation of clinical research on interventions. The outcomes measured were waist circumference, FBG levels, TG levels, HDL-c levels, systolic blood pressure (SBP), and diastolic blood pressure (DBP). Only studies published between 2015 and 2020 and full-text articles published in English were included in this review. Studies that were published in languages other than English were excluded to avoid potential bias resulting from the poor translation of information. Animal and in vitro studies were also excluded.
2.2. Search Strategy
This review was performed in accordance to the PRISMA (Preferred Reporting Items for Systematic Reviews and Meta-Analyses) guidelines. PubMed (U.S. National Library of Medicine and National Institutes of Health) and Scopus® (Elsevier B.V., Amsterdam, The Netherlands) were used for this systematic review. Boolean operators were included in the keyword searches of the two electronic databases. The main keywords used were “MeTS terminology” (keyword 1), “MeTS outcome” (keyword 2), and “type of coffees” (keyword 3). The search strategy was based on two clusters: cluster 1—keyword 1 AND keyword 3; and cluster 2—keyword 2 AND keyword 3. The key search terms for MeTS terminology (keyword 1) were “metabolic syndrome”, “metabolic syndrome X”, “insulin resistance syndrome X”, “metabolic X syndrome”, “dysmetabolic syndrome X”, and “metabolic cardiovascular syndrome”. The key search terms for MeTS outcomes (keyword 2) were “abdominal obesity OR visceral obesity OR central obesity OR abdominal fat”, “blood lipid profiles OR triglycerides OR triacylglycerols OR HDL-c”, “high cholesterol OR hypercholesterolemia OR hypercholesterolaemia OR elevated cholesterol OR dyslipidemia OR dyslipidemia OR dyslipoproteinemia OR dyslipoproteinaemia OR hyperlipidemia OR hyperlipidaemia”, “hypertension OR high blood pressure OR systolic and diastolic pressure OR hypertensive”, and “hyperglycemia OR hyperglycaemia OR glucose intolerance OR impaired glucose intolerance OR fasting blood glucose”. The key search terms for the types of coffees (keyword 3) were “Arabica coffee OR Coffea arabica”, “Robusta coffee OR Coffea robusta”, “caffeinated coffee”, “decaffeinated coffee”, “filtered coffee”, “unfiltered coffee”, “espresso”, “americano”, “cappuccino”, “latte”, “macchiato”, and “mocha”.
2.3. Data Management and Analysis
All articles were uploaded in the Mendeley referencing software, and duplicate articles were removed using the “remove duplicate” function. Two reviewers independently screened the titles and abstracts based on the abovementioned predefined criteria. Full-text articles were reviewed for eligibility, irrelevant publications were excluded, and only the studies that met the inclusion criteria were included in the qualitative and quantitative analyses.
2.4. Evaluation of Studies and Data Synthesis
The mean intergroup differences and percentage reduction, which compared the values in the intervention group to baseline, were calculated for waist circumference, FBG levels, TG levels, HDL-c levels, SBP, and DBP. To calculate percentage reduction and increment, the following formula was applied: percentage reduction or increment = [final reading − baseline/baseline] × 100.
For the meta-analysis, an online calculator was used to calculate the effect size (Cohen’s d) based on the mean differences and standard deviation (SD) for each MeTS outcome between the intervention and control groups [16]. The effect size between groups was considered small (0.2), medium (0.5), or large (0.8). The standard error of the mean (SE) for each outcome measure was calculated using the following formula: SE = es/√ (es×n), where “es” represents the effect size. Studies for which the effect size or SD was not stated or could not be calculated were excluded from the meta-analysis. Cochran’s Q and I2 were calculated automatically using Excel worksheets [17] after inserting the effect size and SE of the mean. Cochran’s Q was used to confirm heterogeneity among data, whereas the I2 statistic was used to measure the heterogeneity level. A negative I2 value was considered equivalent to zero (indicating that the data were homogenous), whereas I2 values of 25%, 50%, and 75% were considered to correspond to low, medium, and high heterogeneity levels, respectively [18]. The fixed effects model was selected for low I2 values (<50%), whereas the random effects model was selected for high I2 values (>50%). The mean effect size data were statistically pooled in the meta-analysis and presented in a forest plot.
The risk of bias in each study was assessed using the Jadad scale. The scale was used to assess the studies on the basis of randomisation, double blinding, drop-out, and withdrawals [19]. The highest possible score obtained with this scale is five, which indicates a low potential for reporting bias.
3. Results
3.1. Study Selection
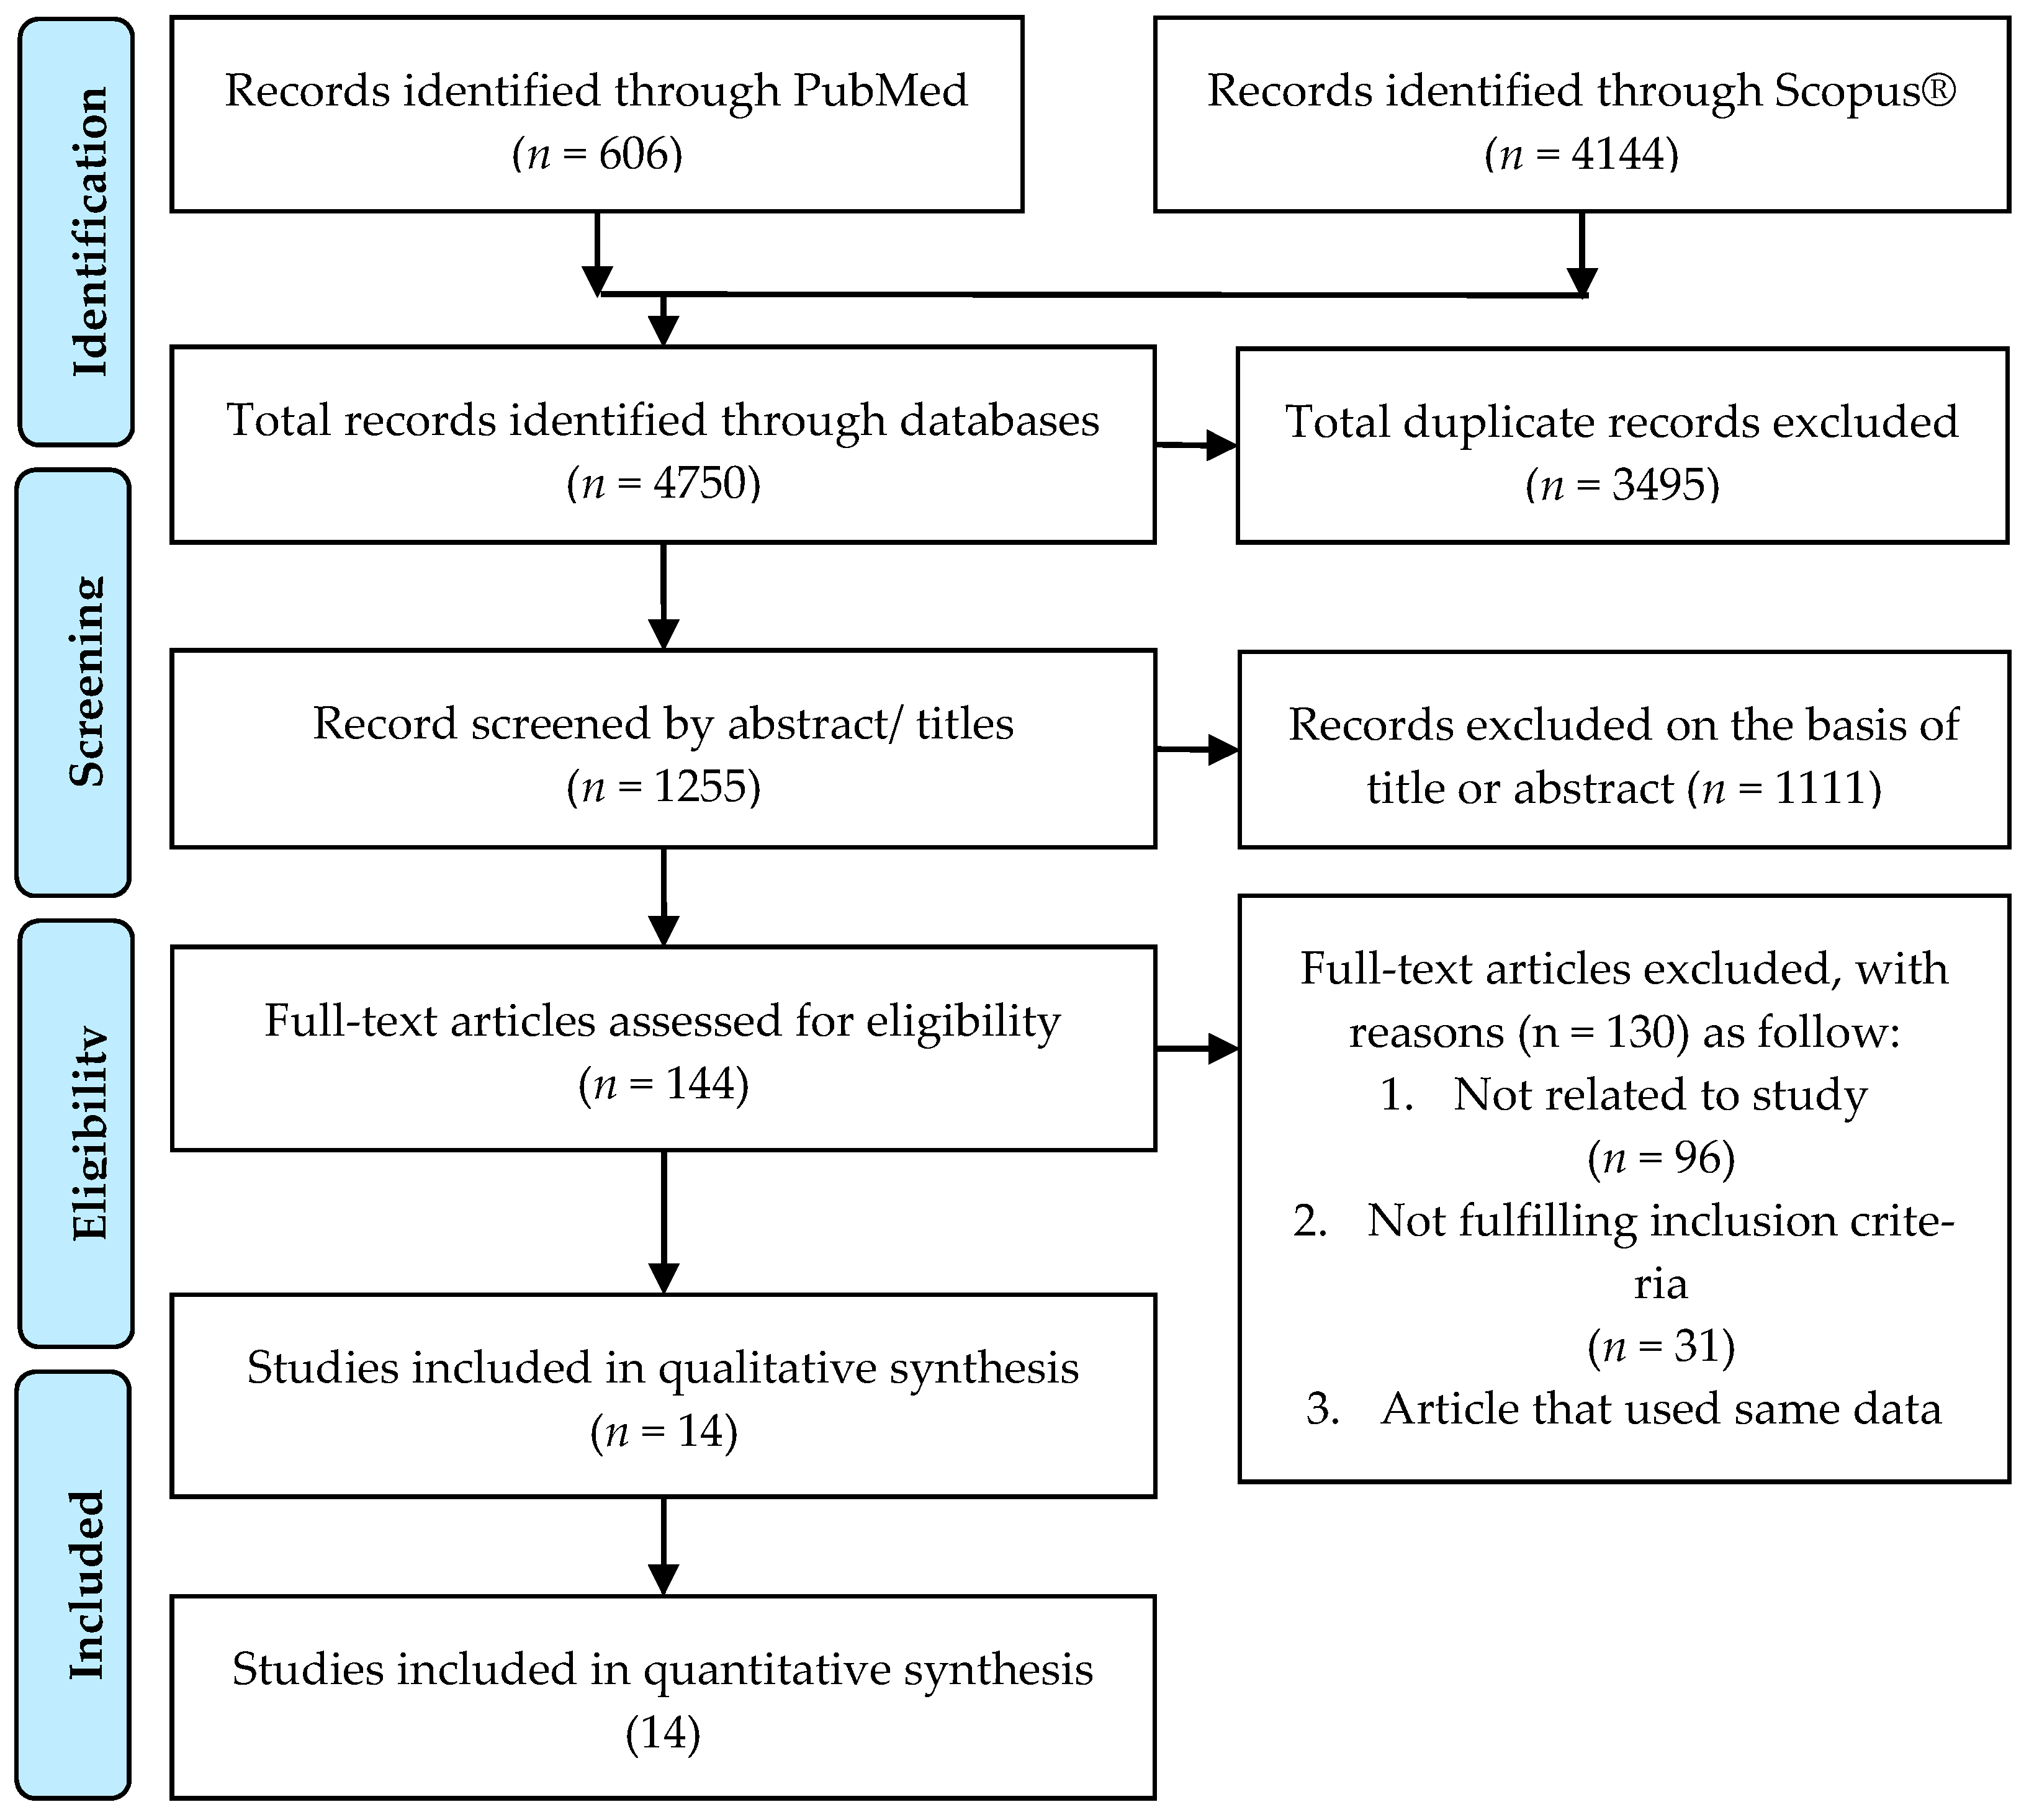
Figure 1 shows the study selection process based on the PRISMA search strategy. A total of 4750 studies were identified through PubMed (n = 606) and Scopus® (n = 4144).
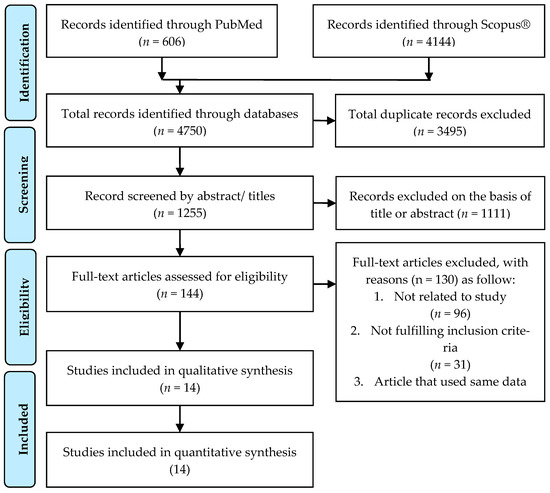
Figure 1.
PRISMA flowchart and search strategy.
3.2. Study Characteristics
Table 1 shows the procedure of the selection of 19 RCTs (14 articles) published between 2015 and 2020 [20,21,22,23,24,25,26,27,28,29,30,31,32,33]. The number of participants in each trial (sample size, n) ranged from 10 to 142, with a total study population of 821. Five studies were conducted on apparently healthy and/or overweight individuals with obesity; other studies were conducted on individuals who were overweight or had obesity, dyslipidaemia, hypertension, or insulin resistance. Three types of coffees were used in the RCTs: caffeinated, decaffeinated, and green coffee extract (GCE) (considered as a type of decaffeinated coffee) (Table 2). Caffeinated coffee contains 5 mg of caffeine per kg body weight to 69.12 mg of caffeine per person per day (CGA content of 45.4 mg) in powdered form and 80 mg of caffeine in a volume of 250 mL. Decaffeinated coffee, with a volume of 180–400 mL, contains 369 to 780 mg of CGA per day. Green coffee extract (GCE), in a range from 10 to 1000 mg, contains 180 to 500 mg of CGA (either in capsule or tablet form).

Table 1.
Summary of randomised controlled controlled trials (RCTs) included in systematic review (n = 16).
Table 2.
Summary findings on coffee types and doses used in RCTs.
3.3. Risk of Biased Based on Jadad Scale
Table 3 shows the risks of bias based on randomisation, double blinding, and drop-outs in the RCTs [19]. Most studies showed a low risk of bias, with a score of 3 or greater. Two studies scored less than 2.5, indicating a high risk of bias.
Table 3.
Jadad scores of RCTs (n = 14).
3.4. Summary of Systematic Review and Meta-Analysis
The outcomes evaluated in this review were waist circumference, FBG levels, TG levels, HDL-c levels, SBP, and DBP. Fourteen RCTs with 821 participants were included in the meta-analysis. Three studies investigated two interventions each (with different doses of coffee) and were considered separately in the analyses [23,29,33]. Sarria et al. investigated two groups (normocholesterolaemia and hypercholesterolaemia), and the data from the two groups were treated as findings from two different studies [22].
3.4.1. Effect of Coffee on Waist Circumference
Eight studies investigated the effect of caffeinated coffee (n = 1), decaffeinated coffee (n = 3), and GCE (n = 4) on waist circumference (Table 1). GCE intake significantly reduced waist circumference by 1.3% to 3.0%, whereas caffeinated and decaffeinated coffee reduced the waist circumference by 0.3% and 0.4% to 1.6%, respectively. However, as shown by Sarria et al., decaffeinated coffee increased the mean waist circumference by 0.7% in normocholesterolaemic participants [22].
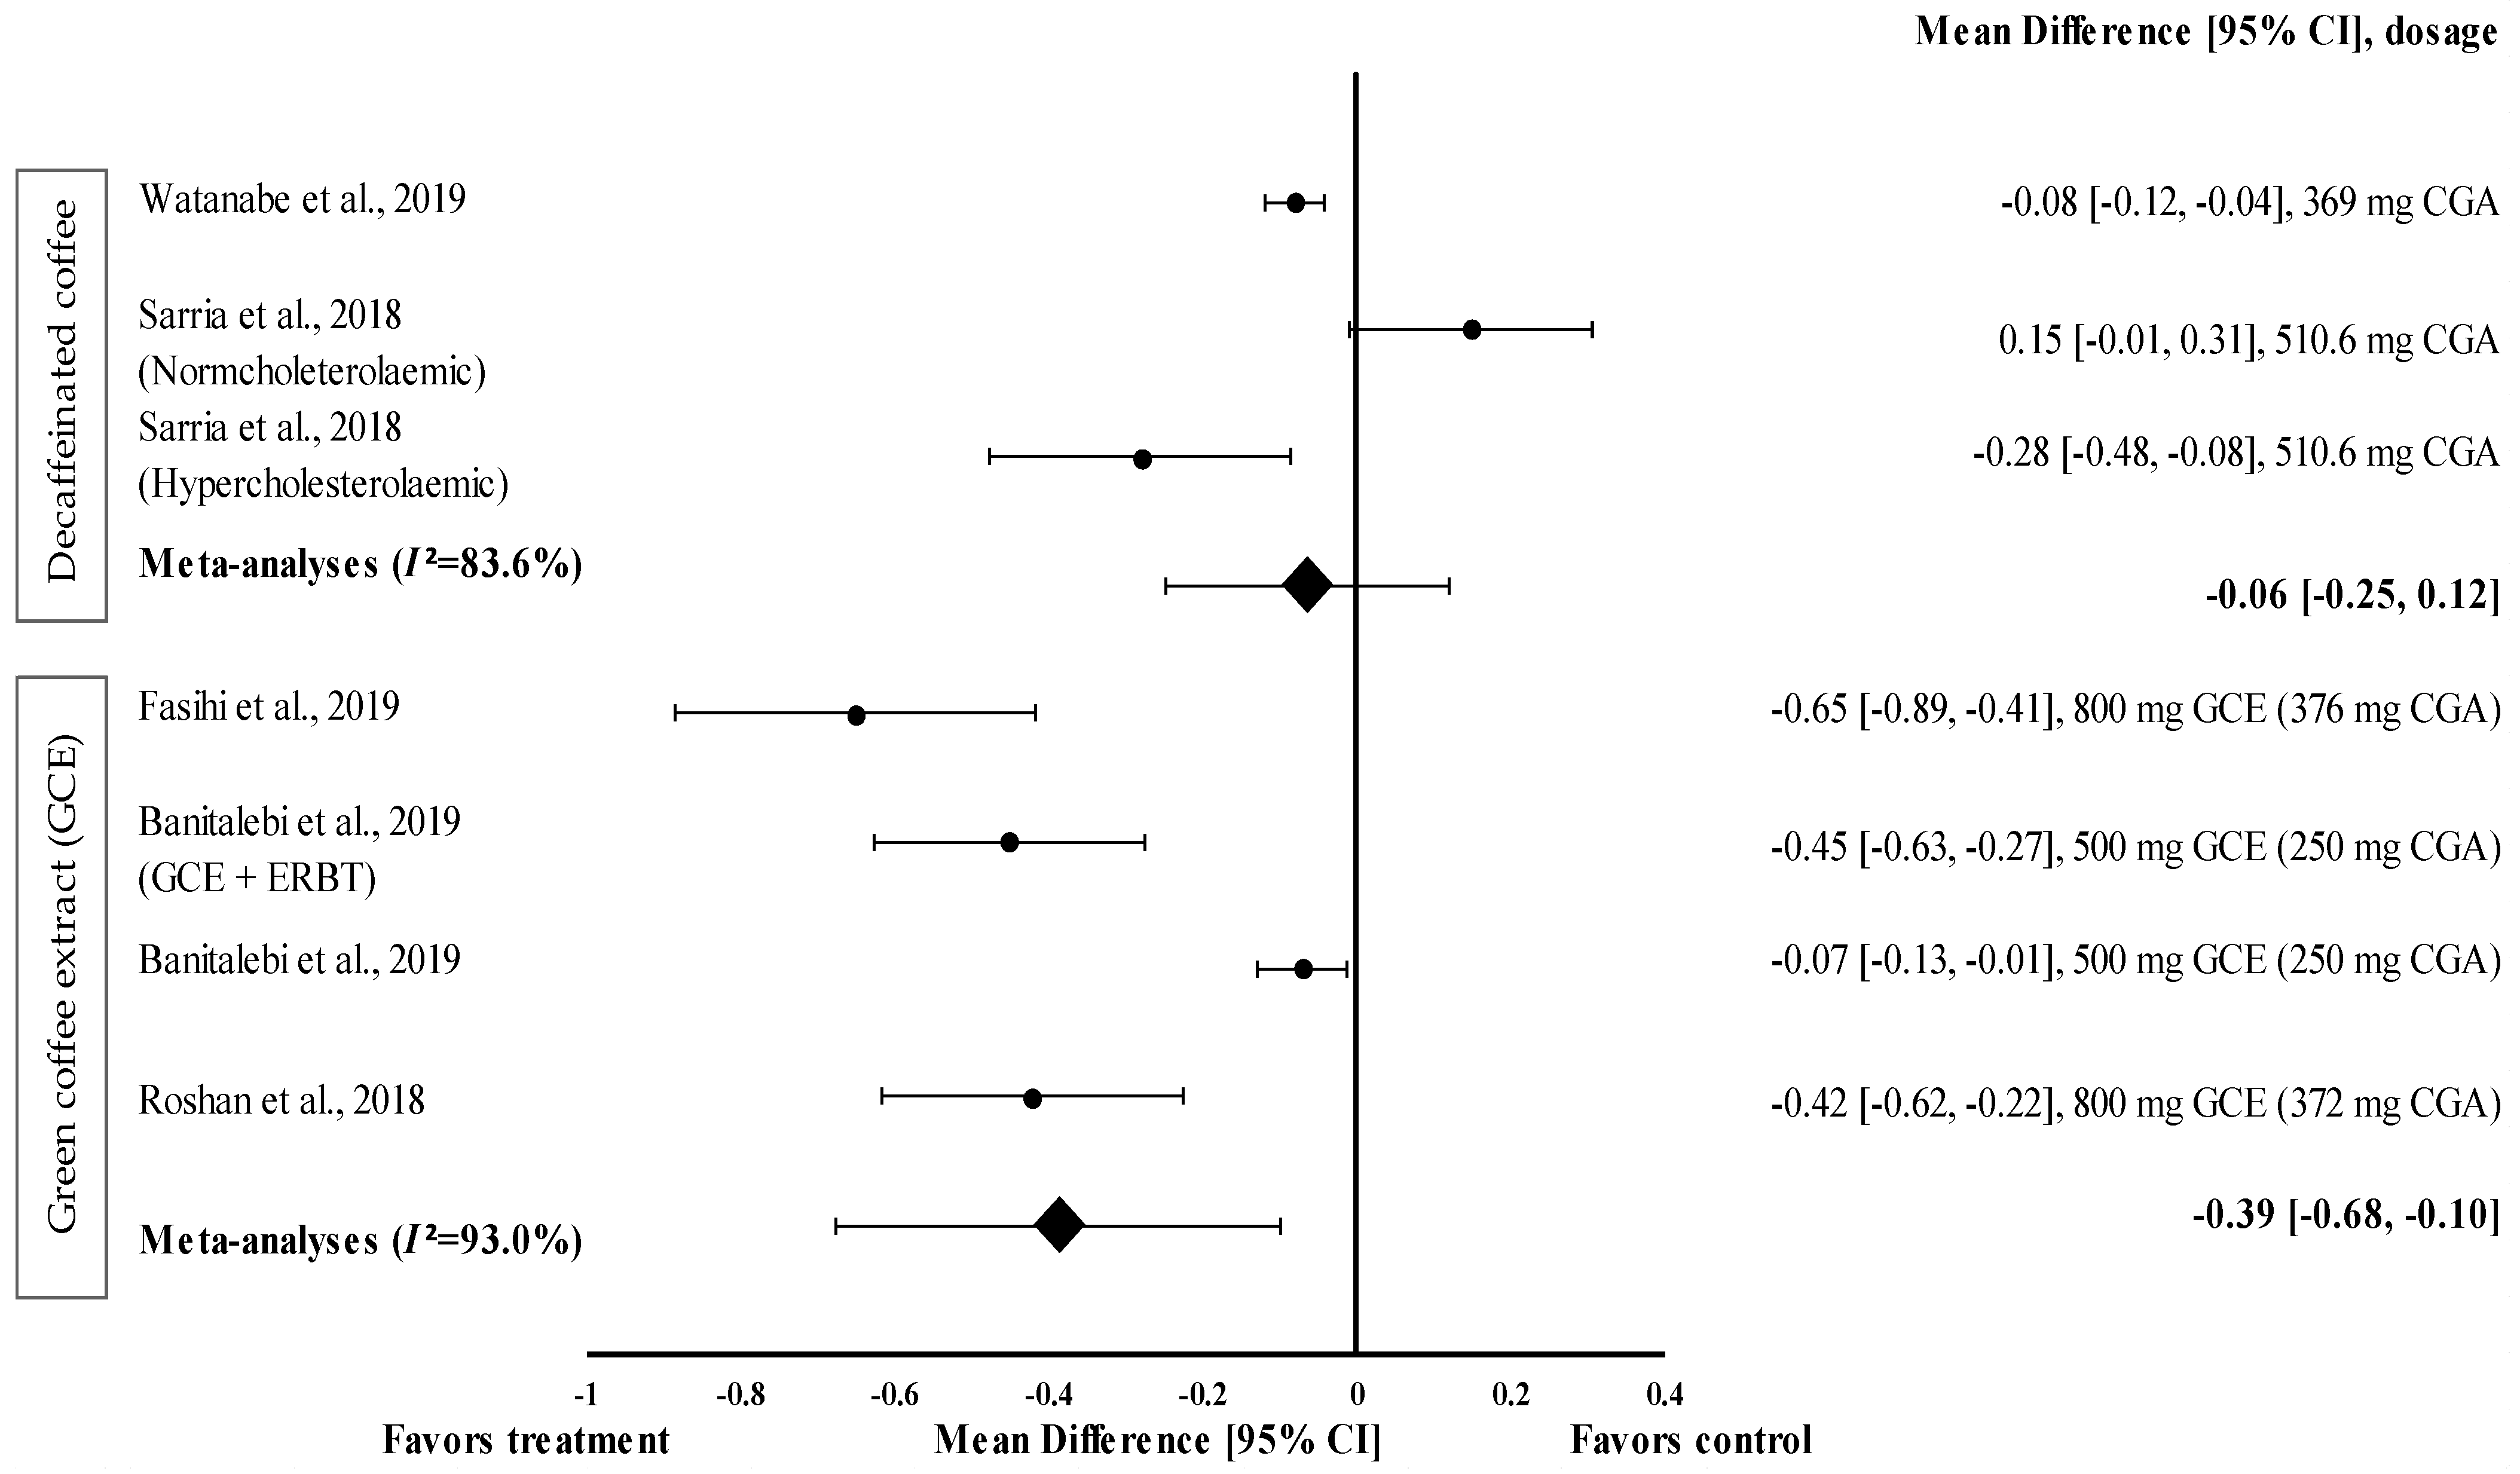
Two studies with three trials were included in the meta-analysis investigating the effect of decaffeinated coffee intake on waist circumference. The data from these studies showed a high level of heterogeneity (I2 = 83.6%) and, hence, were analysed using random effects analysis. Decaffeinated coffee showed a small effect size on mean waist circumference reduction, with d ranging from −0.08 to −0.28 (Figure 2). Two out of three decaffeinated coffee interventions led to body weight reduction (treatment group favoured). Decaffeinated coffee containing 510.6 mg of CGA showed the greatest effect size in hypercholesterolaemic participants (d = −0.28, 95% CI: −0.48, −0.08), followed by that containing 369 mg of CGA (d = −0.08, 95% CI: −0.12, −0.04). However, Sarria et al. showed that the mean waist circumference increased (d = 0.15, 95% CI: −0.01, 0.31) after decaffeinated coffee intake (favoured control group) [22]. The pooled effect size from the meta-analysis was d = −0.06 (95% CI: −0.25, 0.12) (Figure 2).
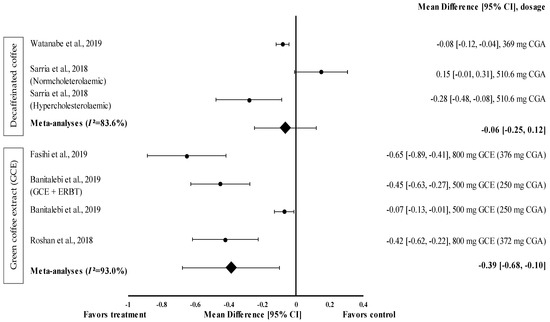
Figure 2.
Forest plot showing the effect of decaffeinated coffee and GCE on waist circumference, expressed as mean differences between the values obtained from the intervention and control groups. A negative effect size indicates that decaffeinated coffee and GCE supplements reduce waist circumference. Meanwhile, a positive effect size indicates that decaffeinated coffee increases waist circumference. Horizontal lines represent 95% CIs. Diamonds represent the pooled effect size from the random effect analysis. CGA: chlorogenic acid, CI: confidence interval, ERBT: elastic resistance band training, GCE: green coffee extract. The values ± 0.2, ± 0.5 and ± 0.8 represent small, medium, and large effect sizes [22,26,29,30,31].
GCE supplementation tended to reduce waist circumference with a small (d = −0.07) to moderate effect size (d = −0.65) (Figure 2) and reduced the waist circumference of participants in all interventions (treatment group favoured). GCE containing 376 mg of CGA (d = −0.65, 95% CI −0.89, −0.41) showed the greatest effect size, followed by that containing 250 mg of CGA (administered along with elastic resistance band training (ERBT)) (d = −0.45, 95% CI: −0.63, −0.27), 372 mg of CGA (d = −0.42, 95% CI: −0.62, −0.22), and 250 mg of CGA (d = −0.07, 95% CI: −0.13, −0.01). The data from the studies showed a high level of heterogeneity (I2 = 93%) and, hence, were analysed using random effects analysis. The meta−analysed pooled effect size of GCE supplementation was d = −0.39 (95% CI: −0.68, −0.10) (Figure 2).
3.4.2. Effect of Coffee on FBG Levels
Twelve interventions investigated the effect of caffeinated coffee (n = 2), decaffeinated coffee (n = 3), and GCE (n = 7) on FBG levels. GCE induced the highest percentage FBG reduction (1.1% to 14.8%), followed by decaffeinated coffee (0.8% to 4.9%). In contrast, Beam et al. showed that GCE supplementation increased the FBG levels by 8.3% compared with baseline, although not significantly [28] (Table 1).
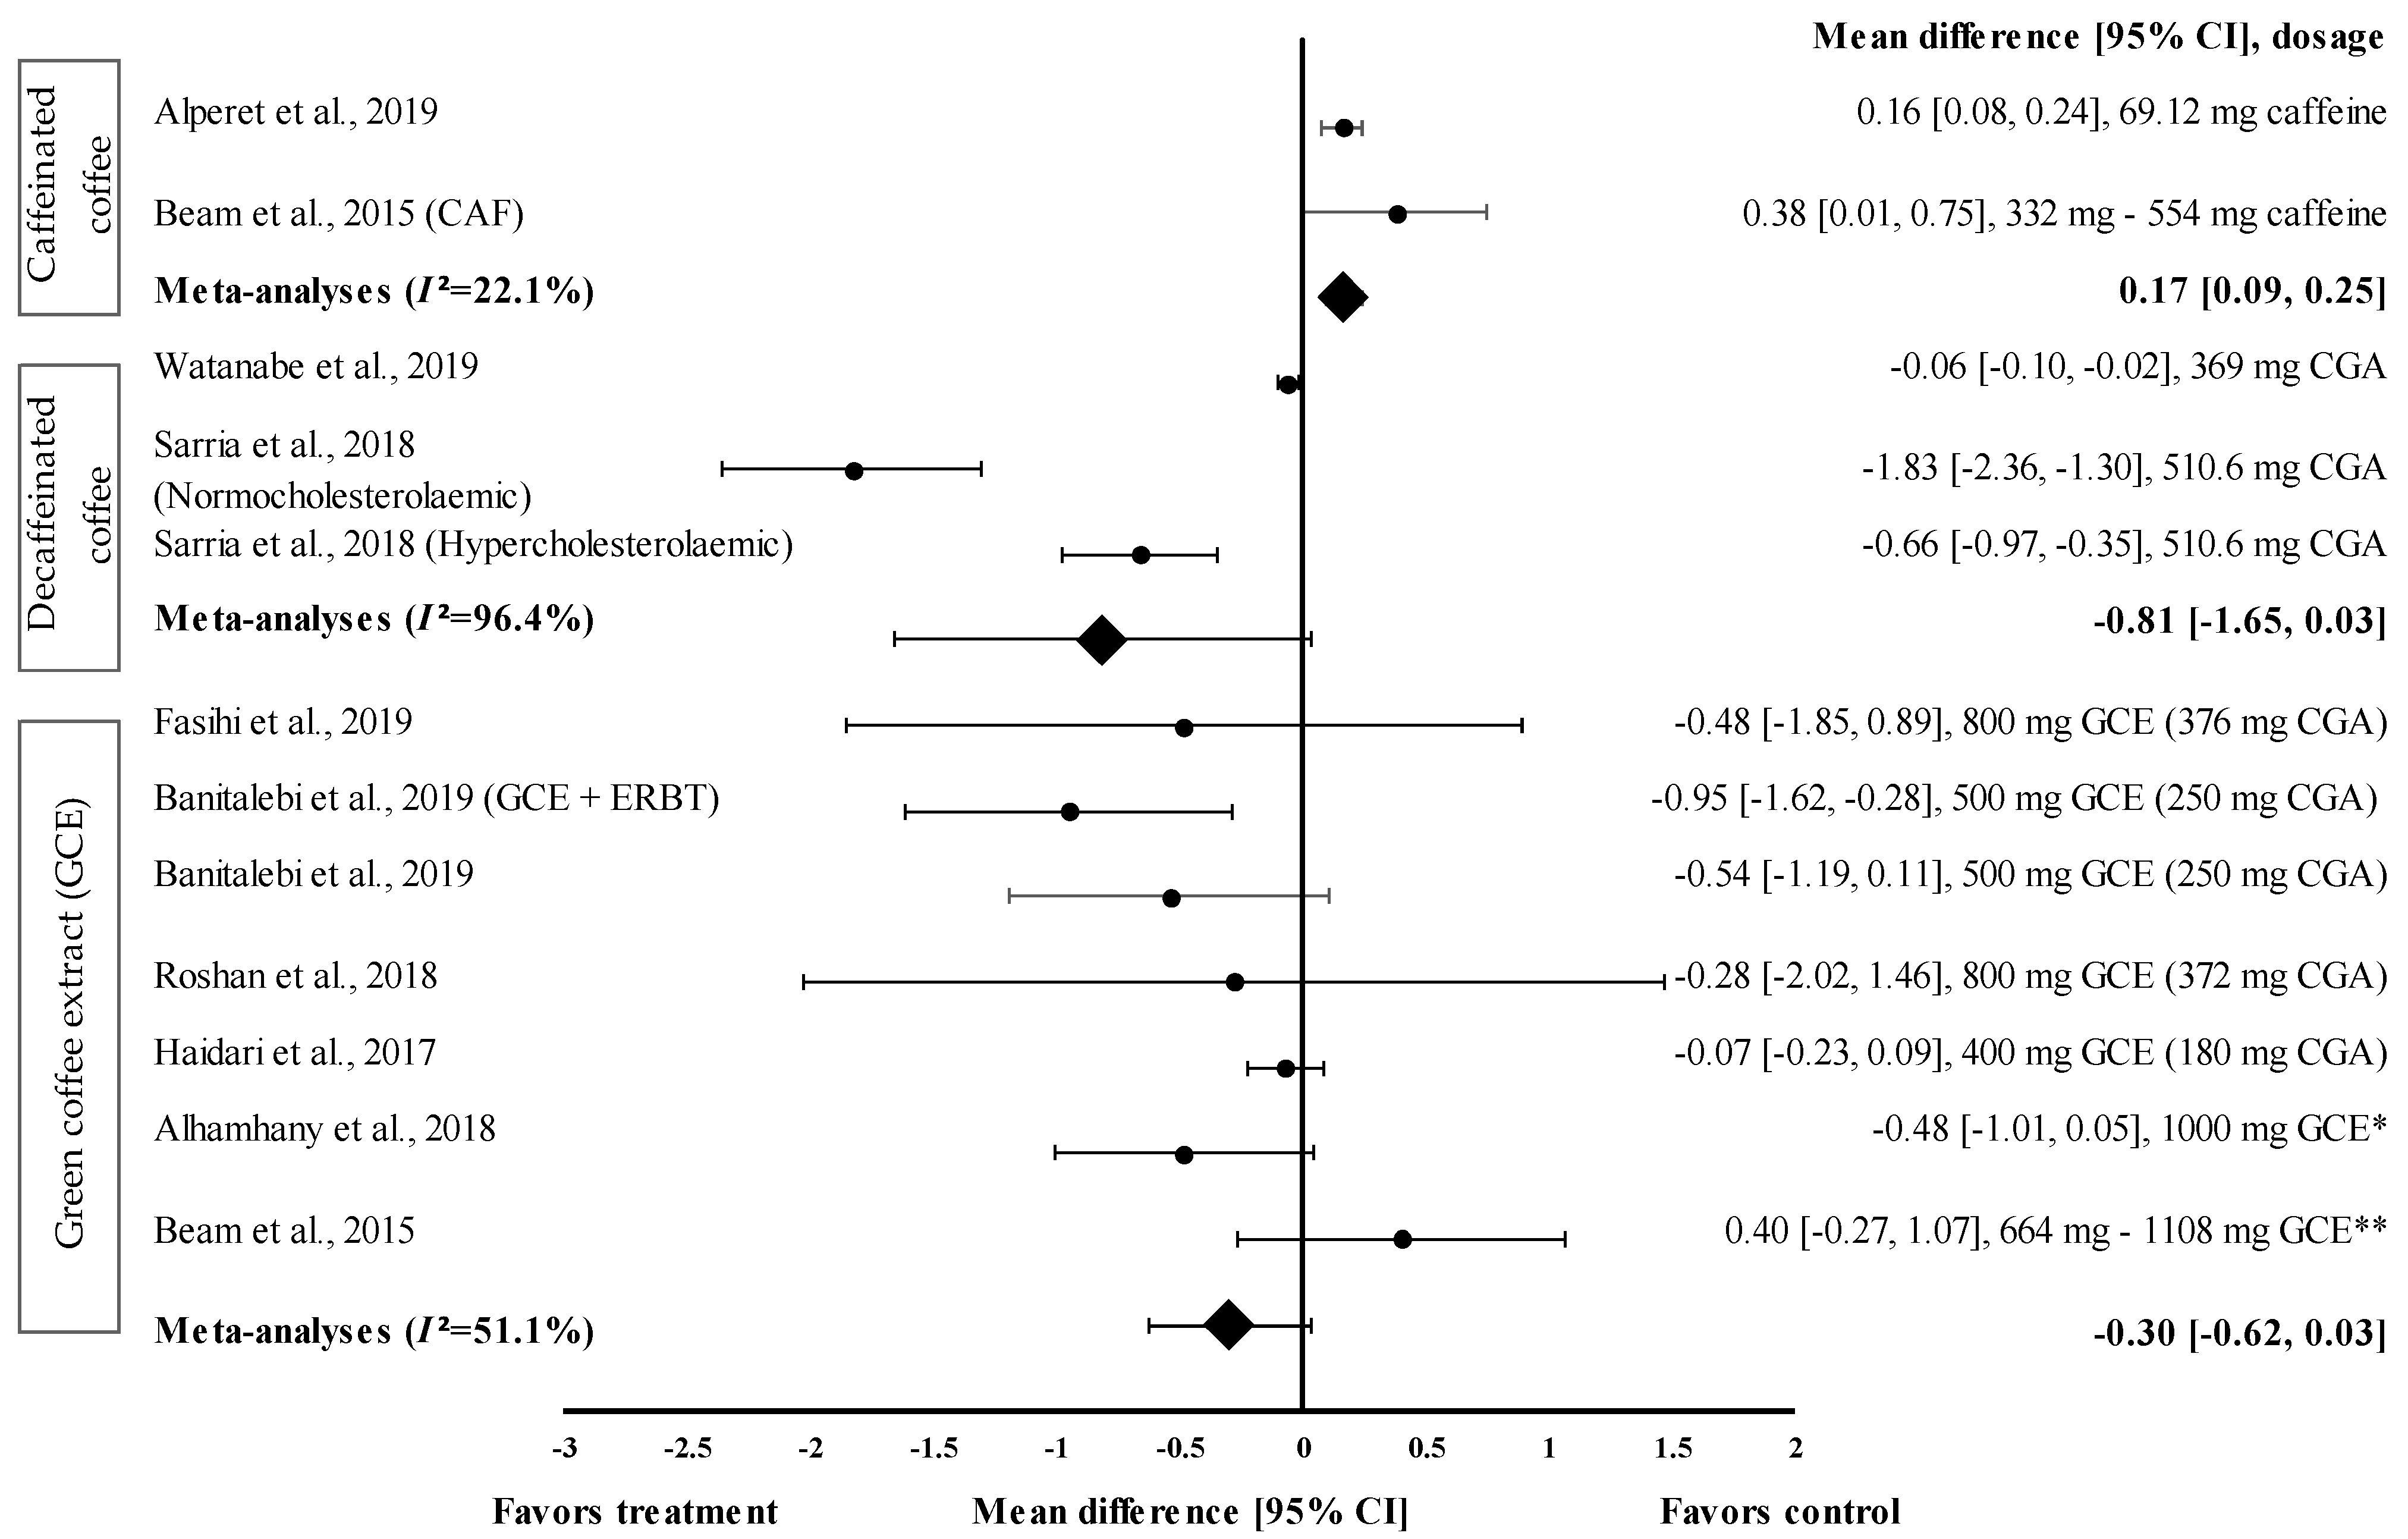
Nine studies with 12 trials investigating the effects of caffeinated and decaffeinated coffee on FBG levels were included in the meta-analysis. Caffeinated and decaffeinated coffee showed a small effect size by increasing the mean FBG levels, with d = 0.16 and 0.38, respectively (Figure 3). Caffeinated coffee intake (n = 2) increased the FBG levels (control group favoured). The greatest effect size was observed at a caffeine intake of 5 mg/kg body weight (approximately 332 to 554 mg) (d = 0.38, 95% CI: 0.01, 0.75), followed by 69.12 mg of caffeine intake (d = 0.16, 95% CI: 0.08, 0.24). The data showed low levels of heterogeneity (I2 = 22.1%) and, hence, were subjected to fixed effects analysis. The meta-analysed pooled effect size of caffeinated coffee was d = 0.17 (95% CI: 0.09, 0.25) (Figure 3).
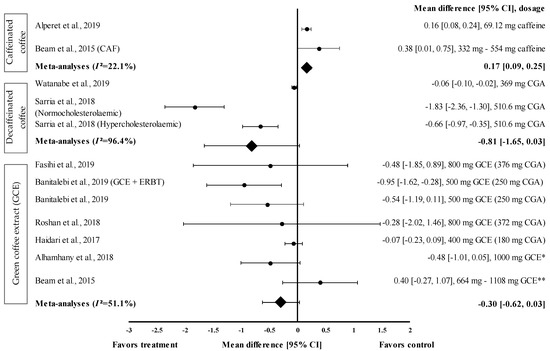
Figure 3.
Forest plot showing the effect of caffeinated coffee, decaffeinated coffee, and GCE on FBG levels, expressed as mean differences between the values obtained from the intervention and control groups. A negative effect size indicates that decaffeinated coffee and GCE supplements reduce FBG levels. Meanwhile, a positive effect size indicates that caffeinated coffee and GCE supplements increase FBG levels. Horizontal lines represent 95% CIs. Diamonds represent the pooled effect size from random effects analysis. CAF: caffeine, CGA: chlorogenic acid, CI: confidence interval, ERBT: elastic resistance band training, FBG: fasting blood glucose, GCE: green coffee extract. The values ± 0.2, ± 0.5 and ± 0.8 represent small, medium, and large effect sizes. * CGA dose not specified, ** CGA content: 332–554 mg [20,21,22,25,26,28,29,30,31].
Figure 3 shows the effect size of decaffeinated coffee intake on the reduction of FBG levels; small to very large effect sizes were observed (d = −0.06 and d = −1.83). All studies showed that the treatment group was favoured (reduced FBG levels). After the intake of decaffeinated coffee (containing 510.6 mg of CGA), normocholesterolaemic participants showed a considerably larger effect size than hypercholesterolaemic participants, with d equal to −1.83 (95% CI: −2.36, −1.30) and −0.66 (95% CI: −0.97, −0.35), respectively. A lower dose of decaffeinated coffee containing 369 mg of CGA in overweight participants led to a smaller effect size, with d = −0.06 (95% CI: −0.10, −0.02). The data showed a high level of heterogeneity, with I2 = 96.4%, and, hence, were subjected to random effects analysis. The meta-analysed pooled effect size of decaffeinated coffee was d = −0.81 (95% CI: −1.65, 0.03) (Figure 3).
Six studies with seven trials were included in the meta-analysis to investigate the effect of GCE supplementation on FBG levels. Figure 3 shows the effect size on mean FBG level reduction with small to large effect sizes (d = −0.07 and −0.95). Six out of seven interventions with GCE reduced the FBG levels compared with the baseline. GCE containing 250 mg of CGA combined with ERBT showed the greatest effect size (d = −0.95, 95% CI: −1.62, −0.28), followed by GCE containing 250 mg of CGA (GCE intake only), GCE containing 376 mg of CGA, 1000 mg of GCE (CGA dose unspecified), GCE containing 372 mg of CGA, and GCE containing 180 mg of CGA (d = −0.54, 95% CI: −1.19, 0.11; d = −0.48, 95% CI: −1.85, 0.89; d = −0.48, 95% CI: −1.01, 0.05; d = −0.28, 95% CI: −2.02, 1.46; and d = −0.07, 95% CI: −0.23, 0.09, respectively). One trial reported a null effect on FBG level reduction (favoured control group). Beam et al. showed that CGA supplementation (at 332 to 554 mg/person/day) increased the mean FBG levels, with d = 0.40 (95% CI: −0.27, 1.07) [28]. The meta-analysed pooled effect size of GCE supplementation was d = −0.30 (95% CI: −0.62, 0.03), with moderate heterogeneity of I2 = 51.1% (random effects analysis) (Figure 3).
3.4.3. Effect of Coffee on TG Levels
The effect of coffee intake on TG levels was evaluated on short-term (60–120 min) and long-term (8–24 weeks) bases. Data from three short-term interventions on the effects of decaffeinated coffee on TG levels were analysed. Additionally, data from fourteen long-term interventions on the effect of coffee on TG levels (caffeinated coffee (n = 1), decaffeinated coffee (n = 7), and GCE (n = 6)) were analysed. Decaffeinated coffee intake increased the mean TG levels, with the increase ranging from 43.8% to 60.6%. GCE was the most effective in reducing TG levels compared to baseline, with a percentage reduction ranging from 2.2% to 11.3% (Table 1).
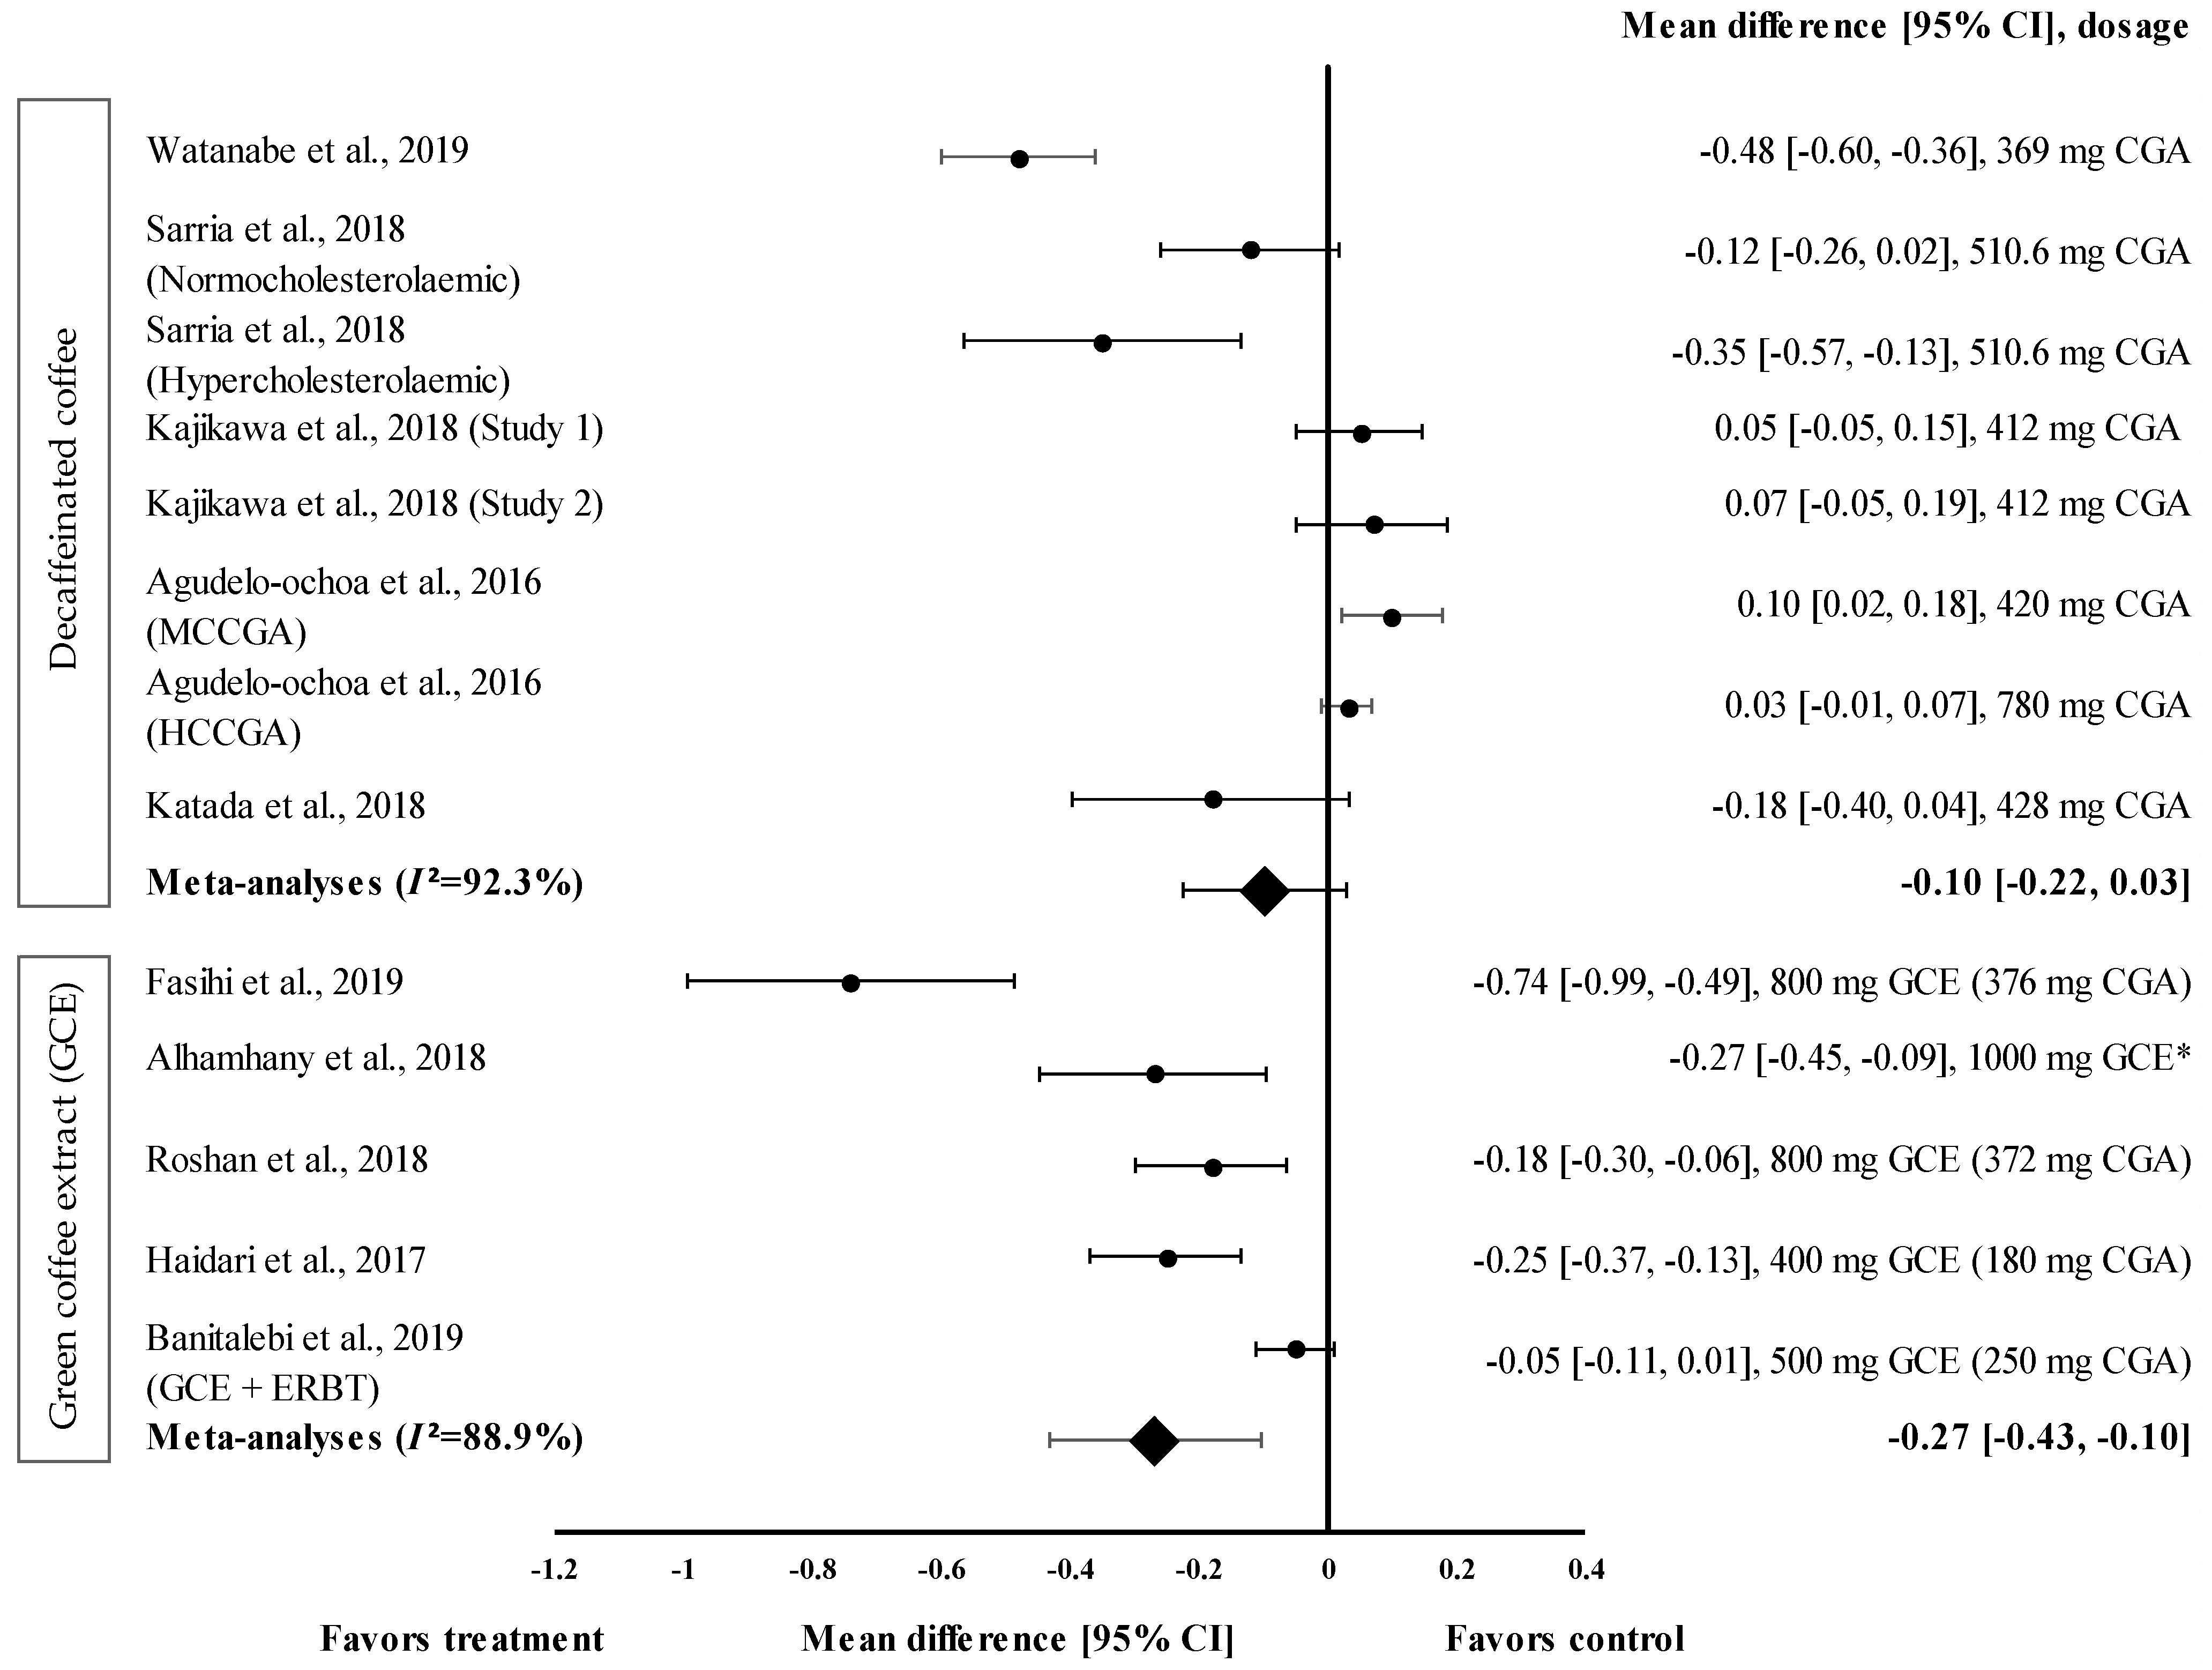
Overall, five studies with eight trials were included in the meta-analysis (Figure 4). Mean TG level reduction showed a small effect size with the d value ranging from 0.03 to −0.48 (Figure 4). Four out of eight decaffeinated coffee interventions showed the reduction of TG levels (treatment group favoured). Decaffeinated coffee containing 369 mg of CGA showed the greatest effect size (d = −0.48, 95% CI: −0.60, −0.36), followed by that containing 510.6 mg of CGA (in hypercholesterolaemic participants), 428 mg of CGA, and 510.6 mg of CGA (normocholesterolaemic participants) (d = −0.35, 95% CI: −0.57; −0.13, d = −0.18, 95% CI: −0.40, 0.04; and d = −0.12, 95% CI: −0.26, 0.02, respectively). Four trials showed a null effect on the mean TG level reduction (favoured control group). Decaffeinated coffee with CGA content ranging from 412 to 780 mg showed an effect size ranging from d = 0.03 (95% CI: −0.01, 0.07) to d = 0.10 (95% CI: 0.02, 0.18). The data showed a high level of heterogeneity with I2 = 92.3% and, hence, were subjected to random effects analysis. Decaffeinated coffee showed small pooled effect size on TG levels, with d = −0.10 (95% CI: −0.22, 0.03) (Figure 4).

Figure 4.
Forest plot showing the effect of decaffeinated coffee and GCE on TG levels, expressed as mean differences between the values obtained in the intervention and control groups. A negative effect size indicates that decaffeinated coffee and GCE supplements reduce TG levels. Meanwhile, a positive effect size indicates that decaffeinated coffee increases TG levels. Horizontal lines represent the 95% CIs. Diamonds represent the pooled effect size from the random effect analysis. CGA: chlorogenic acid, CI: confidence interval, ERBT: elastic resistance band training, GCE: green coffee extract, HCCGA: high CGA content, MCCGA: medium CGA content, TG: triglyceride. The values ± 0.2, ± 0.5, and ± 0.8, represent small, medium, and large effect sizes, respectively. * CGA dose not specified [21,22,23,26,29,30,31,32,33,34].
GCE intake (in five trials) showed small to large effect sizes on TG levels, with d = −0.05 and d = −0.74, respectively (Figure 4). All GCE interventions reduced the TG levels (treatment group favoured). GCE containing 376 mg of CGA showed the greatest effect size (d = −0.74, 95% CI: −0.99, −0.49), followed by 1000 mg of GCE (CGA dose not specified) (d = −0.27, 95% CI: −0.45, −0.09), and GCE containing 180, 372, and 250 mg of CGA (CGA + ERBT) (d = −0.25, 95% CI: −0.37, −0.13; d = −0.18, 95% CI: −0.30, −0.06; d = −0.05, 95% CI: −0.11, 0.01; respectively). Overall, the meta−analysis showed that GCE supplementation had a small pooled effect size with a high level of heterogeneity on the mean reduction in TG levels (pooled effect size of −0.27, 95% CI: −0.43, −0.10; I2 = 88.9%) (Figure 4).
3.4.4. Effect of Coffee on HDL-c Levels
Fourteen interventions reported the effect of coffee (caffeinated coffee (n = 1), decaffeinated coffee (n = 7), and GCE (n = 6)) on HDL-c levels. GCE caused the greatest increase in HDL-c levels, with the percentage of increase ranging from 2.4% to 15.6% (Table 1).
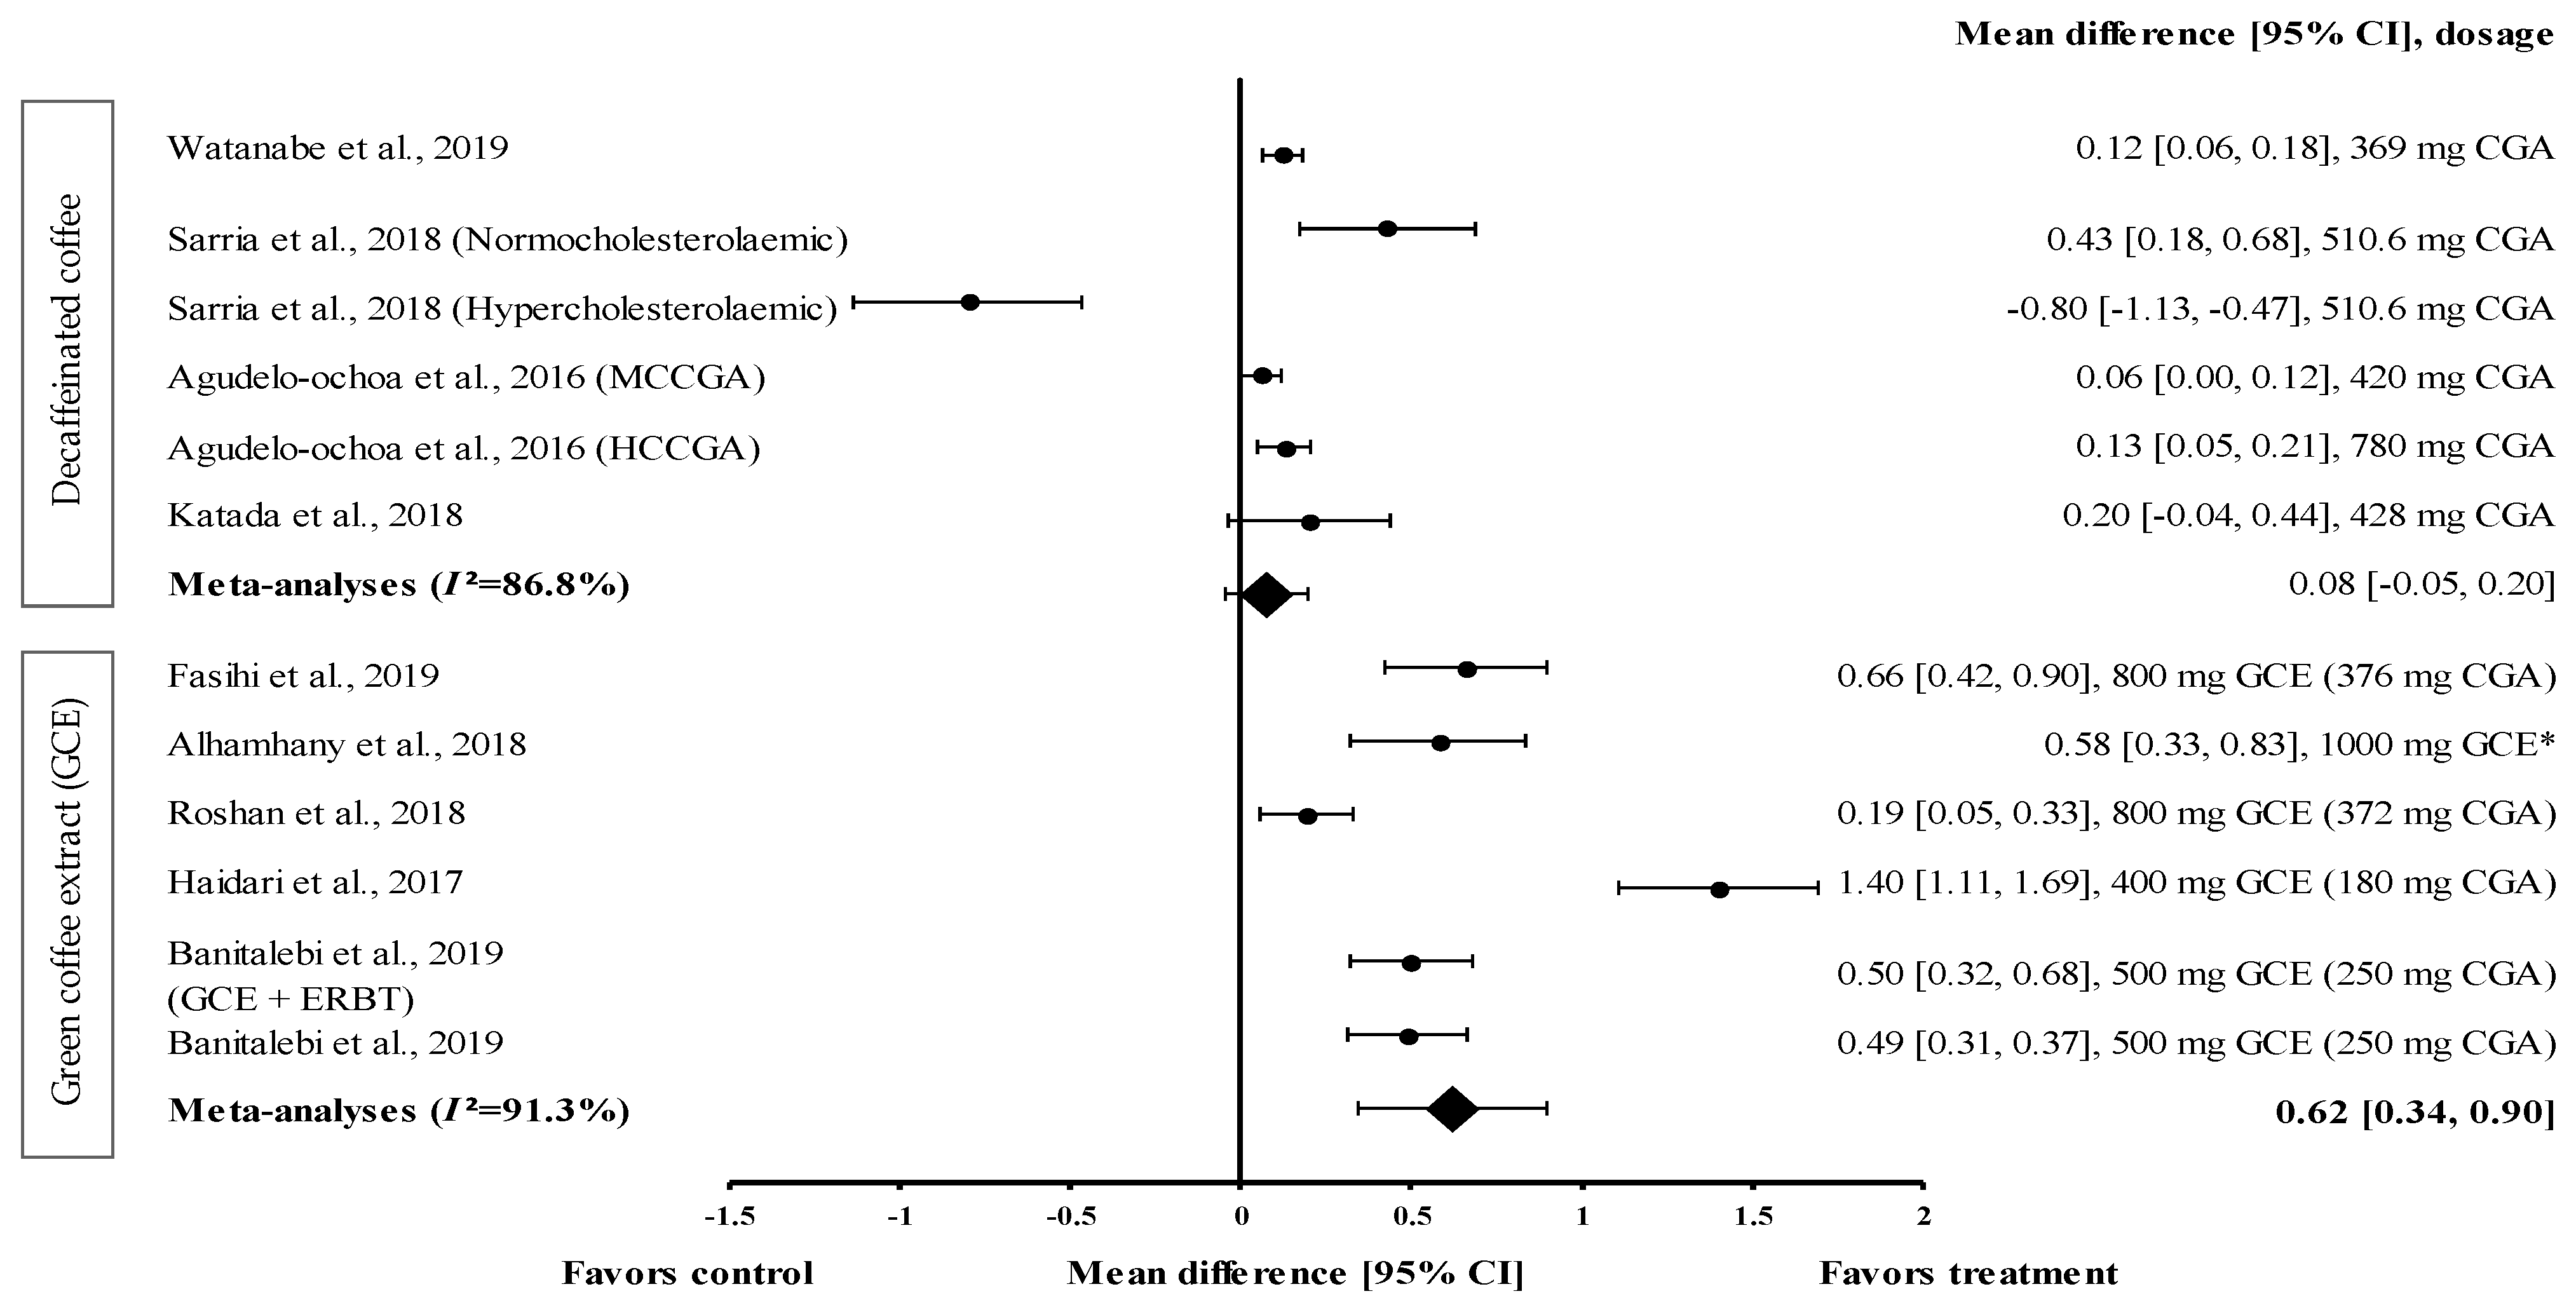
Four studies with six trials were included in the meta-analysis to investigate the effect of decaffeinated coffee on serum HDL-c levels. The effect size of mean increases on HDL-c levels (with small to large effect size; d = 0.06 and d = −0.80) is shown in Figure 5. Five out of six types of decaffeinated coffees increased the HDL-c levels (treatment group favoured). The greatest effect size was observed with decaffeinated coffee containing 510.6 mg of CGA (normocholesterolaemic participants), with d = 0.43 (95% CI: 0.18, 0.68), followed by that observed with decaffeinated coffee containing 428, 780 (high CGA content, HCCGA), 369, and 420 mg of CGA (medium CGA content, MCCGA), with d = 0.20 (95% CI: −0.04, 0.44), 0.13 (95% CI: 0.05, 0.21), 0.12 (95% CI: 0.06, 0.18), and 0.06 (95% CI: 0.00, 0.12), respectively. Meanwhile, one trial showed a null effect of decaffeinated coffee on HDL-c levels (favoured control group). Decaffeinated coffee containing 510.6 mg of CGA (hypercholesterolaemic participants) showed an effect size of d = −0.80 (95% CI: −1.13, −0.47). The data showed a high level of heterogeneity, with I2 = 86.8%, and, hence, were analysed using random effects analysis. The meta-analysed pooled effect size of decaffeinated coffee was d = 0.08 (95% CI: −0.05, 0.20) (Figure 5).
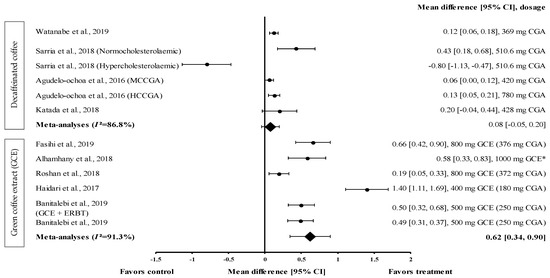
Figure 5.
Forest plot showing the effect of decaffeinated coffee and GCE supplements on HDL-c levels, expressed as mean differences between the values obtained in the intervention and control groups. A positive effect size indicates that decaffeinated coffee and GCE supplements increased the HDL-c levels. Meanwhile, a negative effect size indicates that decaffeinated coffee reduced the HDL-c levels. Horizontal lines represent the 95% CIs. Diamonds represent the pooled effect size from the random effect analysis. CGA: chlorogenic acid, CI: confidence interval, GCE: green coffee extract, HCCGA: high CGA content, HDL-c: high-density lipoprotein-cholesterol, MCCGA: medium CGA content. The values ± 0.2, ± 0.5 and ± 0.8, represent small, medium, and large effect sizes, respectively. * CGA dose not specified [21,22,26,29,30,31,32,33,34].
Five studies with six trials that investigated the effect of GCE on HDL-c levels were included in the meta-analysis (Figure 5). GCE showed a small-to-large effect size on mean HDL-c levels, with d = 0.19 and 1.40. All GCE interventions increased the serum HDL-c levels (treatment group favoured). GCE containing 180 mg of CGA showed the greatest effect size (d = 1.40, 95% CI: 1.11, 1.69), followed by that containing 376 mg of CGA, 1000 mg of CGE (CGA dose not specified), 250 mg of CGA (administered along with ERBT), 250 mg of CGA, and 372 mg of CGA (with d = 0.66, 95% CI: 0.42, 0.90; d = 0.58, 95% CI: 0.33, 0.83; d = 0.50, 95% CI: 0.32, 0.68; d = 0.49, 95% CI: 0.31, 0.37; and d = 0.19, 95% CI: 0.05, 0.33, respectively). A high level of heterogeneity (I2 = 91.3%) was observed in these data; hence, they were analysed using random effects analysis. GCE showed a moderate pooled effect size with d = 0.62 (95% CI: 0.34, 0.90) (Figure 5).
3.4.5. Effect of Coffee on SBP
The effect of coffee consumption on SBP was evaluated on a short-term (60–120 min) and long-term (8–24 weeks) basis. Three short-term intervention studies investigated the effect of coffee (caffeinated coffee (n = 1) and decaffeinated coffee (n = 2)) on SBP. Decaffeinated coffee was more effective than caffeinated coffee in reducing SBP, with a mean percentage reduction of 1.5% and 0.6%, respectively. Nine long-term trials investigated the effect of coffee on SBP (caffeinated coffee (n = 1), decaffeinated coffee (n = 5), and GCE (n = 3)). Among the different types of coffee, GCE was the most effective in reducing SBP, with a percentage reduction ranging from 2.1% to 9.8% (Table 1).
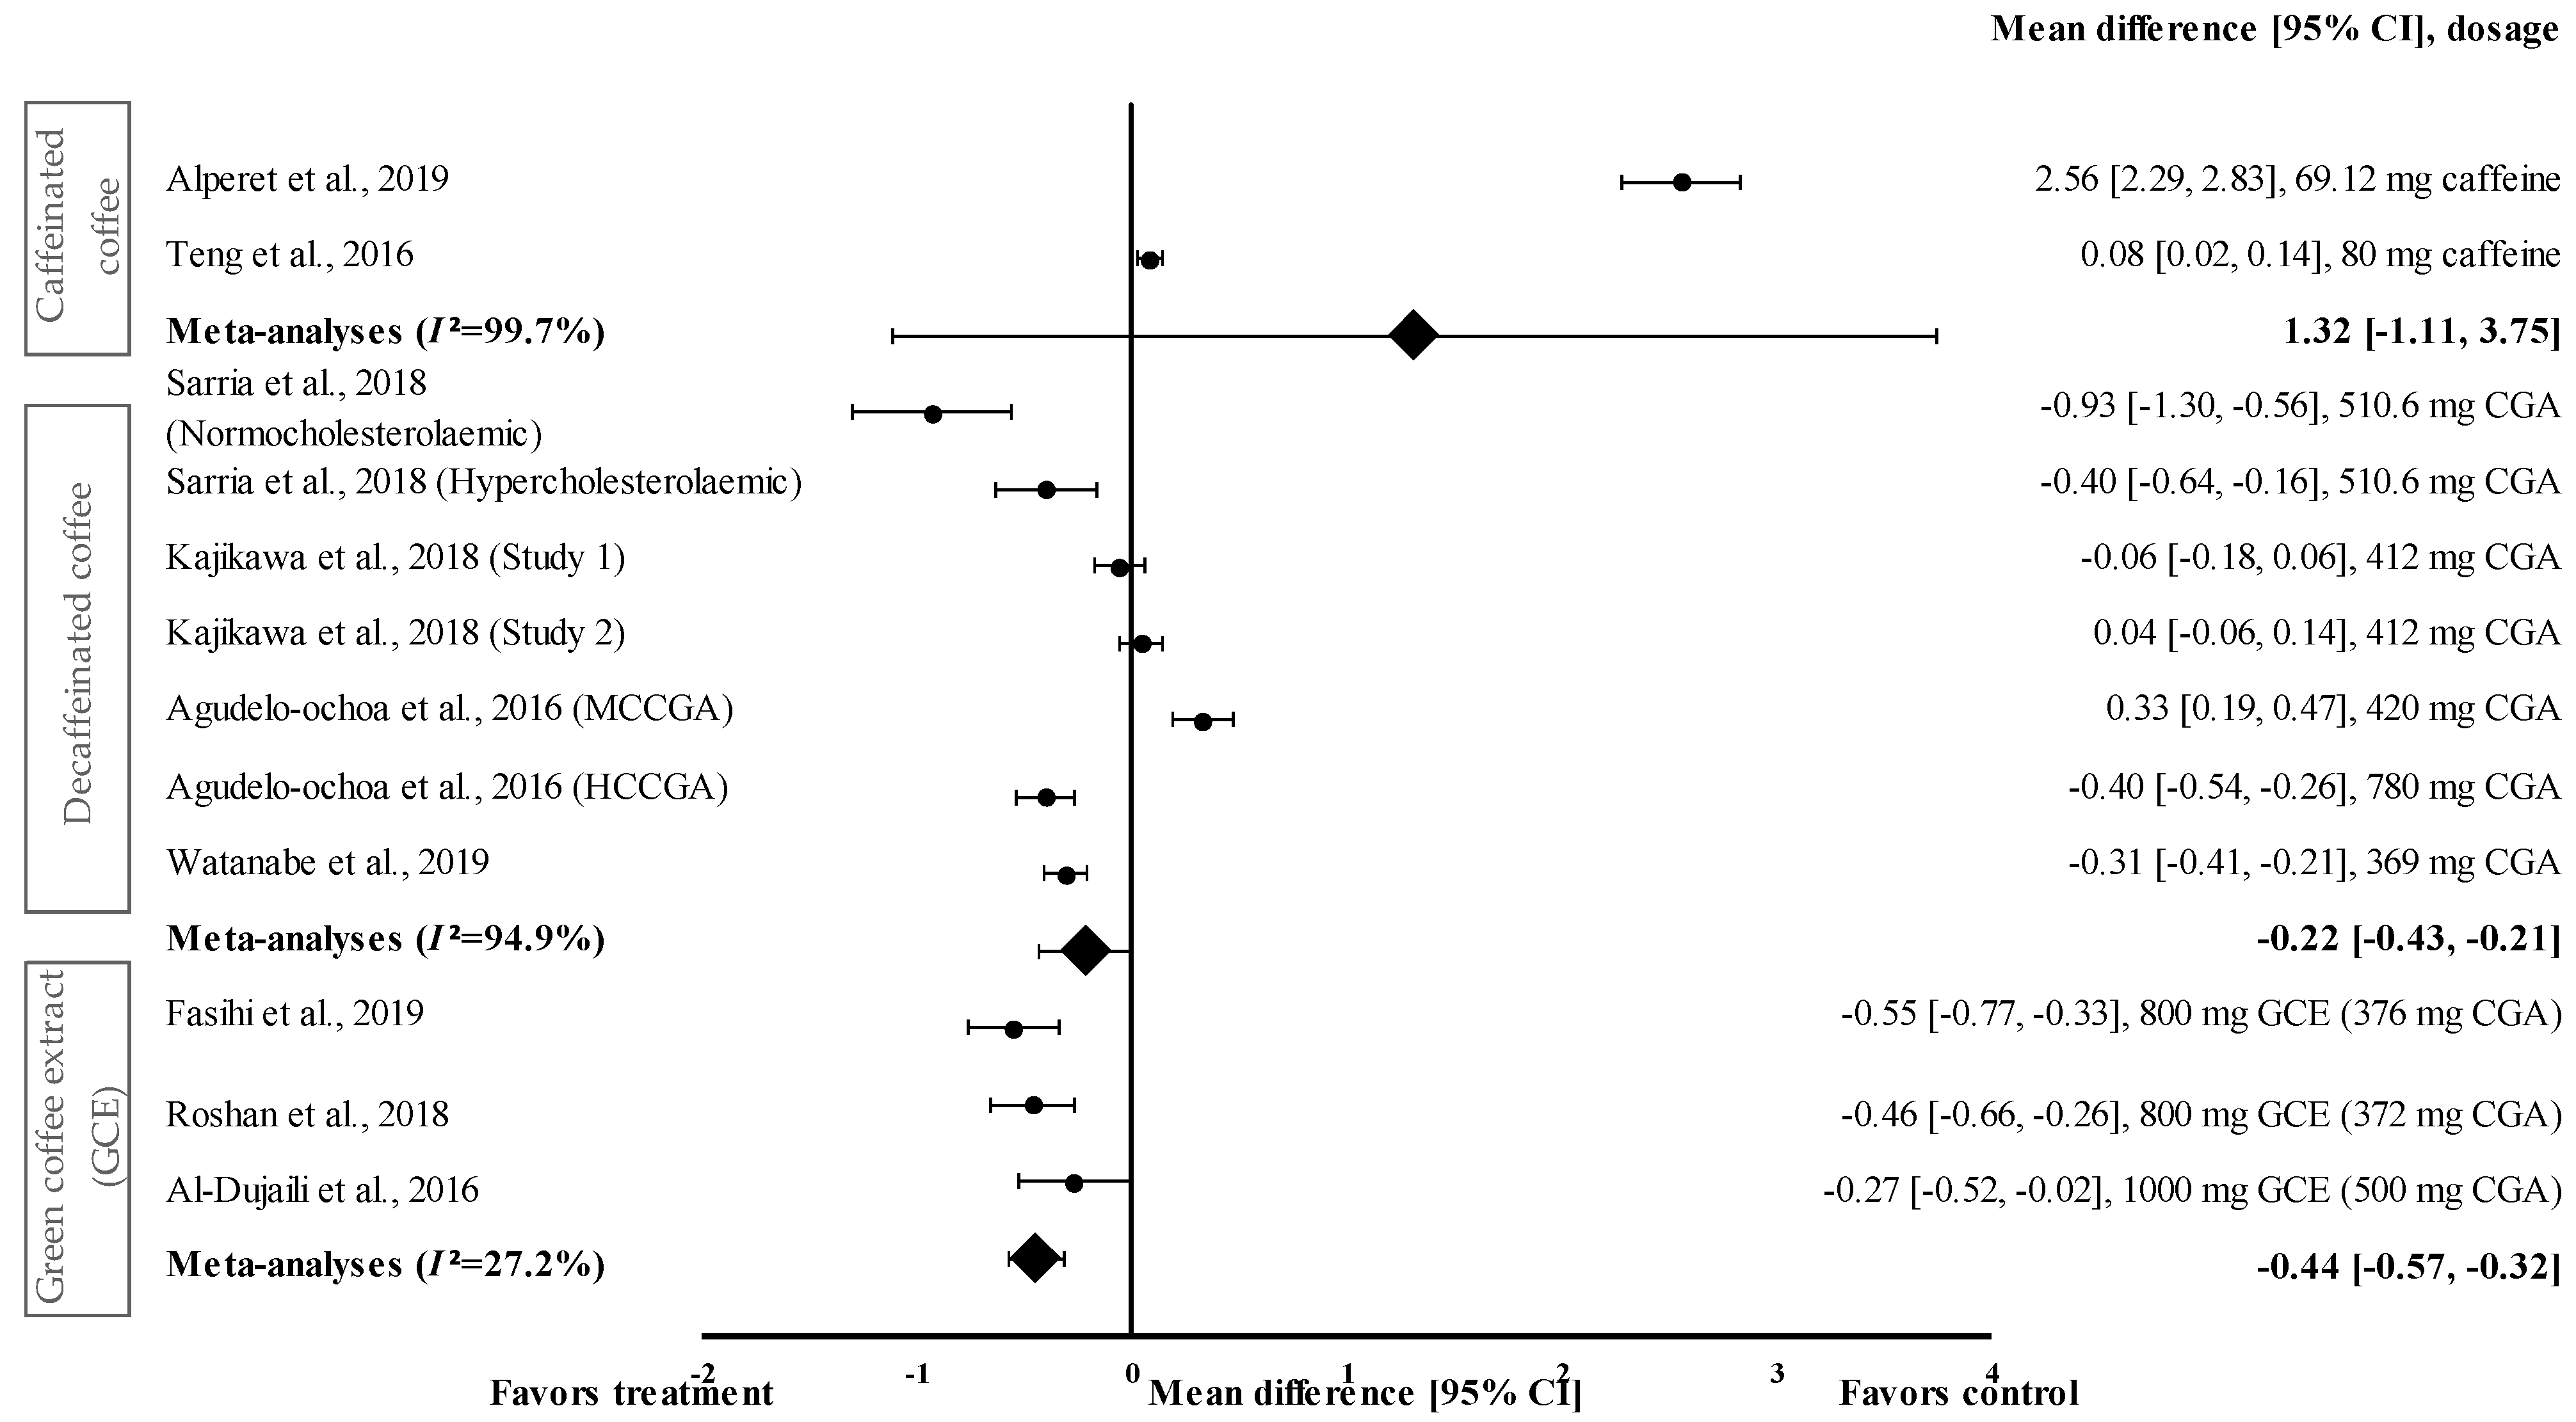
Figure 6 shows the meta-analysis of the effects of caffeinated coffee on SBP. Caffeinated coffee showed a small to very large effect size on mean SBP, with d ranging from 0.08 to 2.56. Caffeinated coffee increased SBP (favoured control group) compared to that in the control group. Caffeinated coffee containing 69.12 mg of caffeine showed the highest effect size (d = 2.56, 95% CI: 2.29, 2.83), followed by that containing 80 mg of caffeine (d = 0.08, 95% CI: 0.02, 0.14). A high level of heterogeneity (I2 = 99.7%) was observed in the data; hence, the data were analysed using random effects analysis. A large pooled effect size was reported for this meta-analysis, with d = 1.32 (95% CI: −1.11 to 3.75) (Figure 6).

Figure 6.
Forest plot showing the effect of caffeinated coffee, decaffeinated coffee, and GCE supplements on SBP, expressed as mean differences between the values obtained from the intervention and control groups. A negative effect size indicates that decaffeinated coffee and GCE supplements reduce SBP. Meanwhile, a positive effect size indicates that caffeinated and decaffeinated coffee increase SBP. Horizontal lines represent 95% CIs. Diamonds (I2 < 50%) represent the pooled effect size from fixed effects analysis. I2 >50% represents the pooled effect size from random effects analysis. CGA: chlorogenic acid, CI: confidence interval, GCE: green coffee extract, HCCGA: high CGA content, MCCGA: medium CGA content, SBP: systolic blood pressure. The values ± 0.2, ± 0.5 and ± 0.8 represent small, medium, and large effect sizes [22,23,24,25,26,27,30,31,33].
Four studies with seven trials were included in the meta-analysis for investigating the effect of decaffeinated coffee on SBP. Decaffeinated coffee showed a small to large effect size on SBP reduction, with d values of 0.04 and -0.93 (Figure 6). In five out of seven interventions with decaffeinated coffee, SBP was reduced (treatment group favoured). Decaffeinated coffee containing 510.6 mg of CGA showed the greatest effect size (in normocholesterolaemic participants) (d = −0.93, 95% CI: −1.30, −0.53), followed by that containing 780 mg of CGA (HCCGA), 510.6 mg of CGA (in hypercholesterolaemic participants), 369 mg of CGA, and 412 mg of CGA (d = −0.40, 95% CI: −0.54, −0.26; d = −0.40, 95% CI: −0.64, −0.16; d = −0.31, 95% CI: −0.41, −0.21; and d = −0.06, 95% CI: −0.18, 0.06; respectively). Two trials showed a null effect on SBP reduction (favoured control group). Decaffeinated coffee containing 412 mg of CGA and 420 mg of MCCGA showed effect sizes with d values of 0.04 (95% CI: −0.06, 0.14) and 0.33 (95% CI: 0.19, 0.47), respectively. A high heterogeneity level of I2 = 94.4% was observed in the data; hence, the data were analysed using random effects analysis. Decaffeinated coffee showed a small pooled effect size on SBP with d = −0.22 (95% CI: −0.43, −0.21) (Figure 6).
GCE supplementation showed a small to moderate effect size in mean SBP reduction with d ranging from −0.27 to −0.55 (Figure 6). All GCE interventions reduced the SBP (treatment group favoured). GCE containing 376 mg of CGA showed the greatest effect size (d = −0.55, 95% CI: −0.77, −0.33), followed by that containing 372 and 500 mg of CGA (d = −0.46, 95% CI: −0.66, −0.26 and d = −0.27, 95% CI: −0.52, −0.02, respectively). A low level of heterogeneity (I2 = 27.2%) was observed in this meta-analysis and, hence, data were analysed using fixed effects analysis. The meta-analysis of GCE supplementation data showed a small pooled effect size with d = −0.44 (95% CI: −0.57, −0.32) (Figure 6).
3.4.6. Effect of Coffee on DBP
The effect of coffee intake on DBP was evaluated on short-term (60–120 min) and long-term (8–24 weeks) bases, with the effect of caffeinated coffee investigated only on a short-term basis. Caffeinated coffee increased the DBP by 1.1% compared to the baseline (Table 1). Eight studies investigated the long-term effect of the consumption of coffee (caffeinated coffee (n = 1), decaffeinated coffee (n = 4), and GCE (n = 3)) on DBP. Decaffeinated coffee reduced the DBP by 7.3% to 3.3% compared to the baseline; however, in some studies, decaffeinated coffee also increased the DBP by 1.3% to 1.4% compared to the baseline (Table 1).
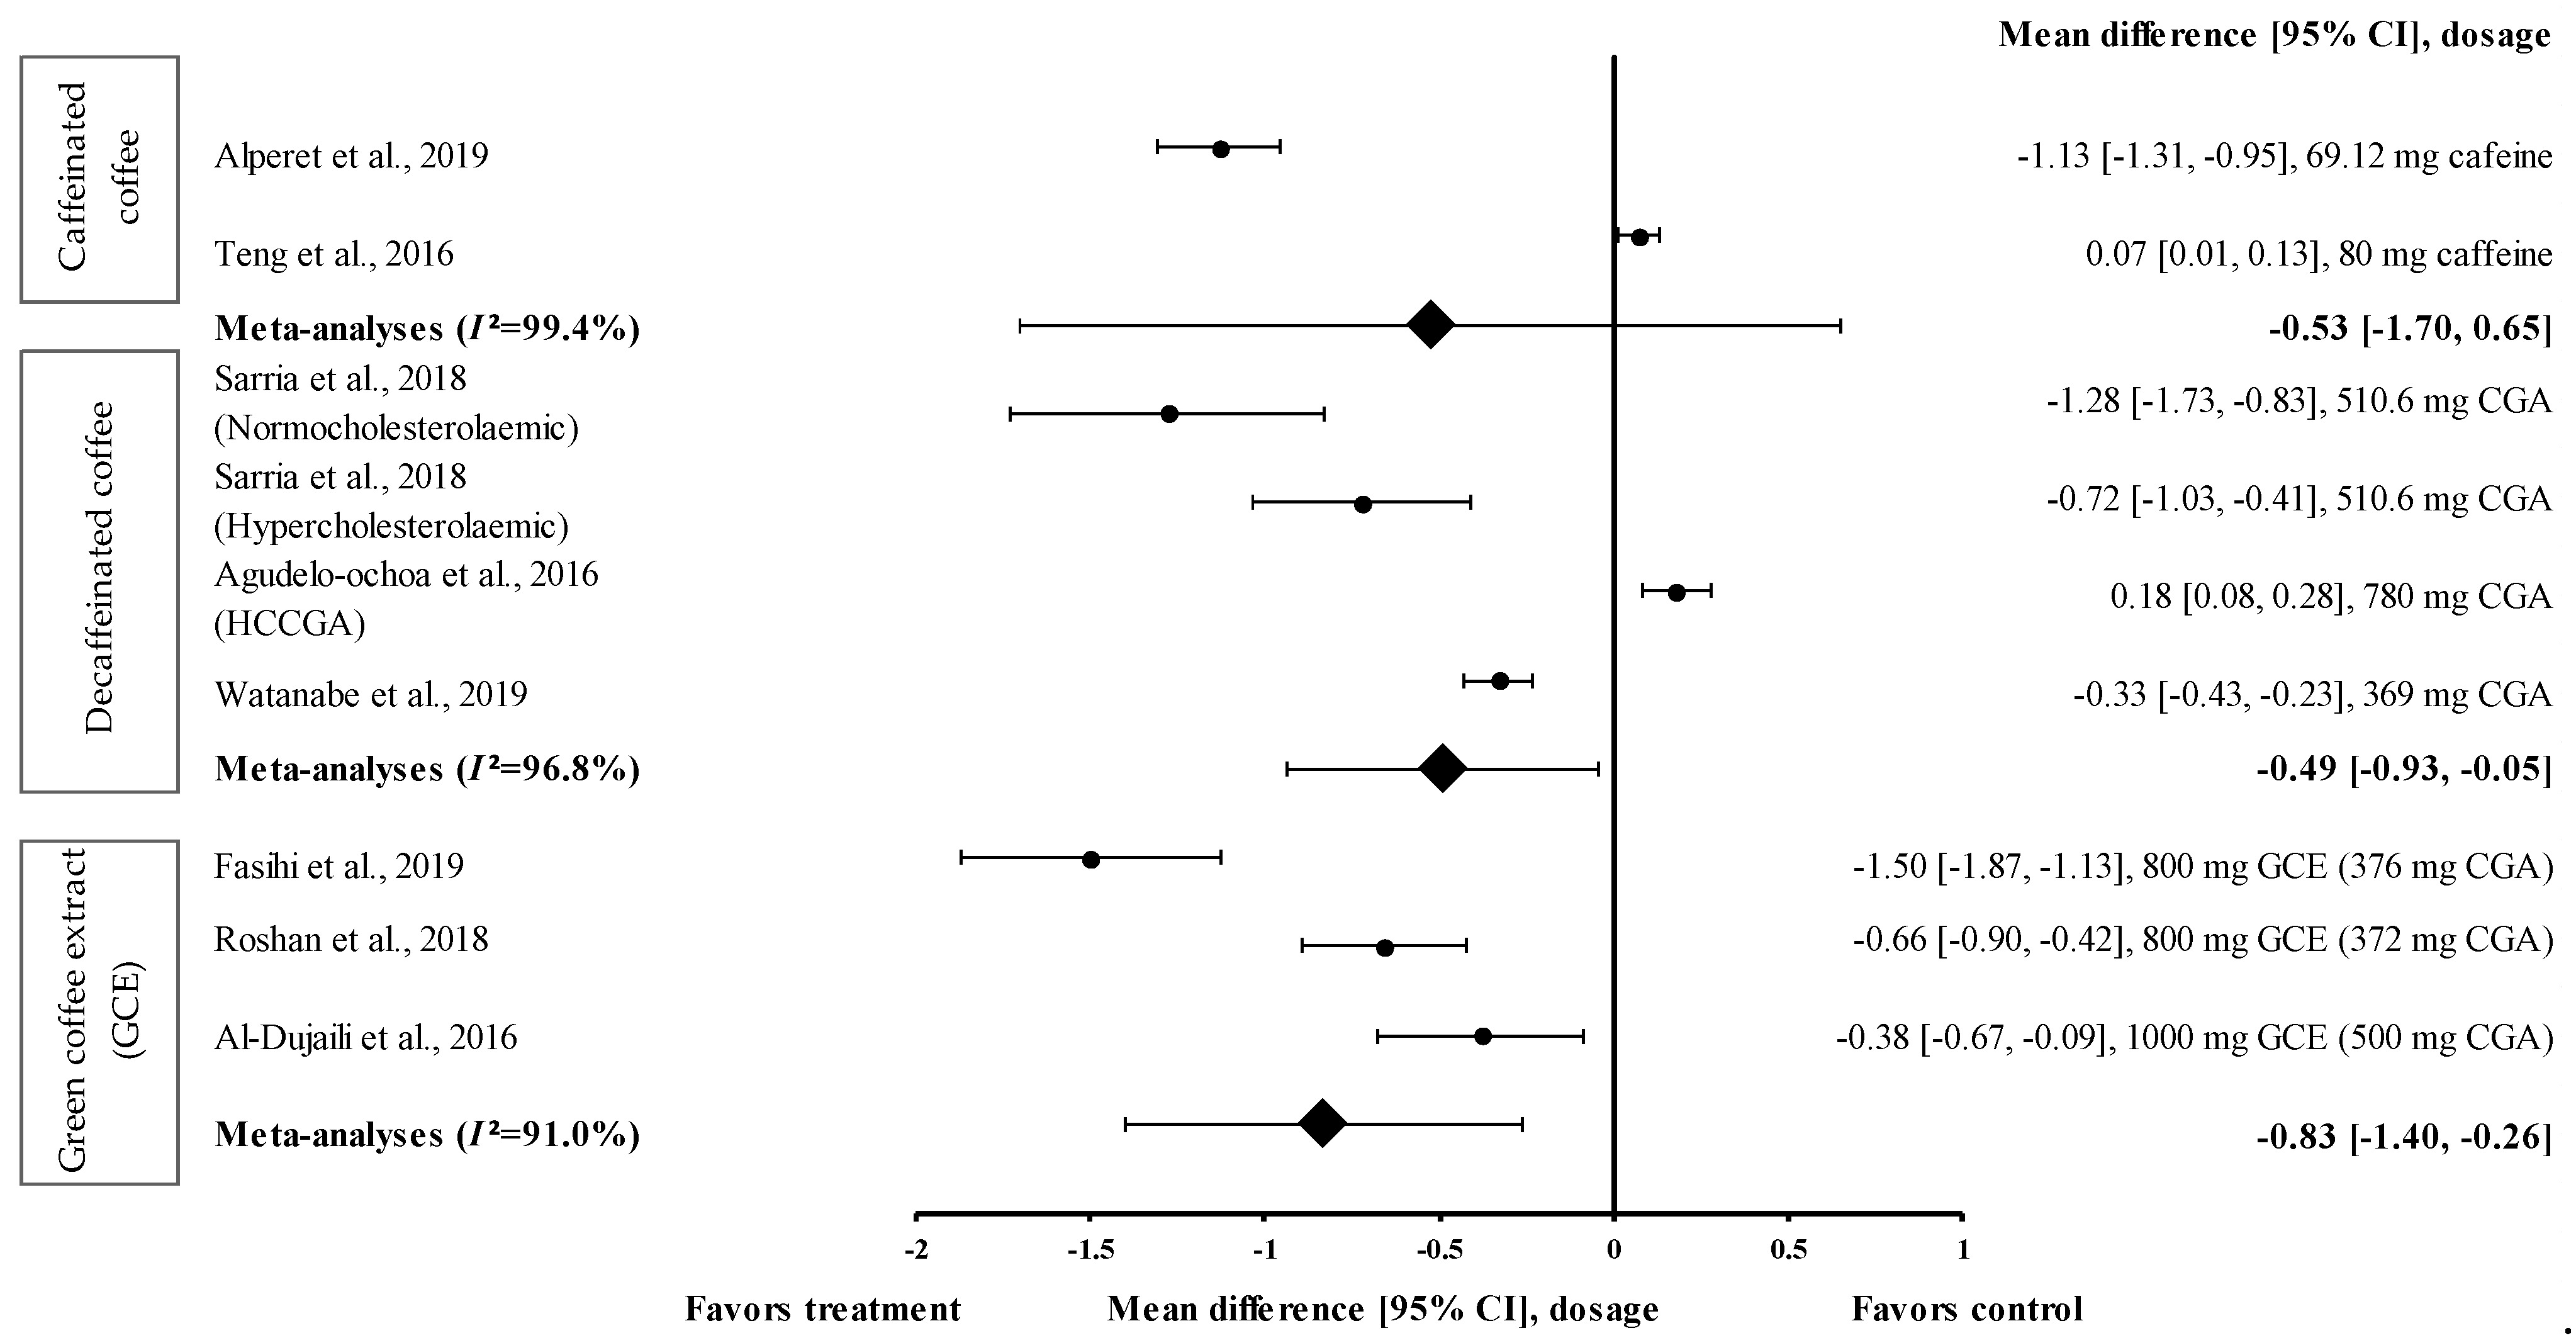
Data from only two trials on caffeinated coffee were included in the meta-analysis (Figure 7). Caffeinated coffee containing 69.12 mg of caffeine reduced DBP (treatment group favoured) with an effect size of d = −1.13 (95% CI: −1.31, −0.95). Teng et al. showed that caffeinated coffee containing 80 mg of caffeine increased the DBP with an effect size of d = 0.07 (95% CI: 0.01, 0.13) [24]. A high level of heterogeneity (I2 = 99.4%) was observed in the data and, hence, the data were analysed using random effects analysis. The meta-analysis showed a moderate pooled effect size with d = −0.53 (95% CI: −1.70, 0.65) (Figure 7).
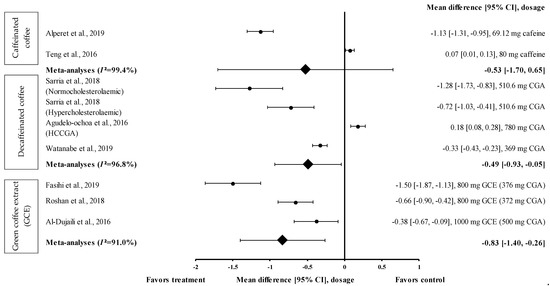
Figure 7.
Forest plot showing the effect of caffeinated coffee, decaffeinated coffee, and GCE supplements on DBP, expressed as mean differences between the values obtained in the intervention and control groups. A negative effect size indicates that caffeinated coffee, decaffeinated coffee, and GCE supplements reduce DBP. Meanwhile, a positive effect size indicates that caffeinated and decaffeinated coffee increase DBP. Horizontal lines represent 95% CIs. Diamonds represent the pooled effect size from random effects analysis. CGA: chlorogenic acid, CI: confidence interval, GCE: green coffee extract, DBP: diastolic blood pressure, HCCGA: high CGA content, MCCGA: medium CGA content. The values ± 0.2, ± 0.5 and ± 0.8 represent small, medium, and large effect sizes [22,24,25,26,27,30,31,33].
Three studies with four trials were included in the meta-analysis to investigate the effect of decaffeinated coffee on DBP. The effect size on mean DBP reduction ranged from small to very large, with d ranging from 0.18 to −1.28 (Figure 7). In three out of four trials on decaffeinated coffee, the mean DBP value was reduced (treatment group favoured). Decaffeinated coffee containing 510.6 mg of CGA (in normocholesterolaemic participants) showed the greatest effect size (d = −1.28, 95% CI: −1.73, −0.83), followed by that containing 510.6 mg of CGA (in hypercholesterolaemic participants) (d = −0.72, 95% CI: −1.03, −0.41) and 369 mg of CGA (d = −0.33, 95% CI: −0.43, −0.23). One trial showed a null effect on mean DBP reduction (favoured control group). Decaffeinated coffee containing 780 mg of CGA (HCCGA) showed an effect size of d = 0.18 (95% CI: 0.08, 0.28) [33]. The data from these studies showed a high level of heterogeneity (I2 = 96.8%) and, hence, were analysed using random effects analysis. Decaffeinated coffee showed a moderate pooled effect size on DBP (d = −0.49, 95% CI: −0.93, −0.05) (Figure 7).
Three intervention studies were included in the meta-analysis to investigate the effect of GCE supplementation on DBP. GCE showed a small to large effect size on DBP, with d = −0.38 and −1.50 (Figure 7). All interventions reduced DBP (treatment group favoured). GCE containing 376 mg of CGA showed the greatest effect size (d = −1.50, 95% CI: −1.87, −1.13), followed by that containing 372 and 500 mg of CGA (d = −0.66, 95% CI: −0.90, −0.42 and d = −0.38, 95% CI: −0.67, −0.09, respectively). The data showed a high level of heterogeneity (I2 = 91.0%); hence, they were analysed using random effects analysis. A large pooled effect size was observed with d = −0.83 (95% CI: −1.40, −0.26) (Figure 7).
4. Discussion
Caffeinated and decaffeinated coffees were the primary types of coffee used in the studies identified in this meta-analysis. Decaffeinated coffee contains 369–780 mg of CGA [22,23,30,31,32,33]. Only one study reported the CGA content of caffeinated coffee (45.4 mg) [28]. GCE is made from decaffeinated and unroasted coffee beans and, therefore, is classified as decaffeinated coffee [35]. GCE contains 180 to 500 mg CGA [20,21,26,27,28,29]. Fourteen studies showed an average risk of bias (score of 3 or above), whereas the remaining two studies showed a high risk of bias (score less than 3). GCE was administered to the participants as an extract. GCE supplementation effectively suppressed the MeTS parameters, namely waist circumference, TG and HDL-c levels, SBP, and DBP. Beverages containing decaffeinated coffee effectively reduced the FBG levels compared with the baseline. However, caffeinated coffee did not effectively improve the MeTS parameters, except for in terms of waist circumference, TG and HDL-c levels, and DBP.
This meta-analysis showed that GCE supplementation effectively improved anthropometric parameters, such as waist circumference. The pooled random effects analysis showed the small reducing effect on waist circumference (d = −0.39, 95% CI: −0.68, 0.10), albeit with a high level of heterogeneity (I2 = 93.0%) (Figure 2). Nevertheless, Fasihi et al. showed that supplementation with GCE containing 376 mg of CGA in capsule form for 8 weeks moderately reduced the waist circumference of participants, with d = −0.65 (95% CI: −0.89, −0.41) [30]. A recent review by Asbaghi et al. showed that, compared to the consumption of high-dose GCE for a short duration, the consumption of low-dose GCE (<400 mg of CGA/day) for 8 weeks effectively reduced body weight, waist circumference, and body mass index [36]. Green coffee beans are rich in CGAs such as 5-caffeoylquinic acid, one of the primary components of CGA that was shown to attenuate diet-induced obesity in mice [35]. The effect is modulated through the suppression of TG accumulation in the liver and the alteration of plasma adipokine levels, which subsequently downregulate adipogenesis-related genes and upregulate fatty acid oxidation-related genes [35,37].
A combination of resistance exercise and GCE supplementation was shown to considerably reduce the anthropometric parameters [38]. The findings of this meta-analysis showed that compared to only GCE supplementation (d = −0.07), the combination of supplementation with GCE (containing 250 mg of CGA) at a low dose and ERBT significantly reduced the waist circumference of participants (d = −0.45) [29]. Moghadam and Ganji showed that, compared to only GCE intake or concurrent training (CT), the ingestion of GCE (containing 420 mg of CGA) with CT (comprising of stretching and warm-up exercises, aerobic training, resistance training, and cool-down/running and stretching exercises) reduced the body weight and body mass index of women with obesity or women who are overweight [39].
Decaffeinated coffee intake reduced waist circumference, but less markedly than GCE supplementation. This could be attributed to the higher CGA content in GCE supplements than in decaffeinated coffee (liquid). The CGA content in coffee varies according to the food matrix; for instance, unroasted green coffee (capsule) has a higher CGA content than roasted coffee (10.2–21.1 g of CGA/100 g dry weight vs. 0.7–9.0 g of CGA/100 g dry weight, respectively) [40]. Reduced waist circumference was shown to be associated with improved glycaemic response [41]. A slight reduction in waist circumference (approximately 10% relative reduction) was associated with the reduction of FBG levels by 10 mg/dL. The findings of this review suggest that GCE and decaffeinated coffee help reduce waist circumference and may improve the glycaemic response.
Decaffeinated coffee containing 369 to 510.6 mg of CGA reduced the FBG levels to a greater extent than caffeinated coffee and GCE. Decaffeinated coffee showed a greater pooled random effect on FBG levels, with d = −0.81 (I2 = 96.4%), than caffeinated coffee and GCE (d = 0.17 and −0.30, respectively) (Figure 3). Decaffeinated coffee (liquid) containing 510.6 mg of CGA led to a greater effect size (d = −1.83) than decaffeinated coffee containing 369 mg of CGA (d = −0.06) [22,31]. This effect might be attributed to the different quantities of coffee in the two studies. In the first study, the participants consumed only one cup of coffee (containing 369 mg of CGA) per day, whereas in the second study, the participants consumed three cups of decaffeinated coffee (170.2 mg of CGA per cup) (breakfast, mid-day, and post-lunch) [22,31]. A previous study showed that phenolic metabolites, such as hydroxycinnamic acid, derived from CGA, are present in the bloodstream at relatively high concentrations for a longer period of time than caffeine, methylxanthines, and methylurics [42,43]. The intestinal absorption rate for CGA (33%) was lower than that for caffeic acid (95%) [44]. However, the mechanisms underlying the observed effects remain unclear. Hence, an understanding of how these metabolites affect FBG levels at the cellular level is warranted.
GCE reduced the FBG levels with an effect size of −0.30 (95% CI: −0.62, 0.03). However, it was less effective than decaffeinated coffee (Figure 3). This might be attributed to the different GCE doses (180–554 mg of CGA) and supplementation duration. Caffeinated coffee containing 69.12 to 554 mg of caffeine increased the FBG levels with an effect size of 0.17 (95% CI: 0.09, 0.25). The increase in the FBG levels caused by caffeinated coffee might be attributed to the varying caffeine contents in coffee. The findings of the study suggested that the reduction of glucose tolerance may have occurred in response to the increase in epinephrine levels after caffeine consumption. Desensitisation to the effects of epinephrine (via the downregulation of β-adrenergic receptors or the absence of epinephrine expression) could weaken the mechanism by which caffeine reduces glucose disposal [15]. GCE supplementation effectively reduced the TG levels and increased the HDL-c levels. The pooled random effects analysis showed the small and moderate effect sizes of the interventions on TG and HDL-c levels (d = −0.27, 95% CI: −0.43, −0.10 and d = 0.62, 95% CI: 0.34, 0.90, respectively). However, in individual studies, supplementation with GCE containing 180 to 376 mg of CGA in the capsule considerably reduced the TG level and considerably increased the HDL−c level, with d = −0.74 (95% CI: −0.99, −0.49) and d = 1.40 (95% CI: 1.11, 1.69), respectively. Mechanistically, this could be attributed to the stimulation of the hepatic peroxisomal proliferation-activated receptor-alpha (PPAR-α) by CGA present in the GCE. A previous study showed that activated PPAR-α plays a vital role in improving insulin sensitivity and inhibiting lipid synthesis in the liver [45]. Furthermore, CGA stimulates hepatic enzymes, such as fatty acid 3-hydroxy−3-methyl-glutaryl coenzyme A reductase, acyl-coenzyme A, and cholesterol acyltransferase, which subsequently increase the TG levels and promote cholesterol homeostasis [46].
This review also showed that GCE supplementation effectively reduced SBP and DBP. CGA was shown to reduce blood pressure and body weight by inhibiting 11β–hydroxysteroid dehydrogenase type 1 found in adipose tissues and the liver [47]. This enzyme is involved in the conversion of hormonally inactive cortisone into active cortisol, which reduces blood pressure and enhances weight loss.
GCE showed small and large pooled effect sizes on SBP and DBP, with d = −0.44 (95% CI: −0.57, −0.32; I2 = 27.2%) and d = −0.83 (95% CI: −1.40, −0.26; I2 = 91.0%), respectively (Figure 6 and Figure 7). However, in individual studies, supplementation with GCE containing 376 mg of CGA for 8 weeks exerted the strongest suppressive effect on both SBP and DBP, with d = −0.55 (95% CI: −0.77, −0.33) and d = −1.50 (95% CI: −1.87, −1.13), respectively. The effect was less pronounced after the short-term (2 weeks) consumption of GCE containing 500 mg of CGA. The short-term administration of GCE supplements, even at a high dose, may have been inadequate for reducing the SBP and DBP.
A high level of heterogeneity was observed among the study data; hence, the results should be interpreted with caution. Additionally, subgroup and sensitivity analyses were not performed to identify the confounding factors that contributed to the MeTS outcomes.
5. Conclusions
Fourteen high-quality RCTs were included in this review, and the observation period in the studies ranged from 60 min to 24 weeks; the longer study periods were adequate for evaluating substantial changes in the MeTS parameters. The findings of this meta-analysis suggested that supplementation with GCE containing 180 to 376 mg of CGA for more than 4 weeks effectively reduced MeTS parameters, namely waist circumference (0.4% to 3.0%), FBG levels (0.8% to 14.8%), TG levels (2.2% to 11.3%), HDL-c levels (0.7% to 15.6%), SBP (2.1% to 9.8%), and DBP (4.7% to 6.7%). Supplementation with decaffeinated coffee containing 510.6 mg of CGA for more than 4 weeks effectively reduced the waist circumference (1.6%), FBG levels (4.1% to 4.9%), TG levels (1.2% to 4.6%), SBP (3.0% to 4.4%), and DBP (3.3% to 7.3%). GCE supplementation along with resistance exercise (i.e., ERBT) further enhanced the suppressive effect of GCE on MeTS parameters. However, the effects of GCE supplementation and decaffeinated coffee intake on MeTS outcomes varied depending on the dose administered and were independent of the intervention duration (60 min to 24 weeks). A more detailed intervention with a specific dose and a well-planned study design, with adjustment for dietary intake, physical activity, and other health outcomes, are needed to further confirm the outcomes reported in this review.
Author Contributions
N.N.S.R., A.M.M.J., and A.A.A. designed and considered the systematic review, and conducted the literature search and study selection. N.N.S.R. analysed and interpreted the data and wrote the article. A.M.M.J. and A.A.A. edited and revised the manuscript before submission. All authors have read and agreed to the published version of the manuscript.
Funding
This research received no external funding.
Institutional Review Board Statement
Not applicable.
Informed Consent Statement
Not applicable.
Data Availability Statement
Not applicable.
Conflicts of Interest
The authors declare no conflict of interest.
References
- Binesh Marvasti, T.; Adeli, K. Pharmacological Management of Metabolic Syndrome and Its Lipid Complications. J. Pharm. Sci. 2010, 18, 146–154. [Google Scholar]
- Grundy, S.M.; Brewer, H.B., Jr.; Cleeman, J.I.; Smith, S.C., Jr.; Lenfant, C. Definition of Metabolic Syndrome: Report of the National Heart, Lung, and Blood Institute/American Heart Association Conference on Scientific Issues Related to Definition. Circulation 2004, 109, 433–438. [Google Scholar] [CrossRef] [PubMed] [Green Version]
- Friend, A.; Craig, L.; Turner, S. The Prevalence of Metabolic Syndrome in Children: A Systematic Review of the Literature. Metab. Syndr. Relat. Disord. 2013, 11, 71–80. [Google Scholar] [CrossRef] [PubMed]
- Sigit, F.S.; Tahapary, D.L.; Trompet, S.; Sartono, E.; Van Dijk, K.W.; Rosendaal, F.R.; De Mutsert, R. The Prevalence of Metabolic Syndrome and Its Association With Body Fat Distribution in Middle-Aged Individuals from Indonesia and The Netherlands: A cross-sectional analysis of two population-based studies. Diabetol. Metab. Syndr. 2020, 12, 1–11. [Google Scholar] [CrossRef] [Green Version]
- Shang, F.; Li, X.; Jiang, X. Coffee Consumption and Risk of The Metabolic Syndrome: A Meta-Analysis. Diabetes Metab. 2016, 42, 80–87. [Google Scholar] [CrossRef] [PubMed]
- Wolska, J.; Janda, K.; Jakubczyk, K.; Szymkowiak, M.; Chlubek, D.; Gutowska, I. Levels of Antioxidant Activity and Fluoride Content in Coffee Infusions of Arabica, Robusta and Green Coffee Beans in According to their Brewing Methods. Biol. Trace Elem. Res. 2017, 179, 327–333. [Google Scholar] [CrossRef] [Green Version]
- Butt, M.S.; Sultan, M.T. Coffee and Its Consumption: Benefits and Risks. Crit. Rev. Food Sci. Nutr. 2011, 51, 363–373. [Google Scholar] [CrossRef]
- Gökcen, B.B.; Şanlier, N. Coffee Consumption and Disease Correlations. Crit. Rev. Food Sci. Nutr. 2019, 59, 336–348. [Google Scholar] [CrossRef]
- Hollands, M.A.; Arch, J.R.S.; Cawthorne, M.A. A Simple Apparatus for Comparative Measurements of Energy Expenditure in Human Subjects: The Thermic Effect of Caffeine. Am. J. Clin. Nutr. 1981, 34, 2291–2294. [Google Scholar] [CrossRef]
- Acheson, K.J.; Zahorska-Markiewicz, B.; Pittet, P.; Anantharaman, K.; Jéquier, E. Caffeine and Coffee: Their Influence on Metabolic Rate and Substrate Utilization in Normal Weight and Obese Individuals. Am. J. Clin. Nutr. 1980, 33, 989–997. [Google Scholar] [CrossRef]
- Bracco, D.; Ferrarra, J.M.; Arnaud, M.J.; Jequier, E.; Schutz, Y. Effects of Caffeine on Energy Metabolism, Heart Rate, and Methylxanthine Metabolism in Lean and Obese Women. Am. J. Physiol. Metab. 1995, 269 Pt 1, E671–E678. [Google Scholar] [CrossRef] [PubMed]
- Costill, D.L.; Dalsky, G.P.; Fink, W.J. Effects of Caffeine Ingestion on Metabolism and Exercise Performance. Med. Sci. Sports 1978, 10, 155–158. [Google Scholar] [PubMed]
- Daubresse, J.-C.; Luyckx, A.; Demey-Ponsart, E.; Franchimont, P.; Lefebvre, P. Effects of Coffee and Caffeine on Carbohydrate Metabolism, Free Fatty Acid, Insulin, Growth Hormone and Cortisol Plasma Levels in Man. Acta Diabetol. 1973, 10, 1069–1084. [Google Scholar] [CrossRef]
- Sawynok, J.; Yaksh, T.L. Caffeine as An Analgesic Adjuvant: A Review of Pharmacology and Mechanisms of Action. Pharmacol. Rev. 1993, 45, 43–85. [Google Scholar]
- Battram, D.S.; Arthur, R.; Weekes, A.; Graham, T.E. The Glucose Intolerance Induced by Caffeinated Coffee Ingestion Is Less Pronounced than That Due to Alkaloid Caffeine in Men. J. Nutr. 2006, 136, 1276–1280. [Google Scholar] [CrossRef] [PubMed] [Green Version]
- Neath, I. Effect Size Calculator. Available online: https://memory.psych.mun.ca/models/stats/effect_size.shtml (accessed on 29 January 2021).
- Neyeloff, J.L.; Fuchs, S.C.; Moreira, L.B. Meta-Analyses and Forest Plots Using a Microsoft Excel Spreadsheet: Step-by-Step Guide Focusing on Descriptive Data Analysis. BMC Res. Notes 2012, 5, 52. [Google Scholar] [CrossRef] [PubMed] [Green Version]
- Rothstein, H.R.; Borenstein, M.; Hedges, L.V.; Higgins, J.P.T. Effect Sizes Based on Correlations. Introd. Meta-Anal. 2009, 2009, 41–43. [Google Scholar] [CrossRef]
- Jadad, A.R.; Moore, R.A.; Carroll, D.; Jenkinson, C.; Reynolds, D.J.; Gavaghan, D.J.; McQuay, H.J. Assessing the Quality of Reports of Randomized Clinical Trials: Is Blinding Necessary? Control. Clin. Trials 1996, 17, 1–12. [Google Scholar] [CrossRef]
- Haidari, F.; Samadi, M.; Mohammadshahi, M.; Jalali, M.T.; Engali, K.A. Energy Restriction Combined with Green Coffee Bean Extract Affects Serum Adipocytokines and the Body Composition in Obese Women. Asia Pac. J. Clin. Nutr. 2017, 26, 1048–1054. [Google Scholar]
- Alhamhany, N.N.; Alassady, E.H. Does Green Coffee has A Positive Effect on Body Mass Index and Lipid Profile in A Sample of Obese People. J. Pharm. Sci. Res. 2018, 10, 627–630. [Google Scholar]
- Sarriá, B.; Martínez-López, S.; Sierra-Cinos, J.L.; García-Diz, L.; Mateos, R.; Bravo-Clemente, L. Regularly Consuming A Green/Roasted Coffee Blend Reduces the Risk of Metabolic Syndrome. Eur. J. Nutr. 2018, 57, 269–278. [Google Scholar] [CrossRef] [Green Version]
- Kajikawa, M.; Maruhashi, T.; Hidaka, T.; Nakano, Y.; Kurisu, S.; Matsumoto, T.; Iwamoto, Y.; Kishimoto, S.; Matsui, S.; Aibara, Y.; et al. Coffee with A High Content of Chlorogenic Acids and Low Content of Hydroxyhydroquinone Improves Postprandial Endothelial Dysfunction in Patients with Borderline and Stage 1 Hypertension. Eur. J. Nutr. 2019, 58, 989–996. [Google Scholar] [CrossRef] [PubMed] [Green Version]
- Teng, C.L.; Lim, W.Y.; Chua, C.Z.; Teo, R.S.K.; Lin, K.T.H.; Yeo, J.C. Does A Single Cup of Caffeinated Drink Significantly Increase Blood Pressure in Young Adults? A Randomised Controlled Trial. Aust. Fam. Physician 2016, 45, 65–68. [Google Scholar] [PubMed]
- Alperet, D.J.; Rebello, S.A.; Khoo, E.Y.-H.; Tay, Z.; Seah, S.S.-Y.; Tai, B.-C.; Tai, E.S.; Emady-Azar, S.; Chou, C.J.; Darimont, C.; et al. The Effect of Coffee Consumption on Insulin Sensitivity and Other Biological Risk Factors for Type 2 Diabetes: A Randomized Placebo-Controlled Trial. Am. J. Clin. Nutr. 2019, 111, 448–458. [Google Scholar] [CrossRef] [PubMed]
- Roshan, H.; Nikpayam, O.; Sedaghat, M.; Sohrab, G. Effects of Green Coffee Extract Supplementation on Anthropometric Indices, Glycaemic Control, Blood Pressure, Lipid Profile, Insulin Resistance and Appetite in Patients with the Metabolic Syndrome: A Randomised Clinical Trial. Br. J. Nutr. 2018, 119, 250–258. [Google Scholar] [CrossRef] [PubMed] [Green Version]
- Al-Dujaili, E.A.S.; Abu Hajleh, M.N.; Al-Turk, W. Effect of Green Coffee Bean Extract Consumption on Blood Pressure and Anthropometric Measures in Healthy Volunteers: A Pilot Crossover Placebo Controlled Study. Jordan J. Pharm. Sci. 2016, 9, 181–191. [Google Scholar] [CrossRef] [Green Version]
- Beam, J.R.; Gibson, A.L.; Kerksick, C.M.; Conn, C.A.; White, A.C.; Mermier, C.M. Effect of Post-Exercise Caffeine and Green Coffee Bean Extract Consumption on Blood Glucose and Insulin Concentrations. Nutrients 2015, 31, 292–297. [Google Scholar] [CrossRef]
- Banitalebi, E.; Rahimi, A.; Faramarzi, M.; Ghahfarrokhi, M.M. The Effects of Elastic Resistance Band Training and Green Coffee Bean Extract Supplement on Novel Combined Indices of Cardiometabolic Risk in Obese Women. Res. Pharm. Sci. 2019, 14, 414–423. [Google Scholar] [CrossRef] [PubMed]
- Fasihi, M.; Yousefi, M.; Safaiyan, A.; Mele, M.M.; Rostami, M.; Barzegar, A. Effects of Green Coffee Extract Supplementation on Level of Chemerin, Malondialdehyde, Nutritional and Metabolic Status in Patients with Metabolic Syndrome. Nutr. Food Sci. 2019, 50, 21–33. [Google Scholar] [CrossRef]
- Watanabe, T.; Kobayashi, S.; Yamaguchi, T.; Hibi, M.; Fukuhara, I.; Osaki, N. Coffee Abundant in Chlorogenic Acids Reduces Abdominal Fat in Overweight Adults: A Randomized, Double-Blind, Controlled Trial. Nutrients 2019, 11, 1617. [Google Scholar] [CrossRef] [PubMed] [Green Version]
- Katada, S.; Watanabe, T.; Mizuno, T.; Kobayashi, S.; Takeshita, M.; Osaki, N.; Kobayashi, S.; Katsuragi, Y. Effects of Chlorogenic Acid-Enriched and Hydroxyhydroquinone-Reduced Coffee on Postprandial Fat Oxidation and Antioxidative Capacity in Healthy Men: A Randomized, Double-Blind, Placebo-Controlled, Crossover Trial. Nutrients 2018, 10, 525. [Google Scholar] [CrossRef] [PubMed] [Green Version]
- Agudelo-Ochoa, G.M.; Pulgarín-Zapata, I.C.; Velásquez-Rodríguez, C.; Duque-Ramírez, M.; Naranjo-Cano, M.; Quintero-Ortiz, M.M.; Lara-Guzman, O.J.; Muñoz-Durango, K. Coffee Consumption Increases the Antioxidant Capacity of Plasma and Has No Effect on the Lipid Profile or Vascular Function in Healthy Adults in a Randomized Controlled Trial. J. Nutr. 2016, 146, 524–531. [Google Scholar] [CrossRef] [PubMed] [Green Version]
- Salamat, S.; Mohammadshahi, F.H.M.; Haghighizadeh, M.H.; Heli, B. The Effect of Green Coffee Bean Extract Supplementation on Anthropometric Indices, Lipid Profile and High-Sensitivity C-Reactive Protein in Adult Men with Dyslipidemia. J. Biochem. Tech. 2018, 2, 75–81. [Google Scholar]
- Song, S.J.; Choi, S.; Park, T. Decaffeinated Green Coffee Bean Extract Attenuates Diet-Induced Obesity and Insulin Resistance in Mice. Evid.-Based Complement. Altern. Med. 2014, 2014, 718379. [Google Scholar] [CrossRef] [Green Version]
- Asbaghi, O.; Sadeghian, M.; Rahmani, S.; Mardani, M.; Khodadost, M.; Maleki, V.; Pirouzi, A.; Talebi, S.; Sadeghi, O. The Effect of Green Coffee Extract Supplementation on Anthropometric Measures in Adults: A Comprehensive Systematic Review and Dose-Response Meta-Analysis of Randomized Clinical Trials. Complement. Ther. Med. 2020, 51, 102424. [Google Scholar] [CrossRef]
- Shimoda, H.; Seki, E.; Aitani, M. Inhibitory Effect of Green Coffee Bean Extract on Fat Accumulation and Body Weight Gain in Mice. BMC Complement. Altern. Med. 2006, 6, 9. [Google Scholar] [CrossRef] [Green Version]
- Myers, J.; Kokkinos, P.; Nyelin, E. Physical Activity, Cardiorespiratory Fitness, and the Metabolic Syndrome. Endocrinol. Metab. Clin. N. Am. 2014, 43, 1–23. [Google Scholar] [CrossRef] [Green Version]
- Moghadam, S.H.; Ganji, J. Evaluation of the Nursing Process Utilization in A Teaching Hospital, Ogun State, Nigeria. J. Nurs. Midwifery Sci. 2019, 6, 149–155. [Google Scholar] [CrossRef]
- Farah, A.; Lima, J.D.P. Consumption of Chlorogenic Acids Through Coffee and Health Implications. Beverages 2019, 5, 11. [Google Scholar] [CrossRef] [Green Version]
- Rothberg, A.E.; McEwen, L.N.; Kraftson, A.T.; Ajluni, N.; Fowler, C.E.; Nay, C.K.; Miller, N.M.; Burant, C.F.; Herman, W.H. Impact of Weight Loss on Waist Circumference and The Components of The Metabolic Syndrome. BMJ Open Diabetes Res. Care 2017, 5, e000341. [Google Scholar] [CrossRef] [PubMed] [Green Version]
- Gómez-Juaristi, M.; Martínez-López, S.; Sarria, B.; Bravo, L.; Mateos, R. Bioavailability of Hydroxycinnamates in An Instant Green/Roasted Coffee Blend in Humans. Identification of Novel Colonic Metabolites. Food Funct. 2018, 9, 331–343. [Google Scholar] [CrossRef] [PubMed] [Green Version]
- Martínez-López, S.; Sarriá, B.; Baeza, G.; Mateos, R.; Bravo-Clemente, L. Pharmacokinetics of Caffeine and Its Metabolites in Plasma and Urine After Consuming A Soluble Green/Roasted Coffee Blend by Healthy Subjects. Food Res. Int. 2014, 64, 125–133. [Google Scholar] [CrossRef] [PubMed]
- Scalbert, A.; Morand, C.; Manach, C.; Remesy, C. Absorption and Metabolism of Polyphenols in the Gut and Impact on Health. Biomed. Pharmacother. 2002, 56, 276–282. [Google Scholar] [CrossRef]
- de Sotillo, D.V.R.; Hadley, M. Chlorogenic Acid Modifies Plasma and Liver Concentrations Of: Cholesterol, Triacylglycerol, and Minerals in (Fa/Fa) Zucker Rats. J. Nutr. Biochem. 2002, 13, 717–726. [Google Scholar] [CrossRef]
- Cho, A.-S.; Jeon, S.-M.; Kim, M.-J.; Yeo, J.; Seo, K.-I.; Choi, M.-S.; Lee, M.-K. Chlorogenic Acid Exhibits Anti-Obesity Property and Improves Lipid Metabolism in High-Fat Diet-Induced-Obese Mice. Food Chem. Toxicol. 2010, 48, 937–943. [Google Scholar] [CrossRef]
- Revuelta-Iniesta, R.; Al-Dujaili, E.A.S. Consumption of Green Coffee Reduces Blood Pressure and Body Composition by Influencing 11β-HSD1 Enzyme Activity in Healthy Individuals: A Pilot Crossover Study Using Green and Black Coffee. BioMed Res. Int. 2014, 2014, 482704. [Google Scholar] [CrossRef] [PubMed] [Green Version]
Publisher’s Note: MDPI stays neutral with regard to jurisdictional claims in published maps and institutional affiliations. |
© 2021 by the authors. Licensee MDPI, Basel, Switzerland. This article is an open access article distributed under the terms and conditions of the Creative Commons Attribution (CC BY) license (https://creativecommons.org/licenses/by/4.0/).