
Effects of Caffeinated and Decaffeinated Coffee Consumption on Metabolic Syndrome Parameters: A Systematic Review and Meta-Analysis of Data from Randomised Controlled Trials


Abstract
:1. Introduction
2. Materials and Methods
2.1. Eligibility Criteria
2.2. Search Strategy
2.3. Data Management and Analysis
2.4. Evaluation of Studies and Data Synthesis
3. Results
3.1. Study Selection
3.2. Study Characteristics
3.3. Risk of Biased Based on Jadad Scale
3.4. Summary of Systematic Review and Meta-Analysis
3.4.1. Effect of Coffee on Waist Circumference
3.4.2. Effect of Coffee on FBG Levels
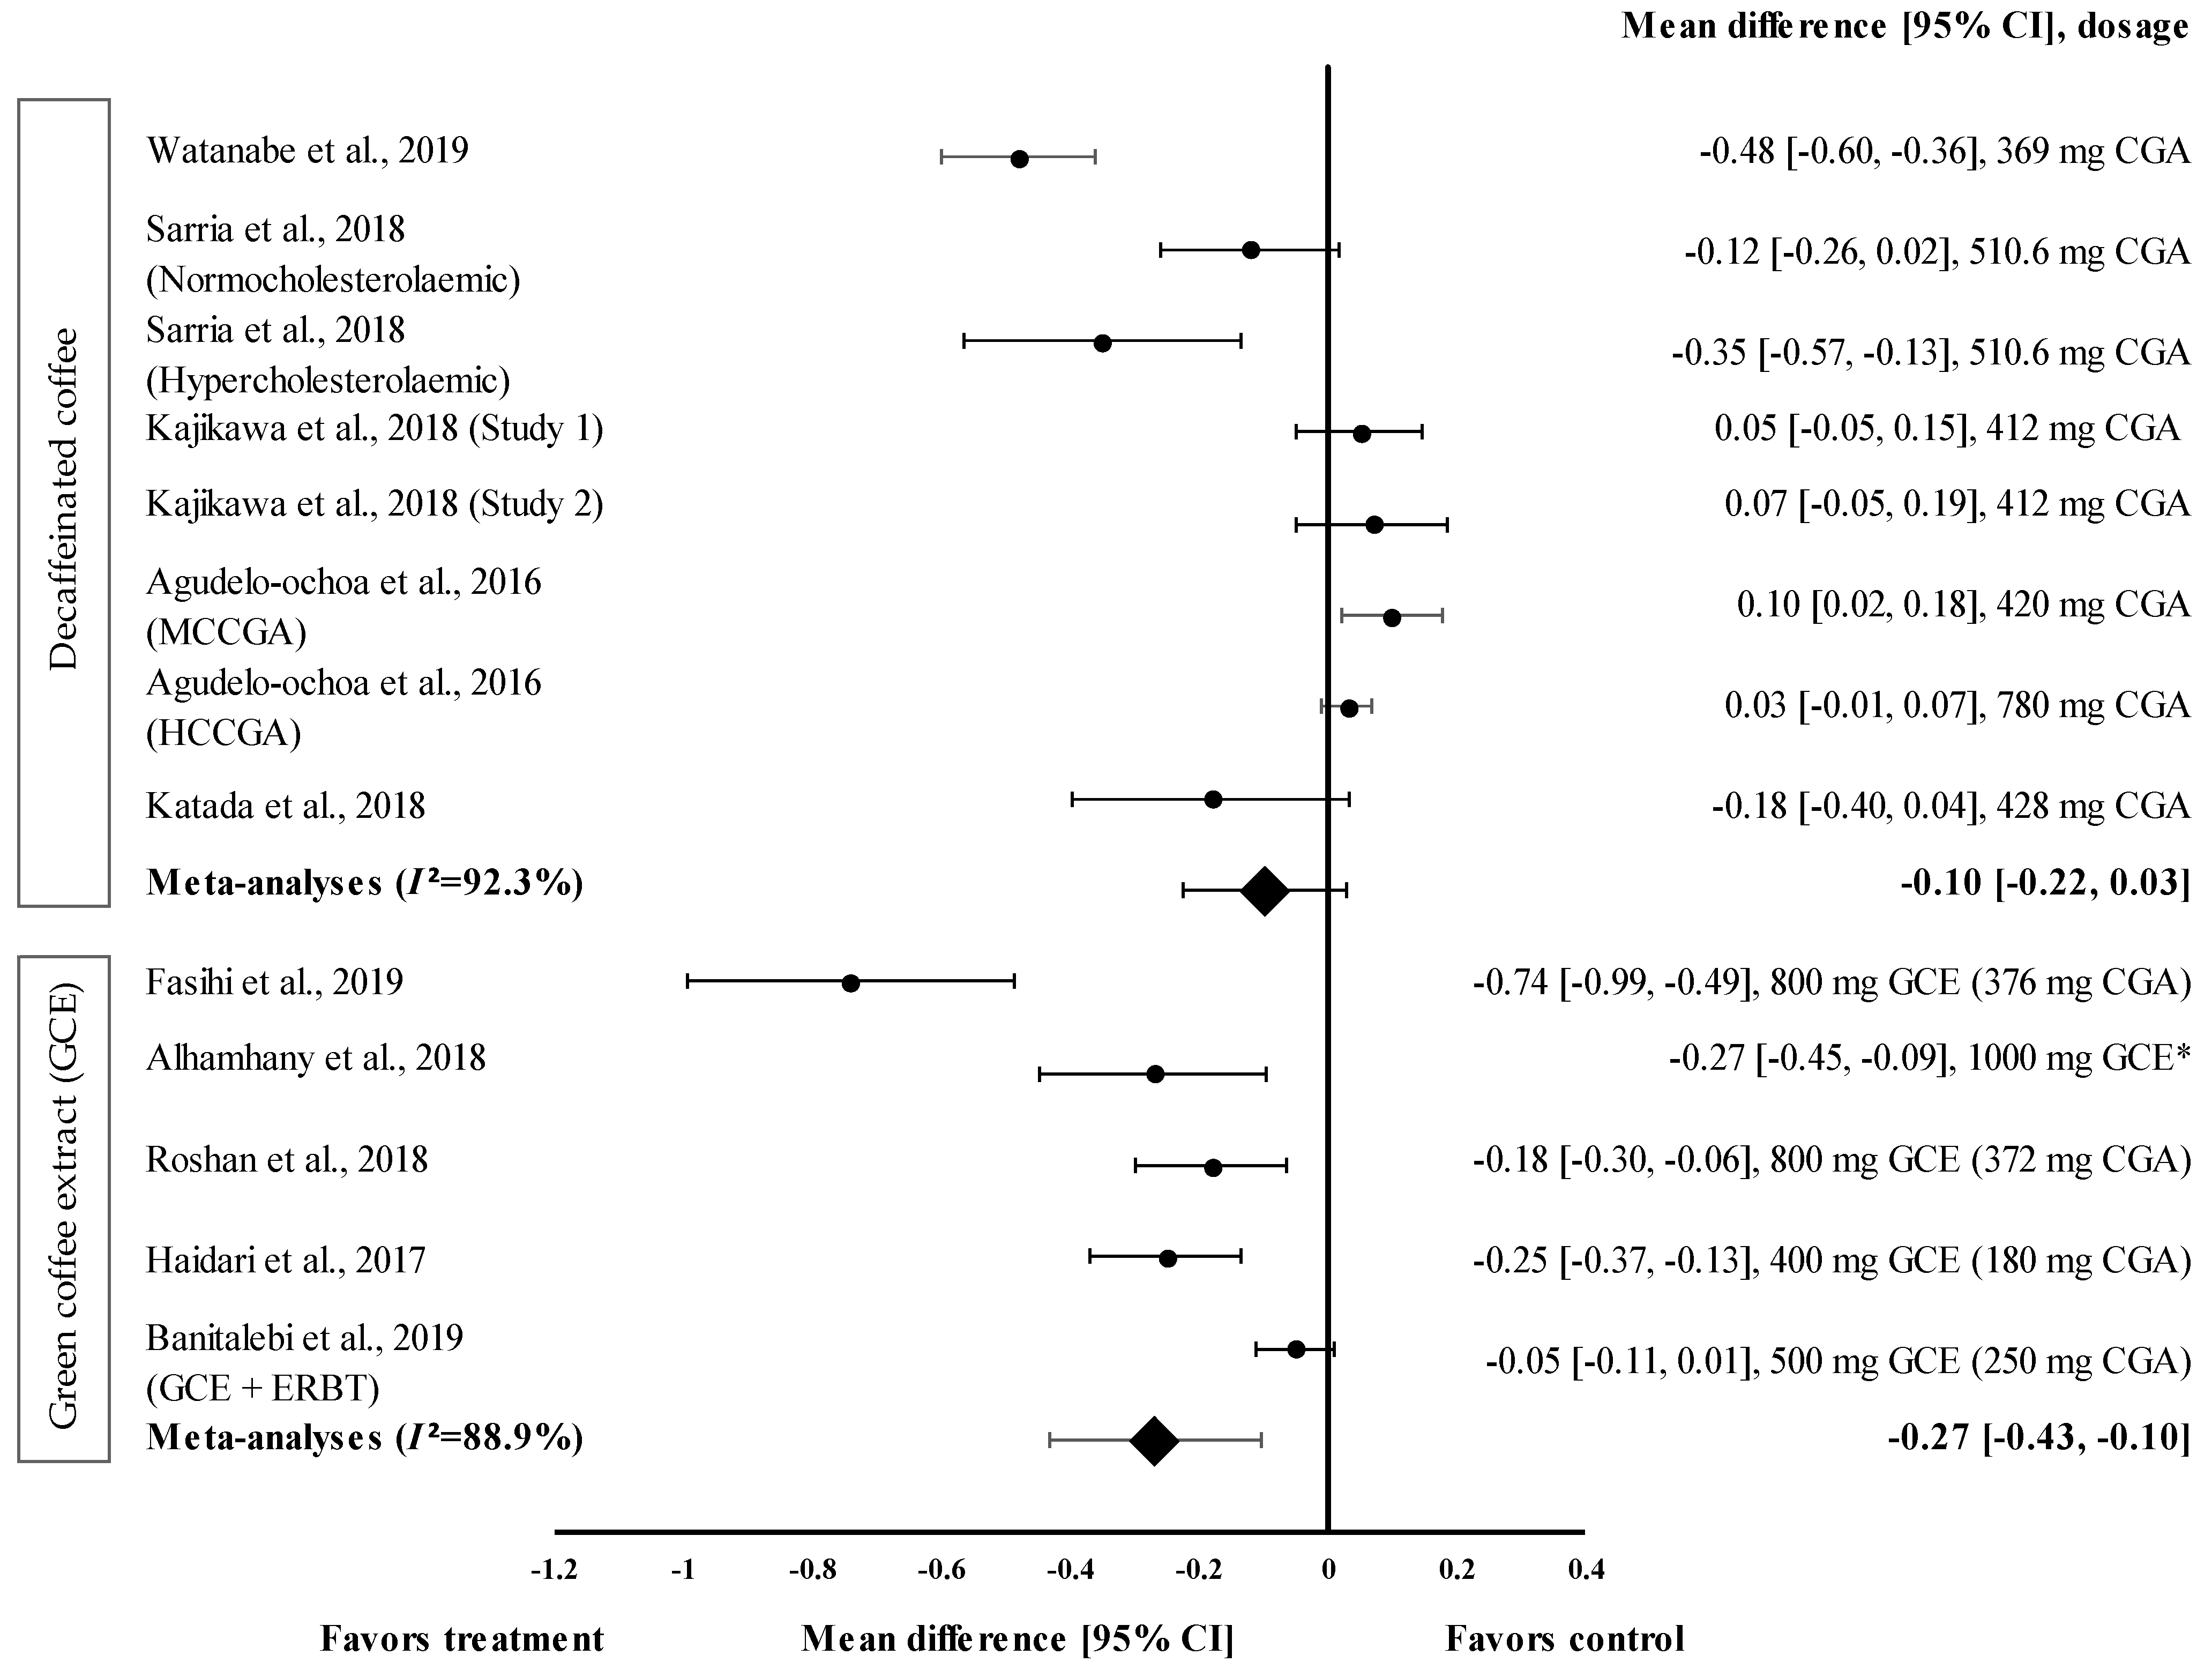
3.4.3. Effect of Coffee on TG Levels
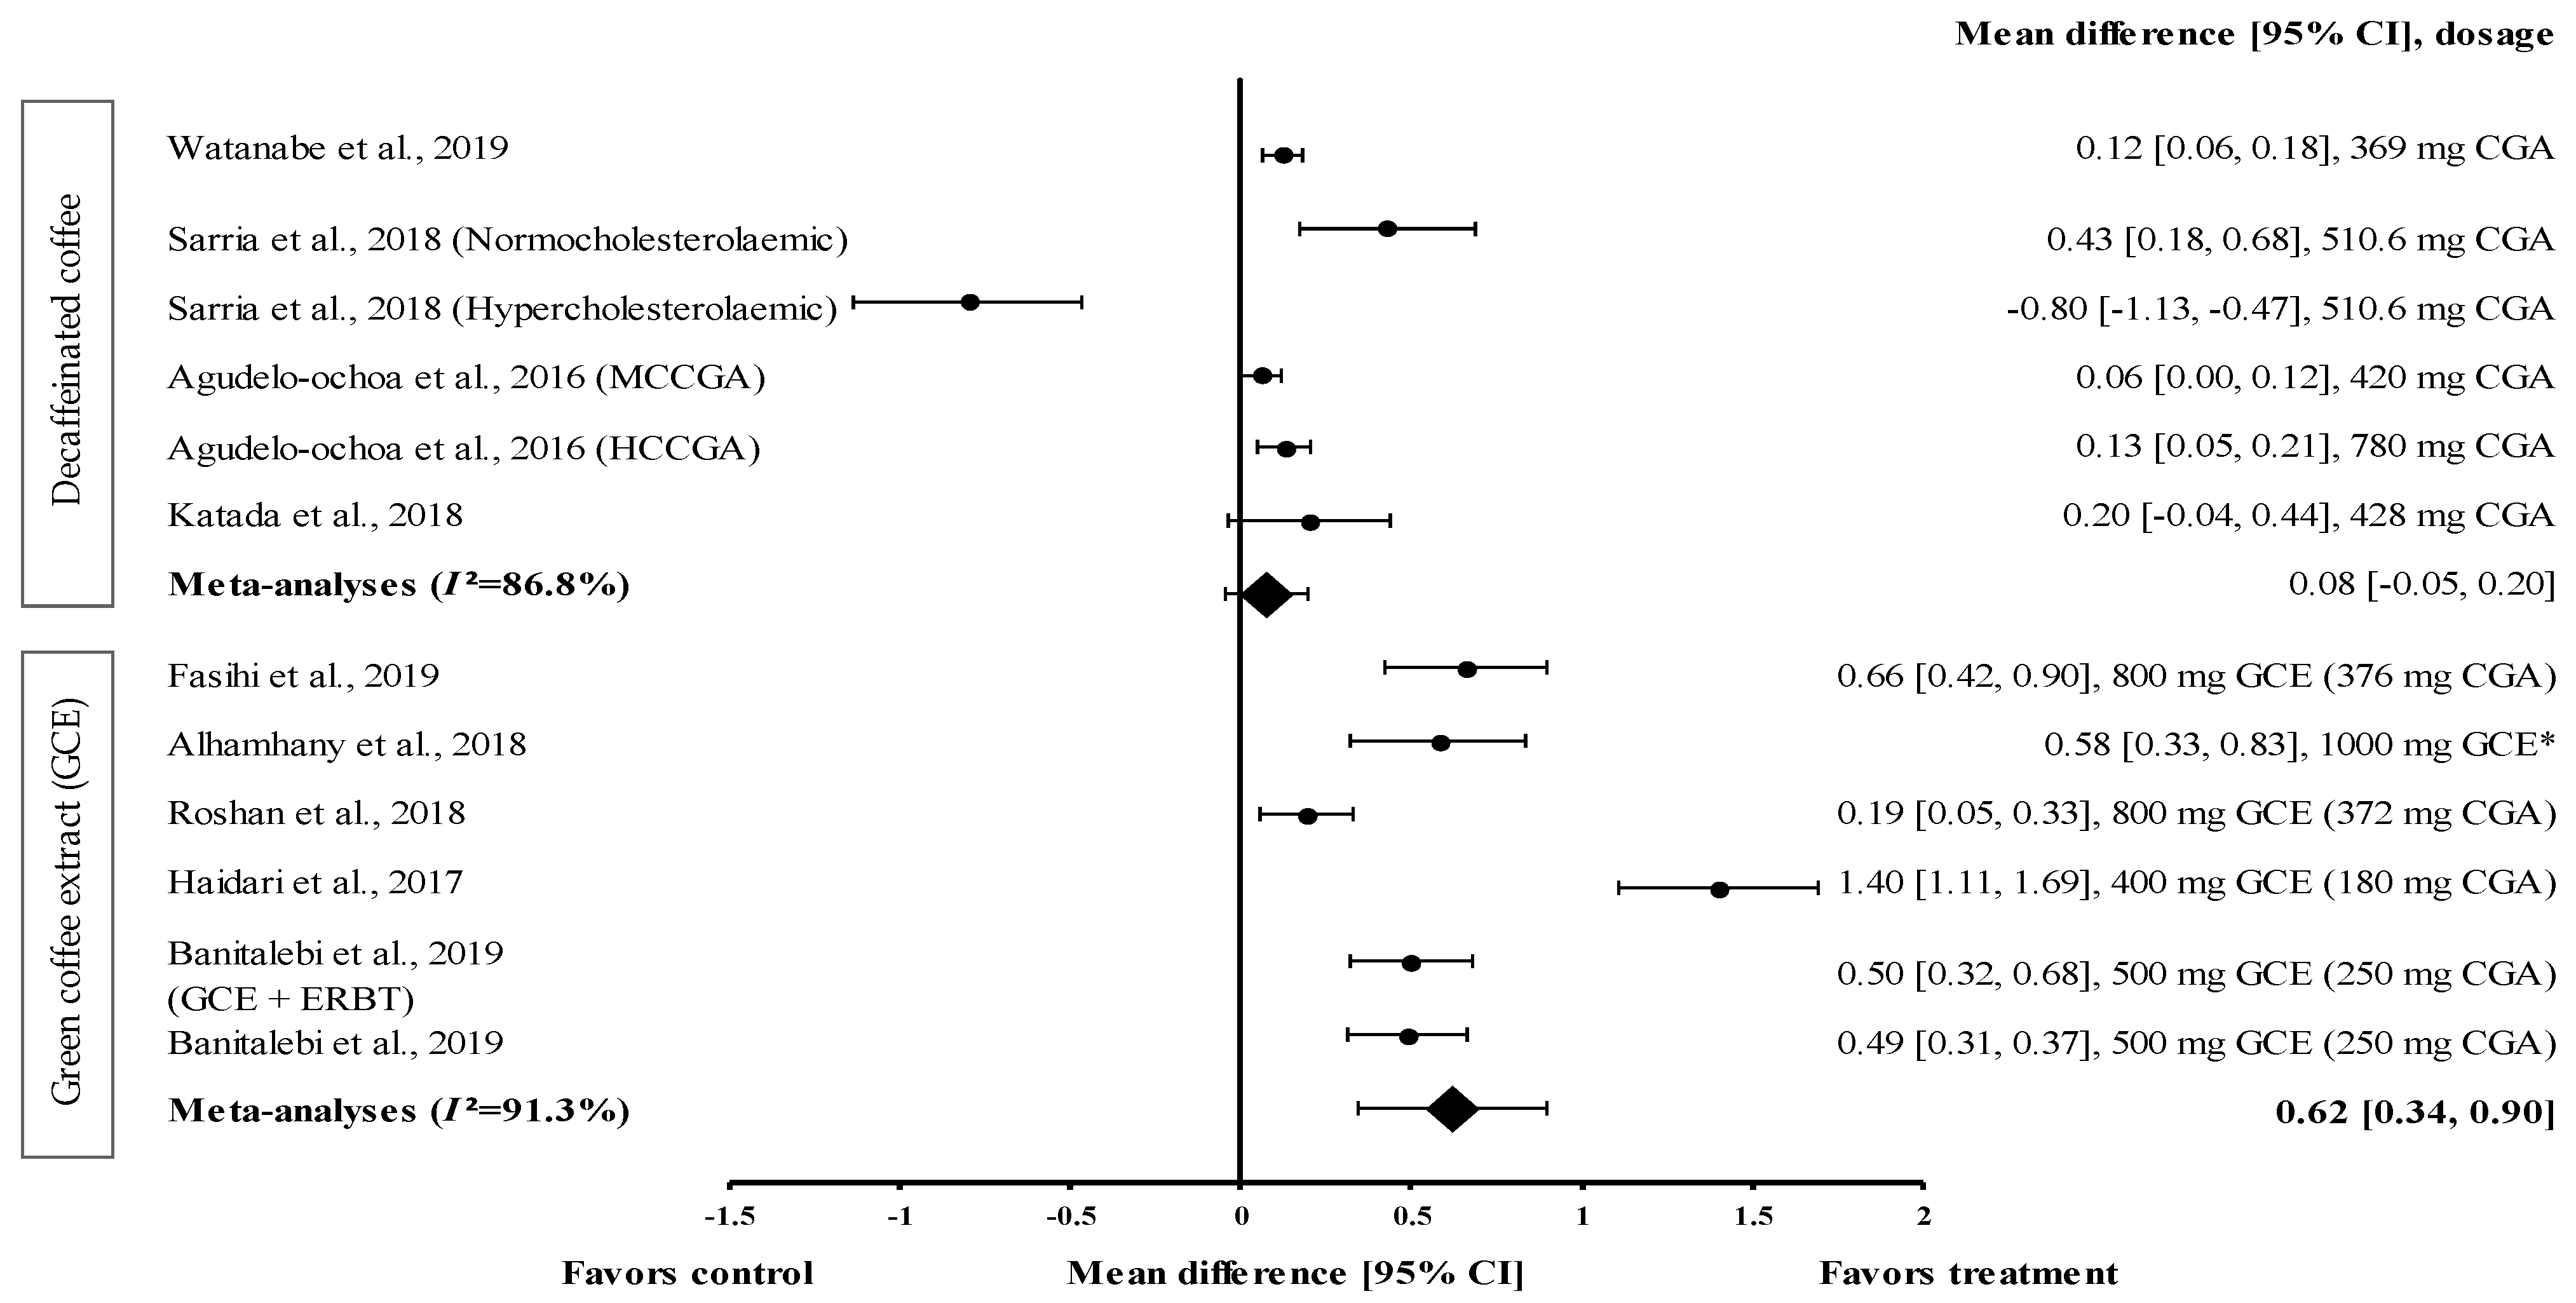
3.4.4. Effect of Coffee on HDL-c Levels
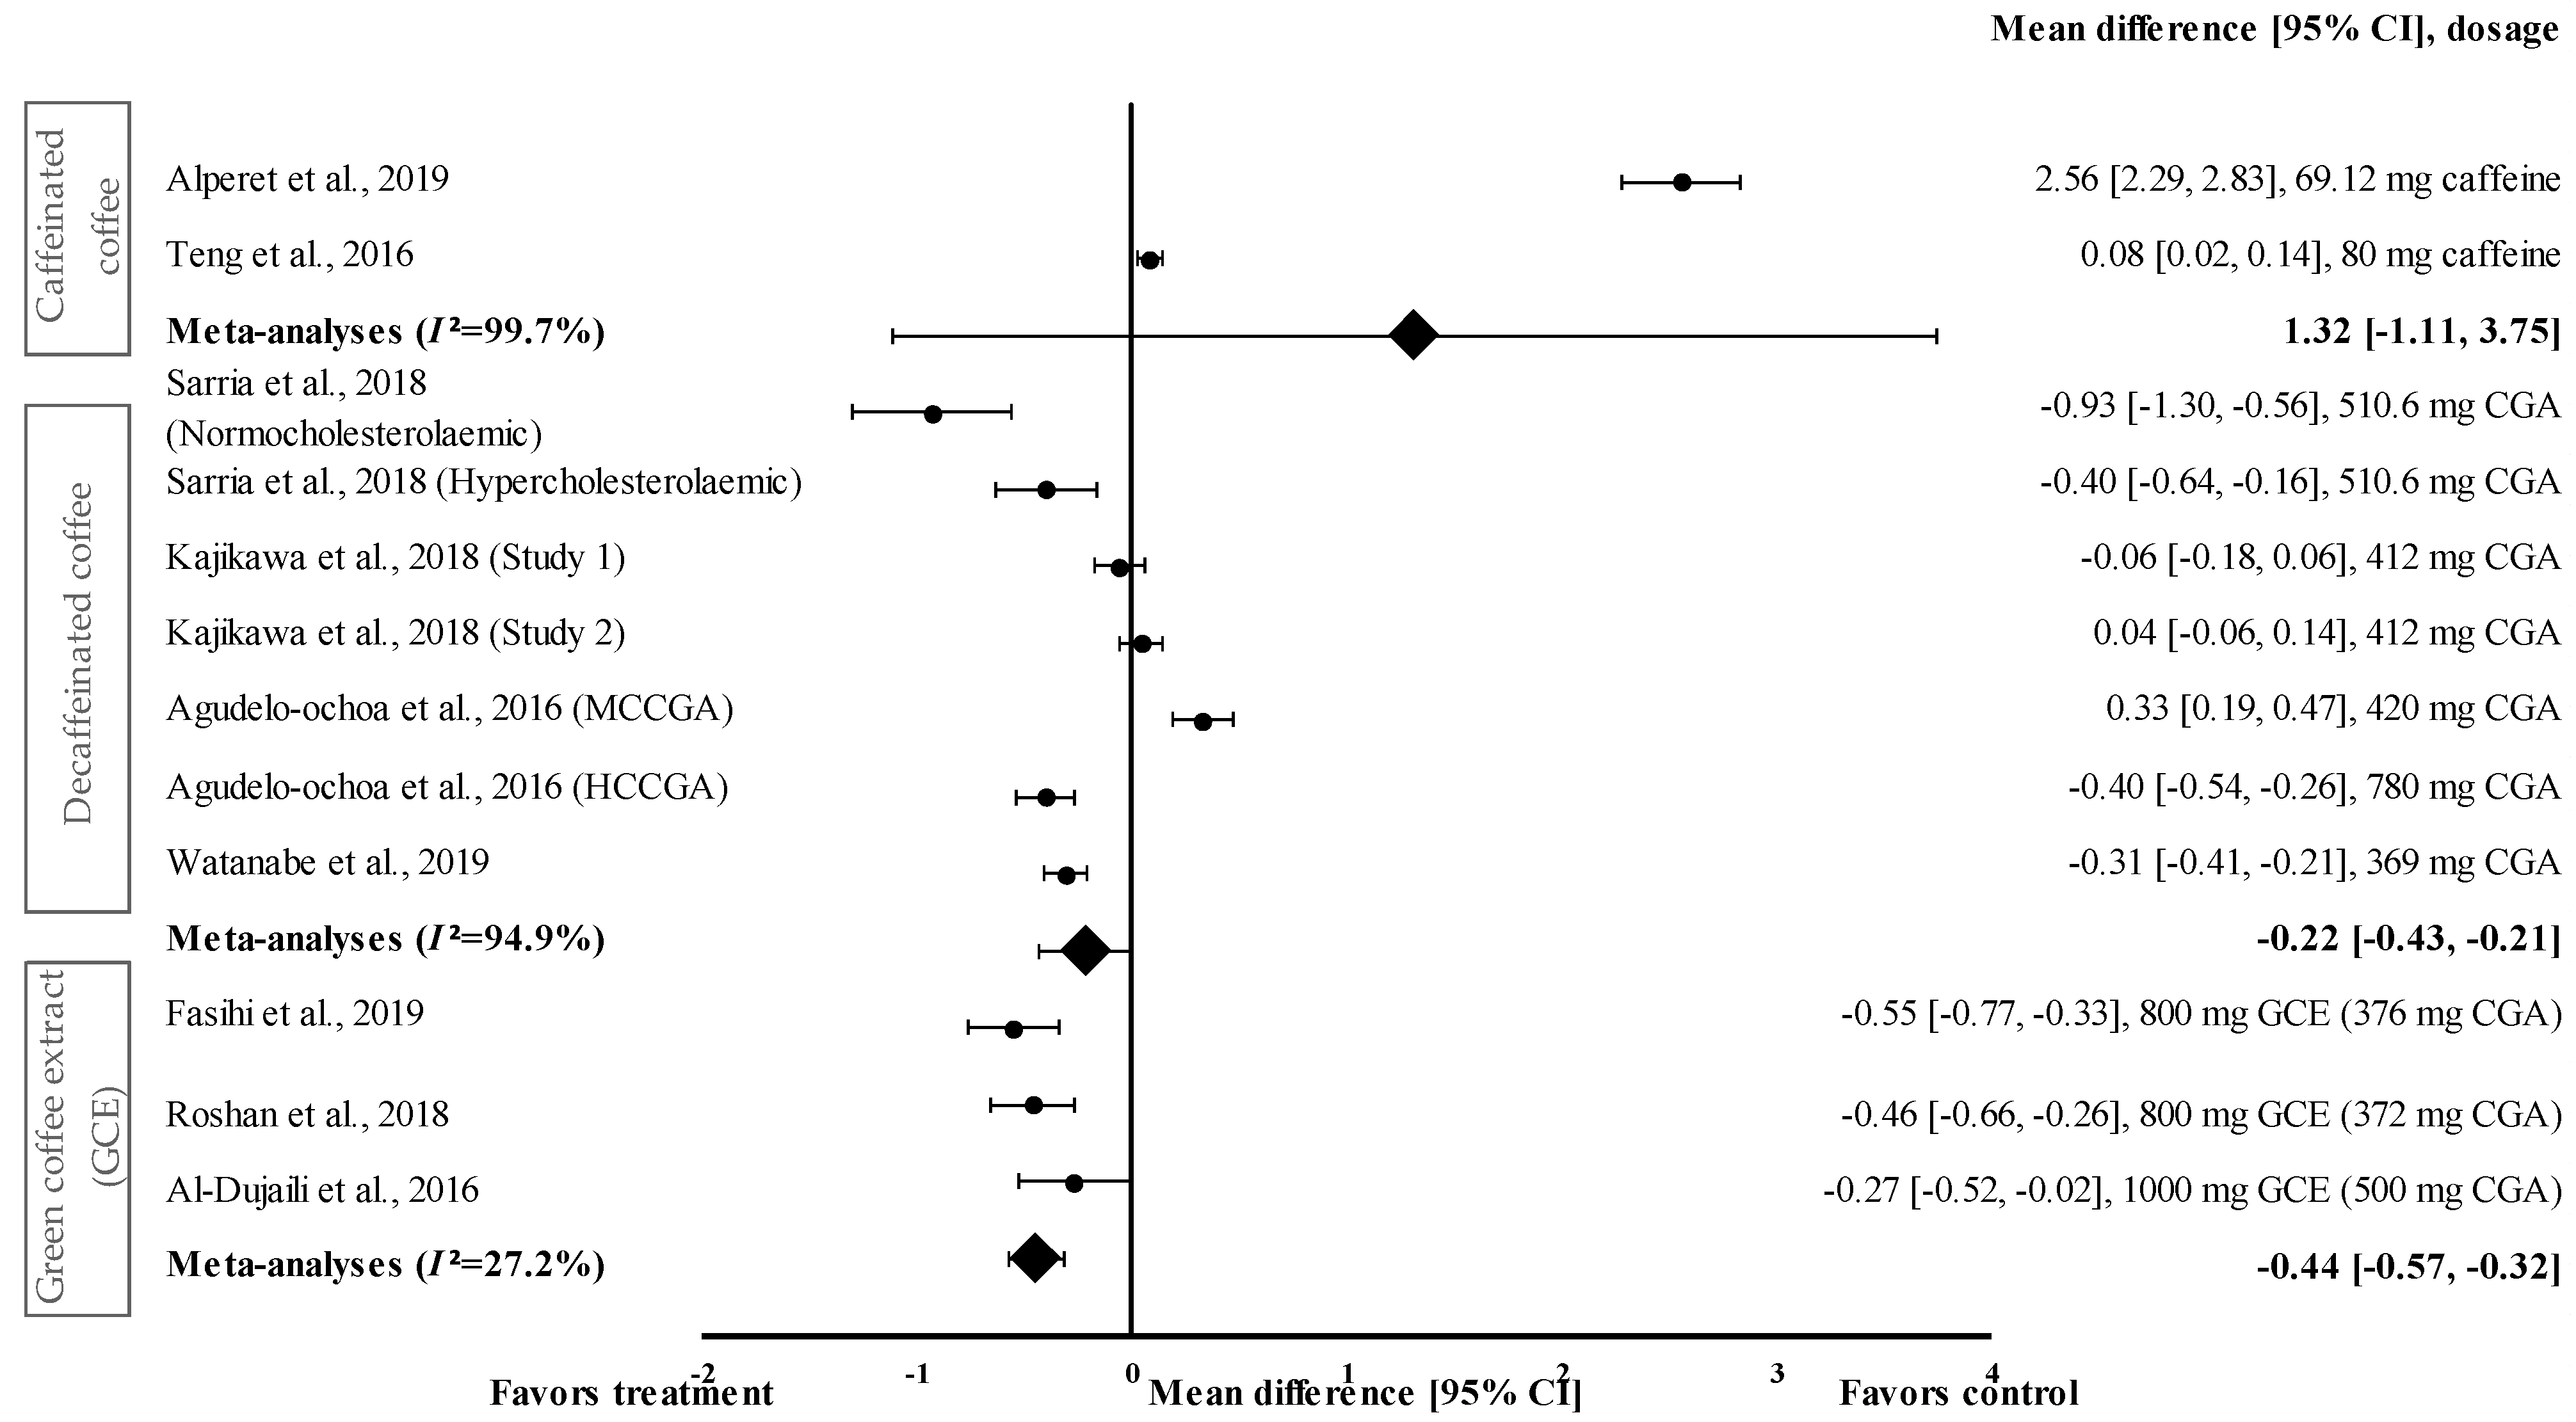
3.4.5. Effect of Coffee on SBP
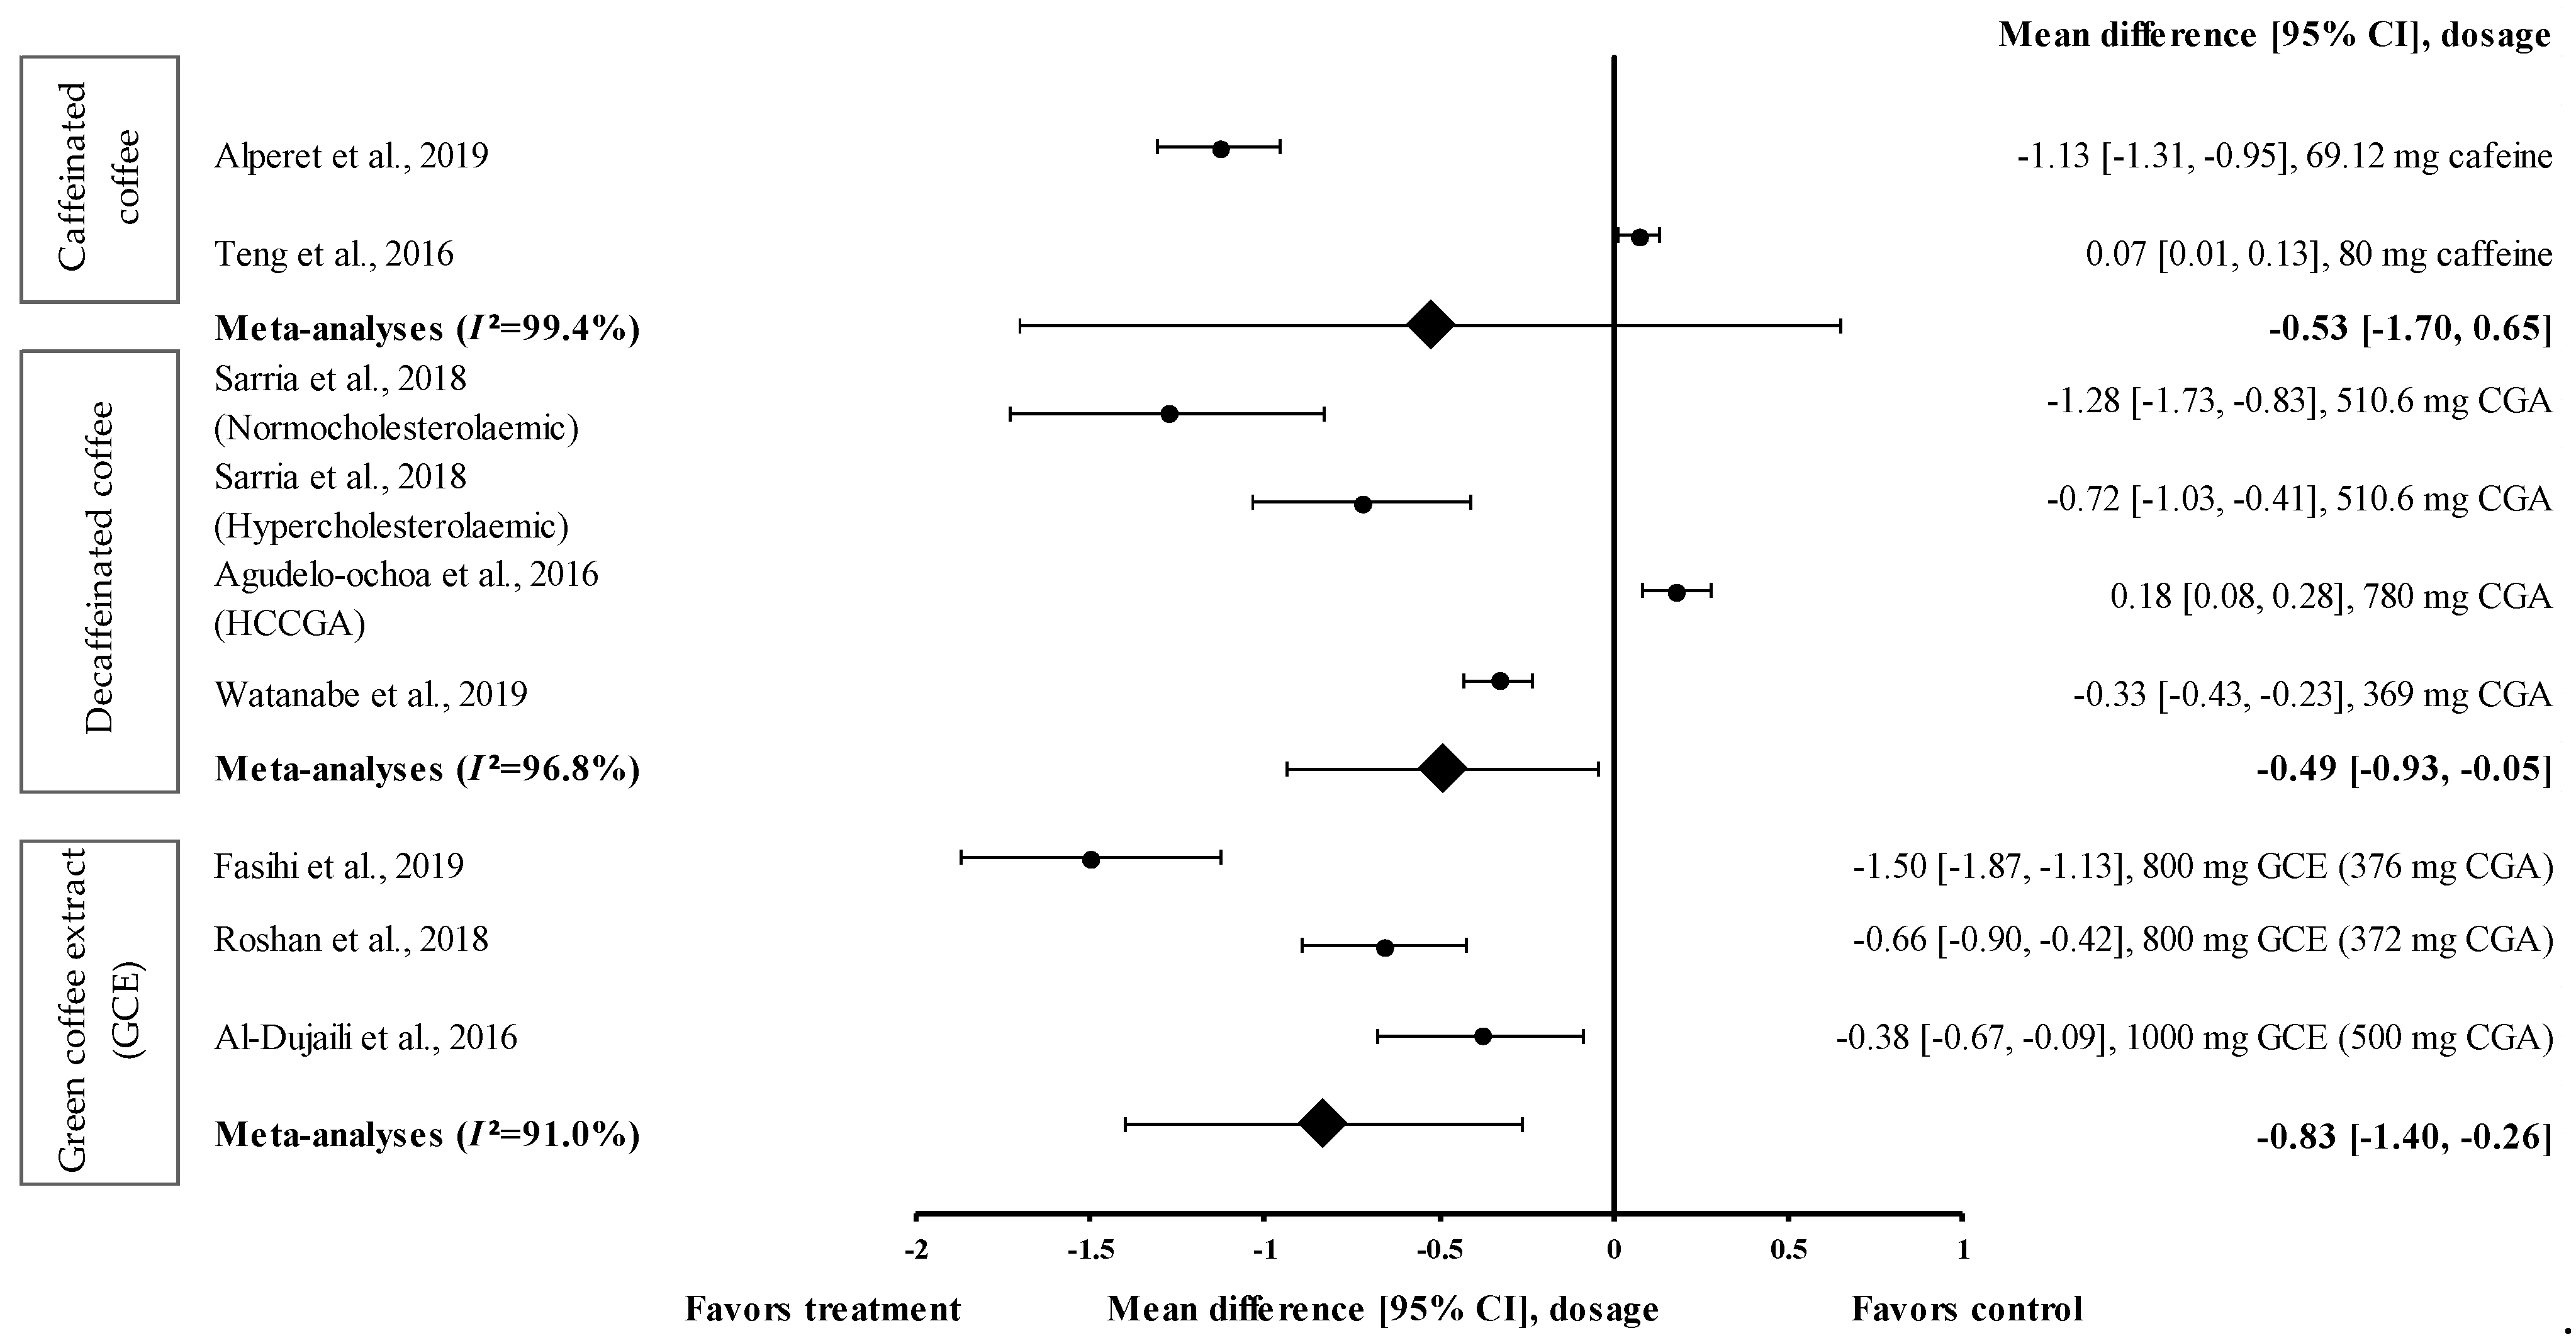
3.4.6. Effect of Coffee on DBP
4. Discussion
5. Conclusions
Author Contributions
Funding
Institutional Review Board Statement
Informed Consent Statement
Data Availability Statement
Conflicts of Interest
References
- Binesh Marvasti, T.; Adeli, K. Pharmacological Management of Metabolic Syndrome and Its Lipid Complications. J. Pharm. Sci. 2010, 18, 146–154. [Google Scholar]
- Grundy, S.M.; Brewer, H.B., Jr.; Cleeman, J.I.; Smith, S.C., Jr.; Lenfant, C. Definition of Metabolic Syndrome: Report of the National Heart, Lung, and Blood Institute/American Heart Association Conference on Scientific Issues Related to Definition. Circulation 2004, 109, 433–438. [Google Scholar] [CrossRef] [PubMed] [Green Version]
- Friend, A.; Craig, L.; Turner, S. The Prevalence of Metabolic Syndrome in Children: A Systematic Review of the Literature. Metab. Syndr. Relat. Disord. 2013, 11, 71–80. [Google Scholar] [CrossRef] [PubMed]
- Sigit, F.S.; Tahapary, D.L.; Trompet, S.; Sartono, E.; Van Dijk, K.W.; Rosendaal, F.R.; De Mutsert, R. The Prevalence of Metabolic Syndrome and Its Association With Body Fat Distribution in Middle-Aged Individuals from Indonesia and The Netherlands: A cross-sectional analysis of two population-based studies. Diabetol. Metab. Syndr. 2020, 12, 1–11. [Google Scholar] [CrossRef] [Green Version]
- Shang, F.; Li, X.; Jiang, X. Coffee Consumption and Risk of The Metabolic Syndrome: A Meta-Analysis. Diabetes Metab. 2016, 42, 80–87. [Google Scholar] [CrossRef] [PubMed]
- Wolska, J.; Janda, K.; Jakubczyk, K.; Szymkowiak, M.; Chlubek, D.; Gutowska, I. Levels of Antioxidant Activity and Fluoride Content in Coffee Infusions of Arabica, Robusta and Green Coffee Beans in According to their Brewing Methods. Biol. Trace Elem. Res. 2017, 179, 327–333. [Google Scholar] [CrossRef] [Green Version]
- Butt, M.S.; Sultan, M.T. Coffee and Its Consumption: Benefits and Risks. Crit. Rev. Food Sci. Nutr. 2011, 51, 363–373. [Google Scholar] [CrossRef]
- Gökcen, B.B.; Şanlier, N. Coffee Consumption and Disease Correlations. Crit. Rev. Food Sci. Nutr. 2019, 59, 336–348. [Google Scholar] [CrossRef]
- Hollands, M.A.; Arch, J.R.S.; Cawthorne, M.A. A Simple Apparatus for Comparative Measurements of Energy Expenditure in Human Subjects: The Thermic Effect of Caffeine. Am. J. Clin. Nutr. 1981, 34, 2291–2294. [Google Scholar] [CrossRef]
- Acheson, K.J.; Zahorska-Markiewicz, B.; Pittet, P.; Anantharaman, K.; Jéquier, E. Caffeine and Coffee: Their Influence on Metabolic Rate and Substrate Utilization in Normal Weight and Obese Individuals. Am. J. Clin. Nutr. 1980, 33, 989–997. [Google Scholar] [CrossRef]
- Bracco, D.; Ferrarra, J.M.; Arnaud, M.J.; Jequier, E.; Schutz, Y. Effects of Caffeine on Energy Metabolism, Heart Rate, and Methylxanthine Metabolism in Lean and Obese Women. Am. J. Physiol. Metab. 1995, 269 Pt 1, E671–E678. [Google Scholar] [CrossRef] [PubMed]
- Costill, D.L.; Dalsky, G.P.; Fink, W.J. Effects of Caffeine Ingestion on Metabolism and Exercise Performance. Med. Sci. Sports 1978, 10, 155–158. [Google Scholar] [PubMed]
- Daubresse, J.-C.; Luyckx, A.; Demey-Ponsart, E.; Franchimont, P.; Lefebvre, P. Effects of Coffee and Caffeine on Carbohydrate Metabolism, Free Fatty Acid, Insulin, Growth Hormone and Cortisol Plasma Levels in Man. Acta Diabetol. 1973, 10, 1069–1084. [Google Scholar] [CrossRef]
- Sawynok, J.; Yaksh, T.L. Caffeine as An Analgesic Adjuvant: A Review of Pharmacology and Mechanisms of Action. Pharmacol. Rev. 1993, 45, 43–85. [Google Scholar]
- Battram, D.S.; Arthur, R.; Weekes, A.; Graham, T.E. The Glucose Intolerance Induced by Caffeinated Coffee Ingestion Is Less Pronounced than That Due to Alkaloid Caffeine in Men. J. Nutr. 2006, 136, 1276–1280. [Google Scholar] [CrossRef] [PubMed] [Green Version]
- Neath, I. Effect Size Calculator. Available online: https://memory.psych.mun.ca/models/stats/effect_size.shtml (accessed on 29 January 2021).
- Neyeloff, J.L.; Fuchs, S.C.; Moreira, L.B. Meta-Analyses and Forest Plots Using a Microsoft Excel Spreadsheet: Step-by-Step Guide Focusing on Descriptive Data Analysis. BMC Res. Notes 2012, 5, 52. [Google Scholar] [CrossRef] [PubMed] [Green Version]
- Rothstein, H.R.; Borenstein, M.; Hedges, L.V.; Higgins, J.P.T. Effect Sizes Based on Correlations. Introd. Meta-Anal. 2009, 2009, 41–43. [Google Scholar] [CrossRef]
- Jadad, A.R.; Moore, R.A.; Carroll, D.; Jenkinson, C.; Reynolds, D.J.; Gavaghan, D.J.; McQuay, H.J. Assessing the Quality of Reports of Randomized Clinical Trials: Is Blinding Necessary? Control. Clin. Trials 1996, 17, 1–12. [Google Scholar] [CrossRef]
- Haidari, F.; Samadi, M.; Mohammadshahi, M.; Jalali, M.T.; Engali, K.A. Energy Restriction Combined with Green Coffee Bean Extract Affects Serum Adipocytokines and the Body Composition in Obese Women. Asia Pac. J. Clin. Nutr. 2017, 26, 1048–1054. [Google Scholar]
- Alhamhany, N.N.; Alassady, E.H. Does Green Coffee has A Positive Effect on Body Mass Index and Lipid Profile in A Sample of Obese People. J. Pharm. Sci. Res. 2018, 10, 627–630. [Google Scholar]
- Sarriá, B.; Martínez-López, S.; Sierra-Cinos, J.L.; García-Diz, L.; Mateos, R.; Bravo-Clemente, L. Regularly Consuming A Green/Roasted Coffee Blend Reduces the Risk of Metabolic Syndrome. Eur. J. Nutr. 2018, 57, 269–278. [Google Scholar] [CrossRef] [Green Version]
- Kajikawa, M.; Maruhashi, T.; Hidaka, T.; Nakano, Y.; Kurisu, S.; Matsumoto, T.; Iwamoto, Y.; Kishimoto, S.; Matsui, S.; Aibara, Y.; et al. Coffee with A High Content of Chlorogenic Acids and Low Content of Hydroxyhydroquinone Improves Postprandial Endothelial Dysfunction in Patients with Borderline and Stage 1 Hypertension. Eur. J. Nutr. 2019, 58, 989–996. [Google Scholar] [CrossRef] [PubMed] [Green Version]
- Teng, C.L.; Lim, W.Y.; Chua, C.Z.; Teo, R.S.K.; Lin, K.T.H.; Yeo, J.C. Does A Single Cup of Caffeinated Drink Significantly Increase Blood Pressure in Young Adults? A Randomised Controlled Trial. Aust. Fam. Physician 2016, 45, 65–68. [Google Scholar] [PubMed]
- Alperet, D.J.; Rebello, S.A.; Khoo, E.Y.-H.; Tay, Z.; Seah, S.S.-Y.; Tai, B.-C.; Tai, E.S.; Emady-Azar, S.; Chou, C.J.; Darimont, C.; et al. The Effect of Coffee Consumption on Insulin Sensitivity and Other Biological Risk Factors for Type 2 Diabetes: A Randomized Placebo-Controlled Trial. Am. J. Clin. Nutr. 2019, 111, 448–458. [Google Scholar] [CrossRef] [PubMed]
- Roshan, H.; Nikpayam, O.; Sedaghat, M.; Sohrab, G. Effects of Green Coffee Extract Supplementation on Anthropometric Indices, Glycaemic Control, Blood Pressure, Lipid Profile, Insulin Resistance and Appetite in Patients with the Metabolic Syndrome: A Randomised Clinical Trial. Br. J. Nutr. 2018, 119, 250–258. [Google Scholar] [CrossRef] [PubMed] [Green Version]
- Al-Dujaili, E.A.S.; Abu Hajleh, M.N.; Al-Turk, W. Effect of Green Coffee Bean Extract Consumption on Blood Pressure and Anthropometric Measures in Healthy Volunteers: A Pilot Crossover Placebo Controlled Study. Jordan J. Pharm. Sci. 2016, 9, 181–191. [Google Scholar] [CrossRef] [Green Version]
- Beam, J.R.; Gibson, A.L.; Kerksick, C.M.; Conn, C.A.; White, A.C.; Mermier, C.M. Effect of Post-Exercise Caffeine and Green Coffee Bean Extract Consumption on Blood Glucose and Insulin Concentrations. Nutrients 2015, 31, 292–297. [Google Scholar] [CrossRef]
- Banitalebi, E.; Rahimi, A.; Faramarzi, M.; Ghahfarrokhi, M.M. The Effects of Elastic Resistance Band Training and Green Coffee Bean Extract Supplement on Novel Combined Indices of Cardiometabolic Risk in Obese Women. Res. Pharm. Sci. 2019, 14, 414–423. [Google Scholar] [CrossRef] [PubMed]
- Fasihi, M.; Yousefi, M.; Safaiyan, A.; Mele, M.M.; Rostami, M.; Barzegar, A. Effects of Green Coffee Extract Supplementation on Level of Chemerin, Malondialdehyde, Nutritional and Metabolic Status in Patients with Metabolic Syndrome. Nutr. Food Sci. 2019, 50, 21–33. [Google Scholar] [CrossRef]
- Watanabe, T.; Kobayashi, S.; Yamaguchi, T.; Hibi, M.; Fukuhara, I.; Osaki, N. Coffee Abundant in Chlorogenic Acids Reduces Abdominal Fat in Overweight Adults: A Randomized, Double-Blind, Controlled Trial. Nutrients 2019, 11, 1617. [Google Scholar] [CrossRef] [PubMed] [Green Version]
- Katada, S.; Watanabe, T.; Mizuno, T.; Kobayashi, S.; Takeshita, M.; Osaki, N.; Kobayashi, S.; Katsuragi, Y. Effects of Chlorogenic Acid-Enriched and Hydroxyhydroquinone-Reduced Coffee on Postprandial Fat Oxidation and Antioxidative Capacity in Healthy Men: A Randomized, Double-Blind, Placebo-Controlled, Crossover Trial. Nutrients 2018, 10, 525. [Google Scholar] [CrossRef] [PubMed] [Green Version]
- Agudelo-Ochoa, G.M.; Pulgarín-Zapata, I.C.; Velásquez-Rodríguez, C.; Duque-Ramírez, M.; Naranjo-Cano, M.; Quintero-Ortiz, M.M.; Lara-Guzman, O.J.; Muñoz-Durango, K. Coffee Consumption Increases the Antioxidant Capacity of Plasma and Has No Effect on the Lipid Profile or Vascular Function in Healthy Adults in a Randomized Controlled Trial. J. Nutr. 2016, 146, 524–531. [Google Scholar] [CrossRef] [PubMed] [Green Version]
- Salamat, S.; Mohammadshahi, F.H.M.; Haghighizadeh, M.H.; Heli, B. The Effect of Green Coffee Bean Extract Supplementation on Anthropometric Indices, Lipid Profile and High-Sensitivity C-Reactive Protein in Adult Men with Dyslipidemia. J. Biochem. Tech. 2018, 2, 75–81. [Google Scholar]
- Song, S.J.; Choi, S.; Park, T. Decaffeinated Green Coffee Bean Extract Attenuates Diet-Induced Obesity and Insulin Resistance in Mice. Evid.-Based Complement. Altern. Med. 2014, 2014, 718379. [Google Scholar] [CrossRef] [Green Version]
- Asbaghi, O.; Sadeghian, M.; Rahmani, S.; Mardani, M.; Khodadost, M.; Maleki, V.; Pirouzi, A.; Talebi, S.; Sadeghi, O. The Effect of Green Coffee Extract Supplementation on Anthropometric Measures in Adults: A Comprehensive Systematic Review and Dose-Response Meta-Analysis of Randomized Clinical Trials. Complement. Ther. Med. 2020, 51, 102424. [Google Scholar] [CrossRef]
- Shimoda, H.; Seki, E.; Aitani, M. Inhibitory Effect of Green Coffee Bean Extract on Fat Accumulation and Body Weight Gain in Mice. BMC Complement. Altern. Med. 2006, 6, 9. [Google Scholar] [CrossRef] [Green Version]
- Myers, J.; Kokkinos, P.; Nyelin, E. Physical Activity, Cardiorespiratory Fitness, and the Metabolic Syndrome. Endocrinol. Metab. Clin. N. Am. 2014, 43, 1–23. [Google Scholar] [CrossRef] [Green Version]
- Moghadam, S.H.; Ganji, J. Evaluation of the Nursing Process Utilization in A Teaching Hospital, Ogun State, Nigeria. J. Nurs. Midwifery Sci. 2019, 6, 149–155. [Google Scholar] [CrossRef]
- Farah, A.; Lima, J.D.P. Consumption of Chlorogenic Acids Through Coffee and Health Implications. Beverages 2019, 5, 11. [Google Scholar] [CrossRef] [Green Version]
- Rothberg, A.E.; McEwen, L.N.; Kraftson, A.T.; Ajluni, N.; Fowler, C.E.; Nay, C.K.; Miller, N.M.; Burant, C.F.; Herman, W.H. Impact of Weight Loss on Waist Circumference and The Components of The Metabolic Syndrome. BMJ Open Diabetes Res. Care 2017, 5, e000341. [Google Scholar] [CrossRef] [PubMed] [Green Version]
- Gómez-Juaristi, M.; Martínez-López, S.; Sarria, B.; Bravo, L.; Mateos, R. Bioavailability of Hydroxycinnamates in An Instant Green/Roasted Coffee Blend in Humans. Identification of Novel Colonic Metabolites. Food Funct. 2018, 9, 331–343. [Google Scholar] [CrossRef] [PubMed] [Green Version]
- Martínez-López, S.; Sarriá, B.; Baeza, G.; Mateos, R.; Bravo-Clemente, L. Pharmacokinetics of Caffeine and Its Metabolites in Plasma and Urine After Consuming A Soluble Green/Roasted Coffee Blend by Healthy Subjects. Food Res. Int. 2014, 64, 125–133. [Google Scholar] [CrossRef] [PubMed]
- Scalbert, A.; Morand, C.; Manach, C.; Remesy, C. Absorption and Metabolism of Polyphenols in the Gut and Impact on Health. Biomed. Pharmacother. 2002, 56, 276–282. [Google Scholar] [CrossRef]
- de Sotillo, D.V.R.; Hadley, M. Chlorogenic Acid Modifies Plasma and Liver Concentrations Of: Cholesterol, Triacylglycerol, and Minerals in (Fa/Fa) Zucker Rats. J. Nutr. Biochem. 2002, 13, 717–726. [Google Scholar] [CrossRef]
- Cho, A.-S.; Jeon, S.-M.; Kim, M.-J.; Yeo, J.; Seo, K.-I.; Choi, M.-S.; Lee, M.-K. Chlorogenic Acid Exhibits Anti-Obesity Property and Improves Lipid Metabolism in High-Fat Diet-Induced-Obese Mice. Food Chem. Toxicol. 2010, 48, 937–943. [Google Scholar] [CrossRef]
- Revuelta-Iniesta, R.; Al-Dujaili, E.A.S. Consumption of Green Coffee Reduces Blood Pressure and Body Composition by Influencing 11β-HSD1 Enzyme Activity in Healthy Individuals: A Pilot Crossover Study Using Green and Black Coffee. BioMed Res. Int. 2014, 2014, 482704. [Google Scholar] [CrossRef] [PubMed] [Green Version]


| Author and Country | Study Overview | Change from Final vs. Baseline 1 | Percent Reduction or Increment (%) | p-Value | Calculated Effect Size (ES) | ||
|---|---|---|---|---|---|---|---|
| Intervention | Control | Intervention | Control | ||||
| Green coffee extract (GCE) (all in capsule form) | |||||||
| Haidari et al., 2017 [20] Country: Iran | Subject: F: 64 (20–45 years), intervention: 30, control: 34 Study design: randomised, double-blinded, parallel Study duration: 8 weeks MeTS outcome: obesity (FMI: ≥8.7 kg/m2) Intervention: 400 mg/d GCE containing 180 mg CGA Control: 400 mg starch | FBG: −0.05 ± 0.08 mmol/L | FBG: −0.02 ± 0.07 mmol/L | FBG: −1.1 | FBG: −0.4 | FBG: 0.8 # | FBG: −0.07 |
| TG: −0.04 ± 0.09 mmol/L HDL-c: 0.03 ± 0.01 mmol/l | TG: −0.06 ± 0.07 mmol/L HDL-c: −0.05 ± 0.004 mmol/L | TG: −2.2 HDL-c: 2.4 | TG: −3.4 HDL-c: −3.9 | TG: 0.07 # HDL-c: 0.15 # | TG: −0.25 HDL-c: 1.40 | ||
| Alhamhany et al., 2018 [21] Country: Iraq | Subject: M/F: 35 (20–55 years) Study design: randomised, crossover, single-arm Study duration: 6 weeks MeTS outcome: overweight/obesity (BMI: ≥25 kg/m2) Intervention: 1000 mg GCE Control: not available | FBG: −0.77 ± 0.27 mmol/L | N/A * | FBG: −14.8 | N/A * | 0.001 # | −0.48 |
| TG: −0.19 ± 0.17 mmol/L HDL-c 0.14 ± 0.06 mmol/L | N/A * | TG: −10.7 HDL-c: 15.6 | N/A * | TG: 0.061 # HDL-c: 0.03 # | TG: −0.27 HDL-c: 0.58 | ||
| Roshan et al., 2018 [26] Country: Iran | Subject: M/F: 43 (18–70 years), intervention: 21, control: 22 Study design: randomised, double-blinded, parallel Study duration: 8 weeks MeTS outcome: metabolic syndrome (according to IDF 3 guidelines) Intervention: 800 mg/d of GCE containing 372 mg CGA Control: 800 mg starch | WC: −2.40 ± 2.54 cm | WC: −0.66 ± 1.17 cm | WC: −2.3 | WC: −0.6 | WC: 0.009 * | WC: −0.42 |
| FBG: −0.28 ± 3.34 mmol/L | FBG: 1.63 ± 2.22 mmol/L | FBG: −3.3 | FBG: 22.4 | FBG: 0.036 * | FBG: −0.28 | ||
| TG: −0.07 ± 0.60 mmol/L HDL-c: 0.05 ± 0.22 mmol/L | TG: –0.25 ± 0.87 mmol/L HDL-c: 0.05 ± 0.09 mmol/L | TG: −10.6 HDL-c: 5.1 | TG: −3.4 HDL-c: 5.3 | TG: 0.439 * HDL-c: 0.923 * | TG: −0.18 HDL-c: 0.19 | ||
| SBP: −13.76 ± 8.48 mmHg DBP: −3.78 ± 7.30 mmHg | SBP: −6.56 ± 9.58 mmHg DBP: −6.13 ± 15.84 mmHg | SBP: −9.8 DBP: −4.7 | SBP: −4.7 DBP: −6.9 | SBP: 0.013 * DBP: 0.534 * | SBP: −0.46 DBP: −0.66 | ||
| Beam et al., 2015 [28] Country: USA | Subject: M: 10 (19–34 years) Study design: randomised, double-blinded, crossover Study duration: 60–120 min MeTS outcome: healthy and overweight/class I obesity (BMI: 19.6–34.5 kg/m2) Intervention 1: 5 mg/kg BW of caffeine + 75 g dextrose Intervention 2: 10 mg/kg BW of GCE (5 mg/kg CGA) + 75 g dextrose Control: 5 mg/kg BW of dextrose + 75 g dextrose | Intervention 1: FBG: 0.60 ± 0.21 mmol/L Intervention 2: FBG: 0.40 ± 0.29 mmol/L | FBG: 0.90 ± 0.21 mmol/L | Intervention 1: FBG: 12.8, Intervention 2: FBG: 8.3 | FBG: 19.1 | N.S * | Intervention 1: FBG: 0.38 Intervention 2: FBG: 0.40 |
| Al-Dujaili et al., 2016 [27] Country: Jordan | Subject: M/F: 16 (19–32 years) Study design: randomised, single-blinded, crossover Study duration: 2 weeks MeTS outcome: healthy and overweight/class I obesity (BMI: 18–35 kg/m2) Intervention: 1000 mg/d GCE containing 500 mg CGA and 25 mg caffeine Control: 25 mg tablet of caffeine | SBP: −4.60 ± 3.95 mmHg DBP: −4.30 ± 2.80 mmHg | SBP: −0.80 ± 4.09 mmHg DBP: −0.40 ± 3.20 mmHg | SBP: −3.9 DBP: −5.6 | SBP: −0.7 DBP: −0.5 | SBP: 0.001 * DBP: <0.001 * | SBP: −0.27 DBP: −0.38 |
| Banitalebi et al., 2019 [29] Country: Iran | Subject: F: 60 (30–50 years), intervention 1: 15, intervention 2: 15, intervention 3: 15, control: 15 Study design: randomised, single-blinded, parallel Study duration: 8 weeks MeTS outcome: class I and II obesity (BMI: 30–40 kg/m2) Intervention: 1 = Placebo (500 mg starch) + ERBT, Intervention 2 = 500 mg GCE (~250 mg CGA) + ERBT, Intervention 3 = 500 mg GCE (~250 mg CGA) Control: 500 mg starch | Intervention 1: WC: −2.57 ± 2.82 cm Intervention 2: WC: −2.54 ± 2.85 cm Intervention 3: WC: −3.10 ± 2.43 cm | WC: −1.00 ± 2.65 cm | Intervention 1: WC: −2.6 Intervention 2: WC: −2.5 Intervention 3: WC: −3.0 | WC: −1.0 | Intervention 1: WC: 0.001 # Intervention 2: WC: 0.001 # Intervention 3: WC: 0.001 # | Intervention 1: WC: −0.60 Intervention 2: WC: −0.45 Intervention 3: WC: −0.07 |
| Decaffeinated coffee | |||||||
| Intervention 1: FBG: −0.31 ± 0.18 mmol/L Intervention 2: FBG: −0.55 ± 0.23 mmol/L Intervention 3: FBG: −0.13 ± 0.17 mmol/L | FBG: 0.47 ± 0.34 mmol/L | Intervention 1: −5.9 Intervention 2: −10.5 Intervention 3: −2.5 | 9.3 | Intervention 1: FBG: 0.001 # Intervention 2: FBG: 0.001 # Intervention 3: FBG: 0.071 # | Intervention 1: FBG: −0.69 Intervention 2: FBG: −0.95 Intervention 3: FBG: −0.54 | ||
| Intervention 1: TG: −0.10 ± 0.18 mmol/L HDL-c: 0.07 ± 0.04 mmol/L Intervention 2: TG: −0.14 ± 0.15 mmol/L HDL-c: 0.08 ± 0.07 mmol/L Intervention 3: TG: −0.06 ± 0.16 mmol/L HDL-c: 0.03 ± 0.05 mmol/L | TG: −0.01 ± 0.17 mmol/L HDL-c: 0.01 ± 0.08 mmol/L | Intervention 1: TG: −5.6 HDL-c: 5.6 Intervention 2: TG: −7.7 HDL-c: 6.4 Intervention 3: TG: −3.6 HDL-c: 2.7 | TG: −0.60 HDL-c: 0.80 | Intervention 1: TG: 0.012 # HDL-c: 0.007 # Intervention 2: TG: 0.003 # HDL-c: 0.010 # Intervention 3: TG: 0.071 # HDL-c: 0.356 # | Intervention 1: TG: −0.00 HDL-c: 0.55 Intervention 2: TG: −0.05 HDL-c: 0.50 Intervention 3: TG: −0.00 HDL-c: 0.49 | ||
| Fasihi et al., 2019 [30] Country: Iran | Subject: M/F: 43 (25–50 years), intervention: 22, control: 21 Study design: randomised, double-blinded, parallel Study duration: 8 weeks MeTS outcome: metabolic syndrome (according to NCEP-ATP III 2 guidelines) Intervention: 800 mg/d GCE containing 376 mg CGA (capsule form) Control: 800 mg cellulose | WC: −1.40 ± 2.63 cm | WC: −0.60 ± 2.97 cm | WC: −1.3 | WC: −0.5 | WC: 0.14 * | WC: −0.65 |
| FBG: −0.73 ± 0.68 mmol/L | FBG: 0.20 ± 0.57 mmol/L | FBG: −8.4 | FBG: 2.0 | FBG: 0.25 * | FBG: −0.48 | ||
| TG: −0.27 ± 0.08 mmol/L HDL-c: 0.09 ± 0.06 mmol/L | TG: −0.12 ± 0.06 mmol/L HDL-c: −0.02 ± 0.06 mmol/L | TG: −11.3 HDL-c: 8.2 | TG: −5.0 HDL-c: −1.9 | TG: 0.09 * HDL-c: 0.02 * | TG: −0.74 HDL-c: 0.66 | ||
| SBP: −2.80 ± 2.02 mmHg DBP: −6.40 ± 1.96 mmHg | SBP: −1.20 ± 1.86 mmHg DBP: 2.00 ± 2.53 mmHg | SBP: −2.1 DBP: −6.7 | SBP: −0.9 DBP: 2.1 | SBP: 0.01 * DBP: 0 * | SBP: −0.55 DBP: −1.50 | ||
| Watanabe et al., 2019 [31] Country: Japan | Subject: M/F: 142 (20–64 years), intervention: 72, control: 70 Study design: randomised, double-blinded, parallel Study duration: 12 weeks MeTS condition: overweight (BMI: 25–29 kg/m2) Intervention: instant regular coffee containing 369 mg CGA Control: instant regular coffee containing 35 mg CGA (liquid form) Volume: 180 mL | WC: −0.40 ± 0.85 cm | WC: −0.10 ±0.79 cm | WC: −0.4 | WC: −0.1 | WC: 0.012 * | WC: −0.08 |
| FBG: −0.04 ± 0.09 mmol/L | FBG: 0.09 ± 0.07 mmol/L | FBG: −0.8 | FBG: 1.8 | 0.545* | −0.06 | ||
| TG: −0.06 ± 0.12 mmol/L HDL-c: 0.01 ± 0.06 mmol/L | TG: 0.19 ± 0.17 mmol/L HDL-c: 0.01 ± 0.06 mmol/L | TG: −4.3 HDL-c: 0.7 | TG: −0.5 HDL-c: 0.7 | TG: 0.965* HDL-c: 0.666 * | TG: −0.48 HDL-c: 0.12 | ||
| SBP: –6.7 ± 2.17 DBP: −5.2 ± 1.64 | SBP: –3.9 ± 2.30 DBP: −3.8 ± 1.70 | SBP: −5.1 DBP: −6.4 | SBP: −2.9 DBP: −4.6 | SBP: 0.812 * DBP: 0.395 * | SBP: −0.31 DBP: −0.33 | ||
| Katada et al., 2018 [32] Country: Japan | Subject: M: 15 (20–60 years) Study design: randomised, double-blinded, crossover Study duration: 4 weeks MeTS outcome: healthy and overweight (BMI: 20.0–29.9 kg/m2) Intervention 1: CGA-enriched and HHQ-reduced coffee (CGA-HHQ (−): 428 mg CGA, 67 mg caffeine, 0.08 mg HHQ) (liquid form) Intervention 2: CGA-enriched and HHQ non-reduced coffee (CGA-HHQ (+): 382 mg CGA, 66 mg caffeine, 0.57 mg HHQ) (liquid form) Control: not available Volume: 185 mL | Intervention 1: TG: −0.03 ± 0.15 mmol/L HDL-c: 0.07 ± 0.13 mmol/L Intervention 2: TG: 0.08 ± 0.15 mmol/L HDL-c: −0.05 ± 0.12 mmol/L | N/A * | Intervention 1: TG: −2.8 HDL-c: 4.7 Intervention 2: TG: 7.5 HDL-c: −3.3 | N/A * | N.S * | TG: −0.18 HDL-c: 0.20 |
| Agudelo-ochoa et al., 2016 [33] Country: Colombia | Subject: M/F: 74 (20–60 years), intervention 1: 25, intervention 2: 24, control: 25 Study design: randomised, single-blinded, parallel Study duration: 8 weeks MeTS outcome: healthy and overweight (BMI: 18.5–29.9 kg/m2) Intervention 1: 420 mg CGA (MCCGA) (liquid form) Intervention 2: 780 mg CGA (HCCGA) (liquid form) Control: no coffee, no placebo Volume: 400 mL/d | Intervention 1: TG: 0.18 ± 0.20 mmol/L HDL-c: 0.01 ± 0.10 mmol/L Intervention 2: TG: 0.01 ± 0.17 mmol/L HDL-c: 0.01 ± 0.08 mmol/L | TG: 0.12 ± 0.26 mmol/L HDL-c: 0.05 ± 0.09 mmol/L | Intervention 1: TG: 13.5 HDL-c: 0.7 Intervention 2: TG: 0.7 HDL-c: 0.8 | TG: 9.3 HDL-c: 3.8 | TG: 0.09# HDL-c: 0.16# | Intervention 1: TG: 0.10 HDL-c: 0.06 Intervention 2: TG: 0.03 HDL-c: 0.13 |
| Intervention 1: SBP: 1.00 ± 2.90 mmHg DBP: 1.00 ± 2.02 mmHg Intervention 2: SBP: −1.00 ± 2.67 mmHg DBP: 1.00 ± 2.09 mmHg | SBP: −2.00 ± 2.02 mmHg DBP: 0.0 ± 1.92 mmHg | Intervention 1: SBP: 0.9 DBP: 1.4 Intervention 2: SBP: −0.9 DBP: 1.3 | SBP: −1.9 DBP: N.C | N.S # | Intervention 1: SBP: 0.33 DBP: 0.00 Intervention 2: SBP: −0.40 DBP: 0.18 | ||
| Sarria et al., 2018 [22] Country: Spain | Subject: M/F: 52 (18–45 years) Study design: randomised, single-blinded, crossover Study duration: 8 weeks MeTS outcome: normocholesterolemic (n = 25) (TC <200 mg/dL), hypercholesterolemia (n = 27) (TC > 200–240 mg/dL) Intervention: green/roasted coffee beverage containing 510.6 mg CGA/d (liquid form) Control: control drink (water/isotonic caffeine- and polyphenol-free drinks) | Normocholesterolemic: WC: 0.50 ± 0.40 cm Hypercholesterolemic: WC: −1.20 ± 0.69 cm | Normocholesterolemic: WC: 0.20 ± 0.40 cm Hypercholesterolemic: WC: −0.20 ± 0.69 cm | Normocholesterolemic: WC: 0.7 Hypercholesterolemic: WC: −1.6 | Normocholesterolemic: WC: 0.3 Hypercholesterolemic: WC: −0.3 | N.S * | Normocholesterolemic: 0.15 Hypercholesterolemic: −0.28 |
| Normocholesterolemic: FBG: −0.17 ± 0.03 mmol/L Hypercholesterolemic: FBG: −2.1 ± 0.03 mmol/L | Normocholesterolemic: FBG: 0.05 ± 0.03 mmol/L Hypercholesterolemic: FBG: −0.13 ± 0.03 mmol/L | Normocholesterolemic: FBG: −4.1 Hypercholesterolemic: FBG: −4.9 | Normocholesterolemic: FBG: 1.2 Hypercholesterolemic: FBG: −3.0 | FBG: 0.030 * | Normocholesterolemic: FBG: −1.83 Hypercholesterolemic: FBG: −0.66 | ||
| Normocholesterolemic: TG: −0.01 ± 0.02 mmol/L Hypercholesterolemic: TG: −0.04 ± 0.02 mmol/L | Normocholesterolemic: TG: −0.02 ± 0.02 mmol/L Hypercholesterolemic: TG: −0.03 ± 0.02 mmol/L | Normocholesterolemic: TG: −1.2 Hypercholesterolemic: TG: −4.6 | Normocholesterolemic: TG: −2.5 Hypercholesterolemic: TG: −3.4 | TG: 0.017 * * | Normocholesterolemic: TG: −0.12 Hypercholesterolemic: TG: −0.35 | ||
| Normocholesterolemic: SBP: −3.40 ± 0.61 mmHg DBP: −2.30 ± 0.34 mmHg Hypercholesterolemic: SBP: −5.20 ± 0.83 mmHg DBP: −5.60 ± 0.61 mmHg | Normocholesterolemic: SBP: −0.70 ± 0.59 mmHg DBP: −0.30 ± 0.31 mmHg Hypercholesterolemic: SBP: −3.60 ± 0.75 mmHg DBP: −3.50 ± 0.57 mmHg | Normocholesterolemic: SBP: −3.0, DBP: −3.3 Hypercholesterolemic: SBP: −4.4, DBP: −7.3 | Normocholesterolemic: SBP: −0.6, DBP: −0.4 Hypercholesterolemic: SBP: −3.0, DBP: −4.6 | SBP: 0.001 * DBP <0.001 * | Normocholesterolemic: SBP: −0.93, DBP: −1.28 Hypercholesterolemic: SBP: −0.40, DBP: −0.72 | ||
| Kajikawa et al., 2018 [23] Country: Japan | Subject: M/F: 37 years Study 1: intervention 1: 10, intervention 2: 9 (53 ± 19 years) Study 2: intervention 1: 9, control: 9 (56 ± 15 years) Study design: randomised, single-blinded, crossover Study duration: 60–120 min MeTS outcome: borderline (SBP: 130–139 mmHg or DBP: 85–89 mmHg) or stage 1 hypertension (SBP: 140–159 mmHg or DBP: 90–99 mmHg) Study 1: Intervention 1: beverage A (CGA: 412 mg, HHQ: 0.11 mg, CAF: 69 mg), Intervention 2: beverage B (CGA: 373 mg, HHQ: 0.76 mg, CAF: 75 mg)Study 2: beverage AControl: beverage C (CGA: 0 mg, HHQ: 0.1 mg, CAF: 59 mg) (liquid form) Volume: 185 mL | Study 1: Intervention 1: TG: 60 min: 0.40 ± 0.26 mmol/L, 120 min: 0.65 ± 0.29 mmol/L Intervention 2: TG: 60 min: 0.30 ± 0.25 mmol/L, 120 min: 0.80 ± 0.33 mmol/L Study 2: Intervention 1: TG: 60 min: 0.21 ± 5.51 mmol/L, 120 min: 0.60 ± 5.53 mmol/L | TG: 60 min: 0.24 ± 1.01 mmol/L 120 min: 0.64 ± 1.19 mmol/L | Study 1: Intervention 1: TG: 60 min: 28.6, 120 min: 46.4 Intervention 2: TG: 60 min: 22.7, 120 min: 60.6 Study 2: Intervention 1: TG: 60 min: 15.3, 120 min: 43.8 | TG: 60 min: 19.2 120 min: 51.2 | Study 1: TG: N.S # Study 2: TG: N. S # | Study 1: 60 min: 0.15 120 min: 0.05 Study 2: 60 min: 0.10 120 min: 0.07 |
| Study 1: Intervention 1: SBP: 60 min: 1.00 ± 4.02 mmHg, 120 min: 0.0 ± 3.84 Intervention 2: SBP: 60 min: −3.00 ± 3.66 mmHg, 120 min: −2.00 ± 4.02 mmHg Study 2: Intervention 1: SBP: 60 min: 1.00 ± 4.30 mmHg, 120 min: 0.0 ± 5.00 mmHg | SBP: 60 min: 2.00 ± 5.16 mmHg 120 min: −1.00 ± 5.16 mmHg | Study 1: Intervention 1: SBP: 60 min: 0.8, 120 min: N.C Intervention 2: SBP: 60 min: −2.3, 120 min: −1.5 Study 2: Intervention 1: SBP: 60 min: 0.8, 120 min: N.C | SBP: 60 min: 1.5 120 min: −0.8 | Study 1: SBP: N.S # Study 2: SBP: N.S # | Study 1: 60 min: 0.18 120 min: 0.06 Study 2: 60 min: 0.15 120 min: 0.04 | ||
| Caffeinated coffee (all in liquid form) | |||||||
| Teng et al., 2016 [24] Country: Malaysia | Subject: M/F: 104 (19–26 years), intervention: 53, control: 51 Study design: randomised, double-blinded, parallel Study duration: 60 min MeTS outcome: healthy and overweight/obesity (BMI ≥25 kg/m2) Intervention: instant coffee containing 82.2 mg caffeine Control: instant coffee containing undetectable decaffeinated coffee Volume: 250 mL | SBP: 0.65 ± 7.81 mmHg DBP: 0.62 ± 6.46 mmHg | SBP: −2.12 ± 6.28 mmHg DBP: −1.49 ± 4.91 mmHg | SBP: 0.6 DBP: 1.0 | SBP: −1.8 DBP: −2.2 | SBP: 0.05 * DBP: 0.64 * | SBP: 0.08 DBP: 0.07 |
| Alperet et al., 2019 [25] Country: Switzerland | Subject: M/F: 126 (36–67 years), intervention: 62, control: 64 Study design: randomised, double-blinded, parallel Study duration: 24 weeks MeTS condition: overweight (BMI: 22.5–35.4 kg/m2) and non-insulin sensitive (HOMA-IR ≥ 1.30) Intervention: 100% instant Robusta coffee + 73.7% non-diary creamer (69.12 mg caffeine/d and 45.4 mg CGA/d) Control: 32.5% coloured non-dairy creamer + 67.5% non-dairy creamer (0 mg caffeine and CGA) | WC: −2.76 ± 0.14 cm | WC: 0.58 ± 0.13 cm | WC: −3.0 | WC: 0.6 | WC: 0.39 # | WC: −0.70 |
| FBG: 0.30 ± 0.18 mmol/L | FBG: 0.11 ± 0.18 mmol/L | FBG: 6.3 | FBG: 2.3 | FBG: 0.09 # | FBG: 0.16 | ||
| TG: −0.03 ± 0.19 mmol/L HDL-c: 0.04 ± 0.18 mmol/L | TG: 0.09 ± 0.18 mmol/L HDL-c: 0.00 ± 0.18 mmol/L | TG: −2.2 HDL-c: 3.4 | TG: 7.5 HDL-c: N.C | TG: 0.69 # HDL-c: 0.18 # | TG: −0.03 HDL-c: 0.01 | ||
| SBP: 1.36 ± 0.18 mmHg DBP: −0.01 ± 0.18 mmHg | SBP: −1.66 ± 0.18 mmHg DBP: −1.01 ± 0.18 mmHg | SBP: 1.1 DBP: −0.01 | SBP: −1.3 DBP: −1.3 | SBP: 0.33 # DBP: 0.16# | SBP: 2.56 DBP: −1.13 | ||
| Type of Coffee | No. of Study | Mode of Delivery | Dose |
|---|---|---|---|
| Caffeinated | n = 6 | Powder | 5 mg/kg BW–69.12 mg caffeine * |
| Liquid | 80 mg caffeine *, volume: 250 mL | ||
| Decaffeinated (including green coffee extract, GCE) | n = 11 | Liquid | 369–780 mg CGA *, volume: 180–400 mL |
| n = 9 | Capsule/tablet | 10 mg/kg BW–1000 mg GC * containing 180–500 mg CGA |
| Studies | Score Descriptions | |||||
|---|---|---|---|---|---|---|
| Randomisation (Yes/No) | Appropriateness of Randomisation (Detail) | Blinding (Yes/No) a | Appropriateness of Blinding | An Account of All Participants or Description of Withdrawal or Dropouts | Total Score | |
| Haidari et al., 2017 [20] | 1 | 1 | 1 | N/A | N/A | 3.0 |
| Alhamhany et al., 2018 [21] | 1 | N/A | N/A | N/A | N/A | 1.0 |
| Roshan et al., 2018 [26] | 1 | 1 | 1 | 1 | 1 | 5.0 |
| Al-Dujaili et al., 2016 [27] | 1 | 1 | 0.5 | N/A | 1 | 3.5 |
| Beam et al., 2015 [28] | 1 | N/A | 1 | N/A | 1 | 3.0 |
| Banitalebi et al., 2019 [29] | 1 | 1 | 1 | 1 | 1 | 5.0 |
| Fasihi et al., 2019 [30] | 1 | 1 | 1 | N/A | 1 | 4.0 |
| Watanabe et al., 2019 [31] | 1 | 1 | 1 | 1 | 1 | 5.0 |
| Katada et al., 2018 [32] | 1 | N/A | 1 | 1 | 1 | 4.0 |
| Agudelo-ochoa et al., 2016 [33] | 1 | N/A | 0.5 | N/A | 1 | 2.5 |
| Sarria et al., 2016 [22] | 1 | N/A | 1 | N/A | 1 | 3.0 |
| Kajikawa et al., 2018 [23] | 1 | N/A | 0.5 | 1 | 1 | 3.5 |
| Teng et al., 2016 [24] | 1 | 1 | 1 | 1 | 1 | 5.0 |
| Alperet et al., 2019 [25] | 1 | 1 | 1 | 1 | 1 | 5.0 |
Publisher’s Note: MDPI stays neutral with regard to jurisdictional claims in published maps and institutional affiliations. |
© 2021 by the authors. Licensee MDPI, Basel, Switzerland. This article is an open access article distributed under the terms and conditions of the Creative Commons Attribution (CC BY) license (https://creativecommons.org/licenses/by/4.0/).
Share and Cite
Ramli, N.N.S.; Alkhaldy, A.A.; Mhd Jalil, A.M. Effects of Caffeinated and Decaffeinated Coffee Consumption on Metabolic Syndrome Parameters: A Systematic Review and Meta-Analysis of Data from Randomised Controlled Trials. Medicina 2021, 57, 957. https://doi.org/10.3390/medicina57090957
Ramli NNS, Alkhaldy AA, Mhd Jalil AM. Effects of Caffeinated and Decaffeinated Coffee Consumption on Metabolic Syndrome Parameters: A Systematic Review and Meta-Analysis of Data from Randomised Controlled Trials. Medicina. 2021; 57(9):957. https://doi.org/10.3390/medicina57090957
Chicago/Turabian StyleRamli, Nur Nadiah Syuhada, Areej A. Alkhaldy, and Abbe Maleyki Mhd Jalil. 2021. "Effects of Caffeinated and Decaffeinated Coffee Consumption on Metabolic Syndrome Parameters: A Systematic Review and Meta-Analysis of Data from Randomised Controlled Trials" Medicina 57, no. 9: 957. https://doi.org/10.3390/medicina57090957
APA StyleRamli, N. N. S., Alkhaldy, A. A., & Mhd Jalil, A. M. (2021). Effects of Caffeinated and Decaffeinated Coffee Consumption on Metabolic Syndrome Parameters: A Systematic Review and Meta-Analysis of Data from Randomised Controlled Trials. Medicina, 57(9), 957. https://doi.org/10.3390/medicina57090957