
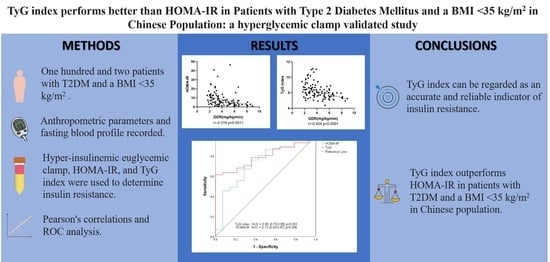
TyG Index Performs Better Than HOMA-IR in Chinese Type 2 Diabetes Mellitus with a BMI < 35 kg/m2: A Hyperglycemic Clamp Validated Study

 , and
, and
Abstract
:
1. Introduction
2. Materials and Methods
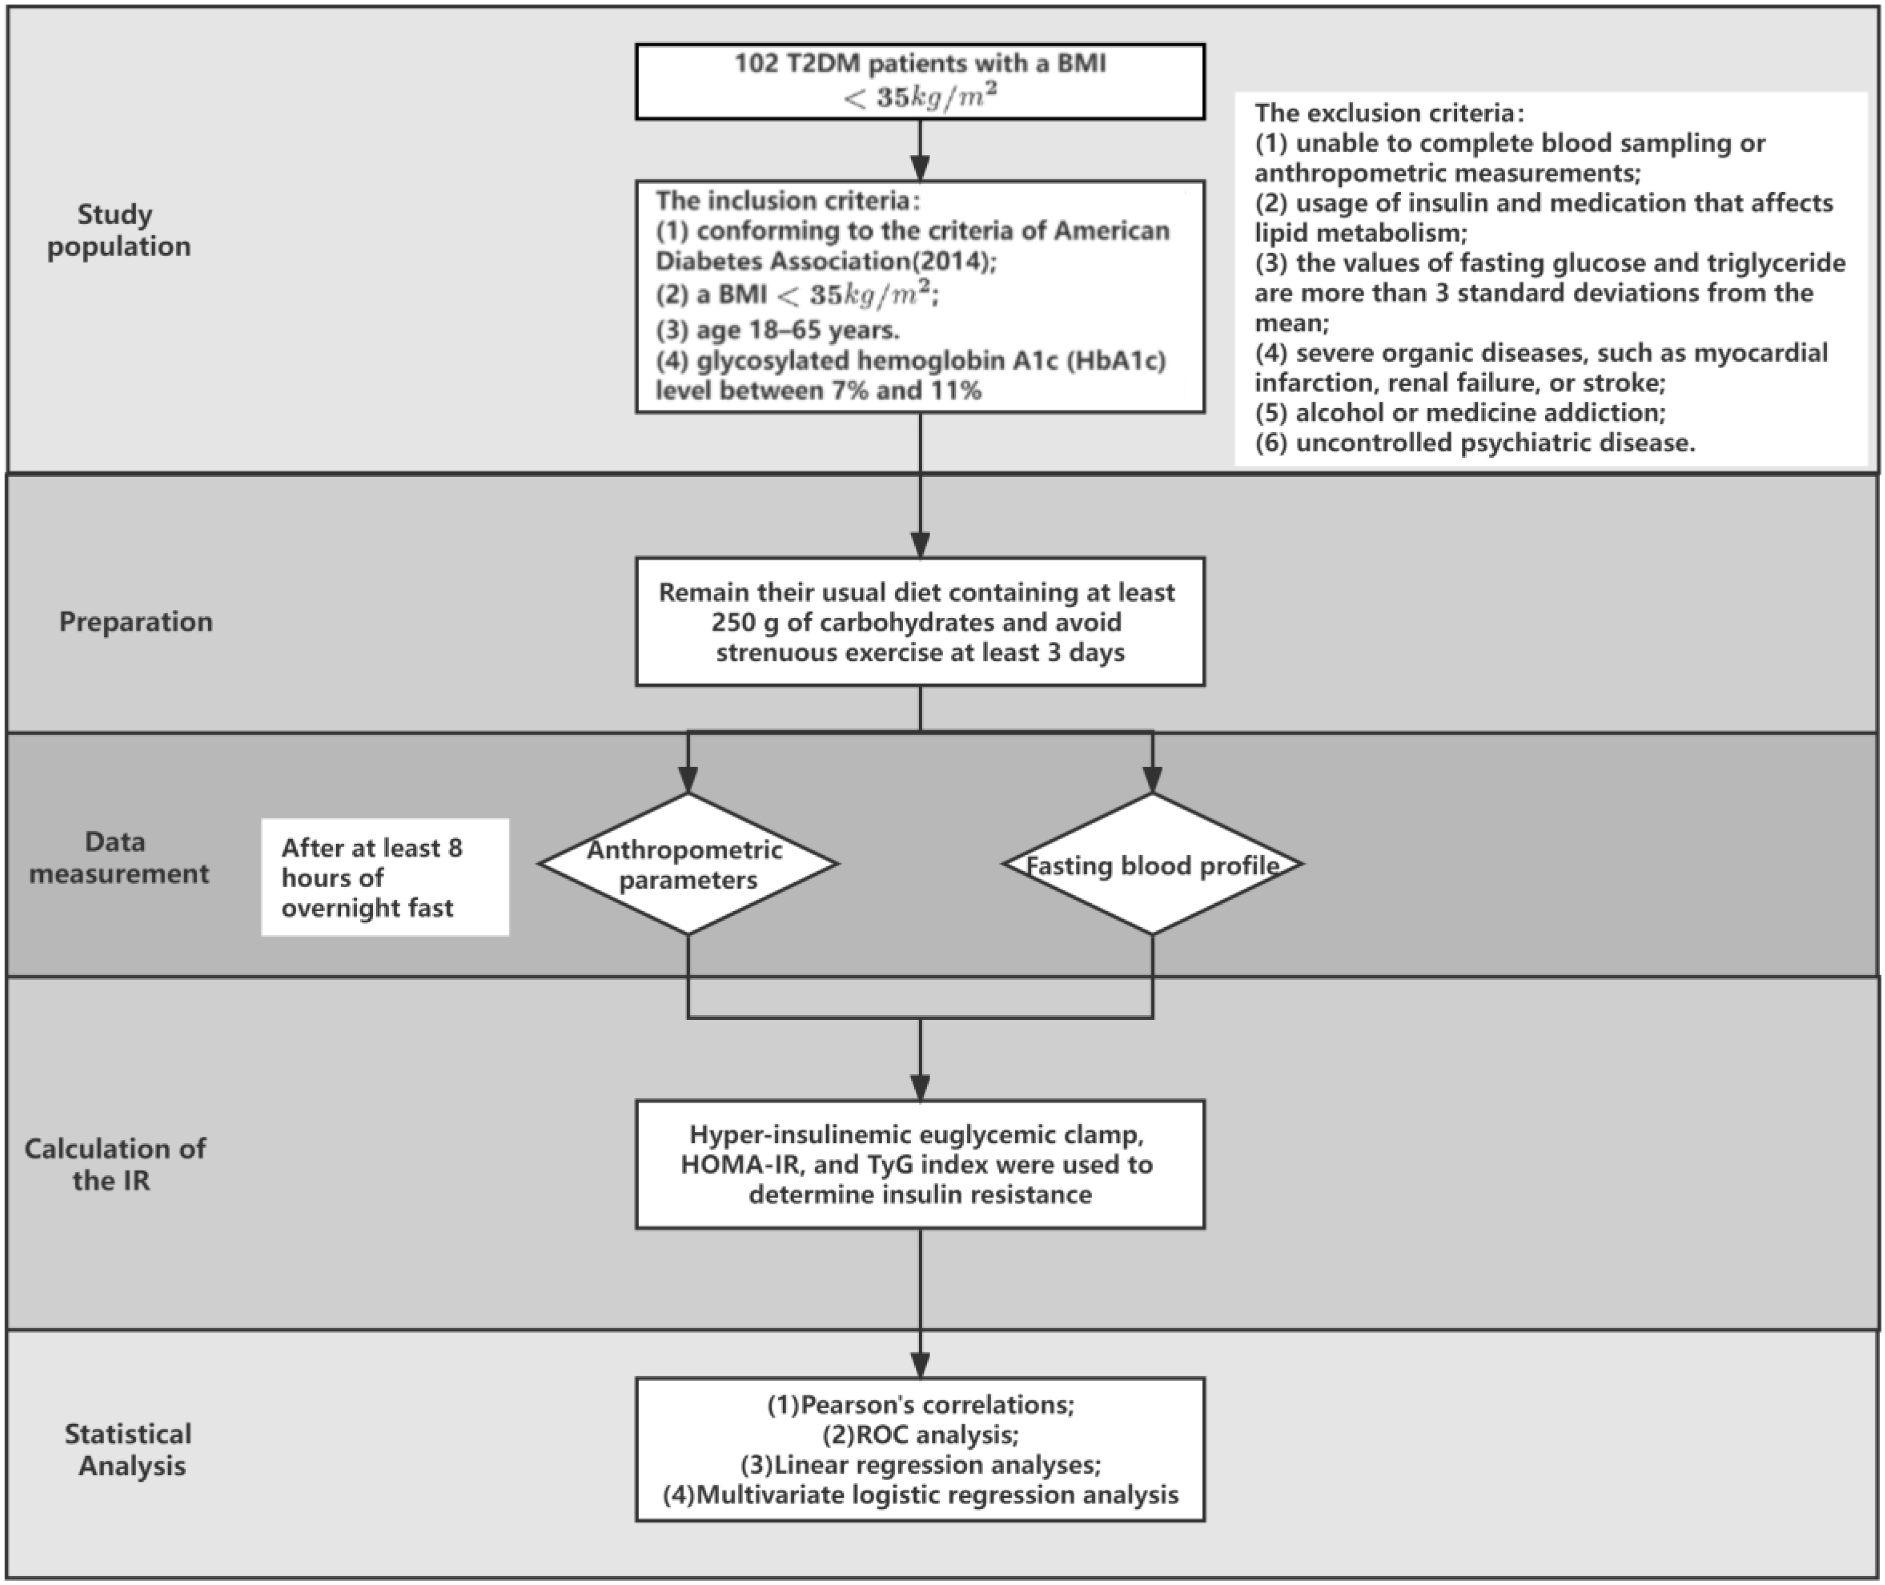
2.1. Study Population
2.2. Study Protocol
2.3. Assays
2.4. Statistical Analysis
3. Results
4. Discussion
5. Conclusions
Author Contributions
Funding
Institutional Review Board Statement
Informed Consent Statement
Data Availability Statement
Conflicts of Interest
References
- Chen, L.; Magliano, D.J.; Zimmet, P.Z. The worldwide epidemiology of type 2 diabetes mellitus--present and future perspectives. Nat. Rev. Endocrinol. 2011, 8, 228–236. [Google Scholar] [CrossRef]
- Saeedi, P.; Petersohn, I.; Salpea, P.; Malanda, B.; Karuranga, S.; Unwin, N.; Colagiuri, S.; Guariguata, L.; Motala, A.A.; Ogurtsova, K.; et al. Global and regional diabetes prevalence estimates for 2019 and projections for 2030 and 2045: Results from the International Diabetes Federation Diabetes Atlas, 9(th) edition. Diabetes Res. Clin. Pract. 2019, 157, 107843. [Google Scholar] [CrossRef] [PubMed] [Green Version]
- Hu, C.; Jia, W. Diabetes in China: Epidemiology and Genetic Risk Factors and Their Clinical Utility in Personalized Medication. Diabetes 2018, 67, 3–11. [Google Scholar] [CrossRef] [PubMed] [Green Version]
- Gao, L.; Zhang, P.; Weng, J.; Lu, J.; Guo, X.; Jia, W.; Yang, W.; Zou, D.; Zhou, Z.; Pan, C.; et al. Patient characteristics and 6-month dose of basal insulin associated with HbA1c achievement <7.0% in Chinese people with type 2 diabetes: Results from the Observational Registry of Basal Insulin Treatment (ORBIT). J. Diabetes 2020, 12, 668–676. [Google Scholar] [CrossRef] [PubMed]
- Porte, D., Jr.; Kahn, S.E. beta-cell dysfunction and failure in type 2 diabetes: Potential mechanisms. Diabetes 2001, 50 (Suppl S1), S160–S163. [Google Scholar] [CrossRef] [Green Version]
- Galicia-Garcia, U.; Benito-Vicente, A.; Jebari, S.; Larrea-Sebal, A.; Siddiqi, H.; Uribe, K.B.; Ostolaza, H.; Martín, C. Pathophysiology of Type 2 Diabetes Mellitus. Int. J. Mol. Sci. 2020, 21, 6275. [Google Scholar] [CrossRef]
- Yabe, D.; Seino, Y.; Fukushima, M.; Seino, S. β cell dysfunction versus insulin resistance in the pathogenesis of type 2 diabetes in East Asians. Curr. Diab. Rep. 2015, 15, 602. [Google Scholar] [CrossRef] [Green Version]
- Matthews, D.R.; Hosker, J.P.; Rudenski, A.S.; Naylor, B.A.; Treacher, D.F.; Turner, R.C. Homeostasis model assessment: Insulin resistance and beta-cell function from fasting plasma glucose and insulin concentrations in man. Diabetologia 1985, 28, 412–419. [Google Scholar] [CrossRef] [Green Version]
- Marcovina, S.; Bowsher, R.R.; Miller, W.G.; Staten, M.; Myers, G.; Caudill, S.P.; Campbell, S.E.; Steffes, M.W. Standardization of insulin immunoassays: Report of the American Diabetes Association Workgroup. Clin. Chem. 2007, 53, 711–716. [Google Scholar] [CrossRef]
- Kang, E.S.; Yun, Y.S.; Park, S.W.; Kim, H.J.; Ahn, C.W.; Song, Y.D.; Cha, B.S.; Lim, S.K.; Kim, K.R.; Lee, H.C. Limitation of the validity of the homeostasis model assessment as an index of insulin resistance in Korea. Metabolism 2005, 54, 206–211. [Google Scholar] [CrossRef]
- Bonora, E.; Targher, G.; Alberiche, M.; Bonadonna, R.C.; Saggiani, F.; Zenere, M.B.; Monauni, T.; Muggeo, M. Homeostasis model assessment closely mirrors the glucose clamp technique in the assessment of insulin sensitivity: Studies in subjects with various degrees of glucose tolerance and insulin sensitivity. Diabetes Care 2000, 23, 57–63. [Google Scholar] [CrossRef] [PubMed] [Green Version]
- Guerrero-Romero, F.; Simental-Mendía, L.E.; González-Ortiz, M.; Martínez-Abundis, E.; Ramos-Zavala, M.G.; Hernández-González, S.O.; Jacques-Camarena, O.; Rodríguez-Morán, M. The product of triglycerides and glucose, a simple measure of insulin sensitivity. Comparison with the euglycemic-hyperinsulinemic clamp. J. Clin. Endocrinol. Metab. 2010, 95, 3347–3351. [Google Scholar] [CrossRef] [PubMed] [Green Version]
- Zhang, M.; Wang, B.; Liu, Y.; Sun, X.; Luo, X.; Wang, C.; Li, L.; Zhang, L.; Ren, Y.; Zhao, Y.; et al. Cumulative increased risk of incident type 2 diabetes mellitus with increasing triglyceride glucose index in normal-weight people: The Rural Chinese Cohort Study. Cardiovasc. Diabetol. 2017, 16, 30. [Google Scholar] [CrossRef] [PubMed] [Green Version]
- Thai, P.V.; Tien, H.A.; Van Minh, H.; Valensi, P. Triglyceride glucose index for the detection of asymptomatic coronary artery stenosis in patients with type 2 diabetes. Cardiovasc. Diabetol. 2020, 19, 137. [Google Scholar] [CrossRef] [PubMed]
- American Diabetes Association. Diagnosis and classification of diabetes mellitus. Diabetes Care 2014, 37 (Suppl S1), S81–S90. [Google Scholar] [CrossRef] [PubMed] [Green Version]
- Park, B.; Lee, H.S.; Lee, Y.J. Triglyceride glucose (TyG) index as a predictor of incident type 2 diabetes among nonobese adults: A 12-year longitudinal study of the Korean Genome and Epidemiology Study cohort. Transl. Res. 2021, 228, 42–51. [Google Scholar] [CrossRef]
- Luo, P.; Cao, Y.; Li, P.; Wang, G.; Song, Z.; Li, W.; Su, Z.; Zhou, H.; Yi, X.; Fu, Z.; et al. Insulin Resistance Remission Following Laparoscopic Roux-en-Y Gastric Bypass and Laparoscopic Sleeve Gastrectomy in Chinese Type 2 Diabetes Mellitus Patients With a Body Mass Index of 27.5–32.5 kg/m2. Front. Physiol. 2021, 12, 772577. [Google Scholar] [CrossRef]
- Du, T.; Yuan, G.; Zhang, M.; Zhou, X.; Sun, X.; Yu, X. Clinical usefulness of lipid ratios, visceral adiposity indicators, and the triglycerides and glucose index as risk markers of insulin resistance. Cardiovasc. Diabetol. 2014, 13, 146. [Google Scholar] [CrossRef]
- Kumar, A.S.; Maiya, A.G.; Shastry, B.A.; Vaishali, K.; Ravishankar, N.; Hazari, A.; Gundmi, S.; Jadhav, R. Exercise and insulin resistance in type 2 diabetes mellitus: A systematic review and meta-analysis. Ann. Phys. Rehabil. Med. 2019, 62, 98–103. [Google Scholar] [CrossRef]
- DeFronzo, R.A.; Ferrannini, E.; Groop, L.; Henry, R.R.; Herman, W.H.; Holst, J.J.; Hu, F.B.; Kahn, C.R.; Raz, I.; Shulman, G.I.; et al. Type 2 diabetes mellitus. Nat. Rev. Dis. Primers 2015, 1, 15019. [Google Scholar] [CrossRef]
- Kautzky-Willer, A.; Harreiter, J.; Pacini, G. Sex and Gender Differences in Risk, Pathophysiology and Complications of Type 2 Diabetes Mellitus. Endocr. Rev. 2016, 37, 278–316. [Google Scholar] [CrossRef] [PubMed] [Green Version]
- Wallace, T.M.; Levy, J.C.; Matthews, D.R. Use and abuse of HOMA modeling. Diabetes Care 2004, 27, 1487–1495. [Google Scholar] [CrossRef] [PubMed] [Green Version]
- Muniyappa, R.; Irving, B.A.; Unni, U.S.; Briggs, W.M.; Nair, K.S.; Quon, M.J.; Kurpad, A.V. Limited predictive ability of surrogate indices of insulin sensitivity/resistance in Asian-Indian men. Am. J. Physiol. Endocrinol. Metab. 2010, 299, E1106–E1112. [Google Scholar] [CrossRef] [PubMed]
- Su, W.Y.; Chen, S.C.; Huang, Y.T.; Huang, J.C.; Wu, P.Y.; Hsu, W.H.; Lee, M.Y. Comparison of the Effects of Fasting Glucose, Hemoglobin A(1c), and Triglyceride-Glucose Index on Cardiovascular Events in Type 2 Diabetes Mellitus. Nutrients 2019, 11, 2838. [Google Scholar] [CrossRef] [PubMed] [Green Version]

| Characteristics | Total (n = 98) | Men (n = 57) | Women (n = 41) | p Value | |||
|---|---|---|---|---|---|---|---|
| Mean ± SD | Median (Min, Max) | Mean ± SD | Median (Min, Max) | Mean ± SD | Median (Min, Max) | ||
| Age (years) | 42.34 ± 12.86 | 42 (18, 67) | 42.46 ± 12.43 | 43 (18, 64) | 42.17 ± 13.58 | 41 (18, 67) | 0.914 |
| Body mass index (kg/m2) | 29.20 ± 3.52 | 29.75 (21.88, 34.95) | 28.94 ± 3.58 | 28.72 (21.88, 34.77) | 29.56 ± 3.46 | 29.95 (22.19, 34.95) | 0.394 |
| Waist circumference (cm) | 99.92 ± 9.88 | 98 (61, 131) | 99.93 ± 10.52 | 97.5 (61, 131) | 99.92 ± 9.03 | 99 (80, 118) | 0.994 |
| Duration of T2DM (years) | 5.84 ± 4.33 | 5 (1, 15) | 6.07 ± 4.18 | 5 (1, 15) | 5.51 ± 4.55 | 4 (1, 15) | 0.532 |
| Metformin (n) | 66 (67.35%) | 37 (64.91%) | 29 (70.73%) | 0.549 | |||
| Duration of metformin (years) | 4.16 ± 4.57 | 2 (1, 15) | 4.04 ± 4.51 | 2 (1, 15) | 4.34 ± 4.69 | 2 (1, 15) | 0.745 |
| Fasting glucose (mg/dL) | 167.09 ± 63.39 | 155.88 (68.04, 392.04) | 161.22 ± 62.88 | 151.2 (68.04, 392.04) | 175.25 ± 63.97 | 165.06 (83.7, 297.72) | 0.282 |
| HbA1c (%) HbA1c (mmol/mol) | 8.50 ± 1.87 62.65 ± 17.79 | 8.3 (5.6, 16.8) 59.56 (37.71, 106.56) | 8.55 ± 1.58 68.33 ± 17.77 | 8.3 (6.2, 12.3) 66.12 (44.26, 110.93) | 8.44 ± 2.24 68.79 ± 24.48 | 8.1 (5.6, 16.8) 65.03 (37.71, 160.11) | 0.793 0.503 |
| Triglyceride (mg/dL) | 56.29 ± 53.71 | 39.78 (8.82, 313.92) | 60.42 ± 60.41 | 41.58 (8.82, 313.92) | 50.55 ± 42.78 | 39.24 (17.1, 219.78) | 0.372 |
| GDR (mg/kg/min) | 4.25 ± 1.81 | 3.88 (1.61, 8.91) | 4.34 ± 1.76 | 4.13 (1.72, 8.91) | 4.13 ± 1.89 | 3.64 (1.61, 8.58) | 0.581 |
| HOMA-IR | 8.05 ± 7.98 | 5.36 (0.59, 46.37) | 7.28 ± 8.23 | 5.11 (0.59, 46.37) | 8.96 ± 7.79 | 6.99 (1.1, 40.84) | 0.312 |
| TyG index | 8.12 ± 0.86 | 7.99 (6.38, 11.03) | 8.13 ± 0.88 | 8.01 (6.38, 11.03) | 8.11 ± 0.83 | 7.97 (6.94, 10.38) | 0.897 |
| Men | Women | Total | ||||
|---|---|---|---|---|---|---|
| Pearson’s Correlations Coefficient | p Value | Pearson’s Correlations Coefficient | p Value | Pearson’s Correlations Coefficient | p Value | |
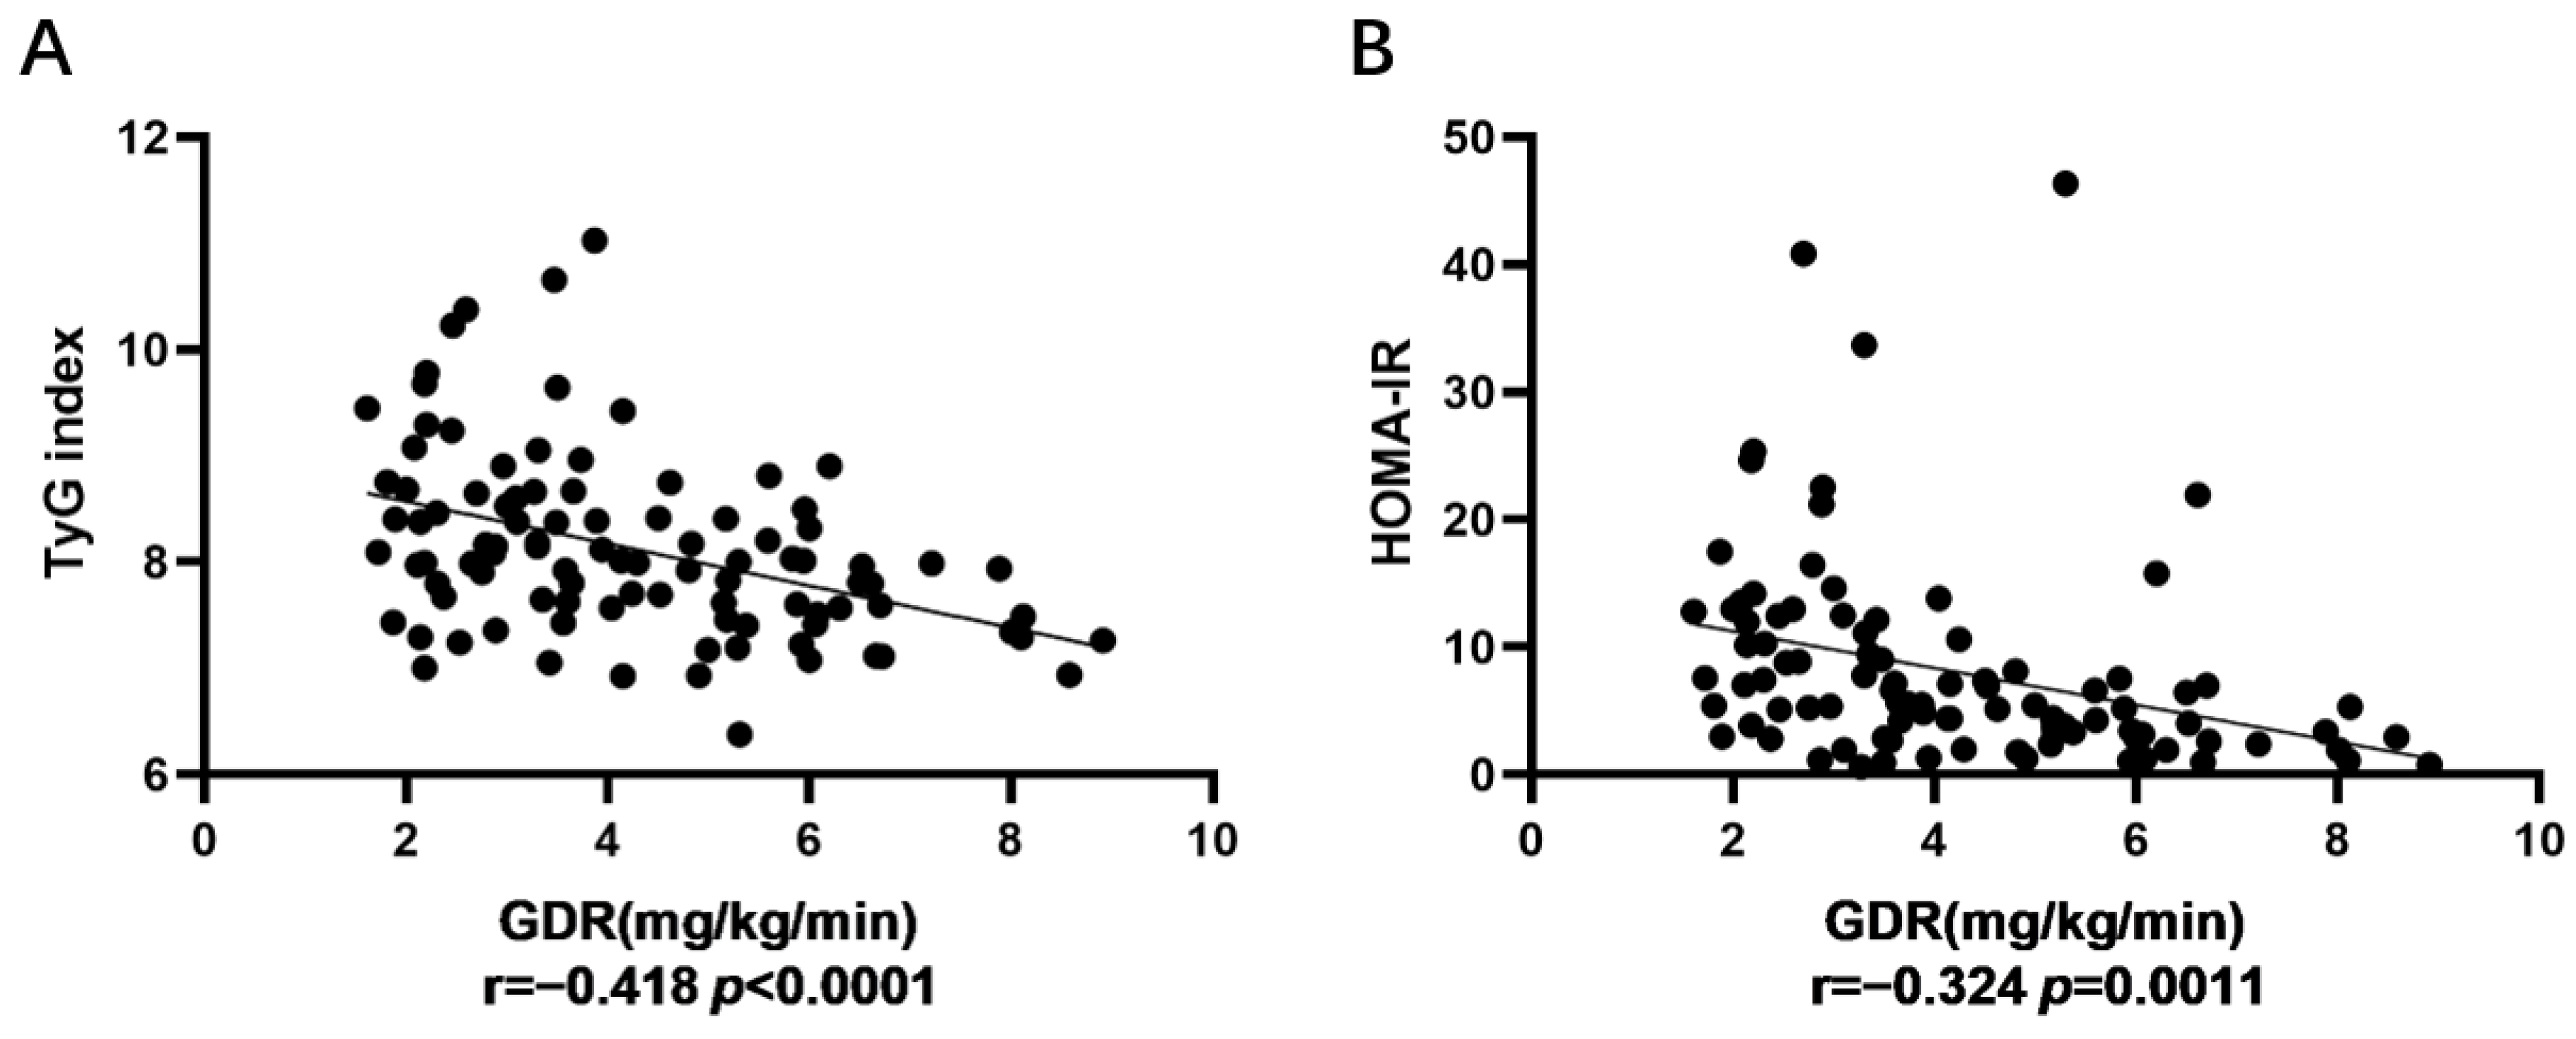
| TyG index and GDR | −0.412 | 0.001 ** | −0.431 | 0.005 ** | −0.418 | 0.0000 **** |
| HOMA-IR and GDR | −0.291 | 0.028 * | −0.364 | 0.019 * | −0.324 | 0.0011 ** |
| Men | Women | |||||
|---|---|---|---|---|---|---|
| Additional R2 | β | p Value | Additional R2 | β | p Value | |
| TyG index | 0.134 | −0.78 | 0.002 ** | 0.81 | −0.69 | 0.02 * |
| HOMA-IR | 0.044 | −0.061 | 0.014 * | 0.003 | −0.034 | 0.369 |
| Men | Women | |||
|---|---|---|---|---|
| Odds ratio (95% Confidence Interval) | p Value | Odds ratio (95% Confidence Interval) | p Value | |
| TyG index | 2.22(1.12–4.39) | 0.022 * | 3.07(1.20–7.83) | 0.019 * |
| HOMA-IR | 1.08(1.00–1.15) | 0.044 * | 1.11(0.98–1.24) | 0.092 |
| Men | Women | Total | ||||
|---|---|---|---|---|---|---|
| AUC (95% Confidence Interval) | p Value | AUC (95% Confidence Interval) | p Value | AUC (95% Confidence Interval) | p Value | |
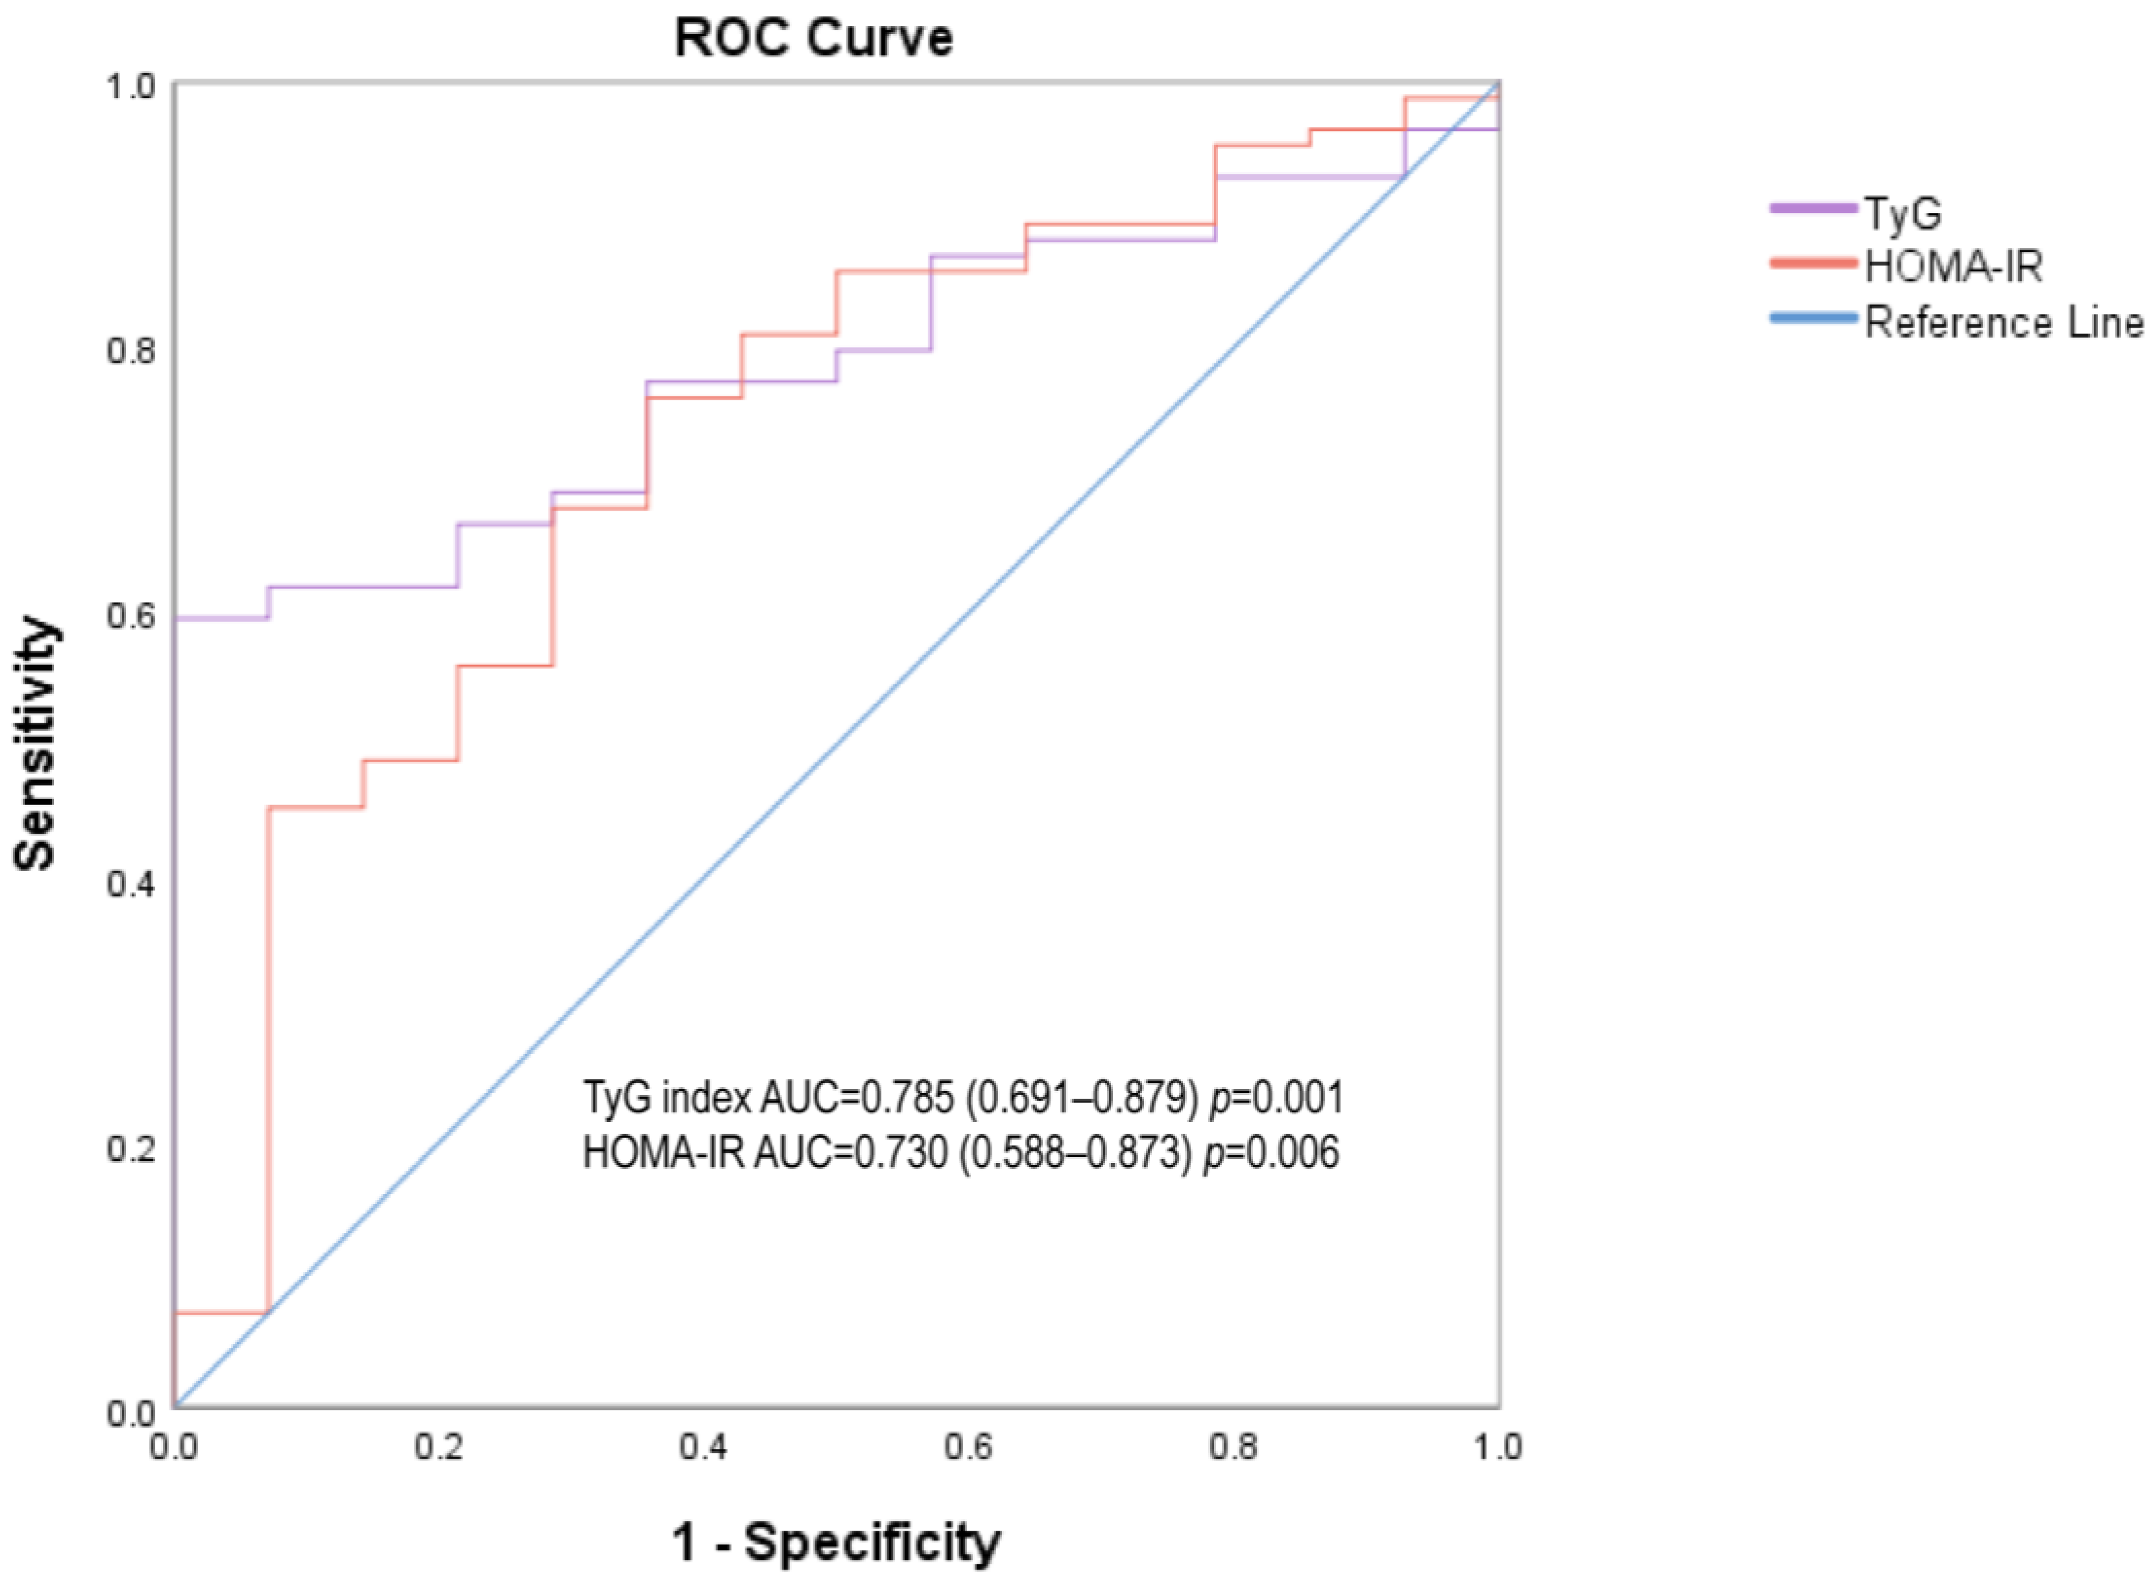
| TyG index | 0.774 (0.648–0.901) | 0.02 * | 0.794 (0.643–0.945) | 0.015 * | 0.785 (0.691–0.879) | 0.001 ** |
| HOMA-IR | 0.709 (0.534–0.884) | 0.076 | 0.769 (0.53–1.00) | 0.027 * | 0.73 (0.588–0.873) | 0.006 ** |
Publisher’s Note: MDPI stays neutral with regard to jurisdictional claims in published maps and institutional affiliations. |
© 2022 by the authors. Licensee MDPI, Basel, Switzerland. This article is an open access article distributed under the terms and conditions of the Creative Commons Attribution (CC BY) license (https://creativecommons.org/licenses/by/4.0/).
Share and Cite
Luo, P.; Cao, Y.; Li, P.; Li, W.; Song, Z.; Fu, Z.; Zhou, H.; Yi, X.; Zhu, L.; Zhu, S. TyG Index Performs Better Than HOMA-IR in Chinese Type 2 Diabetes Mellitus with a BMI < 35 kg/m2: A Hyperglycemic Clamp Validated Study. Medicina 2022, 58, 876. https://doi.org/10.3390/medicina58070876
Luo P, Cao Y, Li P, Li W, Song Z, Fu Z, Zhou H, Yi X, Zhu L, Zhu S. TyG Index Performs Better Than HOMA-IR in Chinese Type 2 Diabetes Mellitus with a BMI < 35 kg/m2: A Hyperglycemic Clamp Validated Study. Medicina. 2022; 58(7):876. https://doi.org/10.3390/medicina58070876
Chicago/Turabian StyleLuo, Ping, Yaoquan Cao, Pengzhou Li, Weizheng Li, Zhi Song, Zhibing Fu, Hui Zhou, Xianhao Yi, Liyong Zhu, and Shaihong Zhu. 2022. "TyG Index Performs Better Than HOMA-IR in Chinese Type 2 Diabetes Mellitus with a BMI < 35 kg/m2: A Hyperglycemic Clamp Validated Study" Medicina 58, no. 7: 876. https://doi.org/10.3390/medicina58070876
APA StyleLuo, P., Cao, Y., Li, P., Li, W., Song, Z., Fu, Z., Zhou, H., Yi, X., Zhu, L., & Zhu, S. (2022). TyG Index Performs Better Than HOMA-IR in Chinese Type 2 Diabetes Mellitus with a BMI < 35 kg/m2: A Hyperglycemic Clamp Validated Study. Medicina, 58(7), 876. https://doi.org/10.3390/medicina58070876