
Network Pharmacology Integrated Molecular Docking and Dynamics to Elucidate Saffron Compounds Targeting Human COX-2 Protein

 , , and
Abstract
:1. Introduction
2. Methods and Material
2.1. Ligand Selection
2.2. ADMET Analysis
2.3. ProTox-II
2.4. PROCHECK
2.5. Selection of Protein
2.5.1. Protein Preparation
2.5.2. Grid Dimensions
2.6. Inhibition Constant
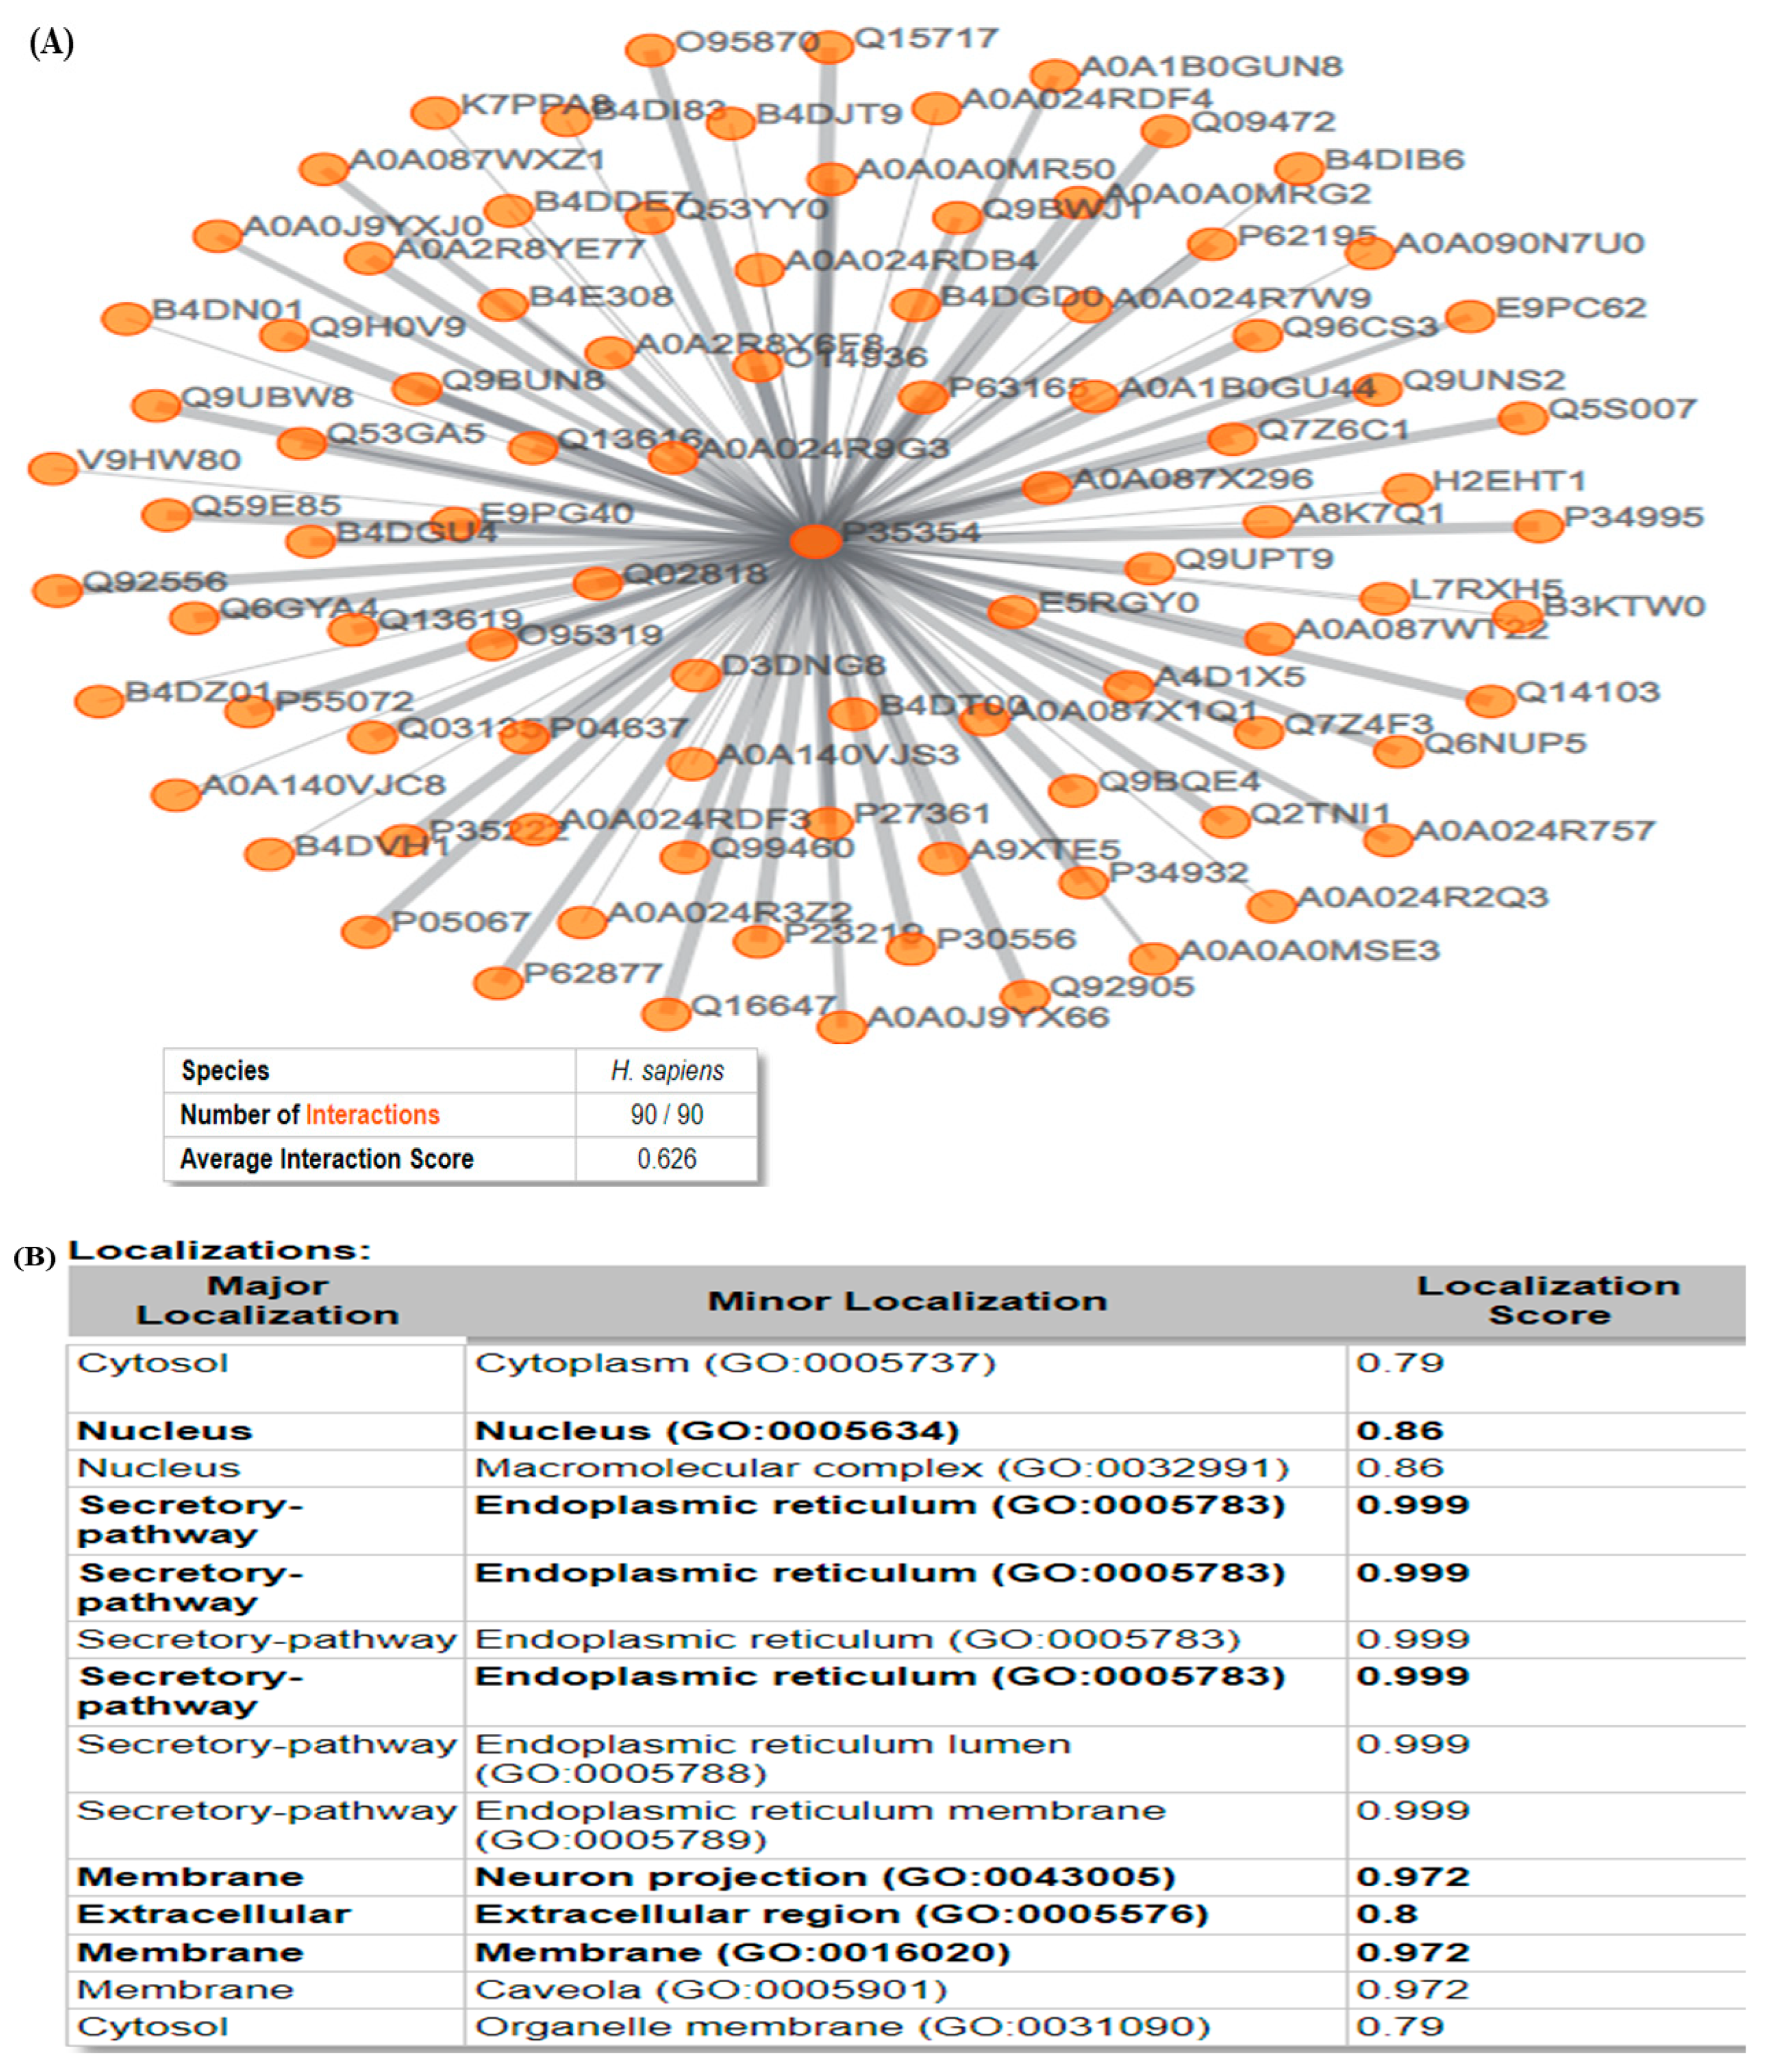
2.7. Compartmentalized Protein–Protein Interaction Database (ComPPI)
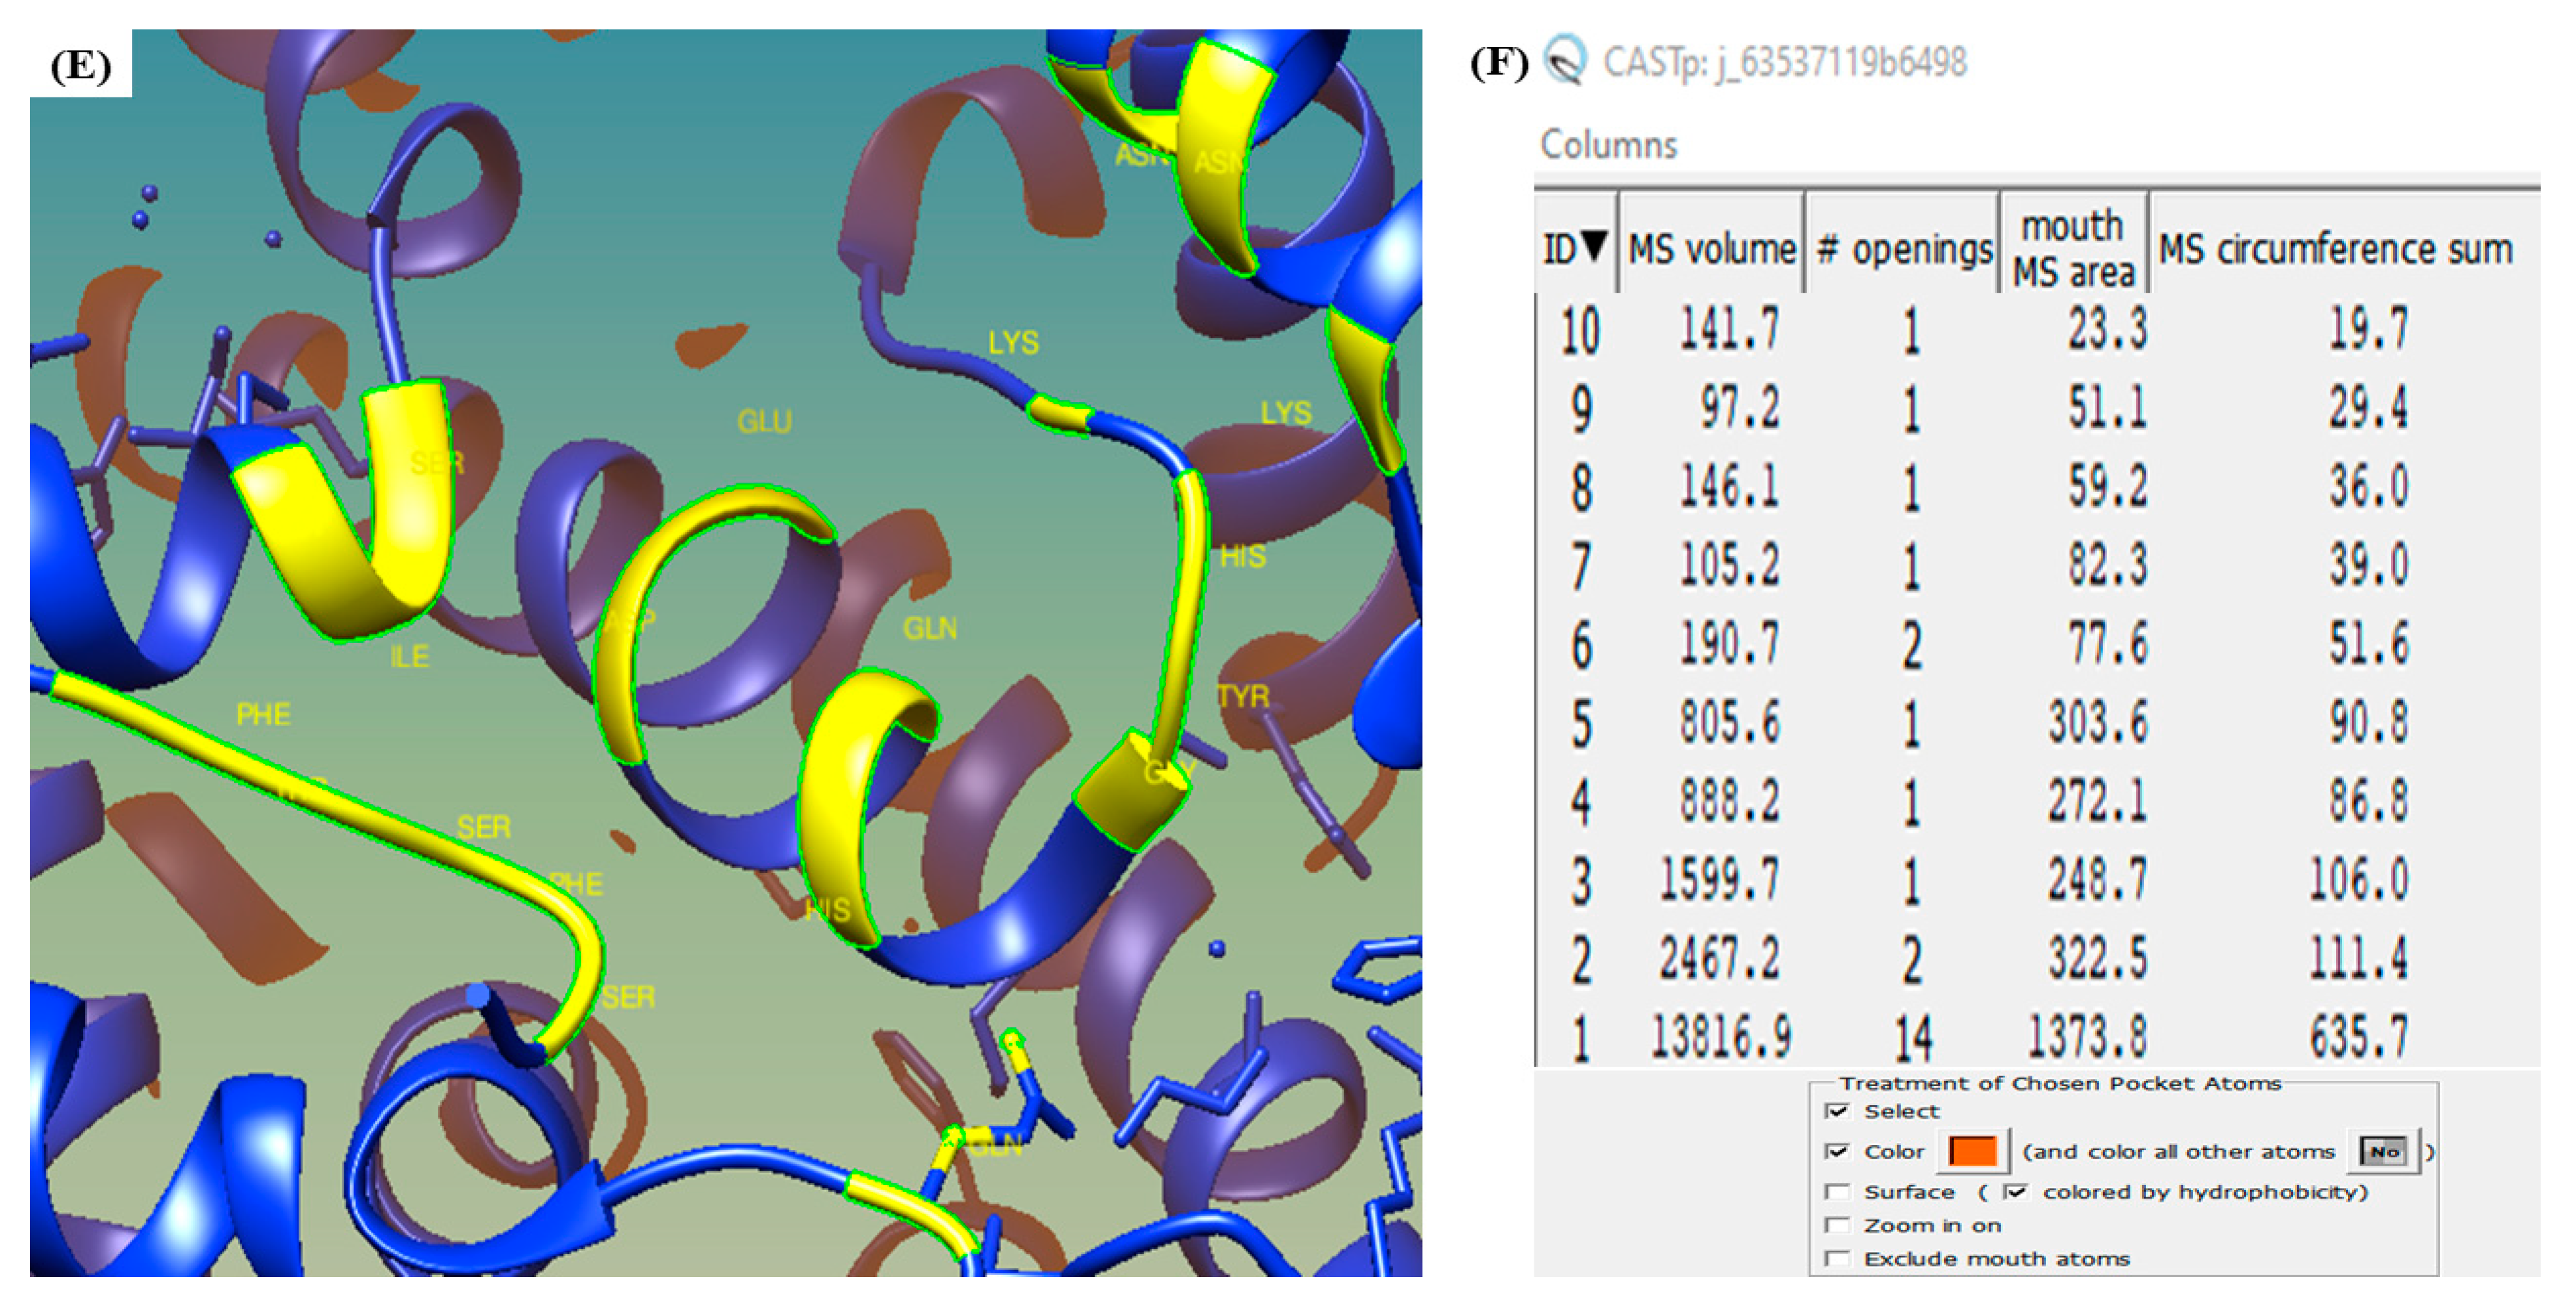
2.8. Computed Atlas of Surface Topography of Proteins (CASTp)
2.9. WEBnm@
2.10. Ligand and Receptor Dynamics (LARMD)
2.11. Gene Enrichment Analysis
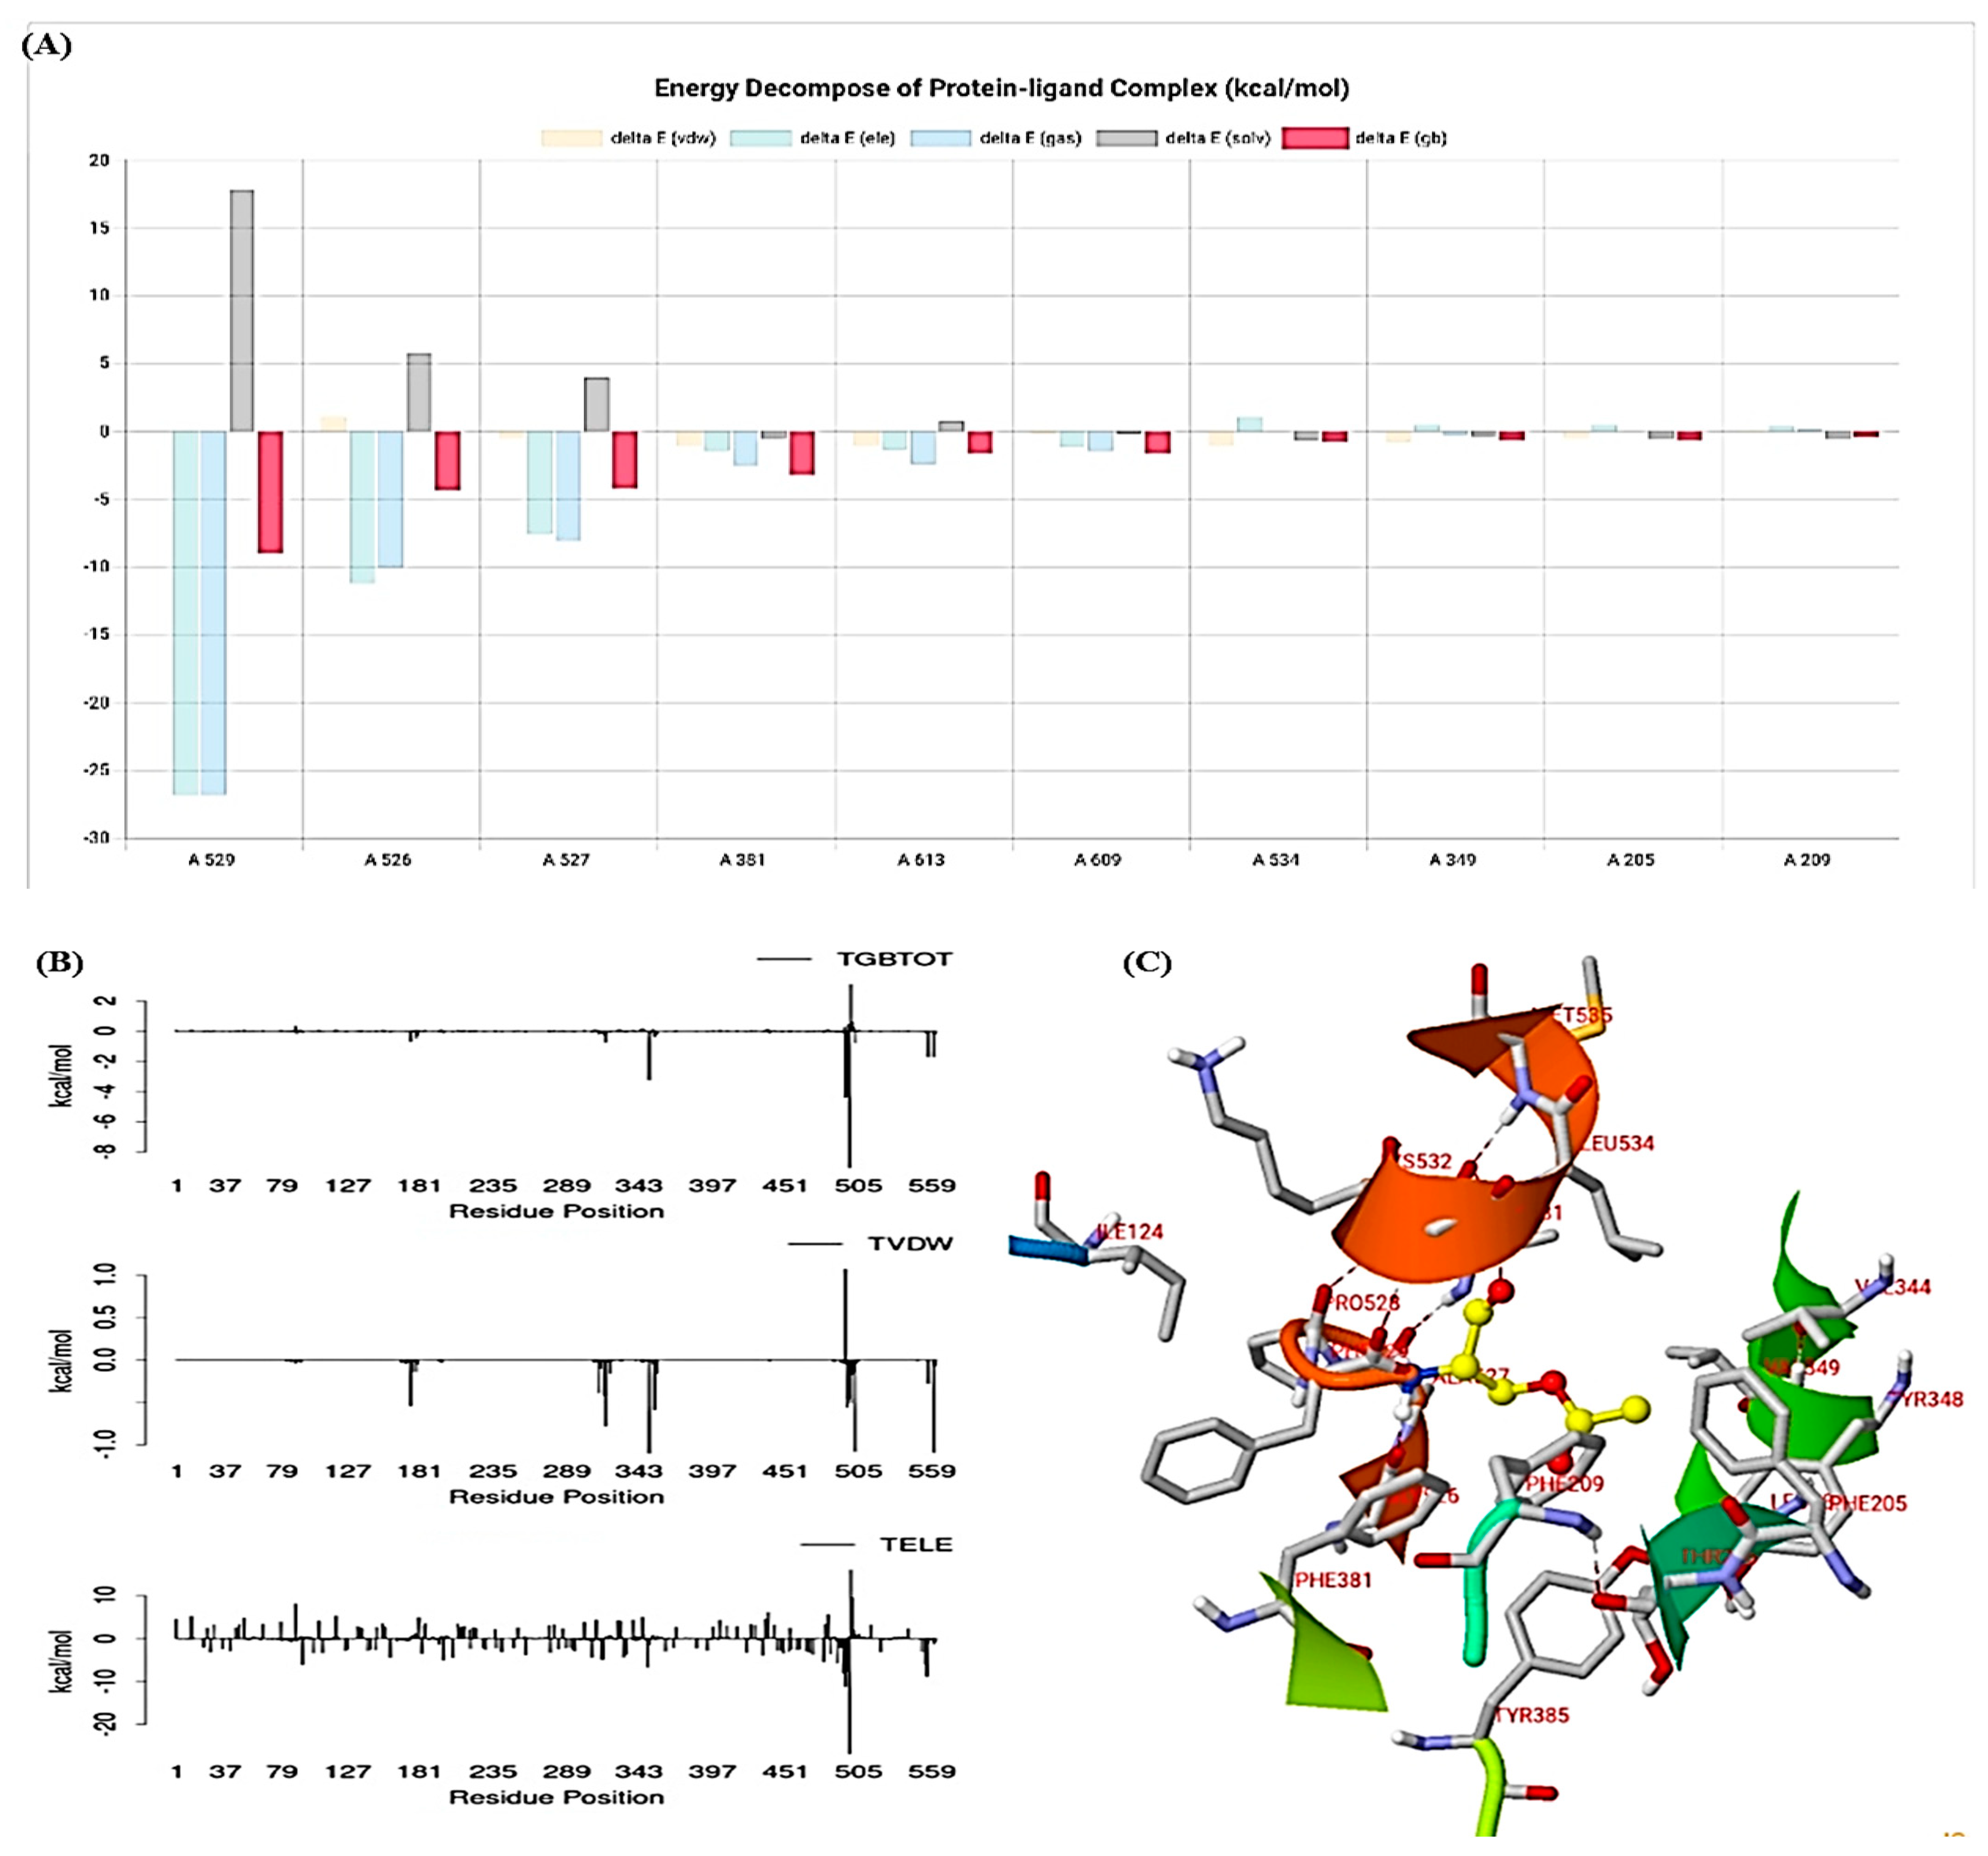
2.12. Molecular Dynamics Simulation
3. Results
3.1. ADMET Properties
3.2. ProTox-II Analysis
3.3. Molecular Docking
3.4. PROCHECK
3.5. ComPPI
3.6. CASTp
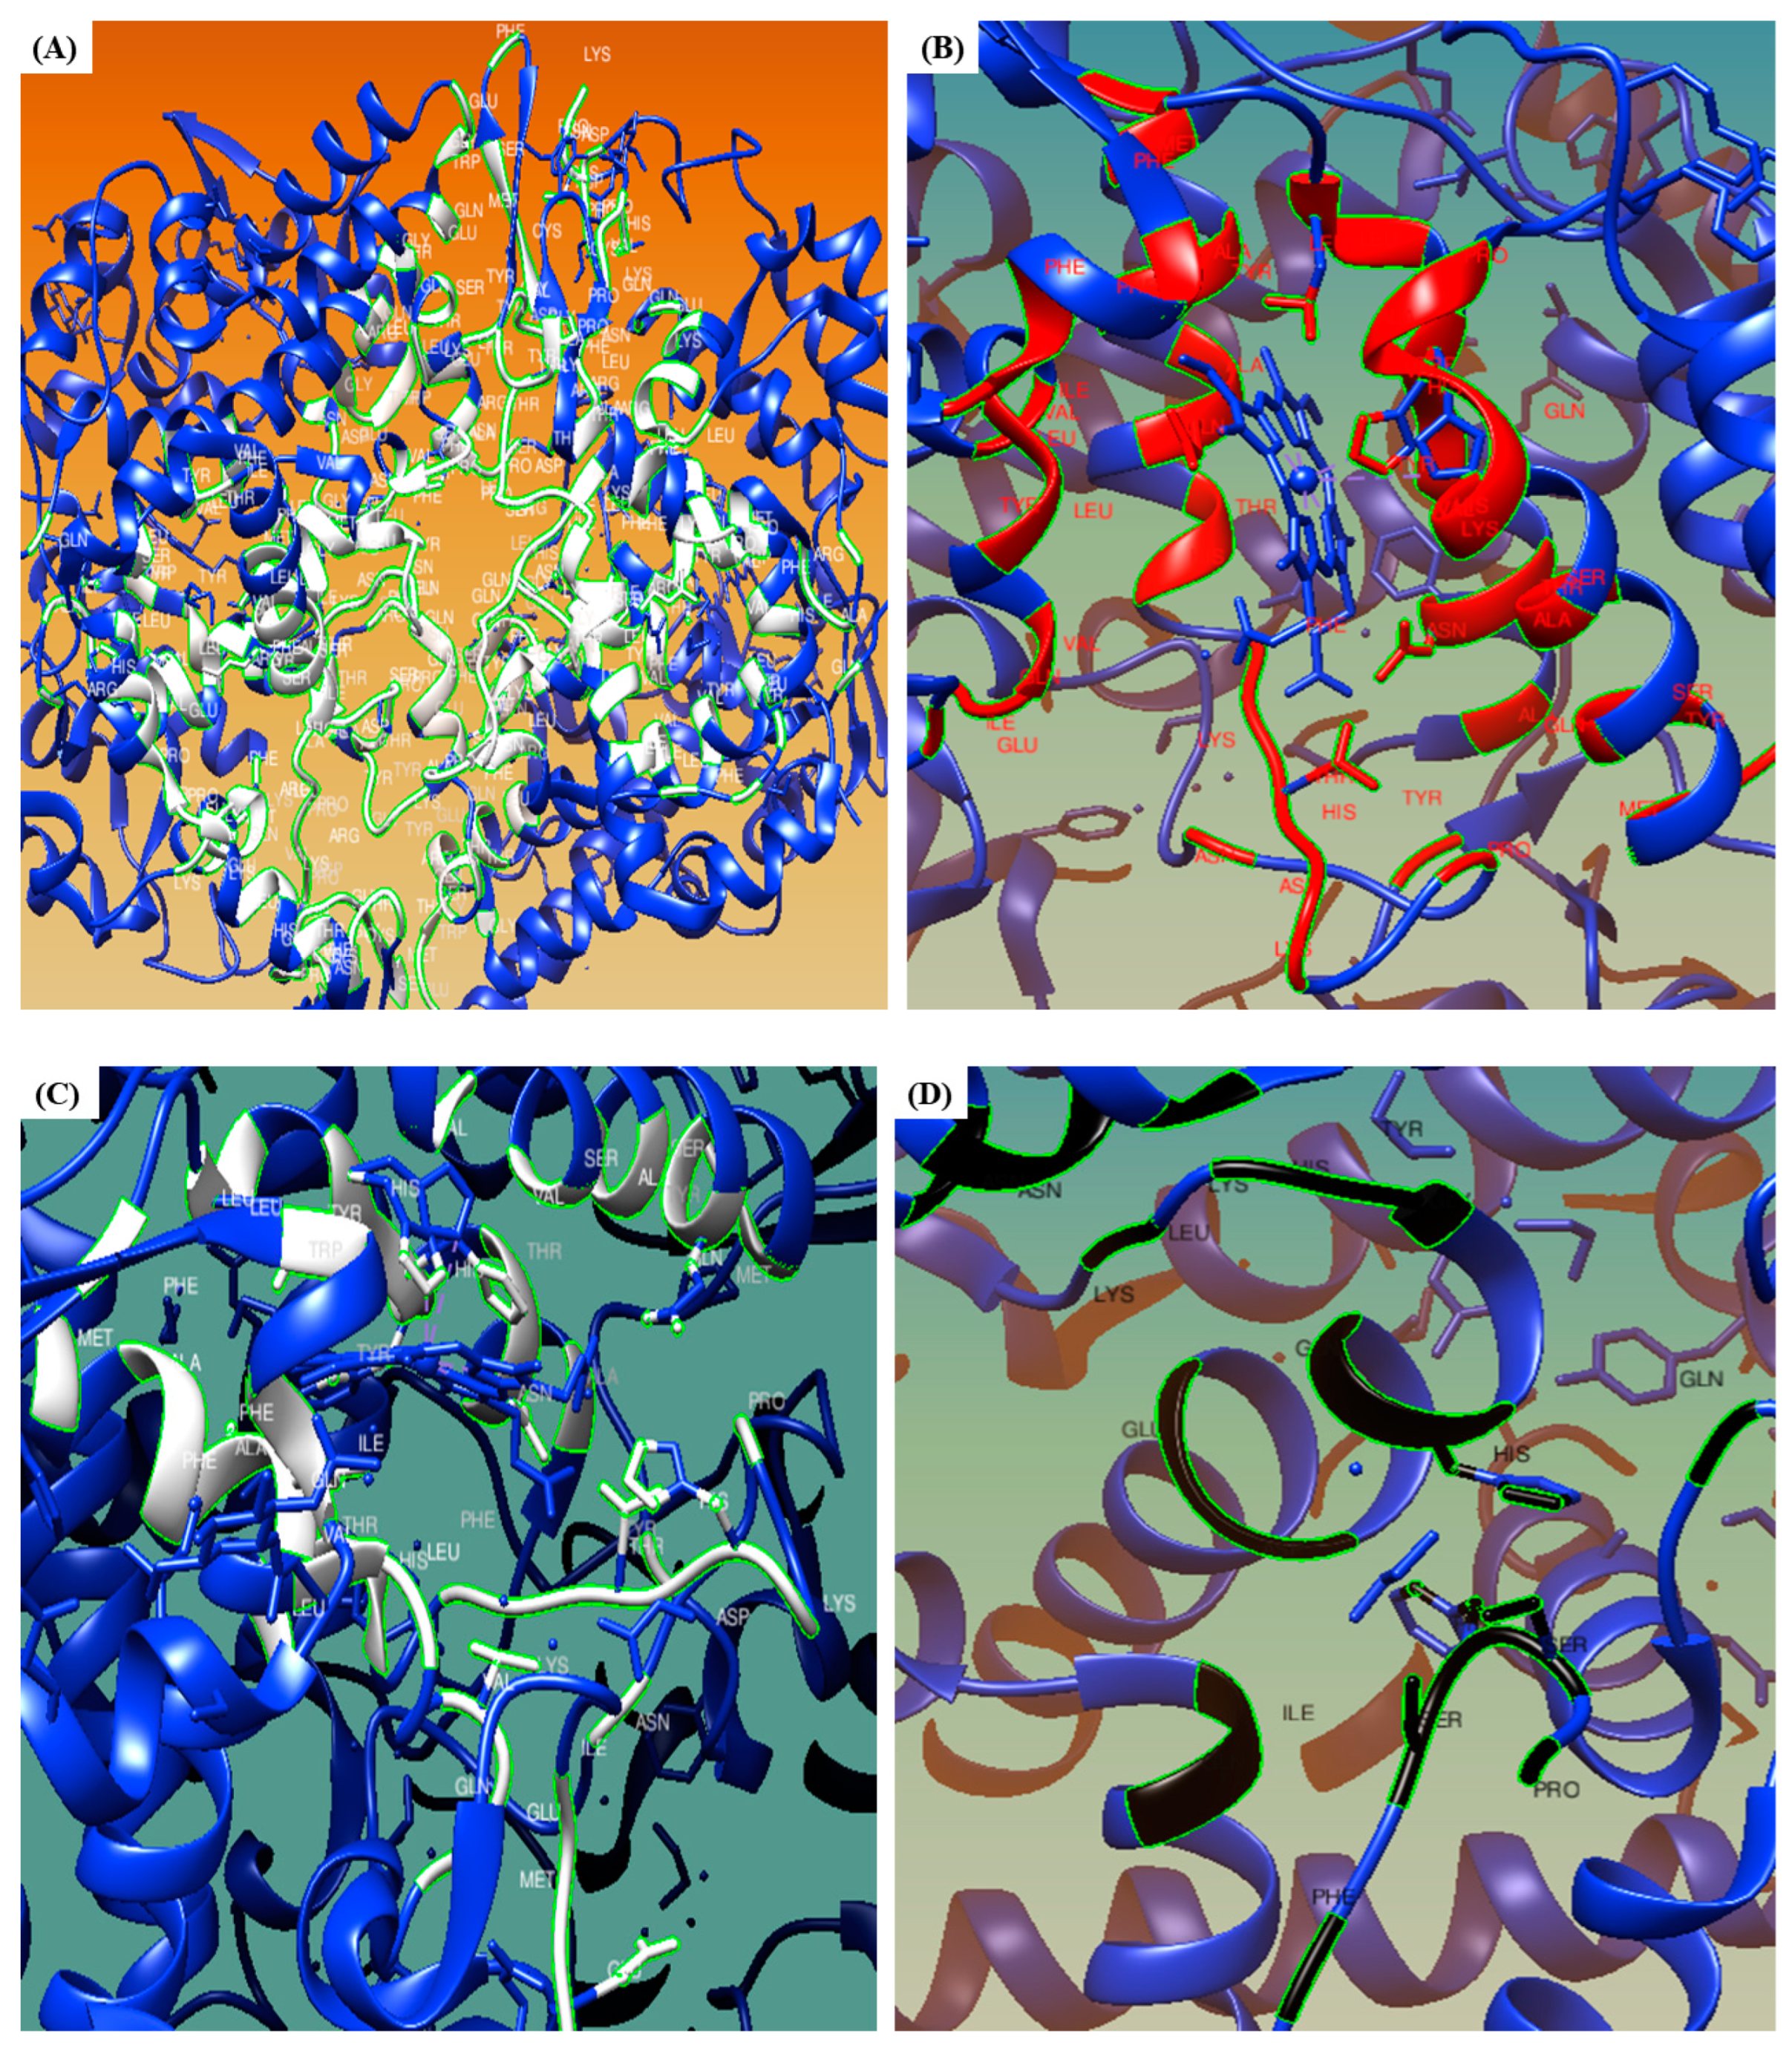
3.7. WEBnmα
3.8. LARMD
3.9. ShinyGO
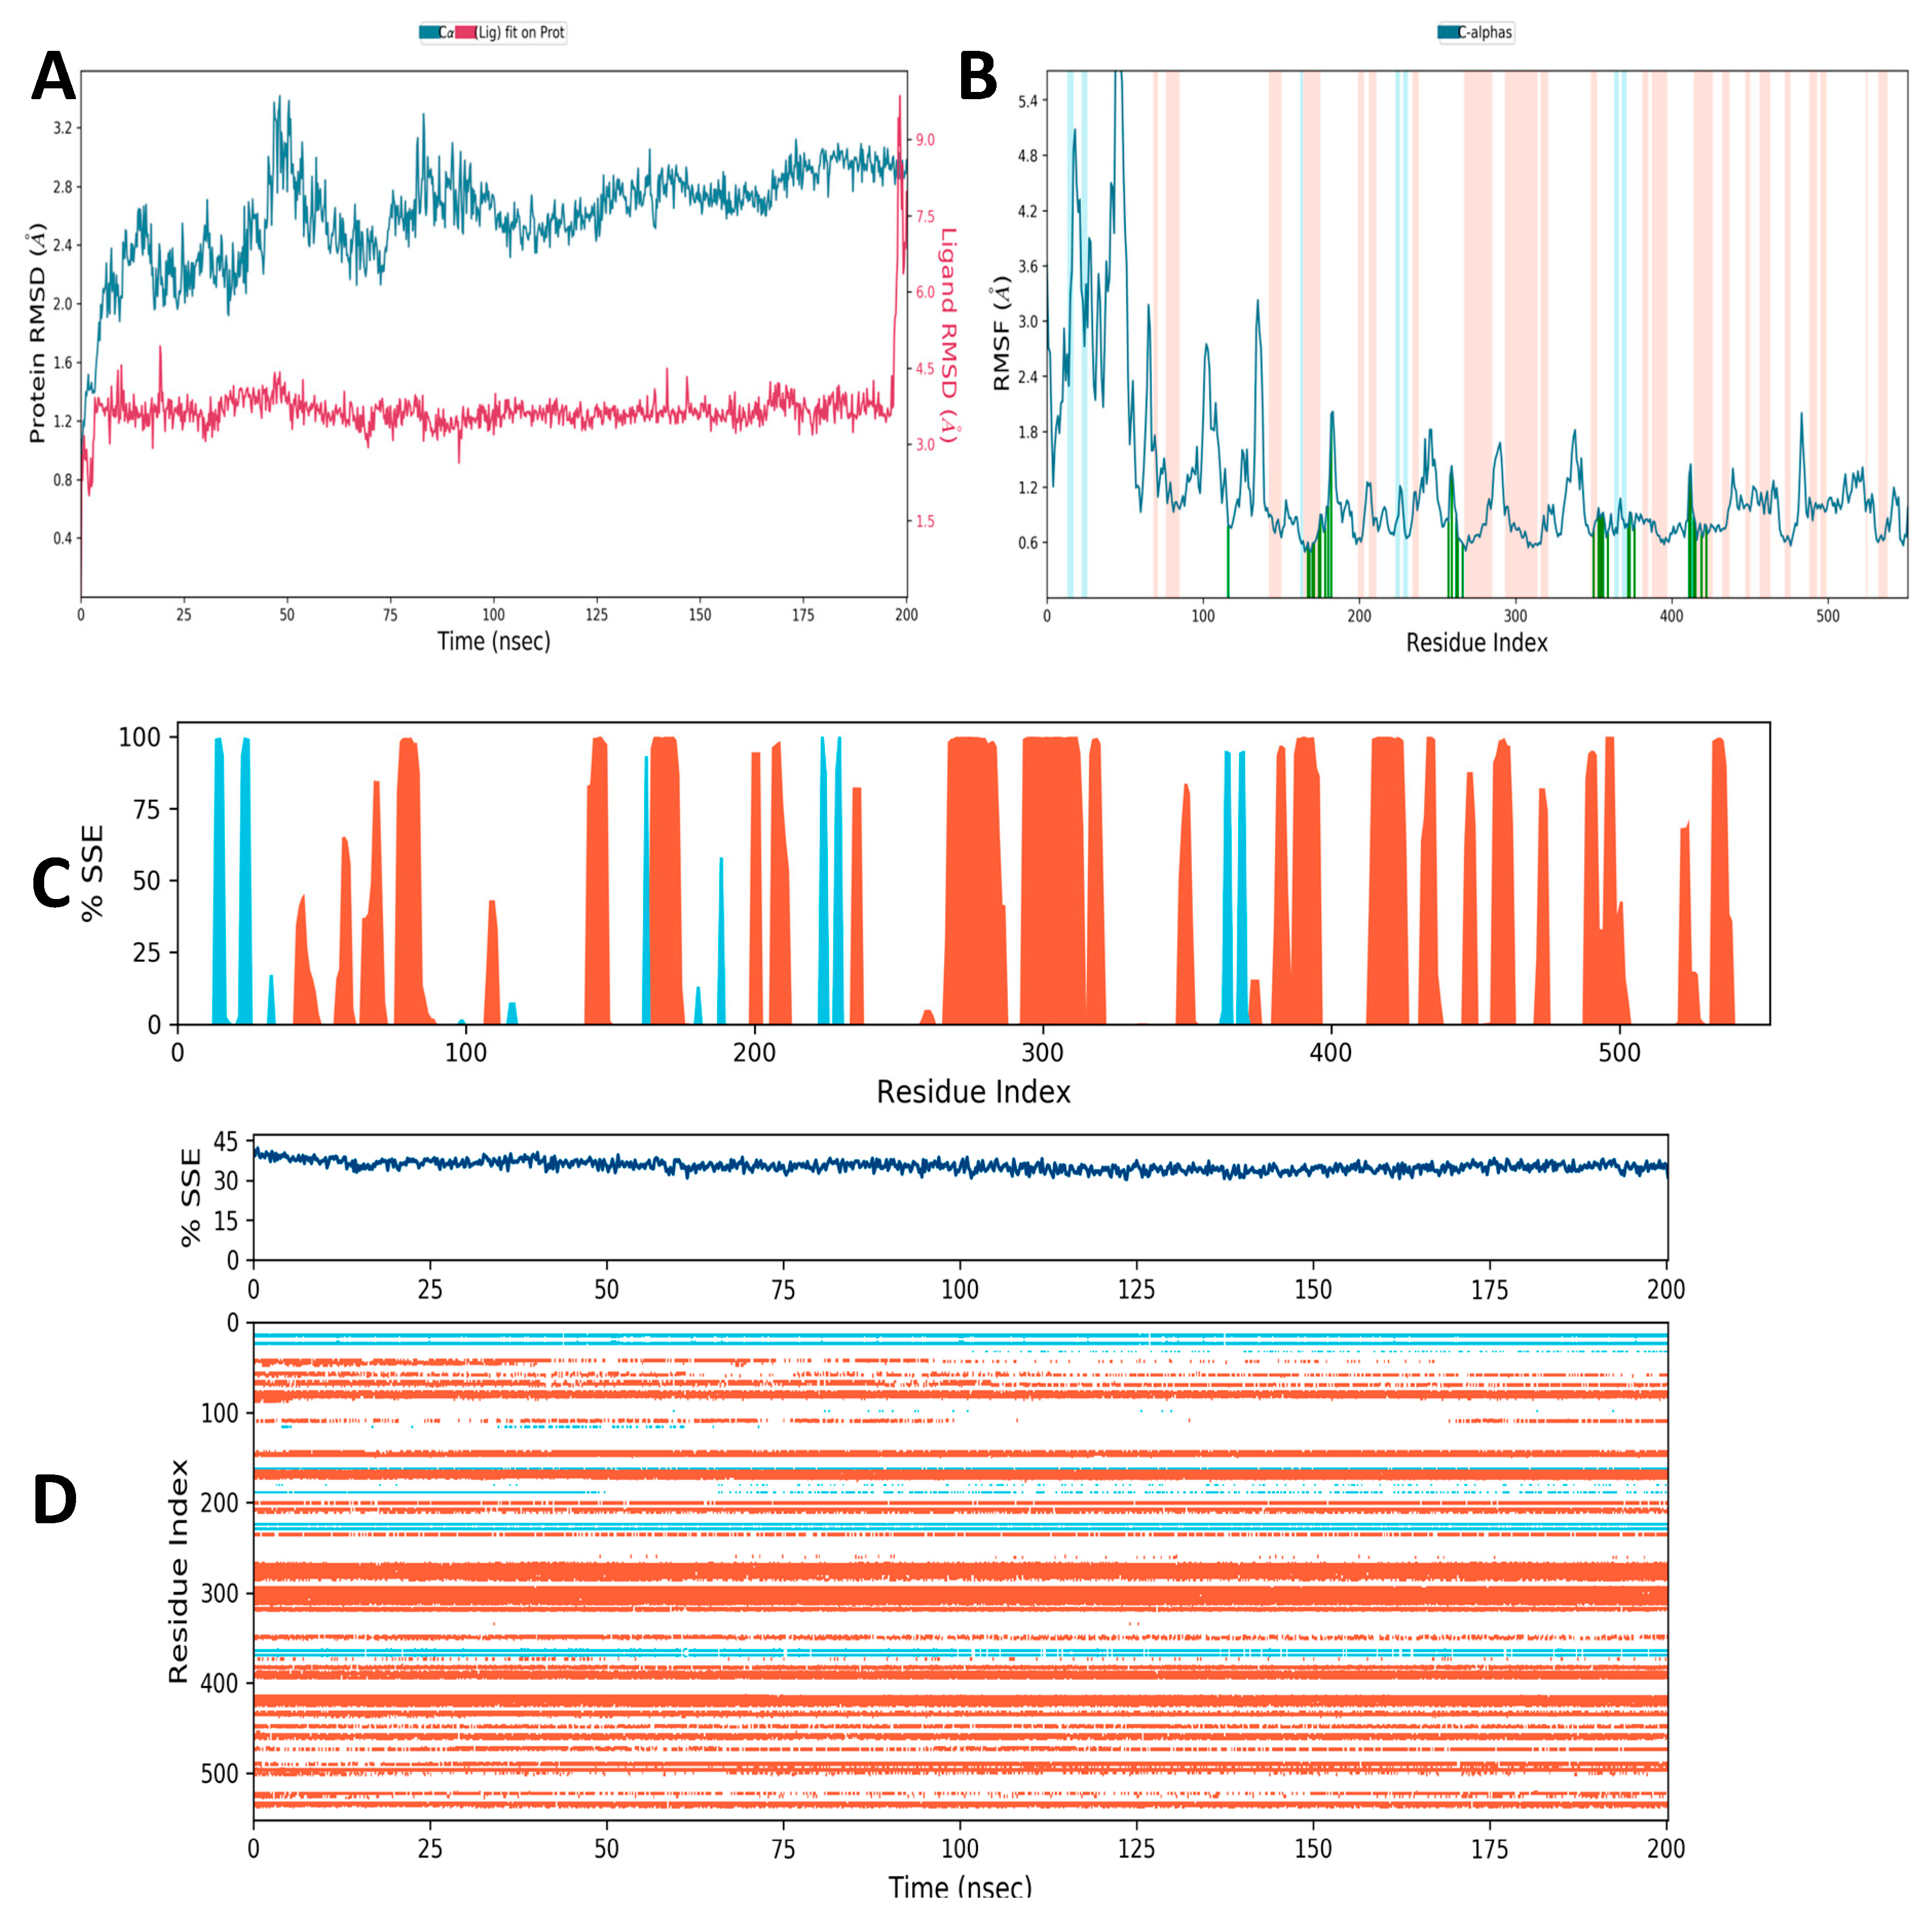
3.10. Molecular Simulation Study
3.10.1. Secondary Structural Elements
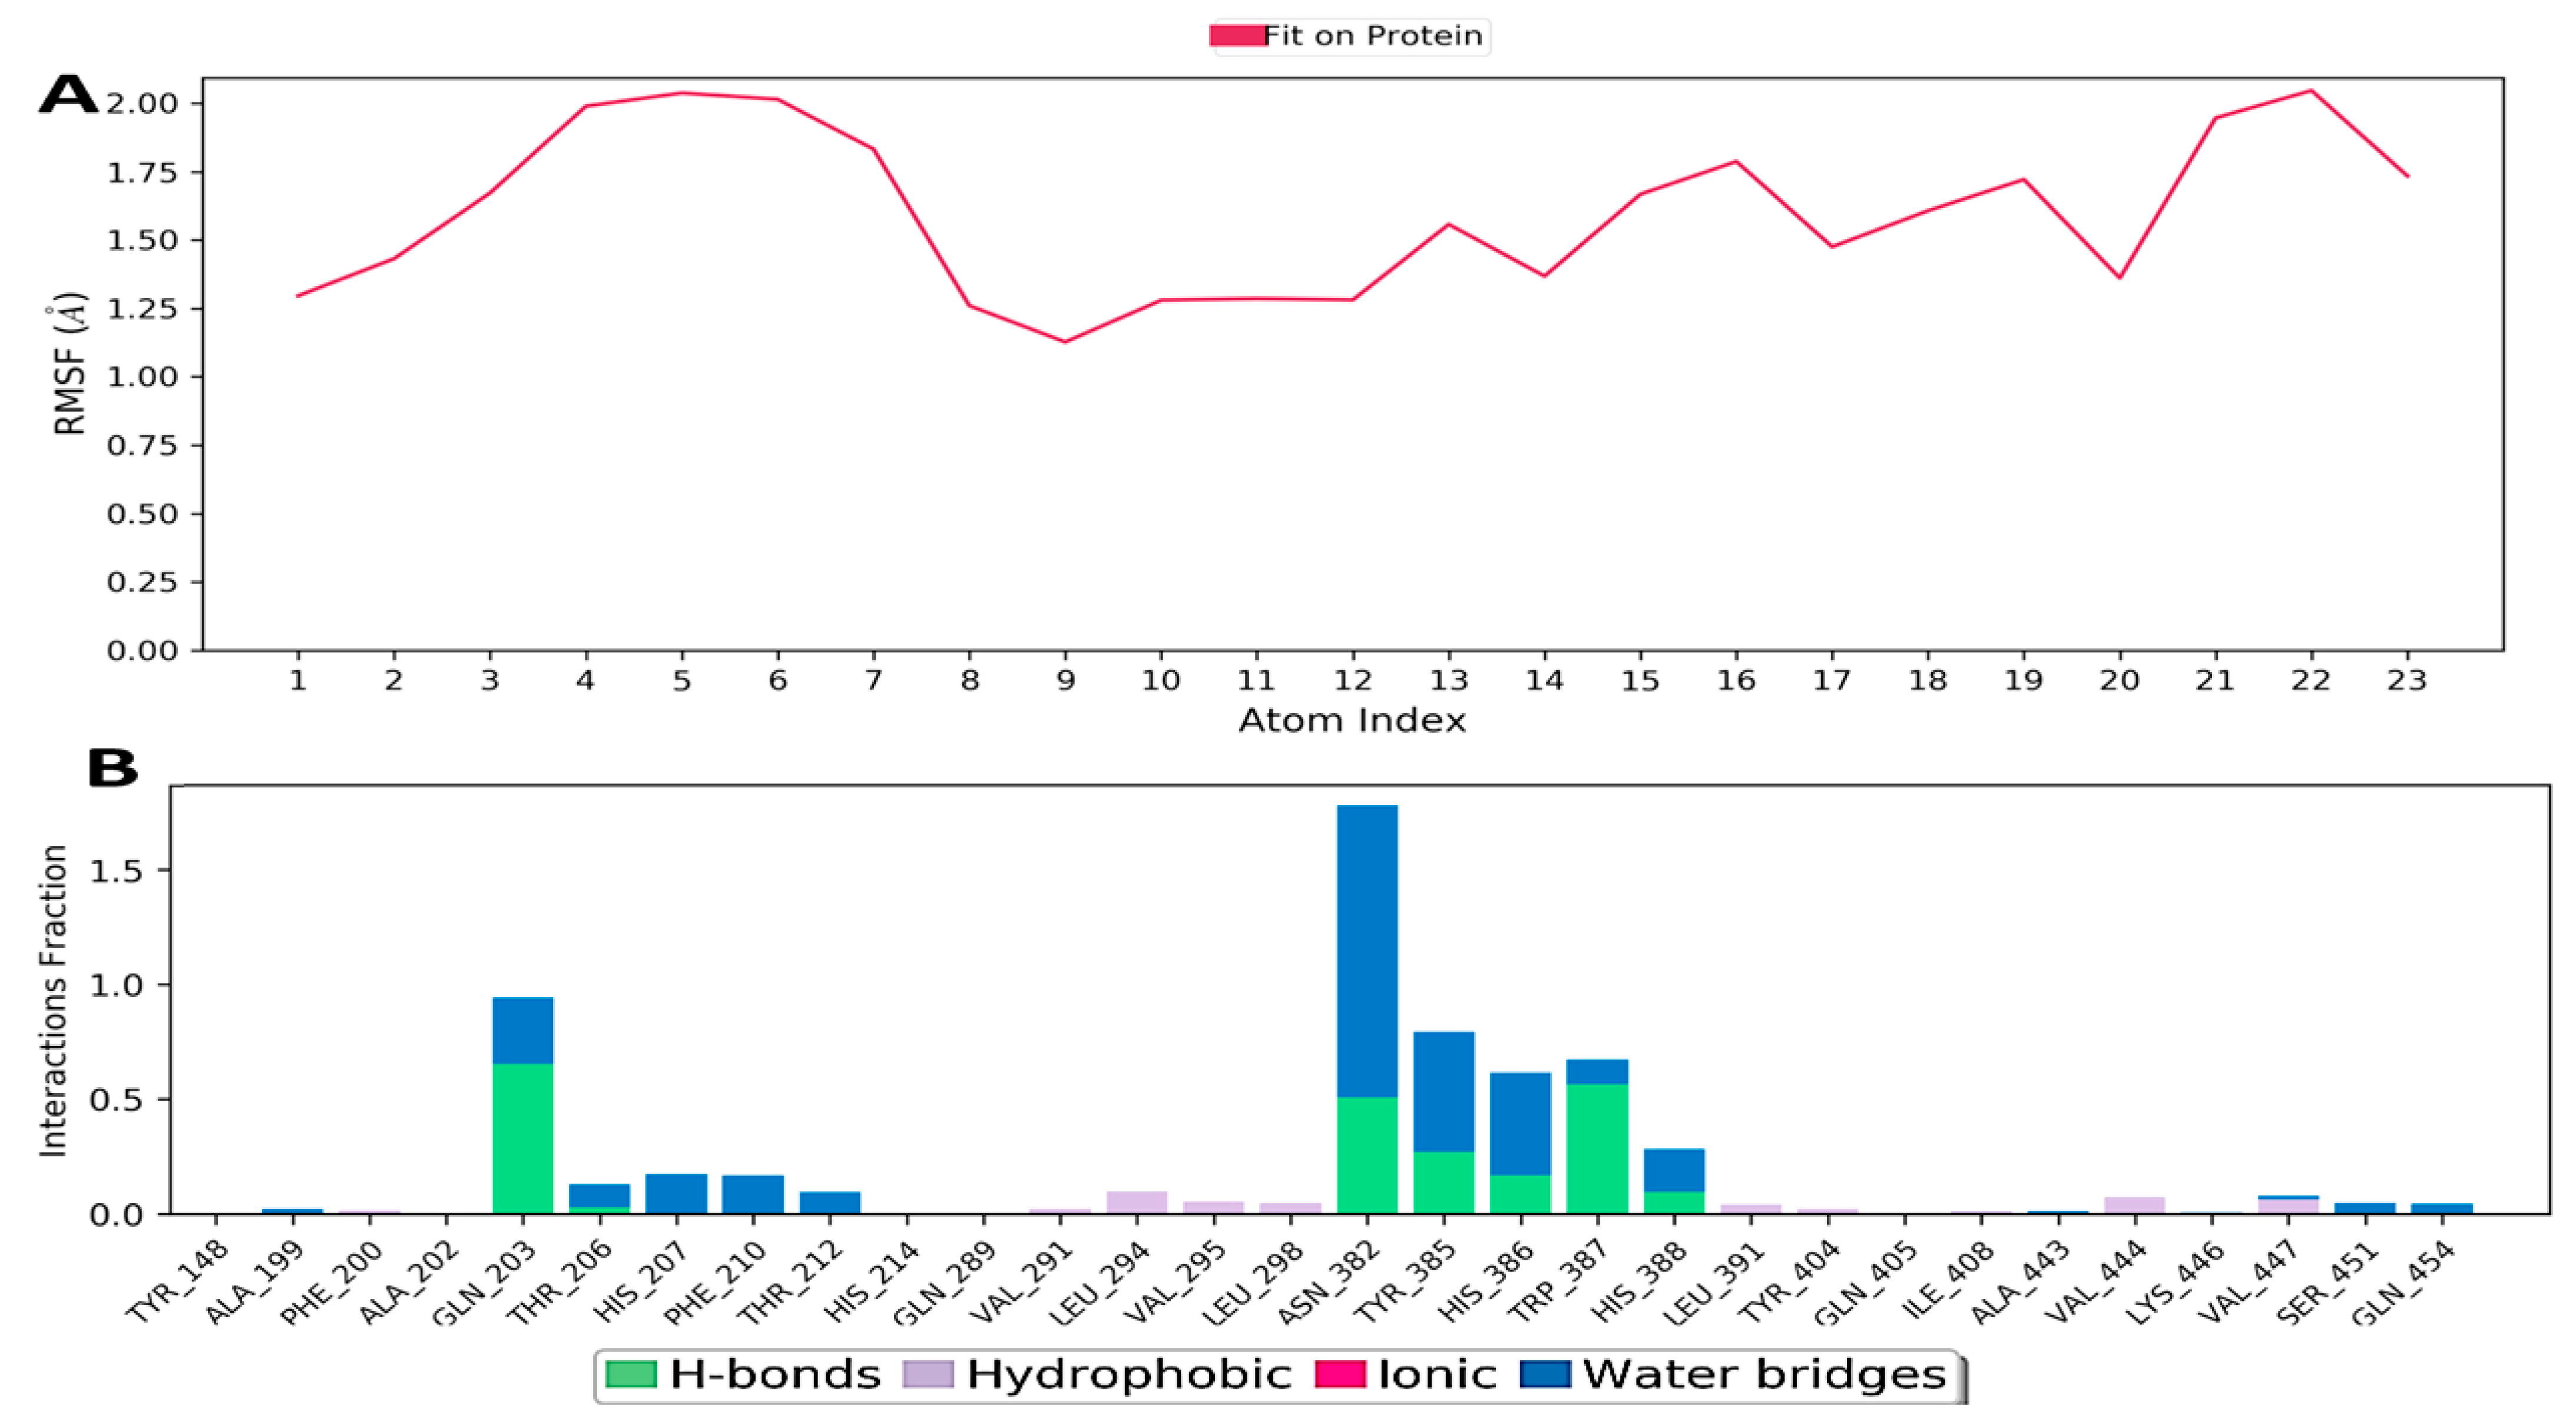
3.10.2. Hydrogen Bonding
3.10.3. Ionic Interaction
3.10.4. Hydrophobic Contacts (like p-p, p-Cation, etc.)
3.10.5. Water Bridge (like Water-Protein and Water-Ligand)
3.10.6. Protein–Ligand Contacts
3.10.7. Torsion Profile
4. Discussion
5. Conclusions
Author Contributions
Funding
Institutional Review Board Statement
Informed Consent Statement
Data Availability Statement
Acknowledgments
Conflicts of Interest
References
- Medzhitov, R. Inflammation 2010: New Adventures of an Old Flame. Cell 2010, 140, 771–776. [Google Scholar] [CrossRef] [PubMed]
- Chen, L.; Deng, H.; Cui, H.; Fang, J.; Zuo, Z.; Deng, J.; Li, Y.; Wang, X.; ZhÅ, L. Inflammatory Responses and Inflammation-Associated Diseases in Organs. Oncotarget 2018, 9, 7204–7218. [Google Scholar] [CrossRef] [PubMed]
- Abdulkhaleq, L.A.; Assi, M.A.; Abdullah, R.; Zamri-Saad, M.; Taufiq-Yap, Y.H.; Hezmee, M.N.M. The Crucial Roles of Inflammatory Mediators in Inflammation: A Review. Vet. World 2018, 11, 627–635. [Google Scholar] [CrossRef] [PubMed]
- Chopade, A.R.; Sayyad, F.J.; Pore, Y.V. Molecular Docking Studies of Phytocompounds from the Phyllanthus species as Potential Chronic Pain Modulators. Sci. Pharm. 2015, 83, 243–267. [Google Scholar] [CrossRef]
- Leláková, V.; Šmejkal, K.; Jakubczyk, K.; Veselý, O.; Landa, P.; Václavík, J.; Bobáľ, P.; Pížová, H.; Temml, V.; Steinacher, T.; et al. Parallel In Vitro and In Silico Investigations into Anti-Inflammatory Effects of Non-Prenylated Stilbenoids. Food Chem. 2019, 285, 431–440. [Google Scholar] [CrossRef]
- Ahmad, S.B.; Ali, A.; Bilal, M.; Rashid, S.M.; Wani, A.B.; Bhat, R.R.; Rehman, M.U. Melatonin and Health: Insights of Melatonin Action, Biological Functions, and Associated Disorders. Cell. Mol. Neurobiol. 2023, 43, 2437–2458. [Google Scholar] [CrossRef] [PubMed]
- Malla, B.A.; Ali, A.; Maqbool, I.; Dar, N.A.; Ahmad, S.B.; Alsaffar, R.M.; Rehman, M.U. Insights into Molecular Docking and Dynamics to Reveal Therapeutic Potential of Natural Compounds Against P53 Protein. J. Biomol. Struct. Dyn. 2023, 41, 8762–8781. [Google Scholar] [CrossRef]
- Aldossari, R.M.; Ali, A.; Rehman, M.U.; Rashid, S.; Ahmad, S.B. Computational Approaches for Identification of Potential Plant Bioactives as Novel G6PD Inhibitors Using Advanced Tools and Databases. Molecules 2023, 28, 3018. [Google Scholar] [CrossRef]
- Ahmed, E.M.; Kassab, A.E.; El-Malah, A.A.; Hassan, M.S.A. Synthesis and Biological Evaluation of Pyridazinone Derivatives as Selective COX-2 Inhibitors and Potential Anti-Inflammatory Agents. Eur. J. Med. Chem. 2019, 171, 25–37. [Google Scholar] [CrossRef]
- Nandakishore, R.; Yalavarthi, P.R.; Kiran, Y.R.; Rajapranathi, M. Selective Cyclooxygenase Inhibitors: Current Status. Curr. Drug Discov. Technol. 2014, 11, 127–132. [Google Scholar] [CrossRef]
- Kurumbail, R.G.; Stevens, A.M.; Gierse, J.K.; McDonald, J.J.; Stegeman, R.A.; Pak, J.Y.; Gildehaus, D.; Miyashiro, J.M.; Penning, T.D.; Seibert, K.; et al. Structural Basis for Selective Inhibition of Cyclooxygenase-2 by Anti-Inflammatory Agents. Nature 1996, 384, 644–648. [Google Scholar] [CrossRef] [PubMed]
- Rouzer, C.A.; Marnett, L.J. Cyclooxygenases: Structural and Functional Insights. J. Lipid Res. 2009, 50, S29–S34. [Google Scholar] [CrossRef]
- Perrone, M.G.; Scilimati, A.; Simone, L.; Vitale, P. Selective COX-1 Inhibition: A Therapeutic Target to Be Reconsidered. Curr. Med. Chem. 2010, 17, 3769–3805. [Google Scholar] [CrossRef] [PubMed]
- de Souza, G.; Silva, R.J.; Milián, I.C.B.; Rosini, A.M.; de Araújo, T.E.; Teixeira, S.C.; Barbosa, B.F. Cyclooxygenase (COX)-2 Modulates Toxoplasma gondii Infection, Immune Response and Lipid Droplets Formation in Human Trophoblast Cells and Villous Explants. Sci. Rep. 2021, 11, 12709. [Google Scholar] [CrossRef]
- El-Sayed, N.A.; Nour, M.S.; Salem, M.A.; Arafa, R.K. New Oxadiazoles with Selective-COX-2 and EGFR Dual Inhibitory Activity: Design, Synthesis, Cytotoxicity Evaluation and In Silico Studies. Eur. J. Med. Chem. 2019, 183, 111693. [Google Scholar] [CrossRef]
- Kumar, R.; Saha, N.; Purohit, P.; Garg, S.K.; Seth, K.; Meena, V.S.; Dubey, S.; Dave, K.; Goyal, R.; Sharma, S.S.; et al. Cyclic Enaminone as New Chemotype for Selective Cyclooxygenase-2 Inhibitory, Anti-Inflammatory, and Analgesic Activities. Eur. J. Med. Chem. 2019, 182, 111601. [Google Scholar] [CrossRef]
- Andrade, P.B.; Valentão, P. Insights into Natural Products in Inflammation. Int. J. Mol. Sci. 2018, 19, 644. [Google Scholar] [CrossRef] [PubMed]
- Wang, Y.H.; Zeng, K.W. Natural Products as a Crucial Source of Anti-Inflammatory Drugs: Recent Trends and Advancements. Trad. Med. Res. 2019, 4, 257–268. [Google Scholar] [CrossRef]
- Wink, M. Modes of Action of Herbal Medicines and Plant Secondary Metabolites. Medicines 2015, 2, 251–286. [Google Scholar] [CrossRef]
- Schafer, H.; Wink, M. Medicinally Important Secondary Metabolites in Recombinant Microorganisms or Plants: Progress in Alkaloid Biosynthesis. Biotechnol. J. 2009, 4, 1684–1703. [Google Scholar] [CrossRef]
- Matsuura, H.N.; Fett-Neto, A.G. Plant Alkaloids: Main Features, Toxicity, and Mechanisms of Action. Plant Toxins 2015, 2, 1–15. [Google Scholar]
- Souto, A.L.; Tavares, J.F.; Da Silva, M.S.; Diniz, M.D.F.F.M.; de Athayde-Filho, P.F.; Barbosa Filho, J.M.B. Anti-Inflammatory Activity of Alkaloids: An Update from 2000 to 2010. Molecules 2011, 16, 8515–8534. [Google Scholar] [CrossRef]
- Alsaffar, R.M.; Ali, A.; Rashid, S.M.; Ahmad, S.B.; Alkholifi, F.K.; Kawoosa, M.S.; Ahmad, S.P.; Rehman, M.U. Zerumbone Protects Rats from Collagen-Induced Arthritis by Inhibiting Oxidative Outbursts and Inflammatory Cytokine Levels. ACS Omega 2023, 8, 2982–2991. [Google Scholar] [CrossRef]
- Cui, J.; Jia, J. Natural COX-2 Inhibitors as Promising Anti-Inflammatory Agents: An Update. Curr. Med. Chem. 2021, 28, 3622–3646. [Google Scholar] [CrossRef] [PubMed]
- Ambati, G.G.; Jachak, S.M. Natural Product Inhibitors of Cyclooxygenase (COX) Enzyme: A Review on Current Status and Future Perspectives. Curr. Med. Chem. 2021, 28, 1877–1905. [Google Scholar] [CrossRef]
- Chandel, P.; Rawal, R.K.; Kaur, R. Natural Products and Their Derivatives as Cyclooxygenase-2 Inhibitors. Future Med. Chem. 2018, 10, 2471–2492. [Google Scholar] [CrossRef] [PubMed]
- Heydari, S.; Haghayegh, G.H. Extraction and Microextraction Techniques for the Determination of Compounds from Saffron. Chem. C Trans. 2014, 2, 221–247. [Google Scholar]
- Patel, S.; Sarwat, M.; Khan, T.H. Mechanism Behind the Anti-tumour Potential of Saffron (Crocus sativus L.): The Molecular Perspective. Crit. Rev. Oncol. Hematol. 2017, 115, 27–35. [Google Scholar] [CrossRef]
- Khorasany, A.R.; Hosseinzadeh, H. Therapeutic Effects of Saffron (Crocus sativus L.) in Digestive Disorders: A Review. Iran. J. Basic Med. Sci. 2016, 19, 455–469. [Google Scholar]
- Christodoulou, E.; Grafakou, M.E.; Skaltsa, E.; Kadoglou, N.; Kostomitsopoulos, N.; Valsami, G. Preparation, Chemical Characterization and Determination of Crocetin’s Pharmacokinetics after Oral and Intravenous Administration of Saffron (Crocus sativus L.) Aqueous Extract to C57/BL6J Mice. J. Pharm. Pharmacol. 2019, 71, 753–764. [Google Scholar] [CrossRef]
- Zeinali, M.; Zirak, M.R.; Rezaee, S.A.; Karimi, G.; Hosseinzadeh, H. Immunoregulatory and Anti-Inflammatory Properties of Crocus sativus (Saffron) and Its Main Active Constituents: A Review. Iran. J. Basic Med. Sci. 2019, 22, 334–344. [Google Scholar] [CrossRef] [PubMed]
- Khajeh, E.; Rasmi, Y.; Kheradmand, F.; Malekinejad, H.; Aramwit, P.; Saboory, E.; Daeihassani, B.; Nasirzadeh, M. Crocetin Suppresses the Growth and Migration in HCT-116 Human Colorectal Cancer Cells by Activating the p-38 MAPK Signaling Pathway. Res. Pharm. Sci. 2020, 15, 592–601. [Google Scholar] [CrossRef] [PubMed]
- Zhang, J.; Wang, Y.; Dong, X.; Liu, J. Crocetin Attenuates Inflammation and Amyloid-β Accumulation in APPsw Transgenic Mice. Immun. Ageing 2018, 15, 24. [Google Scholar] [CrossRef]
- D’Onofrio, G.; Nabavi, S.M.; Sancarlo, D.; Greco, A.; Pieretti, S. Crocus sativus L.(Saffron) in Alzheimer’s Disease Treatment: Bioactive Effects on Cognitive Impairment. Curr. Neuropharmacol. 2021, 19, 1606–1616. [Google Scholar] [CrossRef]
- Dar, R.A.; Brahman, P.K.; Khurana, N.; Wagay, J.A.; Lone, Z.A.; Ganaie, M.A.; Pitre, K.S. Evaluation of Antioxidant Activity of Crocin, Podophyllotoxin and Kaempferol by Chemical, Biochemical and Electrochemical Assays. Arab. J. Chem. 2017, 10, S1119–S1128. [Google Scholar] [CrossRef]
- Ghorbanzadeh, V.; Mohammadi, M.; Dariushnejad, H.; Abhari, A.; Chodari, L.; Mohaddes, G. Cardioprotective Effect of Crocin Combined with Voluntary Exercise in Rat: Role of mir-126 and mir-210 in Heart Angiogenesis. Arq. Bras. Cardiol. 2017, 109, 54–62. [Google Scholar] [CrossRef]
- Maqbool, Z.; Arshad, M.S.; Ali, A.; Aziz, A.; Khalid, W.; Afzal, M.F.; Bangar, S.P.; Addi, M.; Hano, C.; Lorenzo, J.M. Potential Role of Phytochemical Extract from Saffron in Development of Functional Foods and Protection of Brain-Related Disorders. Oxid. Med. Cell. Longev. 2022, 2022, 6480590. [Google Scholar] [CrossRef]
- Daina, A.; Michielin, O.; Zoete, V. SwissADME: A Free Web Tool to Evaluate Pharmacokinetics, Drug-Likeness and Medicinal Chemistry Friendliness of Small Molecules. Sci. Rep. 2017, 7, 42717. [Google Scholar] [CrossRef]
- Lipinski, C.A. Lead- and Drug-like Compounds: The Rule-of-Five Revolution. Drug Discov. Today Technol. 2004, 1, 337–341. [Google Scholar] [CrossRef]
- Banerjee, P.; Eckert, A.O.; Schrey, A.K.; Preissner, R. ProTox-II: A Webserver for the Prediction of Toxicity of Chemicals. Nucleic Acids Res. 2018, 46, W257–W263. [Google Scholar] [CrossRef]
- Laskowski, R.A.; MacArthur, M.W.; Moss, D.S.; Thornton, J.M. PROCHECK: A Program to Check the Stereochemical Quality of Protein Structures. J. Appl. Crystallogr. 1993, 26, 283–291. [Google Scholar] [CrossRef]
- Kleywegt, G.J.; Jones, T.A. Phi/Psi-Chology: Ramachandran Revisited. Structure 1996, 4, 1395–1400. [Google Scholar] [CrossRef] [PubMed]
- Trott, O.; Olson, A.J. AutoDock Vina: Improving the Speed and Accuracy of Docking with a New Scoring Function, Efficient Optimization, and Multithreading. J. Comp. Chem. 2010, 31, 455–461. [Google Scholar] [CrossRef] [PubMed]
- Veres, D.V.; Gyurkó, D.M.; Thaler, B.; Szalay, K.Z.; Fazekas, D.; Korcsmáros, T.; Csermely, P. ComPPI: A Cellular Compartment-Specific Database for Protein–Protein Interaction Network Analysis. Nucleic Acids Res. 2014, 43, D485–D493. [Google Scholar] [CrossRef] [PubMed]
- Hinsen, K. The Molecular Modeling Toolkit: A New Approach to Molecular Simulations. J. Comp. Chem. 2000, 21, 79–85. [Google Scholar] [CrossRef]
- Raha, K.; Merz, K.M. Large-Scale Validation of a Quantum Mechanics Based Scoring Function: Predicting the Binding Affinity and the Binding Mode of a Diverse Set of Protein−Ligand Complexes. J. Med. Chem. 2005, 48, 4558–4575. [Google Scholar] [CrossRef]
- Hou, T.; Wang, J.; Li, Y.; Wang, W. Assessing the Performance of the MM/PBSA and MM/GBSA Methods. 1. The Accuracy of Binding Free Energy Calculations Based on Molecular Dynamics Simulations. J. Chem. Inf. Model. 2011, 51, 69–82. [Google Scholar] [CrossRef]
- HÅ, D.; He, X.; Ji, B.; Zhang, S.; Wang, J. How Well Does the Extended Linear Interaction Energy Method Perform in Accurate Binding Free Energy Calculations? J. Chem. Inf. Model. 2020, 60, 6624–6633. [Google Scholar] [CrossRef]
- Jorgensen, W.L.; Chandrasekhar, J.; Madura, J.D.; Impey, R.W.; Klein, M.L. Comparison of Simple Potential Functions for Simulating Liquid Water. J. Chem. Phys. 1983, 79, 926–935. [Google Scholar] [CrossRef]
- Martyna, G.J.; Tobias, D.J.; Klein, M.L. Constant Pressure Molecular Dynamics Algorithms. J. Chem. Phys. 1994, 101, 4177–4189. [Google Scholar] [CrossRef]
- Ali, A.; Mir, G.J.; Ayaz, A.; Maqbool, I.; Ahmad, S.B.; Mushtaq, S.; Khan, A.; Mir, T.M.; Rehman, M.U. In Silico Analysis and Molecular Docking Studies of Natural Compounds of Withania somnifera Against Bovine NLRP9. J. Mol. Model. 2023, 29, 171. [Google Scholar] [CrossRef] [PubMed]
- Mahmud, S.; Paul, G.K.; Afroze, M.; Islam, S.; Gupt, S.B.R.; Razu, M.H.; Biswas, S.; Zaman, S.; Uddin, M.S.; Khan, M.; et al. Efficacy of Phytochemicals Derived from Avicennia officinalis for the Management of COVID-19: A Combined In Silico and Biochemical Study. Molecules 2021, 26, 2210. [Google Scholar] [CrossRef] [PubMed]
- Ali, A.; Rehman, M.U.; Mushtaq, S.; Ahmad, S.B.; Khan, A.; Karan, A.; Bashir Wani, A.; Ganie, S.A.; Mir, M.U.R. Biochemical and Computational Assessment of Acute Phase Proteins in Dairy Cows Affected with Subclinical Mastitis. Curr. Issues Mol. Biol. 2023, 45, 5317–5346. [Google Scholar] [CrossRef] [PubMed]
- Khan, J.; Sakib, S.A.; Mahmud, S.; Khan, Z.; Islam, M.N.; Sakib, M.A.; Emran, T.B.; Simal-Gandara, J. Identification of Potential Phytochemicals from Citrus limon against Main Protease of SARS-CoV-2: Molecular Docking, Molecular Dynamic Simulations and Quantum Computations. J. Biomol. Struct. Dyn. 2022, 40, 10741–10752. [Google Scholar] [CrossRef]
- Rehman, M.U.; Ali, A.; Ansar, R.; Arafah, A.; Imtiyaz, Z.; Wani, T.A.; Zargar, S.; Ganie, S.A. In Silico Molecular Docking and Dynamic Analysis of Natural Compounds Against Major Nonstructural Proteins of SARS-CoV-2. J. Biomol. Struct. Dyn. 2023, 41, 9072–9088. [Google Scholar] [CrossRef]
- Ertl, P. Cheminformatics Analysis of Organic Substituents: Identification of the Most Common Substituents, Calculation of Substituent Properties, and Automatic Identification of Drug-Like Bioisosteric Groups. J. Chem. Inf. Comput. Sci. 2003, 43, 374–380. [Google Scholar] [CrossRef]
- Wang, Y.; Xing, J.; Xu, Y.; Zhou, N.; Peng, J.; Xiong, Z.; Liu, X.; Luo, X.; Luo, C.; Chen, K.; et al. In Silico ADME/T Modelling for Rational Drug Design. Q. Rev. Biophys. 2015, 48, 488–515. [Google Scholar] [CrossRef]
- Drwal, M.N.; Banerjee, P.; Dunkel, M.; Wettig, M.R.; Preissner, R. ProTox: A Web Server for the In Silico Prediction of Rodent Oral Toxicity. Nucleic Acids Res. 2014, 42, W53–W58. [Google Scholar] [CrossRef]
- Bhardwaj, V.K.; Singh, R.; Sharma, J.; Rajendran, V.; Purohit, R.; Kumar, S. Identification of Bioactive Molecules from Tea Plant as SARS-CoV-2 Main Protease Inhibitors. J. Biomol. Struct. Dyn. 2020, 39, 3449–3458. [Google Scholar] [CrossRef]
- Das, S.; Sarmah, S.; Lyndem, S.; Singha Roy, A. An Investigation into the Identification of Potential Inhibitors of SARS-CoV-2 Main Protease Using Molecular Docking Study. J. Biomol. Struct. Dyn. 2021, 39, 3347–3357. [Google Scholar] [CrossRef]
- Kairys, V.; Baranauskiene, L.; Kazlauskiene, M.; Matulis, D.; Kazlauskas, E. Binding Affinity in Drug Design: Experimental and Computational Techniques. Expert Opin. Drug Discov. 2019, 14, 755–768. [Google Scholar] [CrossRef] [PubMed]
- Du, X.; Li, Y.; Xia, Y.L.; Ai, S.M.; Liang, J.; Sang, P.; Ji, X.L.; Liu, S.Q. Insights into Protein–Ligand Interactions: Mechanisms, Models, and Methods. Int. J. Mol. Sci. 2016, 17, 144. [Google Scholar] [CrossRef] [PubMed]
- Xing, B.; Li, S.; Yang, J.; Lin, D.; Feng, Y.; Lu, J.; ShÅ, Q. Phytochemistry, Pharmacology, and Potential Clinical Applications of Saffron: A Review. J. Ethnopharmacol. 2021, 281, 114555. [Google Scholar] [CrossRef] [PubMed]
- Khazdair, M.R.; Boskabady, M.H.; Hosseini, M.; Rezaee, R.; Tsatsakis, A.M. The Effects of Crocus sativus (Saffron) and Its Constituents on Nervous System: A Review. Avicenna J. Phytomed. 2015, 5, 376–391. [Google Scholar] [PubMed]
- Boneva, B.; Marchev, A.; Amirova, K.; Ganova, P.; Georgiev, M.; Tchorbanov, A.; Mihaylova, N. Crocus sativus Extract as a Biological Agent for Disease-Modifying Therapy of Collagenase-Induced Mouse Model of Osteoarthritis. Life 2023, 13, 894. [Google Scholar] [CrossRef]
- Asbaghi, O.; Sadeghian, M.; Sadeghi, O.; Rigi, S.; Tan, S.C.; Shokri, A.; Mousavi, S.M. Effects of Saffron (Crocus sativus L.) Supplementation on Inflammatory Biomarkers: A Systematic Review and Meta-analysis. Phytother. Res. 2021, 35, 20–32. [Google Scholar] [CrossRef]
- Gezici, S. Comparative Anticancer Activity Analysis of Saffron Extracts and a Principle Component, Crocetin for Prevention and Treatment of Human Malignancies. J. Food Sci. Technol. 2019, 56, 5435–5443. [Google Scholar] [CrossRef]
- Colapietro, A.; Mancini, A.; D’Alessandro, A.M.; Festuccia, C. Crocetin and Crocin from Saffron in Cancer Chemotherapy and Chemoprevention. Anti Cancer Agents Med. Chem. 2019, 19, 38–47. [Google Scholar] [CrossRef]
- Kyriakoudi, A.; Tsimidou, M.Z.; O’Callaghan, Y.C.; Galvin, K.; O’Brien, N.M. Changes in Total and Individual Crocetin Esters upon In Vitro Gastrointestinal Digestion of Saffron Aqueous Extracts. J. Agric. Food Chem. 2013, 61, 5318–5327. [Google Scholar] [CrossRef]
- Husaini, A.M.; Jan, K.N.; Wani, G.A. Saffron: A Potential Drug-Supplement for Severe Acute Respiratory Syndrome Coronavirus (COVID) Management. Heliyon 2021, 7, e07068. [Google Scholar] [CrossRef]
- Hosseini, A.; Razavi, B.M.; Hosseinzadeh, H. Saffron (Crocus sativus) Petal as a New Pharmacological Target: A Review. Iran. J. Basic Med. Sci. 2018, 21, 1091–1099. [Google Scholar] [CrossRef] [PubMed]
- Koh, G.C.; Porras, P.; Aranda, B.; Hermjakob, H.; Orchard, S.E. Analyzing Protein–Protein Interaction Networks. J. Proteome Res. 2012, 11, 2014–2031. [Google Scholar] [CrossRef] [PubMed]
- Bulusu, K.C.; Tym, J.E.; Coker, E.A.; Schierz, A.C.; Al-Lazikani, B. canSAR: Updated Cancer Research and Drug Discovery Knowledgebase. Nucleic Acids Res. 2014, 42, D1040–D1047. [Google Scholar] [CrossRef]
- Vidal, M.; Cusick, M.E.; Barabási, A.L. Interactome Networks and Human Disease. Cell 2011, 144, 986–998. [Google Scholar] [CrossRef] [PubMed]
- Lee, K.; Sung, M.K.; Kim, J.; Kim, K.; Byun, J.; Paik, H.; Kim, B.; Huh, W.K.; Ideker, T. Proteome-Wide Remodeling of Protein Location and Function by Stress. Proc. Natl. Acad. Sci. USA 2014, 111, E3157–E3166. [Google Scholar] [CrossRef]
- Liang, J.; Edelsbrunner, H.; Woodward, C. Anatomy of Protein Pockets and Cavities: Measurement of Binding Site Geometry and Implications for Ligand Design. Protein Sci. 1998, 7, 1884–1897. [Google Scholar] [CrossRef]
- Li, H.; Raman, C.S.; Glaser, C.B.; Blasko, E.; Young, T.A.; Parkinson, J.F.; Whitlow, M.; Poulos, T.L. Crystal Structures of Zinc-Free and-Bound Heme Domain of Human Inducible Nitric-Oxide Synthase: Implications for Dimer Stability and Comparison with Endothelial Nitric-Oxide Synthase. J. Biol. Chem. 1999, 274, 21276–21284. [Google Scholar] [CrossRef]
- Thompson, J.; Reese-Wagoner, A.; Banaszak, L. Liver Fatty Acid Binding Protein: Species Variation and the Accommodation of Different Ligands. Biochim. Biophys. Acta 1999, 1441, 117–130. [Google Scholar] [CrossRef]
- Ory, J.J.; Banaszak, L.J. Studies of the Ligand Binding Reaction of Adipocyte Lipid Binding Protein Using the Fluorescent Probe 1, 8-anilinonaphthalene-8-sulfonate. Biophys. J. 1999, 77, 1107–1116. [Google Scholar] [CrossRef]
- Tiwari, S.P.; Fuglebakk, E.; Hollup, S.M.; Skjærven, L.; Cragnolini, T.; Grindhaug, S.H.; Reuter, N. WEBnm@v2. 0: Web Server and Services for Comparing Protein Flexibility. BMC Bioinform. 2014, 15, 427. [Google Scholar] [CrossRef]
- Liu, Q.; Li, Z.; Li, J. Use B-Factor Related Features for Accurate Classification Between Protein Binding Interfaces and Crystal Packing Contacts. BMC Bioinform. 2014, 15 (Suppl. S16), S3. [Google Scholar] [CrossRef] [PubMed]
- Chen, F.; Liu, H.; Sun, H.; Pan, P.; Li, Y.; Li, D.; Hou, T. Assessing the Performance of the MM/PBSA and MM/GBSA Methods. 6. Capability to Predict Protein–Protein Binding Free Energies and Rerank Binding Poses Generated by Protein–Protein Docking. Phys. Chem. Chem. Phys. 2016, 18, 22129–22139. [Google Scholar] [CrossRef] [PubMed]
- Wang, E.; Sun, H.; Wang, J.; Wang, Z.; Liu, H.; Zhang, J.Z.H.; Hou, T. End-Point Binding Free Energy Calculation with MM/PBSA and MM/GBSA: Strategies and Applications in Drug Design. Chem. Rev. 2019, 119, 9478–9508. [Google Scholar] [CrossRef] [PubMed]
- Weng, G.; Wang, E.; Wang, Z.; Liu, H.; Zhu, F.; Li, D.; Hou, T. HawkDock: A Web Server to Predict and Analyze the Protein–Protein Complex Based on Computational Docking and MM/GBSA. Nucleic Acids Res. 2019, 47, W322–W330. [Google Scholar] [CrossRef]


| ADMET | Physiochemical Properties | |||||
|---|---|---|---|---|---|---|
| Compounds | Drugs | |||||
| Crocetin | Picrocrocin | Quecertin | Rutin | Aspirin | Rofecoxib | |
| Molecular Weight (g/mol) | 328.40 | 330.37 | 302.24 | 610.52 | 180.16 | 314.36 |
| Topological polar surface area (TPSA) Å2 | 74.60 | 116.45 | 131.36 | 269.63 | 63.60 | 68.82 |
| Hydrogen bond acceptors | 4 | 7 | 7 | 16 | 4 | 4 |
| Hydrogen bond donors | 2 | 4 | 5 | 10 | 1 | 0 |
| Molar refractivity | 98.48 | 81.08 | 78.03 | 141.8 | 44.90 | 83.69 |
| XLOGP | 5.41 | −0.50 | 1.54 | −0.33 | 1.19 | 2.27 |
| iLOGP | 3.33 | 2.07 | 1.63 | 0.46 | 1.30 | 2.13 |
| MLOGP | 3.52 | −0.88 | −0.56 | −3.89 | 1.51 | 2.62 |
| WLOGP | 4.61 | −0.49 | 1.99 | −1.69 | 1.31 | 3.64 |
| Lipinski | Yes | Yes | Yes | No | Yes | Yes |
| GI absorption | High | High | High | Low | High | High |
| Bioavailability score | 0.85 | 0.55 | 0.55 | 0.17 | 0.85 | 0.55 |
| BBB permeability | No | No | No | No | Yes | Yes |
| Pgp substrate | No | Yes | No | Yes | No | No |
| CYP2D6 inhibitor | No | No | Yes | No | No | No |
| PAINS (Pan assay interference compounds) | 0 | 0 | 1 | 1 | 0 | 0 |
| Leadlikeness | No | Yes | Yes | No | No | Yes |
| Skin permeation (log kp) cm/s | −4.46 | −8.67 | −7.05 | −10.26 | −6.55 | −6.61 |
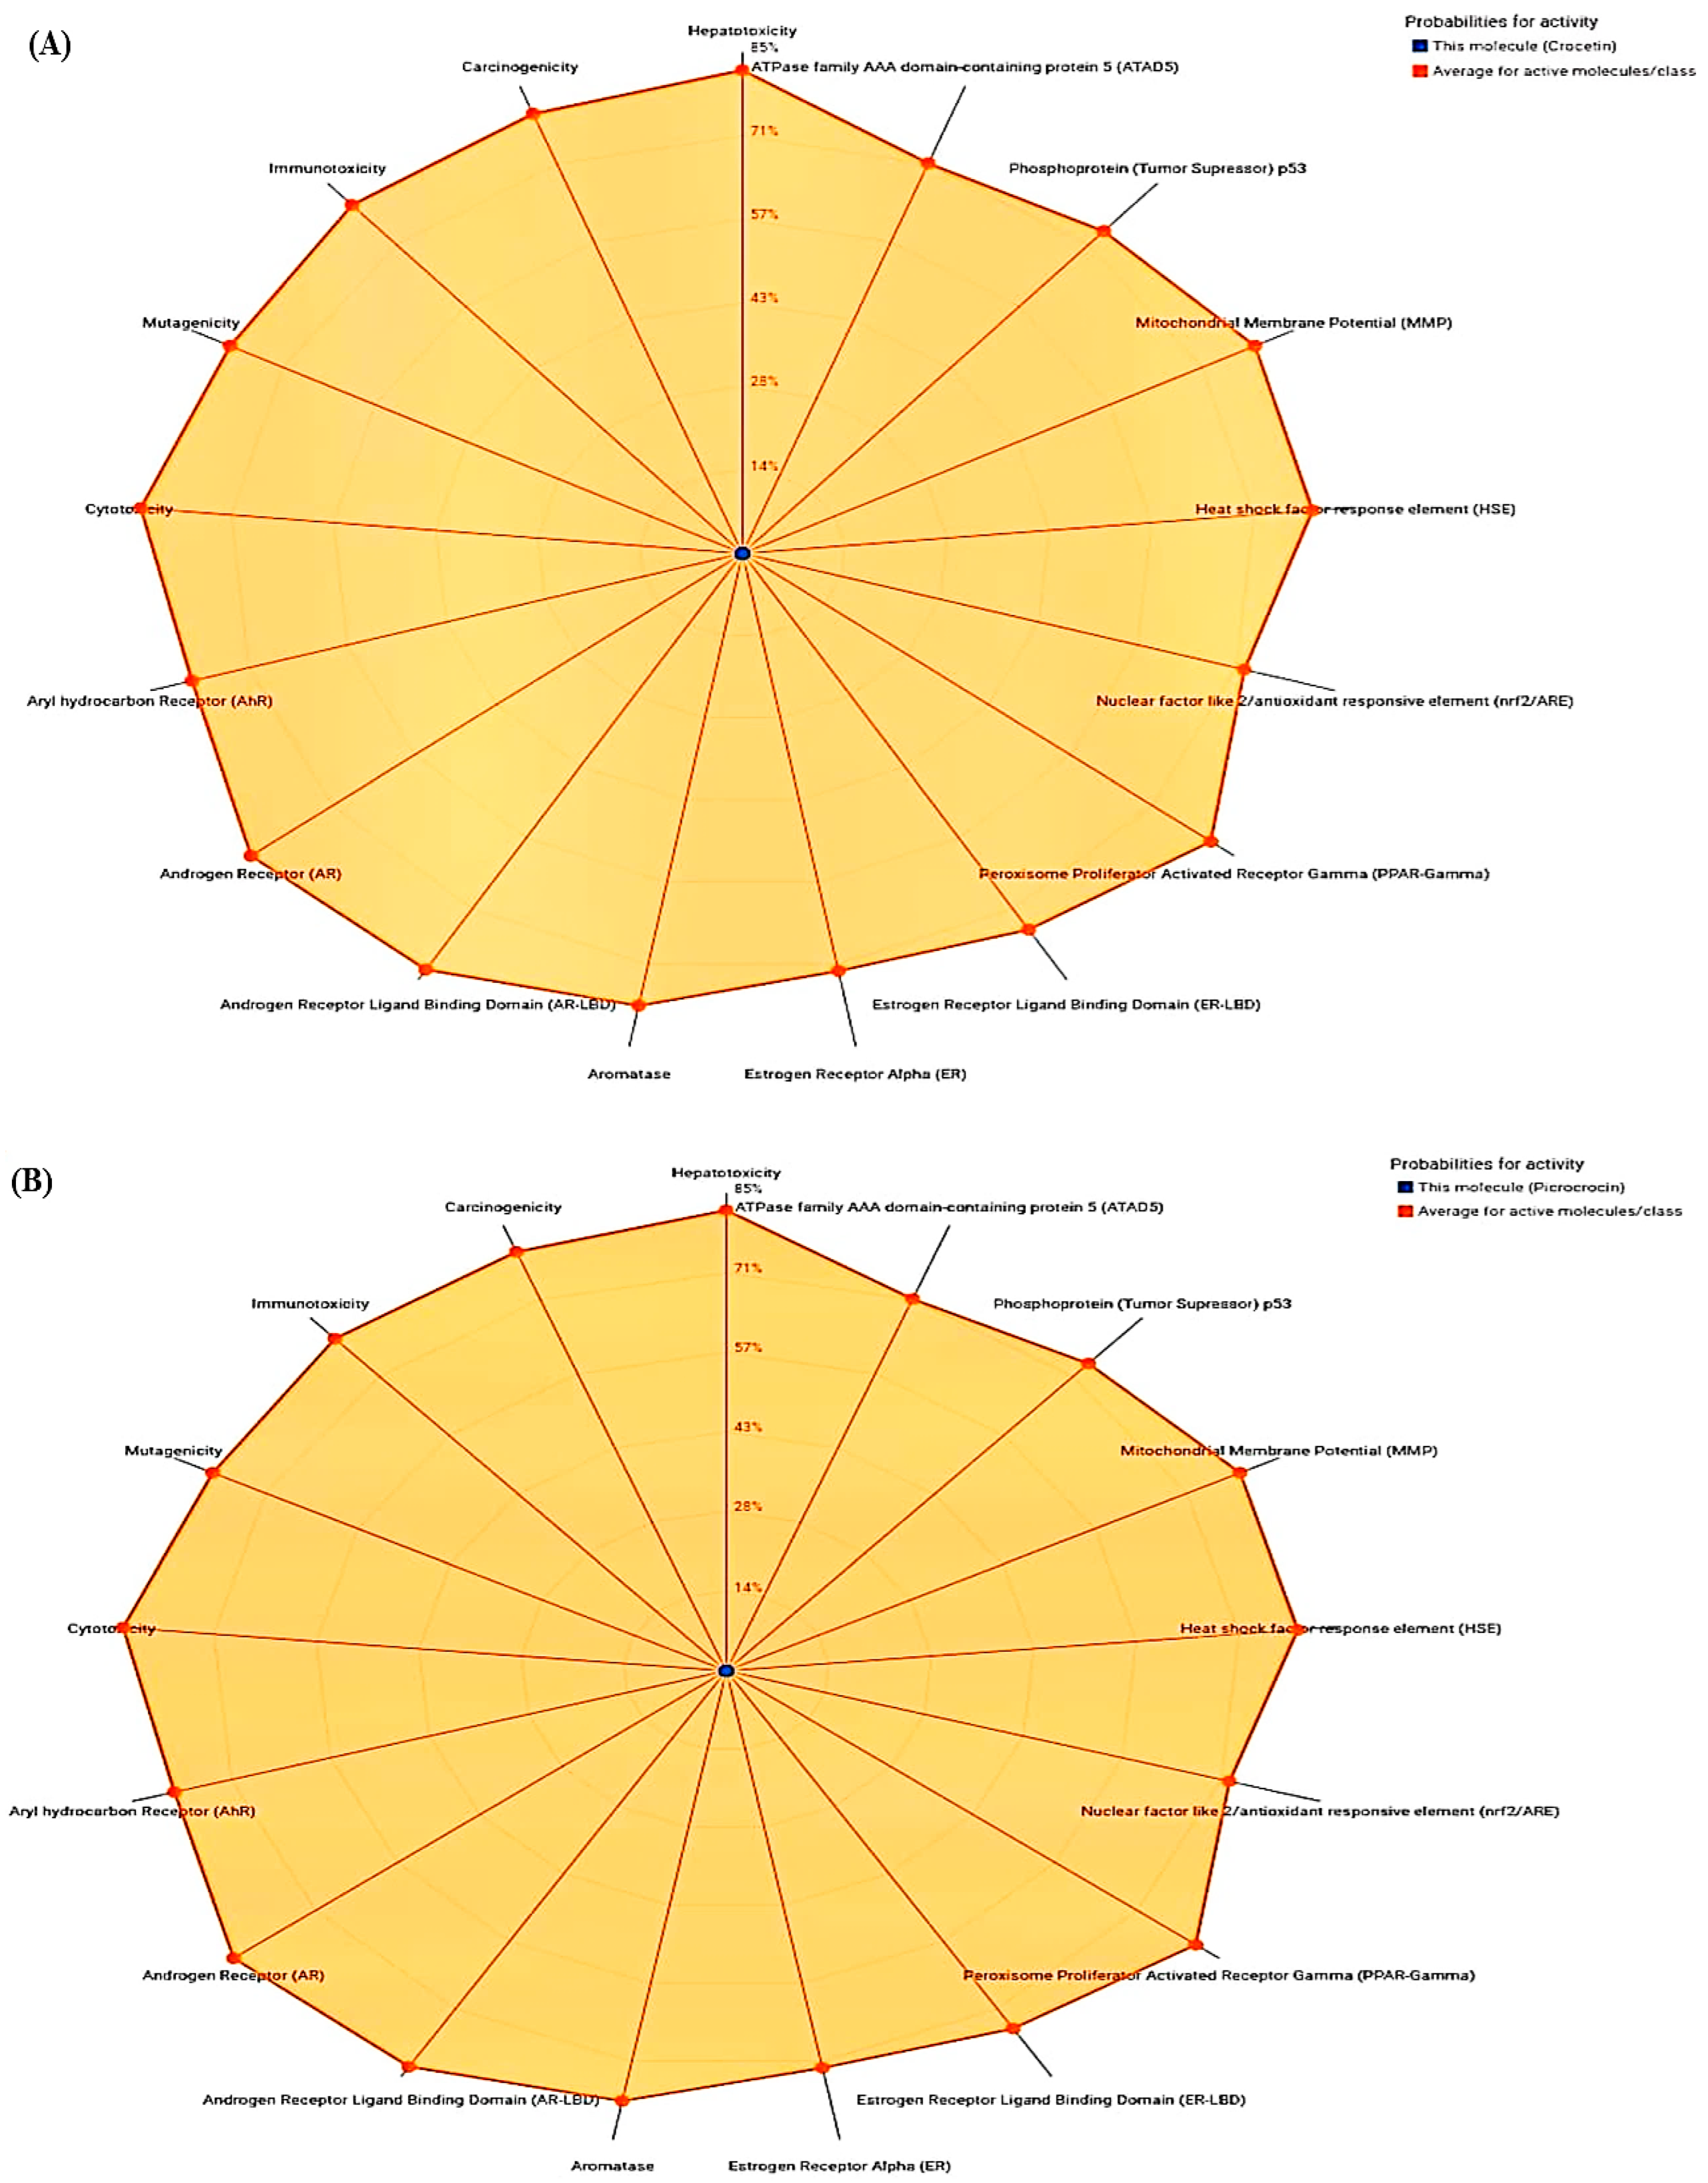
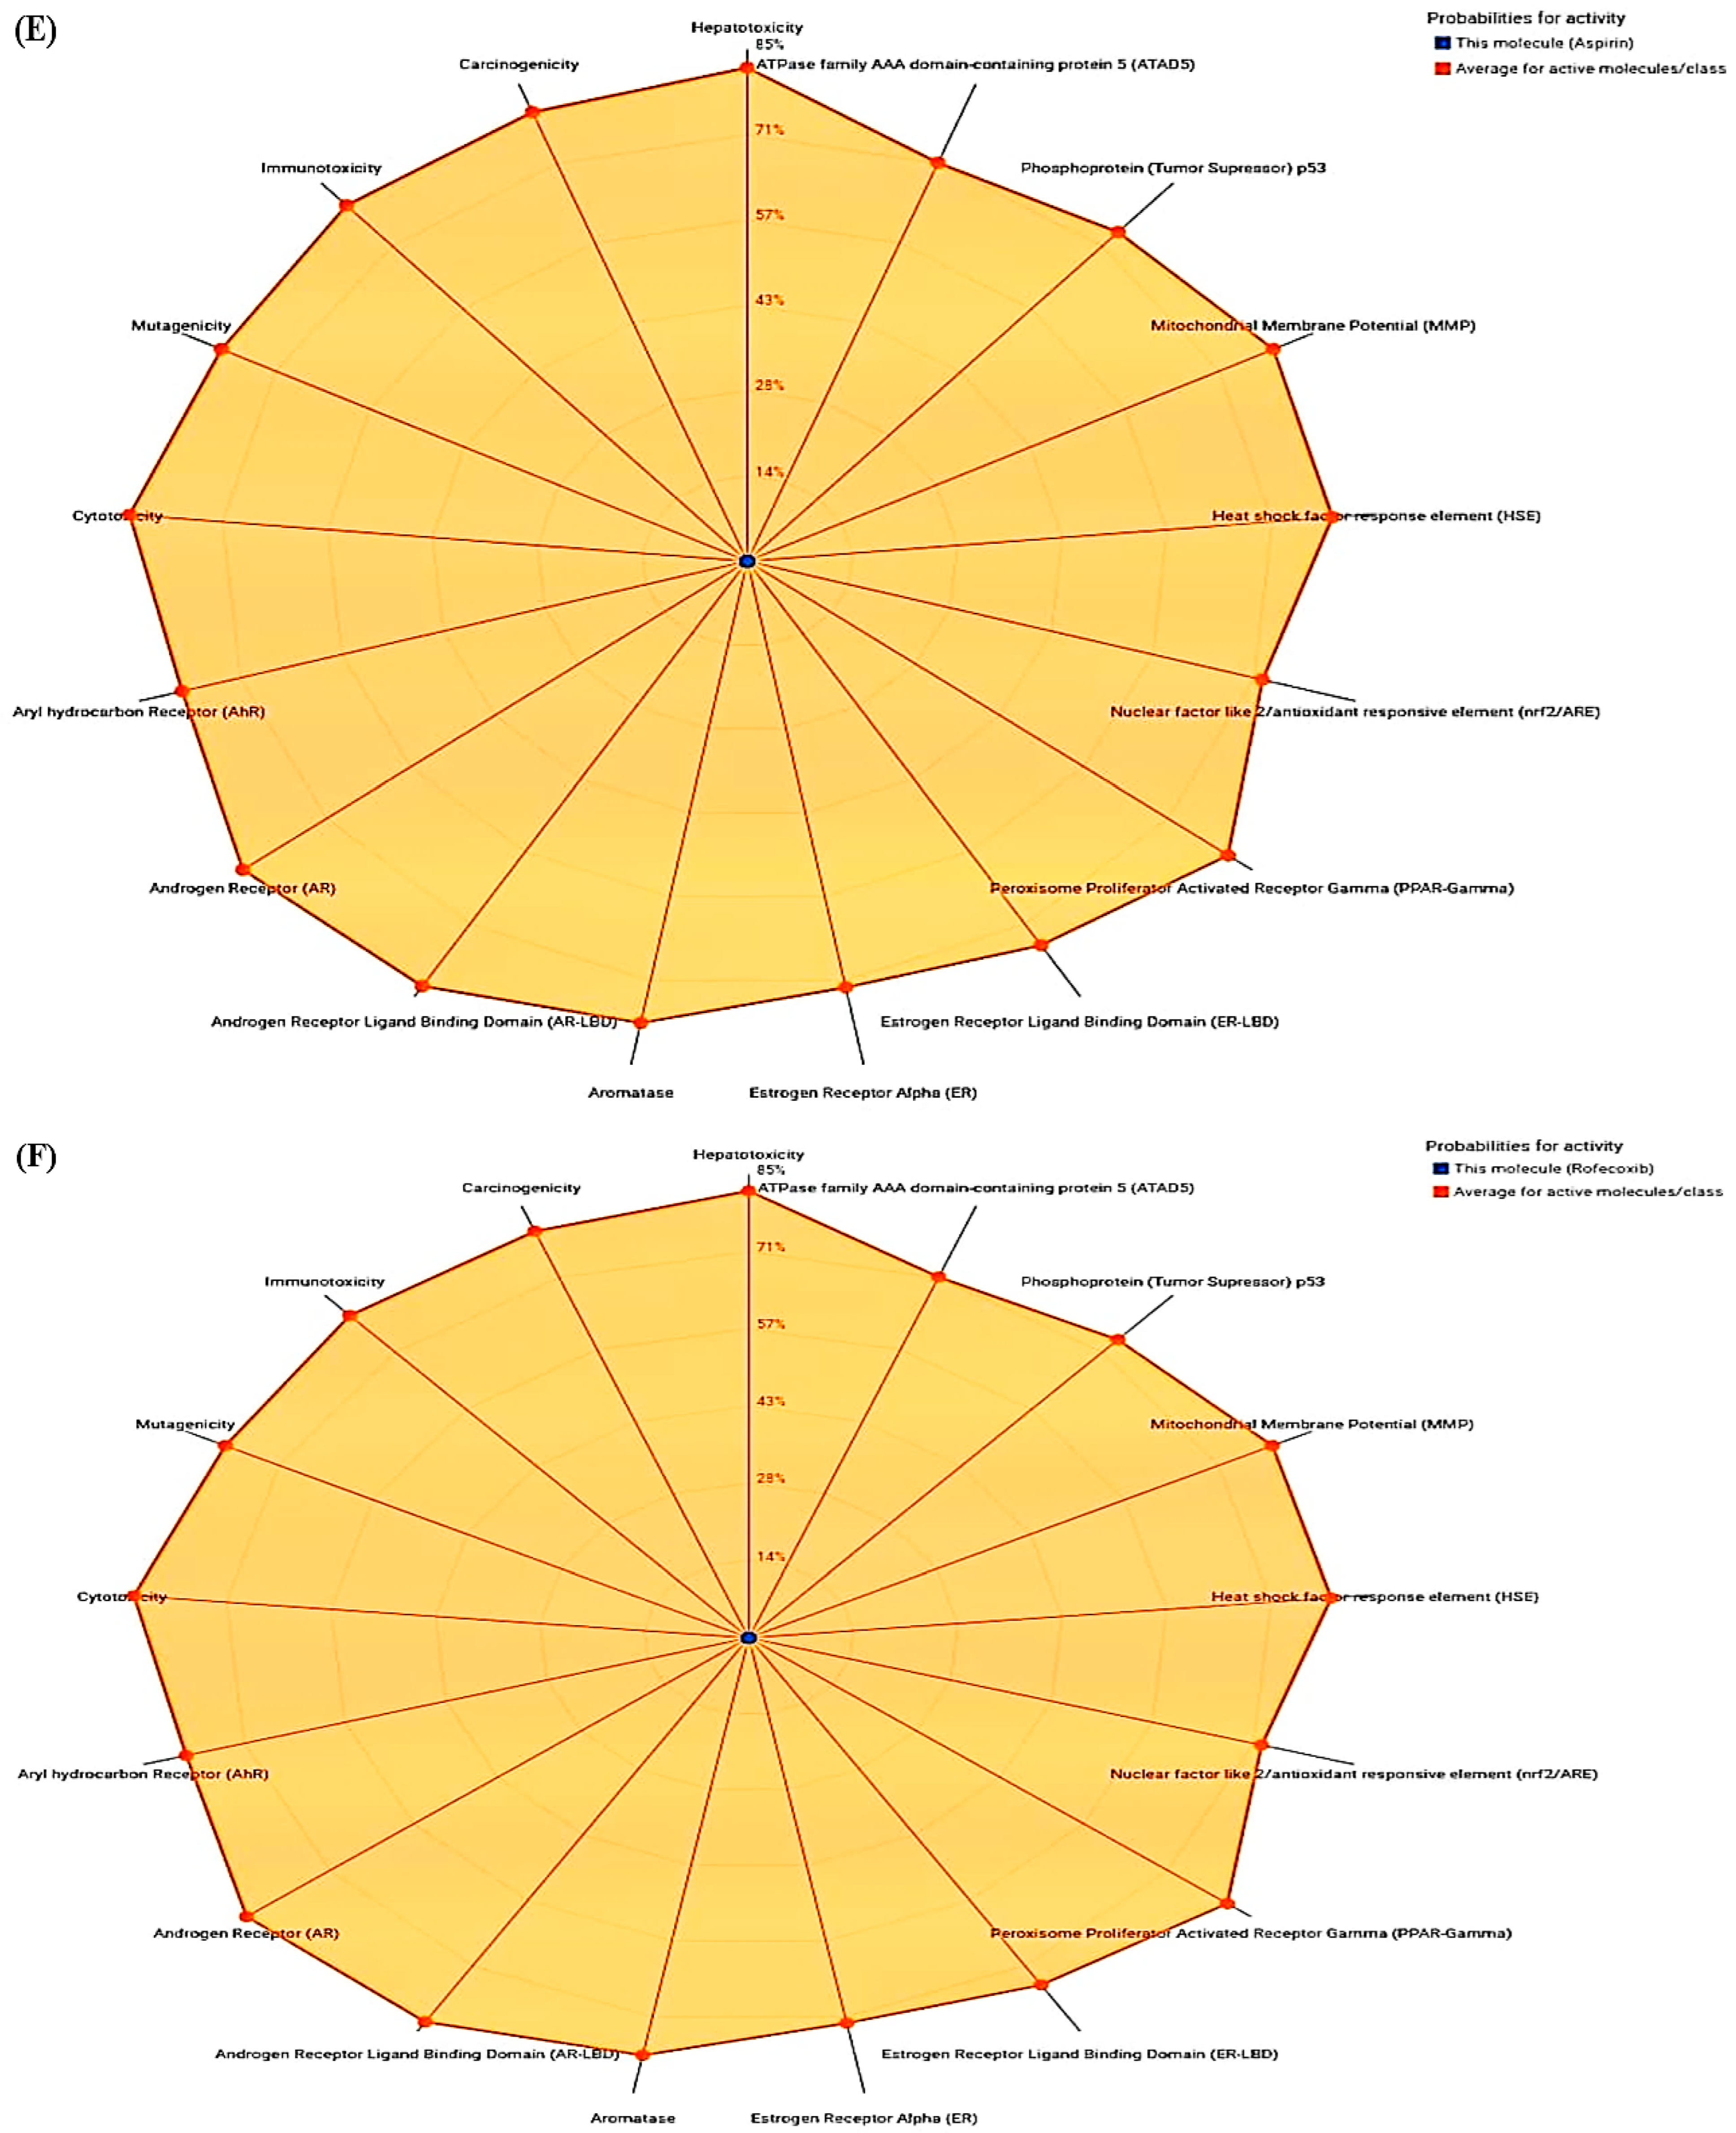
| Compounds | Toxicity Class | Hepatotoxicity | Immunotoxicity | Carcinogenicity | Mutagenicity | Cytotoxicity |
|---|---|---|---|---|---|---|
| Crocetin | 5 | 0.72 | 0.99 | 0.74 | 0.72 | 0.72 |
| Picrocrocin | 3 | 0.83 | 0.83 | 0.78 | 0.73 | 0.87 |
| Quercetin | 3 | 0.69 | 0.87 | 0.68 | 0.51 | 0.99 |
| Rutin | 5 | 0.80 | 0.98 | 0.91 | 0.88 | 0.64 |
| Aspirin | 3 | 0.51 | 0.99 | 0.86 | 0.97 | 0.94 |
| Rofecoxib | 5 | 0.55 | 0.97 | 0.71 | 0.68 | 0.76 |
| S. No. | Phytocompounds | Binding Affinity (kcal/mol) | Ki (µM) |
|---|---|---|---|
| 1 | Crocetin | −7.4 | 12.50 |
| 2 | Picrocrocin | −8.1 | 13.68 |
| 3 | Quecertin | −7.6 | 12.87 |
| 4 | Rutin | −7.9 | 13.38 |
| 5 | Safranal | −6.8 | 11.51 |
| 6 | Crocin | −7.1 | 12.02 |
| 7 | Dimethylcrocetin | −7.2 | 12.19 |
| Drug | |||
| 1 | Aspirin | −6.1 | 10.30 |
| 2 | Rofecoxib | −8.3 | 14.05 |
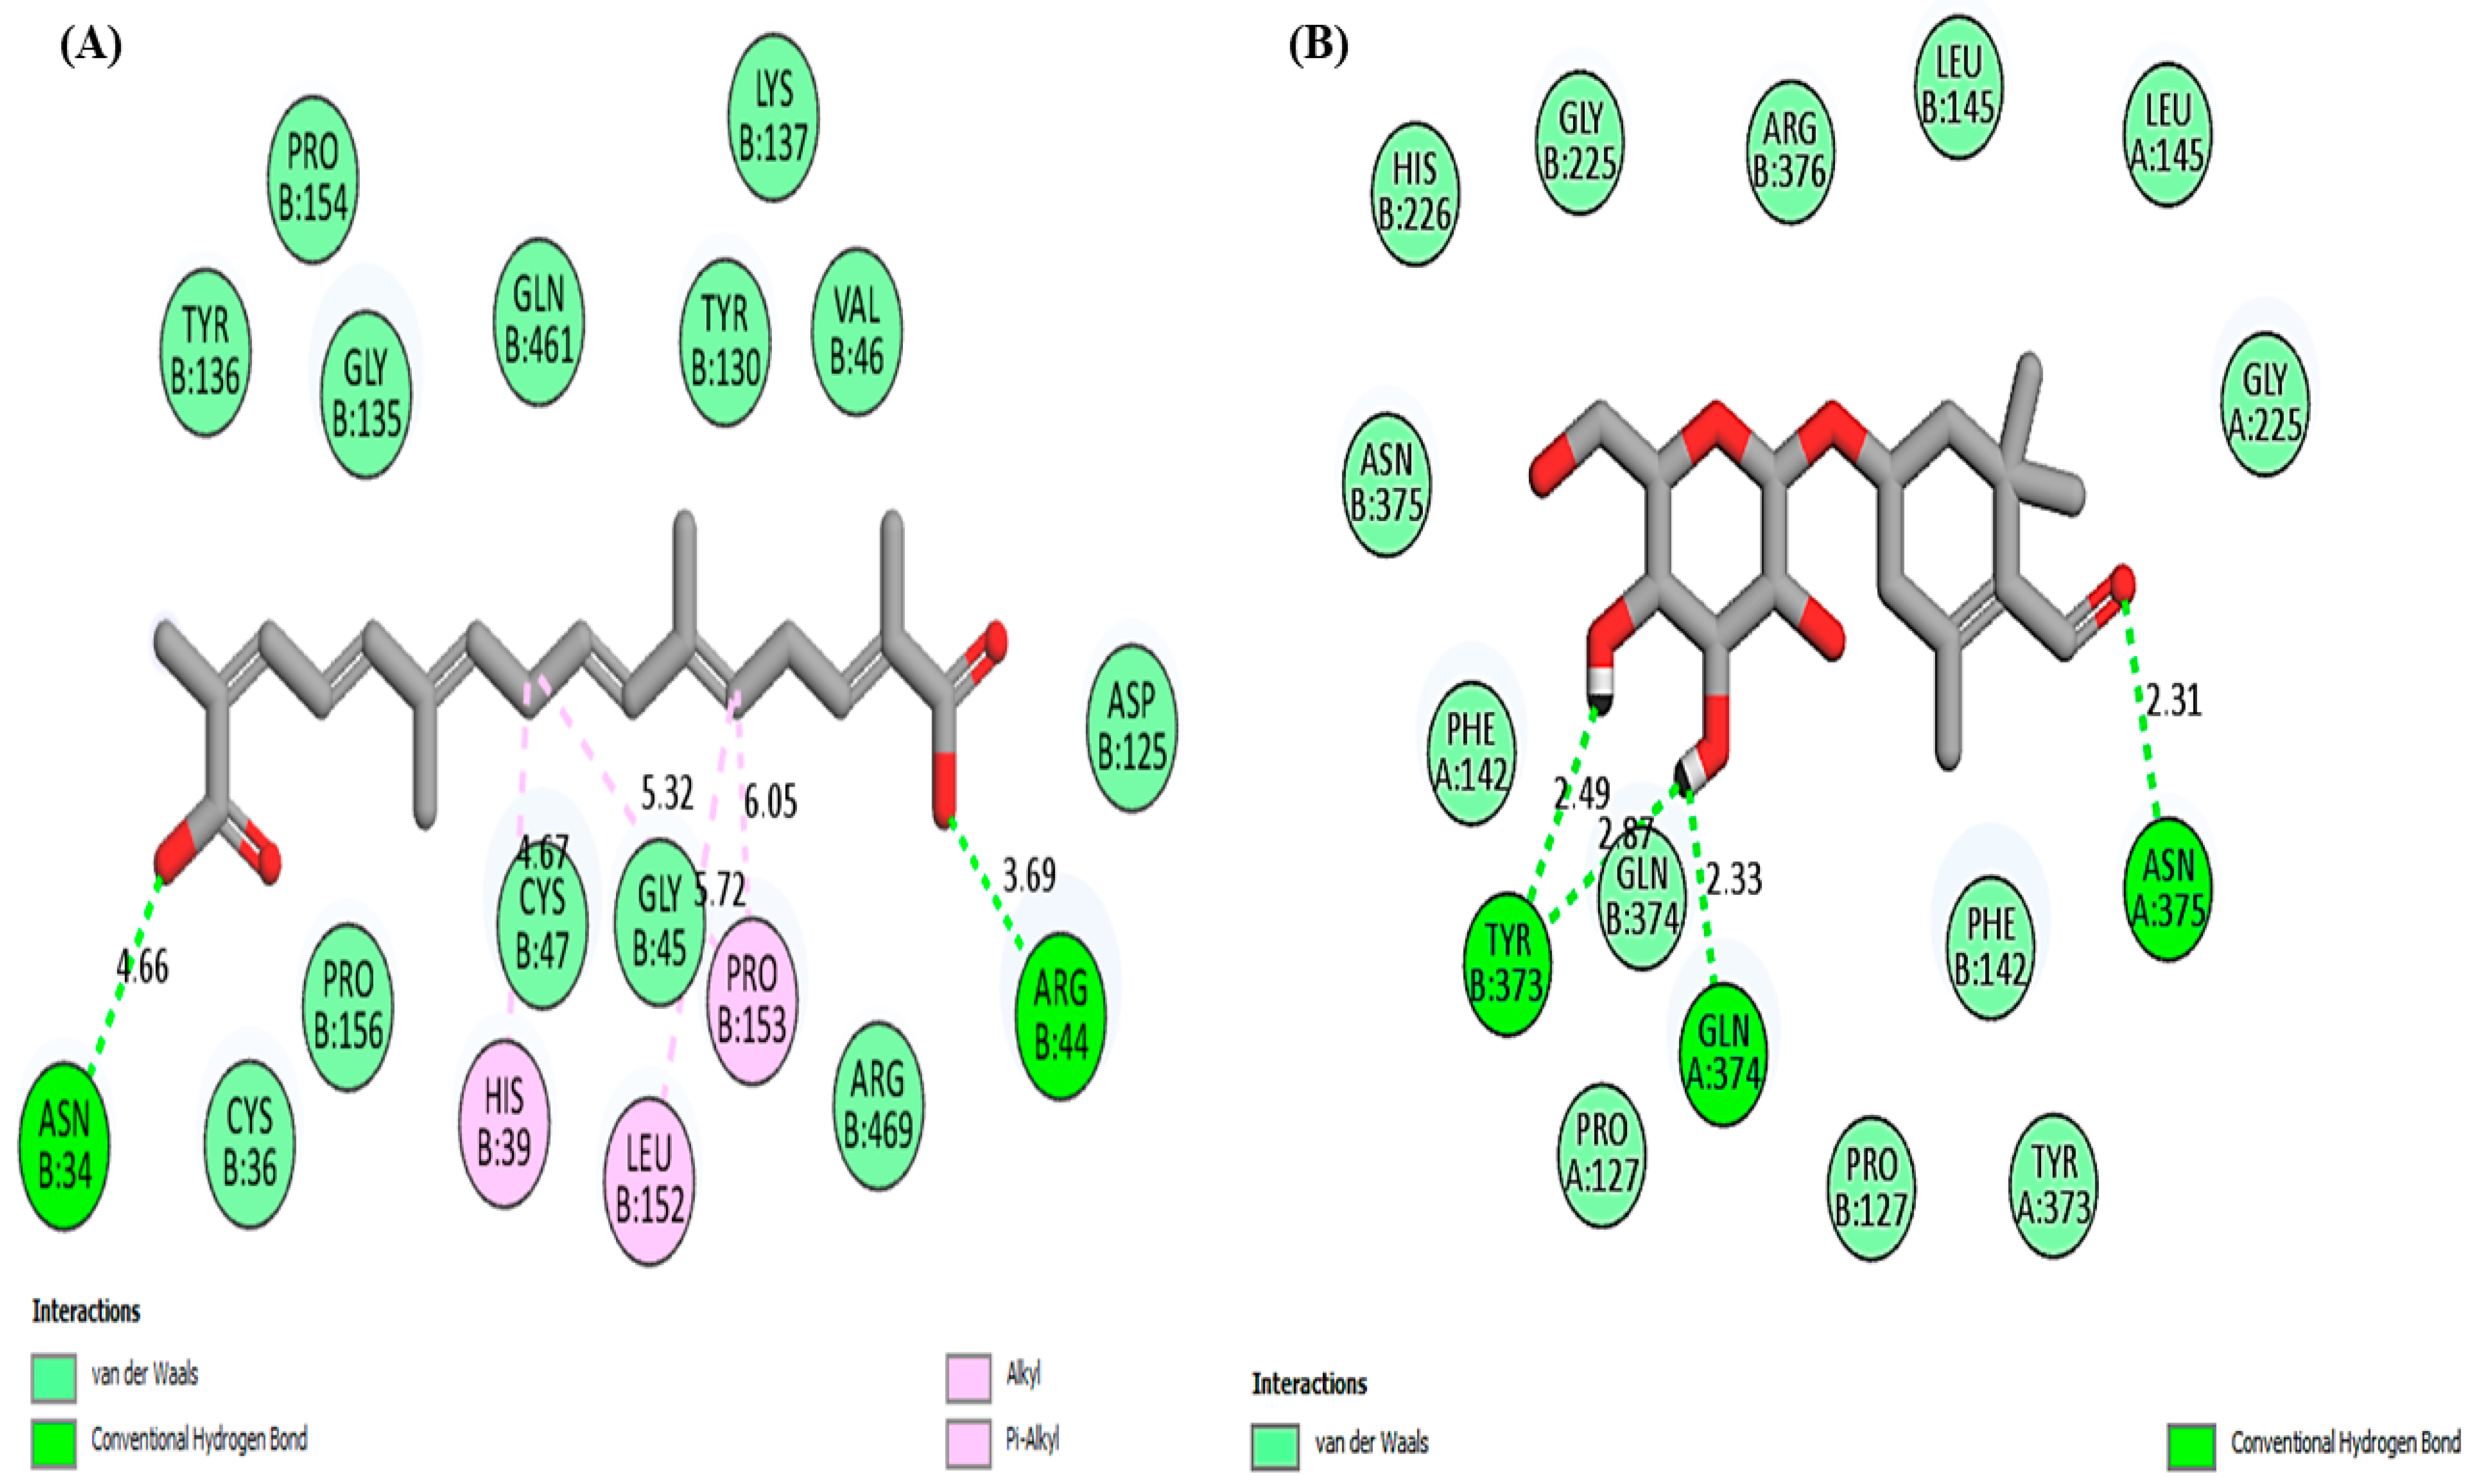
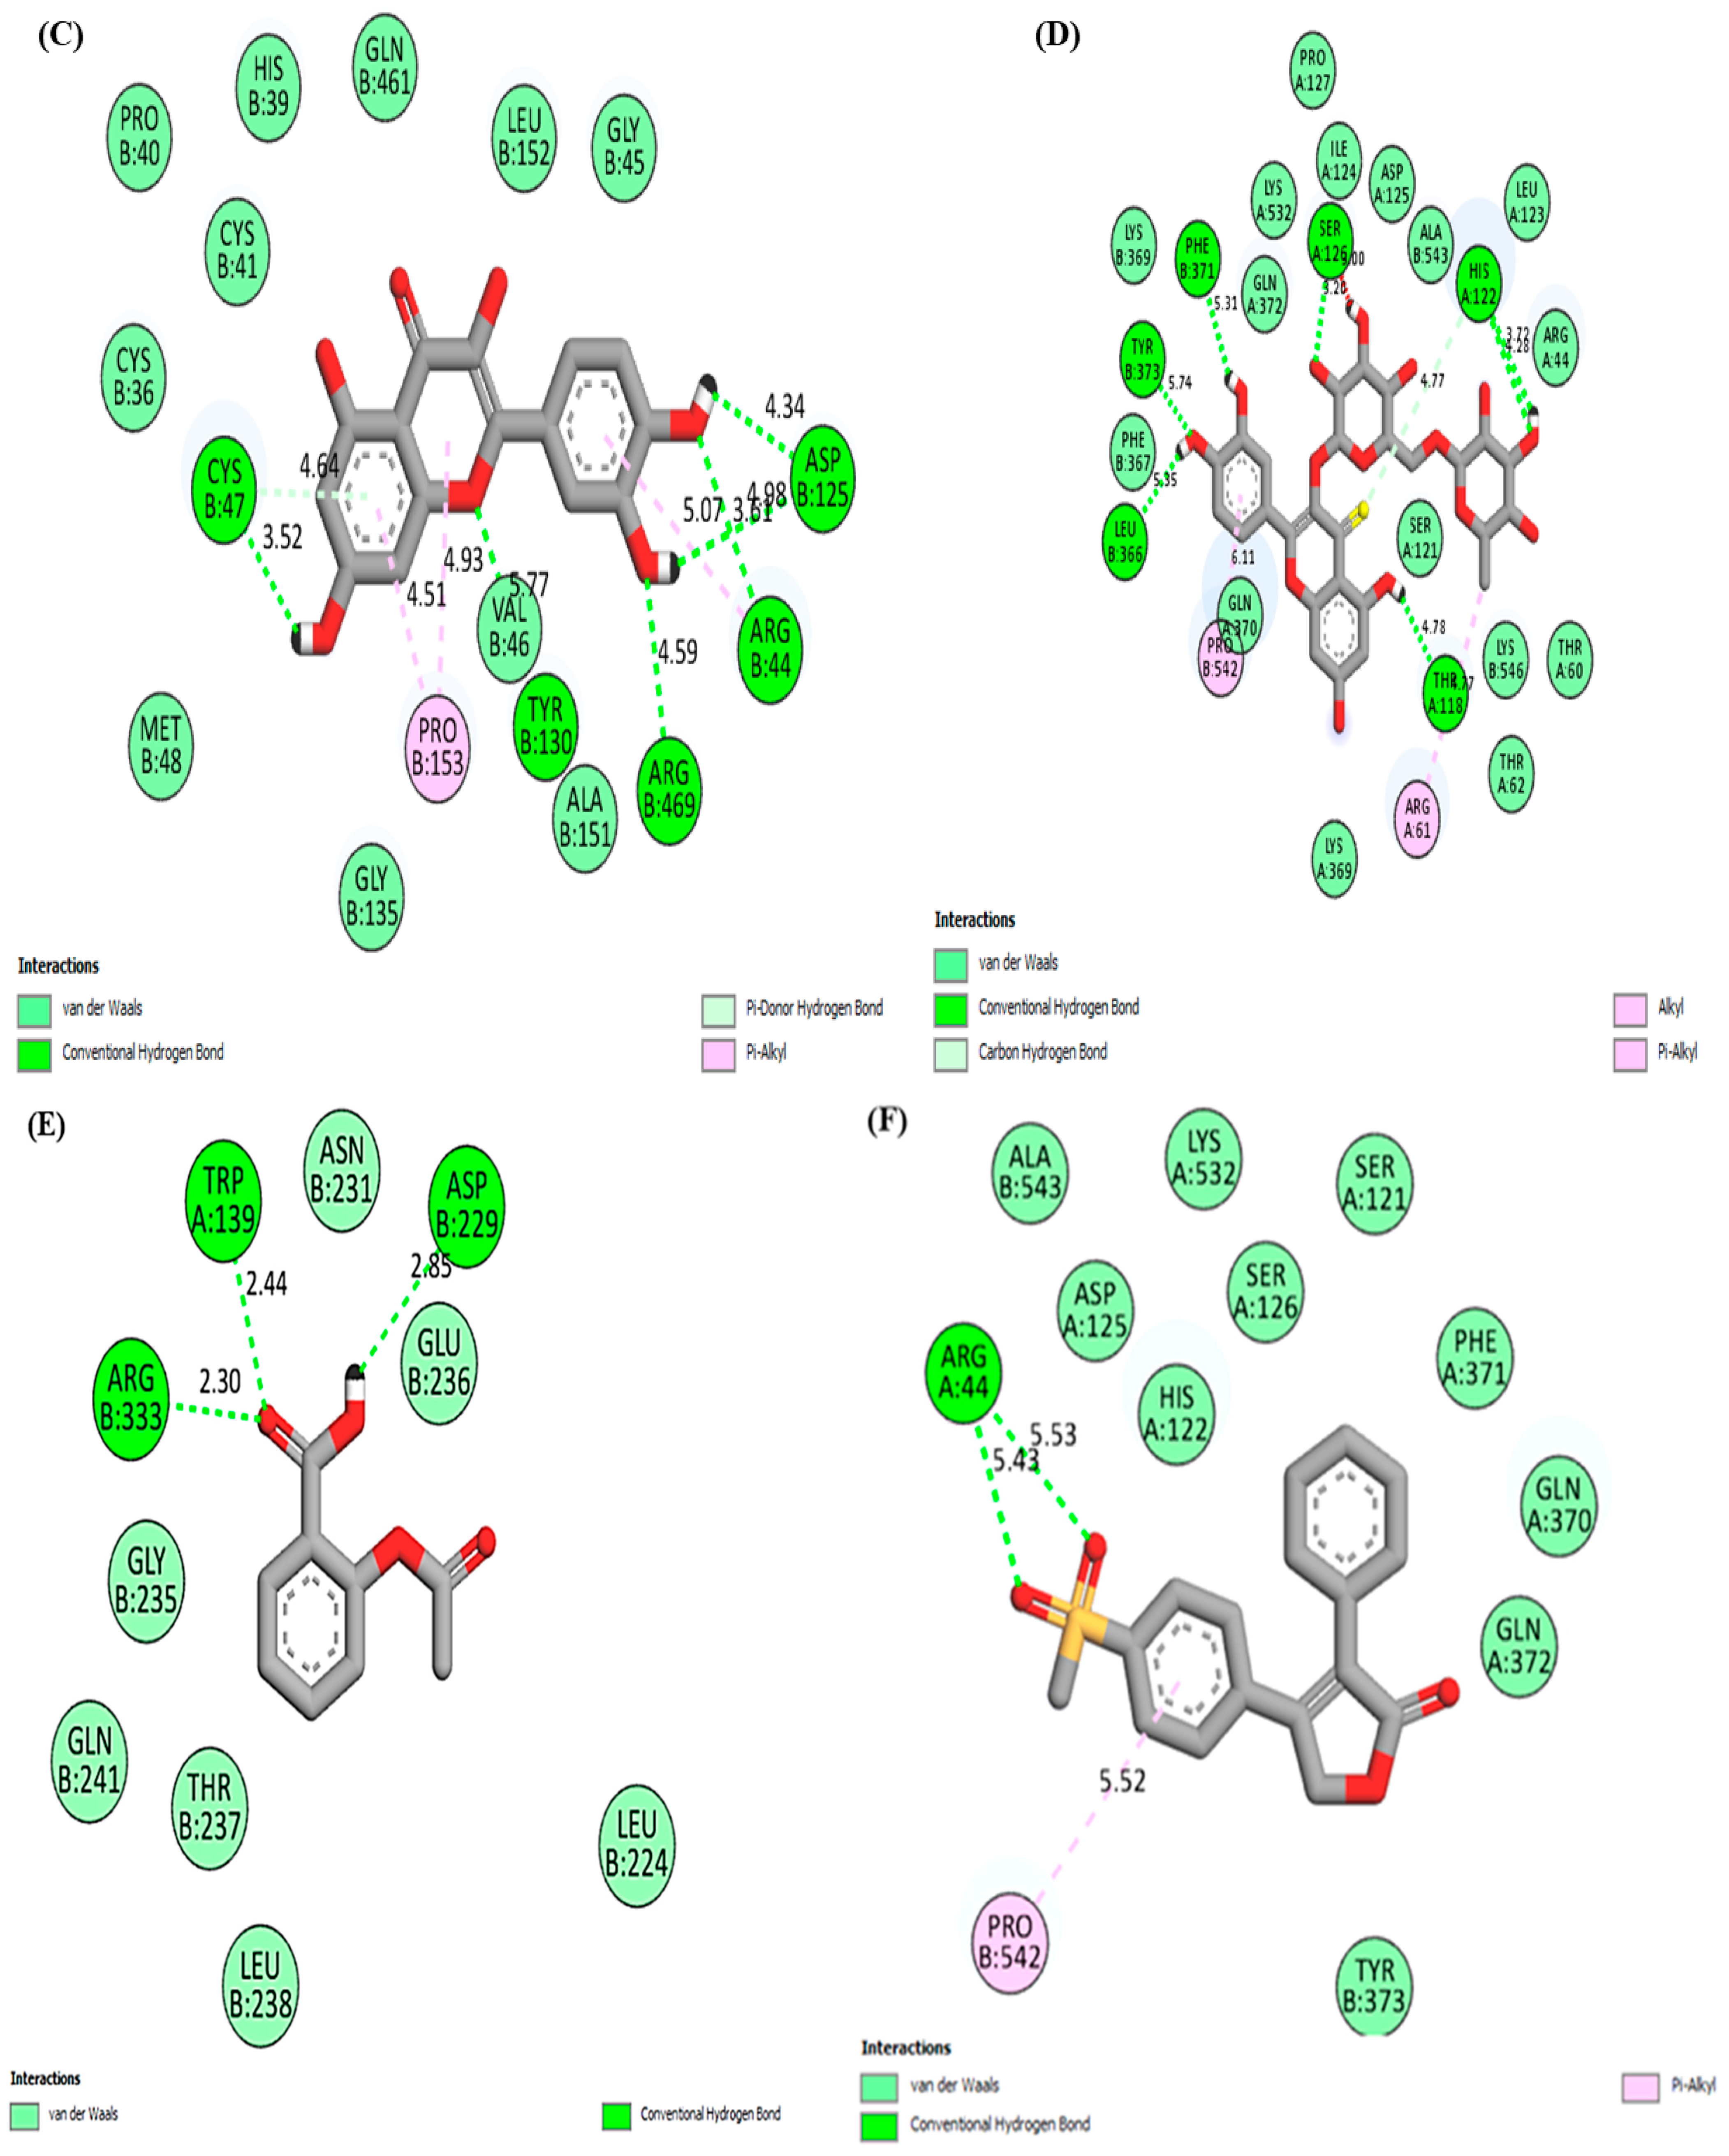
| Compound | Type of Interaction | Position of Interaction |
|---|---|---|
| Crocetin | Hydrogen bonding | ASN34, ARG44 |
| Van der Waals | PRO154, PRO156, TYR136, TYR130, GLY135, GLY45, GLN461, VAL46, CYS36, CYS47, ARG469, ASP125 | |
| Alkyl/Pi-alkyl | PRO153, HIS39, LEU152 | |
| Picocroxin | Hydrogen bonding | TYR373, GLN374, SN375 |
| Van der Waals | GLY225, HIS226, ARG376, LEU145, ASN375, PHE142, PRO127, TYR373 | |
| Quercetin | Hydrogen bonding | CYS47, TYR130, ARG469, ARG44, ASP125 |
| Van der Waals | PRO40, HIS39, GLN461, LEU152, GLY45, GLY135, CYS41, CYS36, MET48 | |
| Pi-alkyl | PRO153 | |
| Rutin | Hydrogen bonding | SER126, HIS122, PHE371, LEU366, TYR373, THR118 |
| Van der Waals | LYS369, THR62, THR60, LYS560, GLN370, SER121, PHE367, ARG44, GLN372, LYS369, LYS532, ILE124, ASP125, ALA543, LEU123 | |
| Alkyl/Pi-alkyl | ARG61, PRO542 | |
| Drug | ||
| Aspirin | Hydrogen bonding | TRP139, ASP229, ARG333 |
| Van der Waals | LEU224, GLY235, GLU236, THR237, LEU238, GLN241 | |
| Rofecoxib | Hydrogen bonding | ARG44 |
| Van der Waals | SER121, ALA543, LYS532, ASP125, SER126, PHE371, HIS122, GLN370, GLN372, TYR373 | |
| Pi-alkyl | PRO542 | |
| ELE | VDW | GAS | PBSOL | PBTOT | GBSOL | GBTOT | TS | Delta PB | Delta GB |
|---|---|---|---|---|---|---|---|---|---|
| −271.82 | −74.73 | −346.55 | 351.66 | 5.12 | 352.92 | −20.63 | 37.45 | 42.57 | 16.82 |
| FDR Enrichment | Genes of Pathway | Gene | Fold Enrichment | Name of Pathway |
|---|---|---|---|---|
| 0.025356055 | 51 | 1 | 158.7843137 | Ovarian steroidogenesis |
| 0.025356055 | 56 | 1 | 144.6071429 | Reg. of lipolysis in adipocytes |
| 0.025356055 | 59 | 1 | 137.2542373 | VEGF signaling pathway |
| 0.025356055 | 61 | 1 | 132.7540984 | Arachidonic acid metabolism |
| 0.025356055 | 68 | 1 | 119.0882353 | Chemical carcinogenesis |
| 0.025356055 | 76 | 1 | 106.5526316 | Leishmaniasis |
| 0.025356055 | 92 | 1 | 88.02173913 | Small cell lung cancer |
| 0.025356055 | 93 | 1 | 87.07526882 | IL-17 signaling pathway |
| 0.025356055 | 104 | 1 | 77.86538462 | NF-kappa B signaling pathway |
| 0.025356055 | 104 | 1 | 77.86538462 | C-type lectin receptor signaling pathway |
| 0.025356055 | 112 | 1 | 72.30357143 | TNF signaling pathway |
| 0.025356055 | 112 | 1 | 72.30357143 | Serotonergic synapse |
| 0.029159463 | 148 | 1 | 54.71621622 | Retrograde endocannabinoid signaling |
| 0.029159463 | 154 | 1 | 52.58441558 | Oxytocin signaling pathway |
| 0.029159463 | 161 | 1 | 50.29813665 | MicroRNAs in cancer |
| 0.032940232 | 194 | 1 | 41.74226804 | Kaposi sarcoma-associated herpesvirus infection |
| 0.035796784 | 224 | 1 | 36.15178571 | Human cytomegalovirus infection |
| 0.049957465 | 331 | 1 | 24.4652568 | Human papillomavirus infection |
Disclaimer/Publisher’s Note: The statements, opinions and data contained in all publications are solely those of the individual author(s) and contributor(s) and not of MDPI and/or the editor(s). MDPI and/or the editor(s) disclaim responsibility for any injury to people or property resulting from any ideas, methods, instructions or products referred to in the content. |
© 2023 by the authors. Licensee MDPI, Basel, Switzerland. This article is an open access article distributed under the terms and conditions of the Creative Commons Attribution (CC BY) license (https://creativecommons.org/licenses/by/4.0/).
Share and Cite
Ali, A.; Wani, A.B.; Malla, B.A.; Poyya, J.; Dar, N.J.; Ali, F.; Ahmad, S.B.; Rehman, M.U.; Nadeem, A. Network Pharmacology Integrated Molecular Docking and Dynamics to Elucidate Saffron Compounds Targeting Human COX-2 Protein. Medicina 2023, 59, 2058. https://doi.org/10.3390/medicina59122058
Ali A, Wani AB, Malla BA, Poyya J, Dar NJ, Ali F, Ahmad SB, Rehman MU, Nadeem A. Network Pharmacology Integrated Molecular Docking and Dynamics to Elucidate Saffron Compounds Targeting Human COX-2 Protein. Medicina. 2023; 59(12):2058. https://doi.org/10.3390/medicina59122058
Chicago/Turabian StyleAli, Aarif, Amir Bashir Wani, Bashir Ahmad Malla, Jagadeesha Poyya, Nawab John Dar, Fasil Ali, Sheikh Bilal Ahmad, Muneeb U. Rehman, and Ahmed Nadeem. 2023. "Network Pharmacology Integrated Molecular Docking and Dynamics to Elucidate Saffron Compounds Targeting Human COX-2 Protein" Medicina 59, no. 12: 2058. https://doi.org/10.3390/medicina59122058
APA StyleAli, A., Wani, A. B., Malla, B. A., Poyya, J., Dar, N. J., Ali, F., Ahmad, S. B., Rehman, M. U., & Nadeem, A. (2023). Network Pharmacology Integrated Molecular Docking and Dynamics to Elucidate Saffron Compounds Targeting Human COX-2 Protein. Medicina, 59(12), 2058. https://doi.org/10.3390/medicina59122058