Patients’ Background Analysis
The retrospective analysis of 486 COVID-19 patients, comprising 200 without diabetes, 62 with type 1 diabetes mellitus, and 224 with type 2 diabetes mellitus, revealed no significant differences in age, gender, body mass index (BMI), smoking habits, frequent alcohol use, place of origin, COVID-19 vaccination status, and Charlson Comorbidity Index greater than 2. The mean age was comparable across groups (no diabetes: 55.3 years; T1D: 53.6 years; T2D: 56.4 years; p = 0.281). The gender distribution showed a majority of men in each group, but without statistical significance (p = 0.586). Similarly, the average BMI across groups showed no significant difference (p = 0.234).
However, significant differences emerged in COVID-19 severity. A higher proportion of severe cases were observed in the T2D group (33.5%) compared to the T1D (25.8%) and no diabetes groups (15.0%), with a p-value of <0.001. This trend was also reflected in higher rates of ICU admissions and mechanical ventilation in the T2D group (31.7% and 35.3%, respectively) compared to T1D (22.6% and 29.0%) and no diabetes groups (17.0% and 18.0%), indicating a more severe clinical course in T2D patients (ICU admissions p = 0.002; mechanical ventilation p ≤ 0.001). Mortality rates were also notably higher in the T2D group (11.6%) compared to patients with T1D (8.1%) and those without diabetes (3.5%, p = 0.008).
Regarding diabetes-related complications, there were no significant differences in the prevalence of cardiovascular disease, neuropathy, kidney disease, and other complications among T1D and T2D patients. However, hyperglycemia at admission was significantly more prevalent in the T2D group (51.8%) compared to the T1D group (32.3%) with a
p-value of 0.006. Insulin use was universal among T1D patients (100%) and significantly lower in the T2D group (17.0%), with a
p-value of <0.001. Dialysis use did not differ significantly between the two groups of patients with diabetes (
p = 0.377), as presented in
Table 1.
Blood glucose levels were significantly higher in the diabetes groups (T1D: 164.8 mg/dL, T2D: 178.3 mg/dL) compared to the no diabetes group (95.1 mg/dL), with a p-value of <0.001. HbA1c levels also differed markedly, being within the normal range for the no diabetes group (5.6%) and elevated in the T1D (7.7%) and T2D (8.1%) groups, consistent with their diabetic status (p < 0.001).
C-reactive protein levels, indicative of inflammation, were significantly higher in the T1D (27.4 mg/L) and T2D (38.2 mg/L) groups compared to the no diabetes group (15.2 mg/L), suggesting more pronounced inflammatory responses in patients with diabetes (p < 0.001). Elevated D-dimer levels, suggestive of coagulation abnormalities, were observed in the diabetes groups (T1D: 2.8 μg/mL, T2D: 2.9 μg/mL) compared to the no diabetes group (1.6 μg/mL, p < 0.001).
Oxygen saturation, a key indicator of respiratory function, was lower in T1D (91.7%) and T2D (90.8%) groups compared to the no diabetes group (93.9%), with a statistically significant difference (
p = 0.037). Creatinine levels, reflecting kidney function, were also significantly higher in patients with diabetes (T1D: 1.2 mg/dL, T2D: 1.3 mg/dL) compared to those without diabetes (0.9 mg/dL,
p < 0.001). Lymphocyte and white blood cell (WBC) counts, however, did not show significant differences across groups, with lymphocytes and WBC counts being similar, as presented in
Table 2.
The analysis of patient outcomes in our study revealed significant differences in the length of hospital stay and the extent of medical interventions among patients with no diabetes, T1D, and type 2 diabetes mellitus. Notably, the length of hospital stay was significantly longer for T2D patients (11.6 days) compared to T1D (9.1 days) and no diabetes groups (7.2 days), with a significant difference (p < 0.001), highlighting the increased healthcare burden in T2D patients.
Regarding treatment, the proportion of patients receiving antiviral treatment and steroids was higher in the diabetes groups, particularly in T2D, but these differences were not statistically significant for antiviral treatments (p = 0.117). However, the use of steroids was significantly more prevalent in T2D (74.6%) compared to no diabetes group (60.5%, p = 0.008), indicating a more aggressive treatment approach in patients with diabetes, especially those with type 2 diabetes.
The requirement for non-invasive ventilation was significantly higher in the T2D group (53.1%) compared to T1D (45.2%) and no diabetes (31.0%) groups (
p < 0.001), aligning with the observed trend of increased COVID-19 severity in T2D patients. Finally, the discharge status indicated a lower recovery rate in the T2D group (88.4%) compared to the no diabetes (96.5%) and T1D (91.9%) groups, with a statistically significant difference (
p = 0.008), suggesting the increased risk and complications associated with COVID-19 in patients with type 2 diabetes, as seen in
Table 3.
The analysis of COVID-19 outcomes over three years revealed a significant evolution in disease severity, hospitalization length, ICU admissions, and mortality among patients with type 1 and type 2 diabetes mellitus (T1D and T2D). In 2020, both groups had moderate COVID-19 severity, but T2D patients experienced slightly higher rates of severe cases (17.0% vs. 14.5% in T1D) and longer hospital stays (10.8 days for T2D vs. 9.0 days for T1D), alongside higher ICU admissions and mortality rates.
The year 2021 marked a peak in severity, particularly for T2D patients, who exhibited a greater proportion of severe cases (25.0% vs. 20.3% in T1D) and the longest hospital stays (12.4 days for T2D vs. 9.9 days for T1D). ICU admissions and mortality rates were notably higher in T2D during this year, aligning with the observed increase in disease severity.
In 2022, a decline in severe cases was observed, yet T2D patients continued to experience higher severity, longer hospital stays, and elevated ICU admissions and mortality rates compared to T1D patients. These findings highlight the disproportionately higher impact of COVID-19 on T2D patients over the years, with 2021 being the most challenging year, as presented in
Table 4.
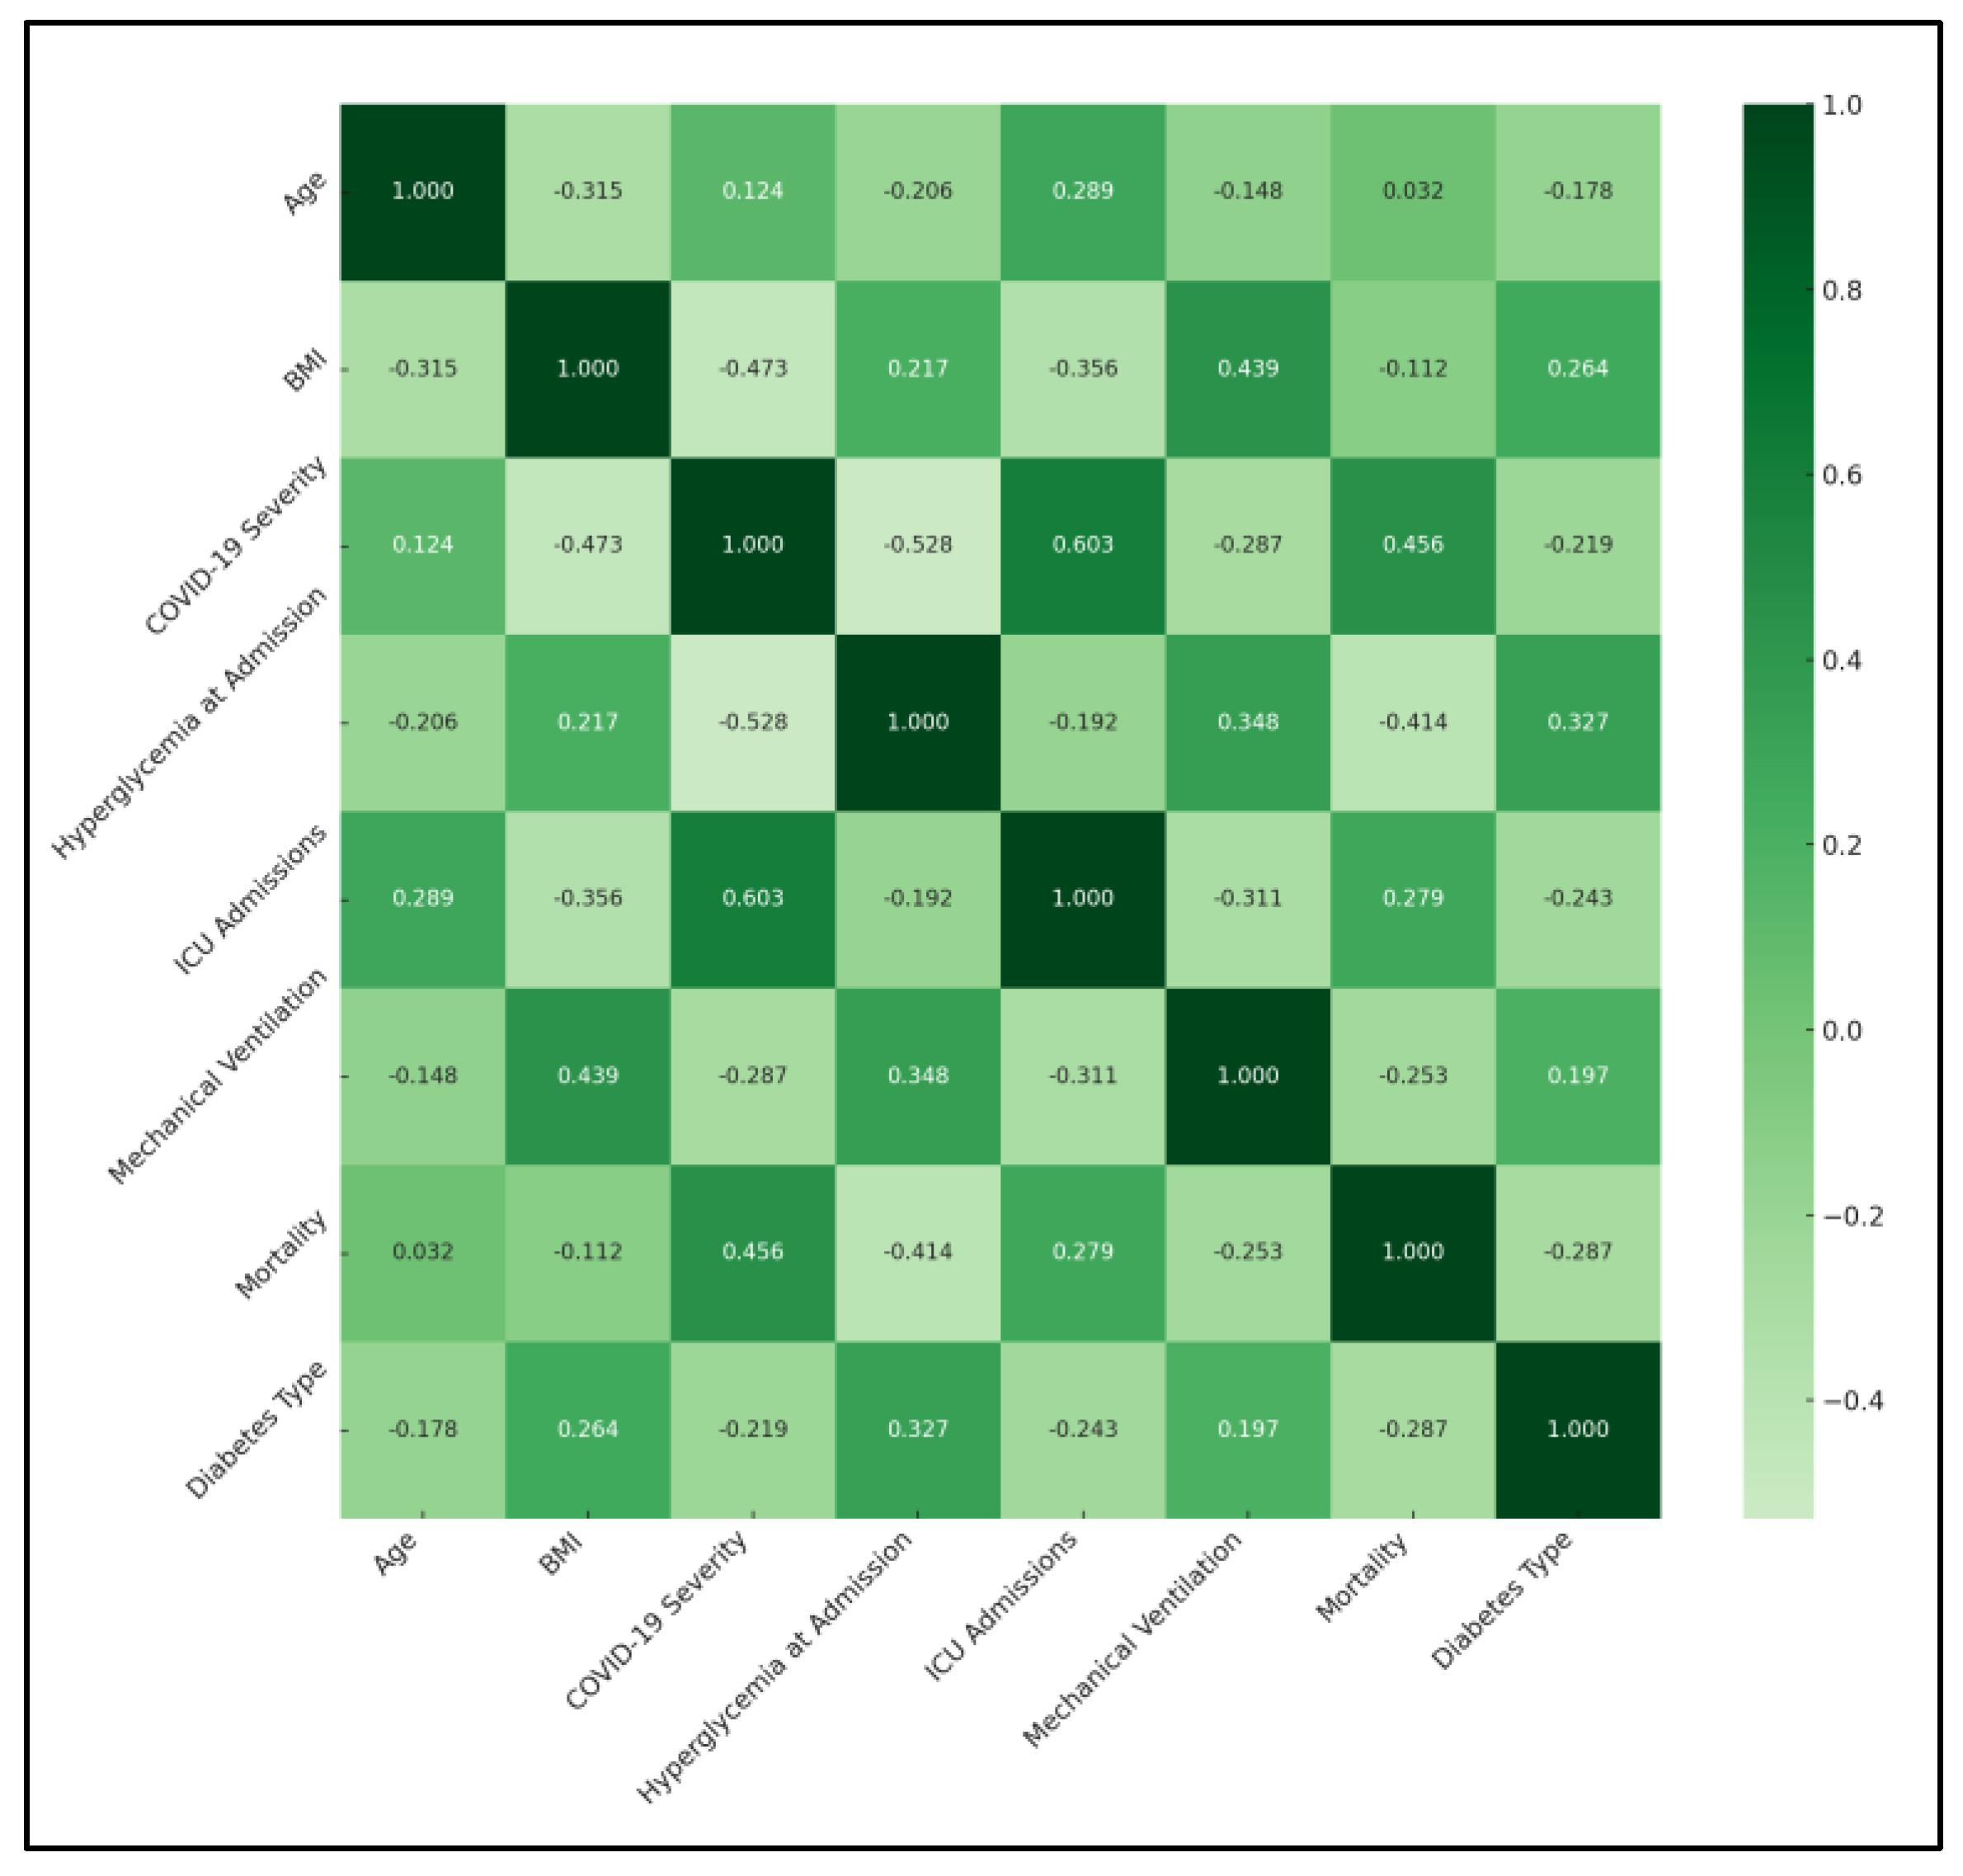
A significant negative correlation was observed between BMI and COVID-19 severity (ρ = −0.473, p < 0.05), suggesting that higher BMI was associated with less severe COVID-19 outcomes. This finding could imply a protective aspect of higher BMI against COVID-19 severity, which contradicts typical health assumptions. Similarly, a significant correlation between BMI and the requirement for mechanical ventilation (ρ = 0.439, p < 0.05) was found, indicating that higher BMI might be linked to an increased need for mechanical support due to respiratory complications. Hyperglycemia at admission showed a significant negative correlation with COVID-19 severity (ρ = −0.528, p < 0.05) and mortality (ρ = −0.414, p < 0.05), highlighting the impact of initial glucose levels on disease progression and survival. This finding underscores the importance of glycemic control in patients with diabetes during COVID-19 infection.
ICU admissions were significantly correlated with age (ρ = 0.289,
p < 0.05) and COVID-19 severity (ρ = 0.603,
p < 0.05), suggesting that older age and higher disease severity were predictive of ICU admission. This outcome aligns with global observations that severe cases of COVID-19 are more likely to require intensive care, particularly among older populations. Notably, the correlation matrix revealed significant relationships involving diabetes type. Diabetes type showed a positive correlation with hyperglycemia at admission (ρ = 0.327), indicating a higher likelihood of elevated blood glucose levels in patients with diabetes, particularly those with type 2 diabetes, as presented in
Table 5 and
Figure 1.
The ICU admission risk was notably higher in the T2D group at 31.70% compared to 17.00% in the no diabetes group. This significant increase was quantified with an odds ratio (OR) of 2.24, indicating more than double the risk. T2D patients also faced a higher risk of ICU admission than T1D patients (22.60%), with an OR of 1.59, indicating substantially elevated risk of severe COVID-19 complications requiring intensive care among T2D patients.
Similarly, the risk of requiring mechanical ventilation followed a significant trend. For T2D patients, this risk was 35.30%, compared to 18.00% for those with no diabetes. The OR of 2.46 suggested a markedly higher likelihood of needing mechanical respiratory support for T2D patients. The comparison with T1D patients, who had a 29.00% risk, also showed a higher, though less pronounced, risk for T2D individuals.
Mortality rates provided further critical insights. T2D patients exhibited a mortality rate of 11.60%, significantly higher than the 3.50% in the no diabetes cohort. The OR of 3.60 underlined the grave impact of T2D on COVID-19 fatality rates. The mortality rate for T1D patients was also higher than for those without diabetes, but the relative increase was lower compared to T2D patients. The duration of hospitalization further mirrored these trends. T2D patients had an average hospital stay of 11.6 days, longer than the 7.2 days observed in the no diabetes group, with an OR of 1.61, as seen in
Figure 2 and
Table 6.
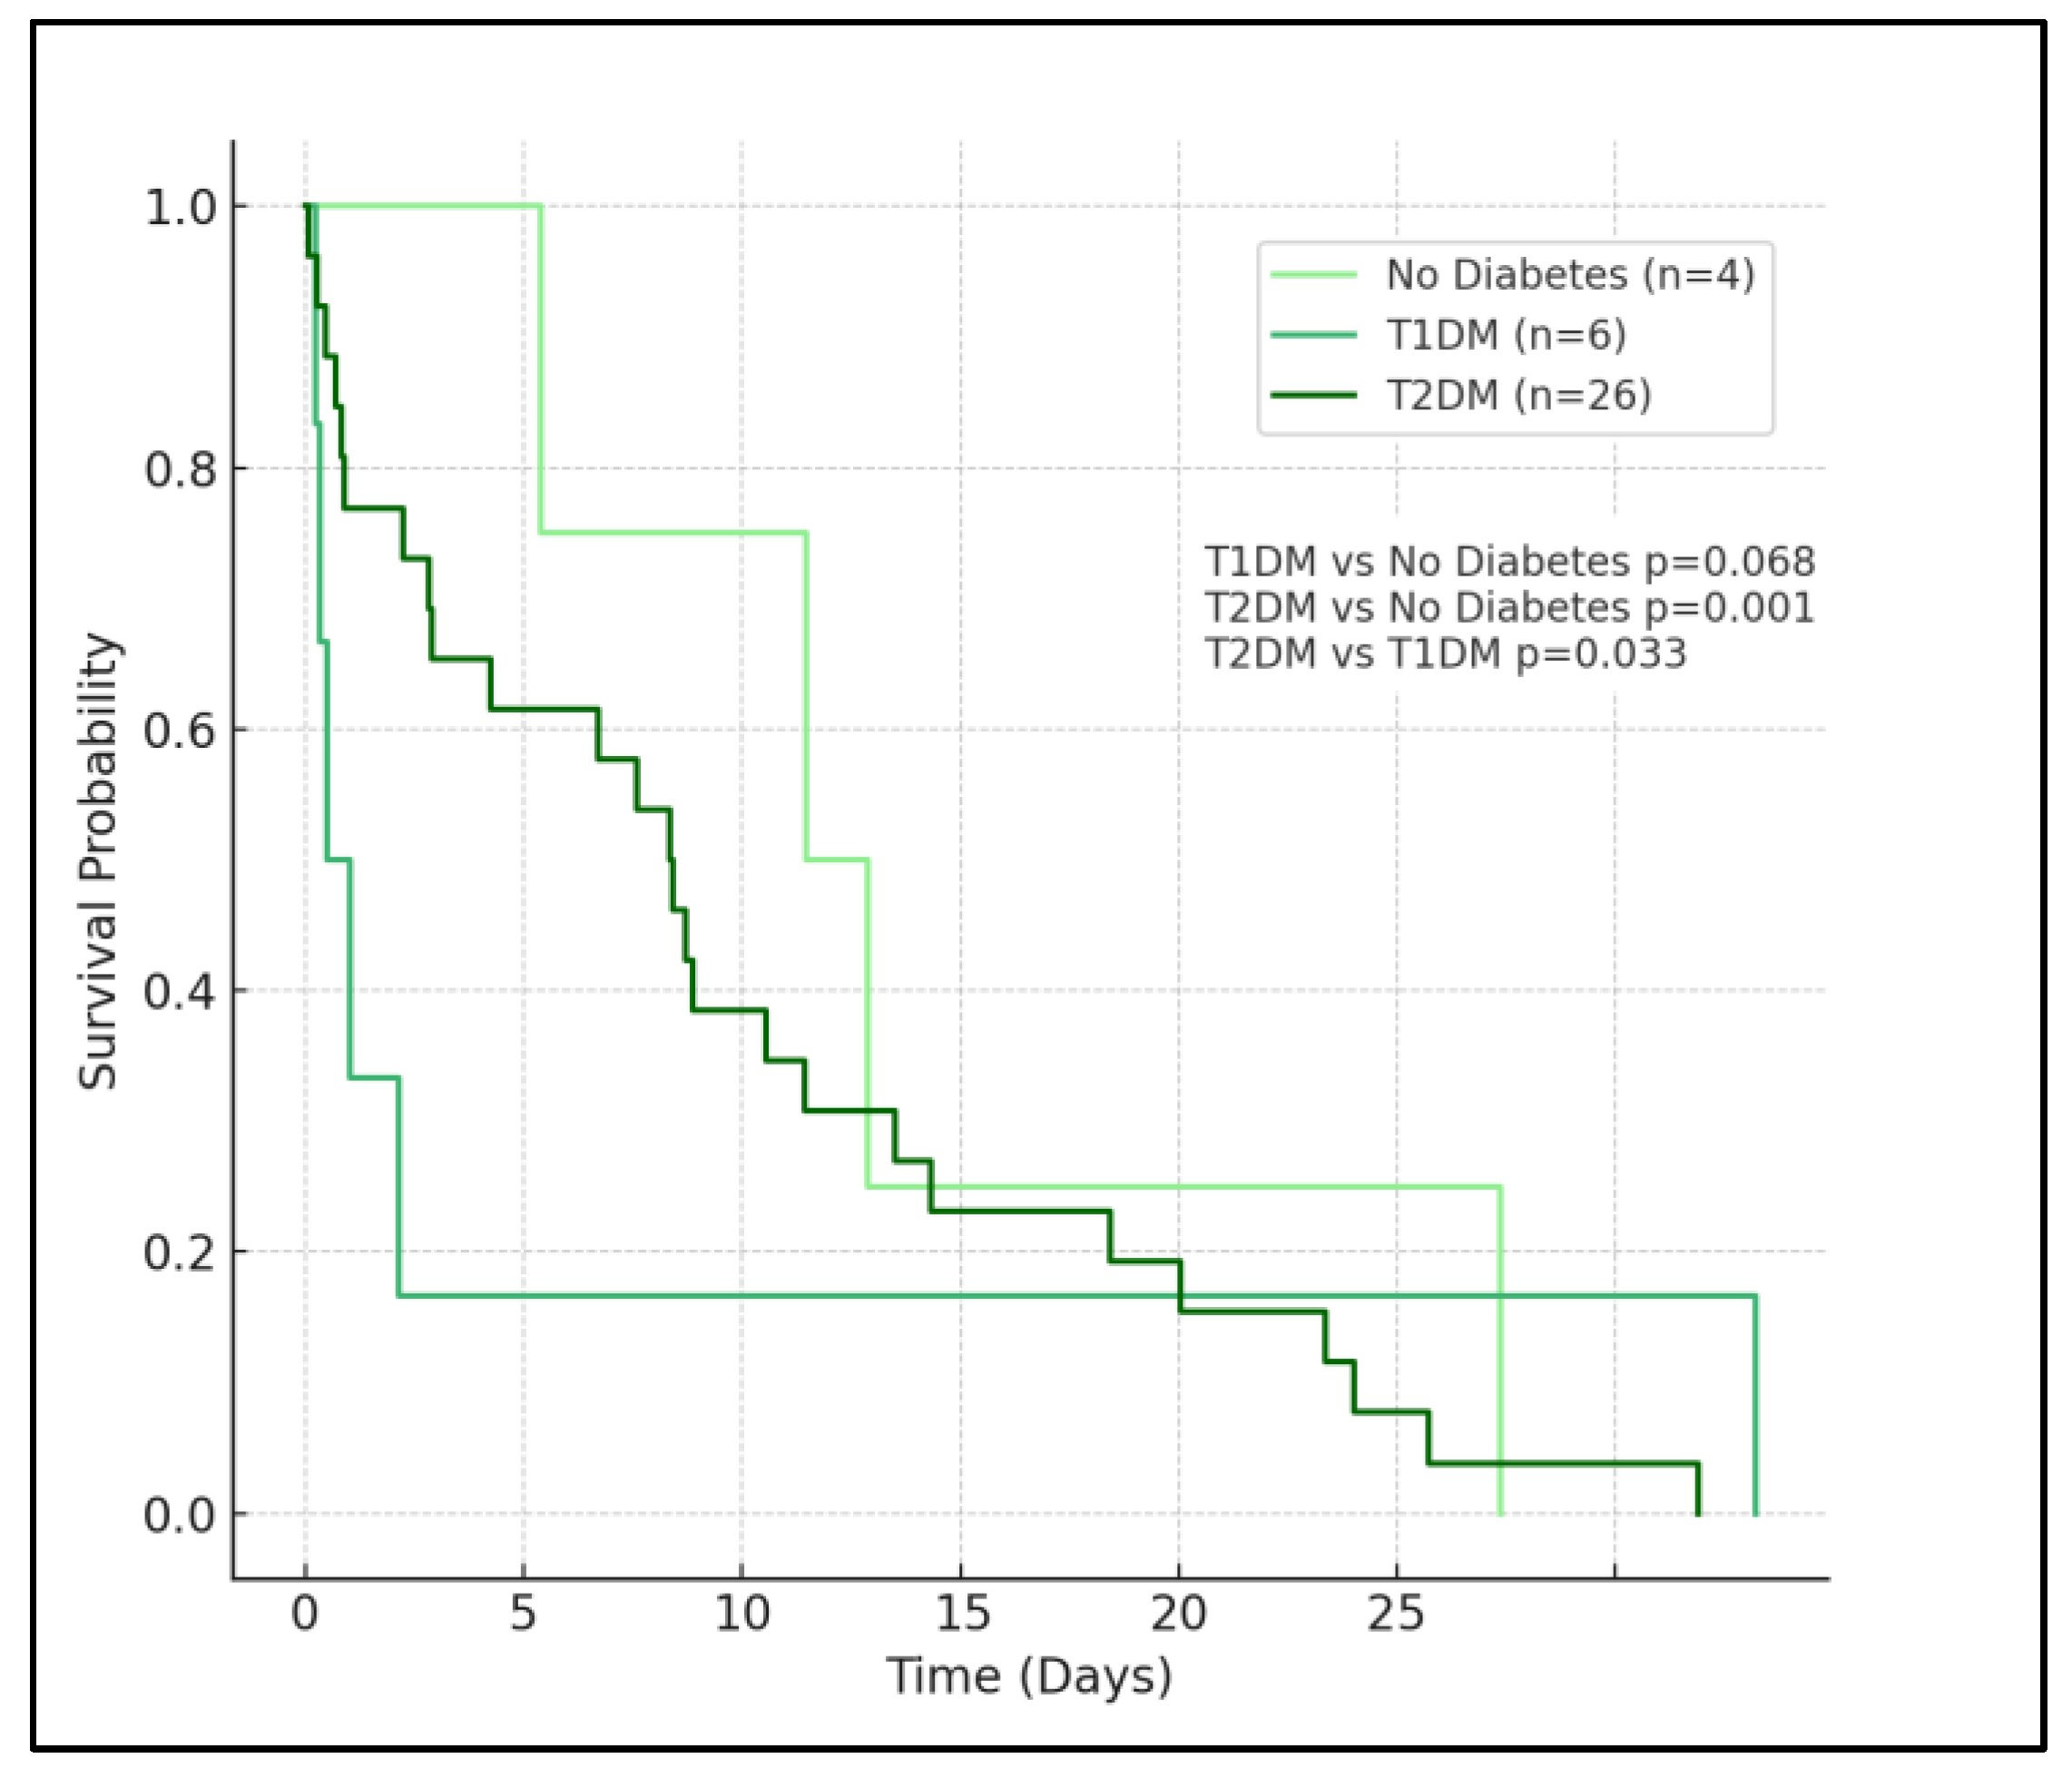
In the analysis, patients with no diabetes (represented by the light green curve) exhibit the highest survival probability over the observed period. This group’s curve descends most gradually, indicating a lower rate of mortality compared to the diabetes groups. The survival probability for this group remains relatively high throughout the time frame, affirming the less severe impact of COVID-19 on patients without diabetes.
Patients with type 1 diabetes, denoted by the medium sea green curve, show a moderately decreased survival probability compared to the no diabetes group. The curve for T1D descends at a faster rate than that of the no diabetes group, but not as rapidly as the type 2 diabetes group. The log-rank test between T1D and no diabetes yields a p-value of 0.068, which is marginally above the typical threshold for statistical significance, suggesting a trend towards but not definitively indicating higher mortality in the T1D group compared to those without diabetes.
The most notable observation comes from the survival curve for patients with T2D, depicted in dark green. This curve shows a significantly steeper decline, especially in the initial phase, reflecting a higher mortality rate. The rapid descent of the T2D curve underscores the severe impact of type 2 diabetes on COVID-19 outcomes. The log-rank
p-values corroborate this observation, with a highly significant difference (
p < 0.001) in survival when compared to the no diabetes group, and a significant difference (
p = 0.033) when compared to the T1D group, as seen in
Figure 3. These results indicate that T2D is a significant risk factor for poorer outcomes in COVID-19 patients.


 ,
, 

