
Effects of Exercise Type on Muscle Strength and Body Composition in Men and Women: A Systematic Review and Meta-Analysis


Abstract
:1. Introduction
2. Materials and Methods
2.1. Search Strategy
2.2. Inclusion Criteria
2.3. Exclusion Criteria
2.4. Quality Assessment and Data Extraction
2.5. Statistical Analysis
3. Results
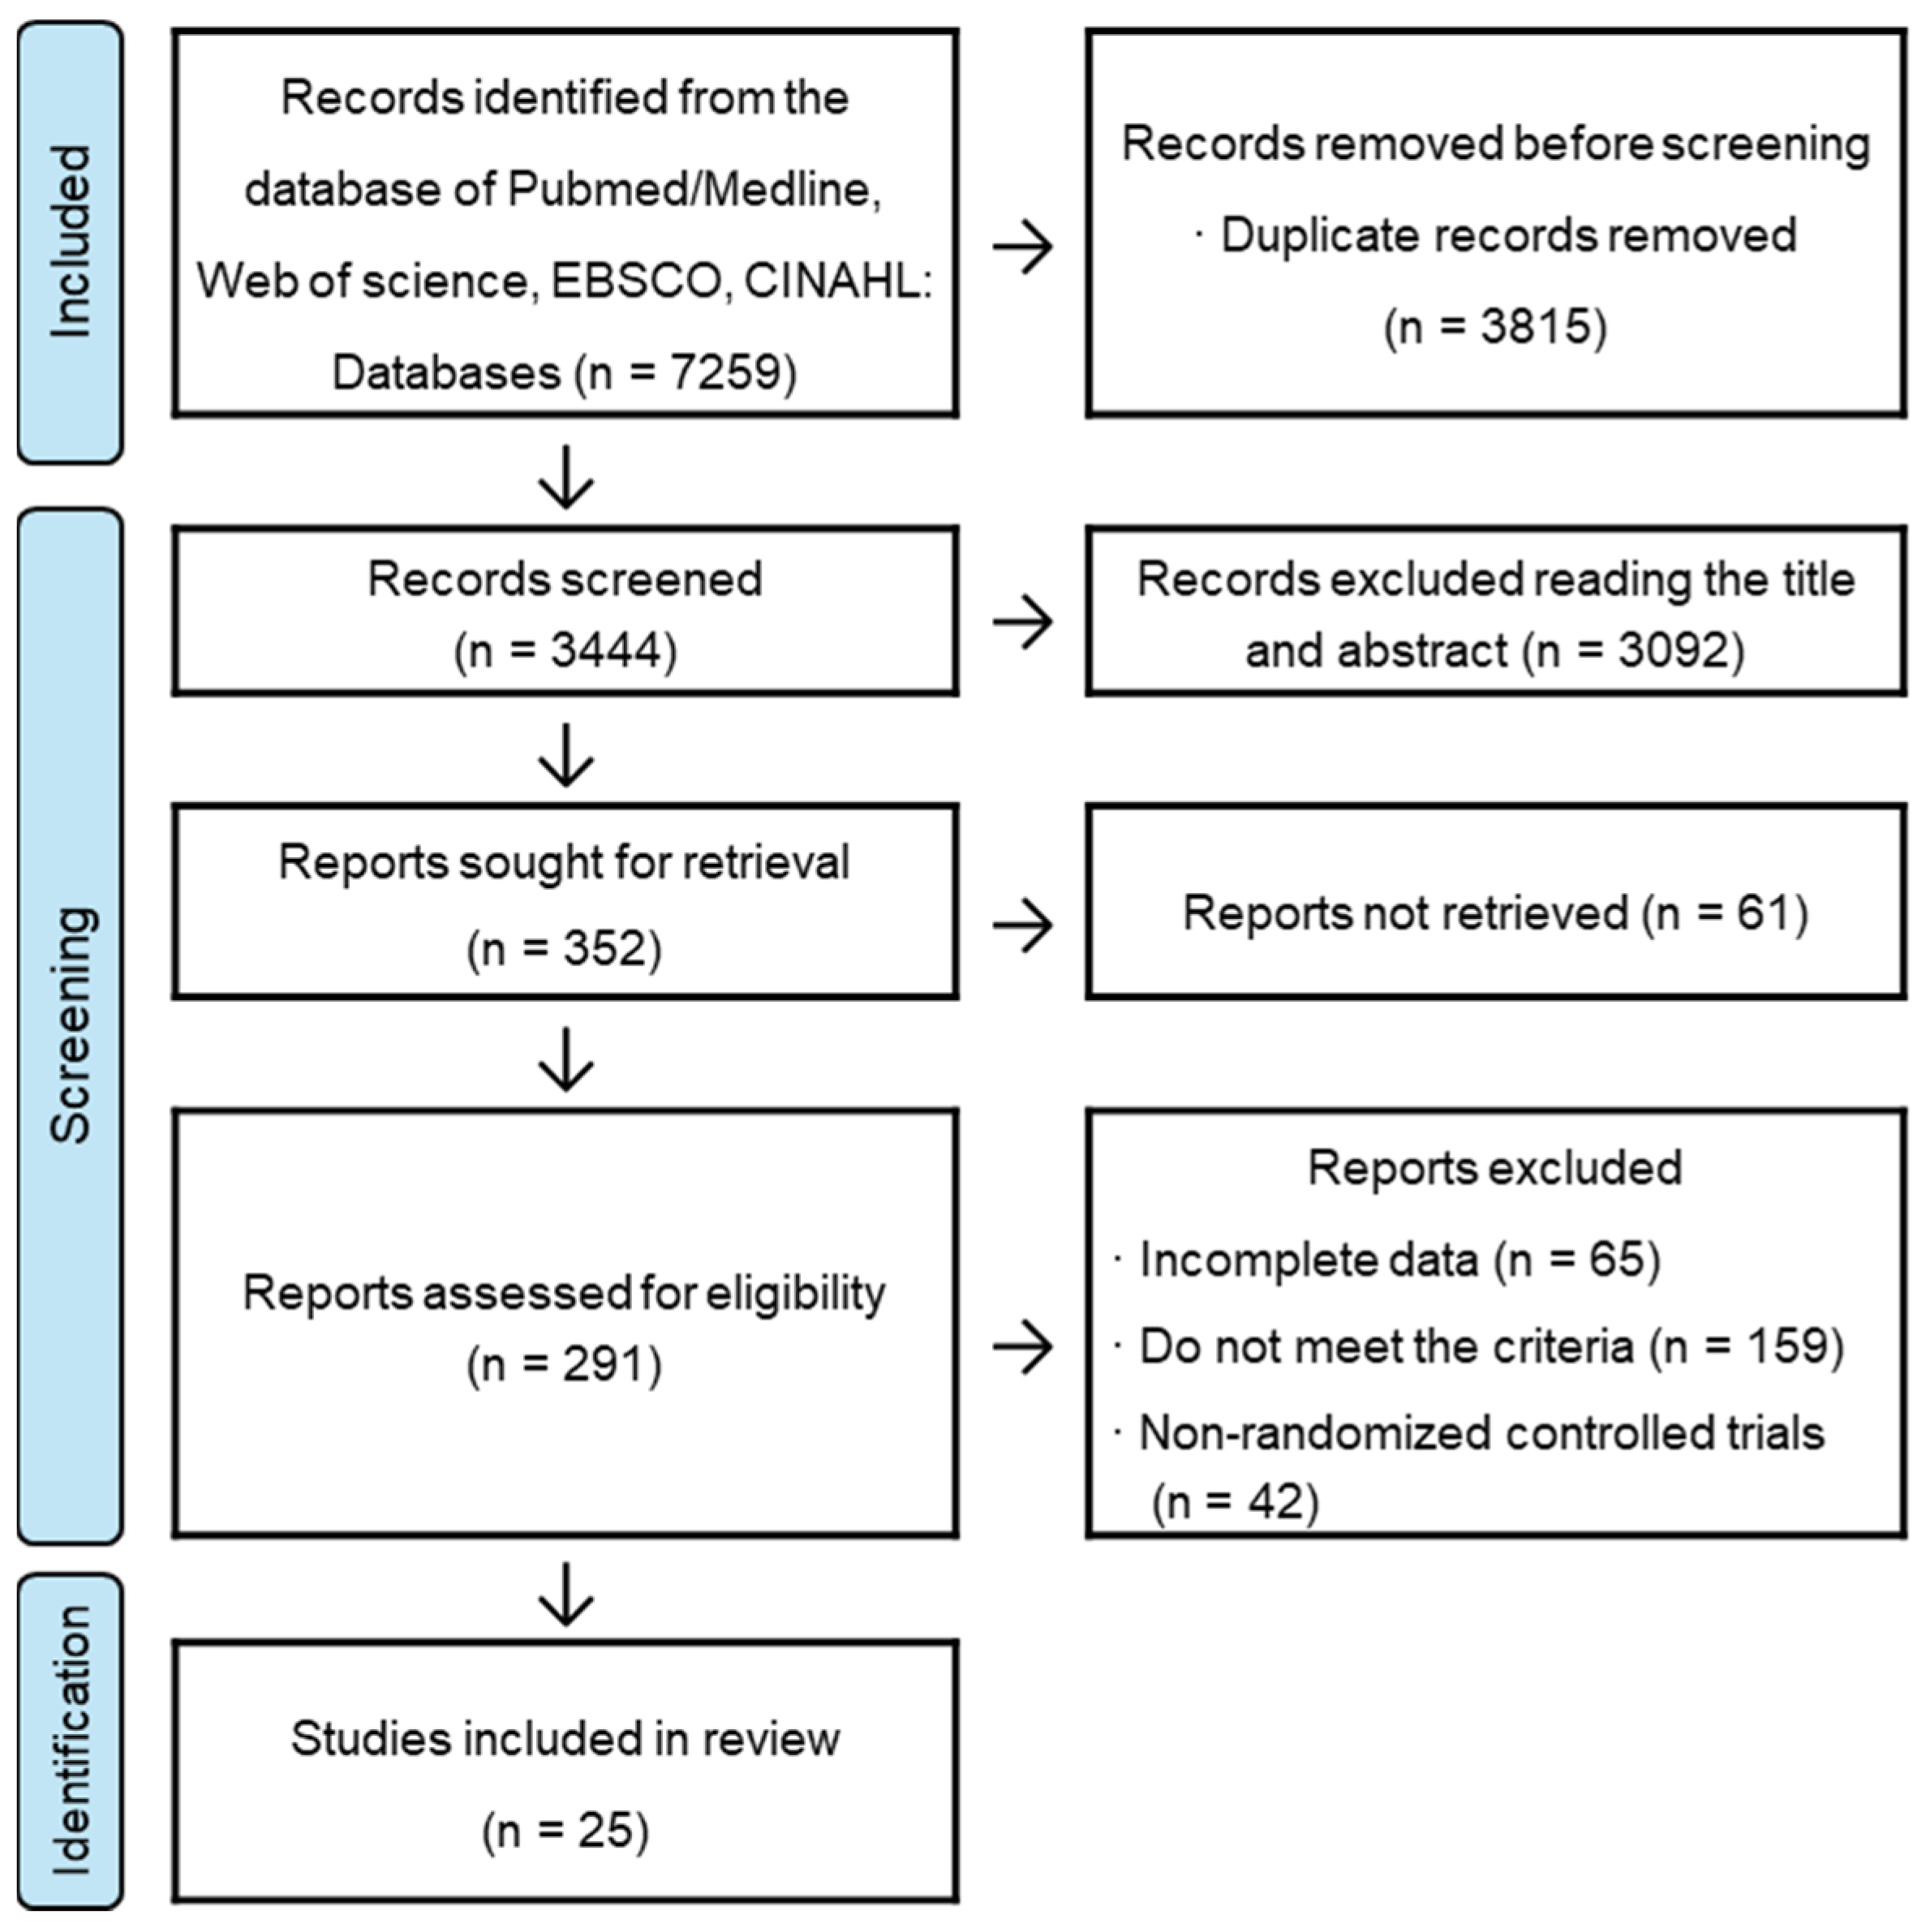
3.1. Literature Search Results
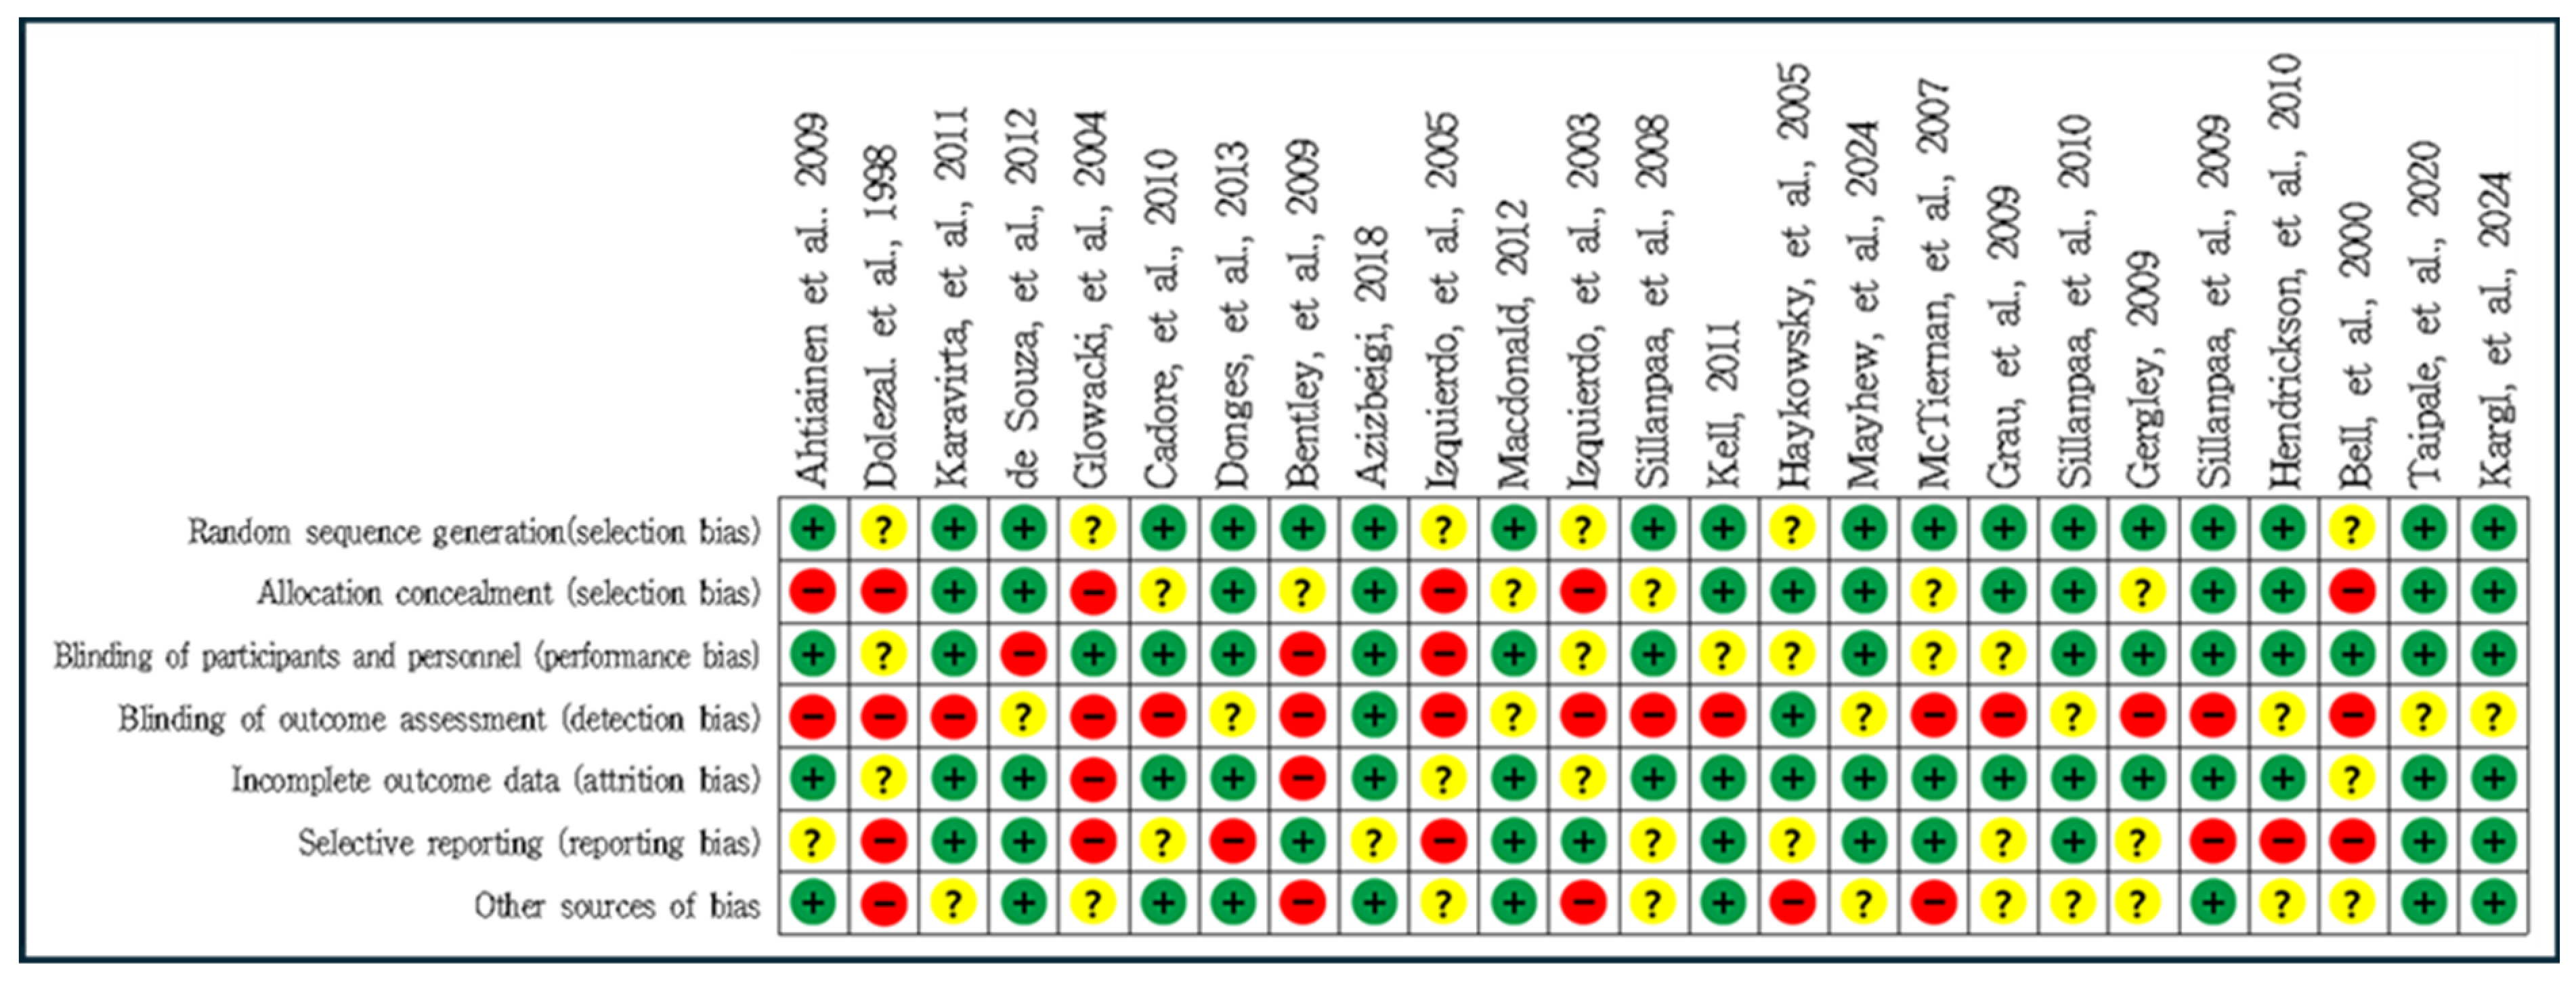
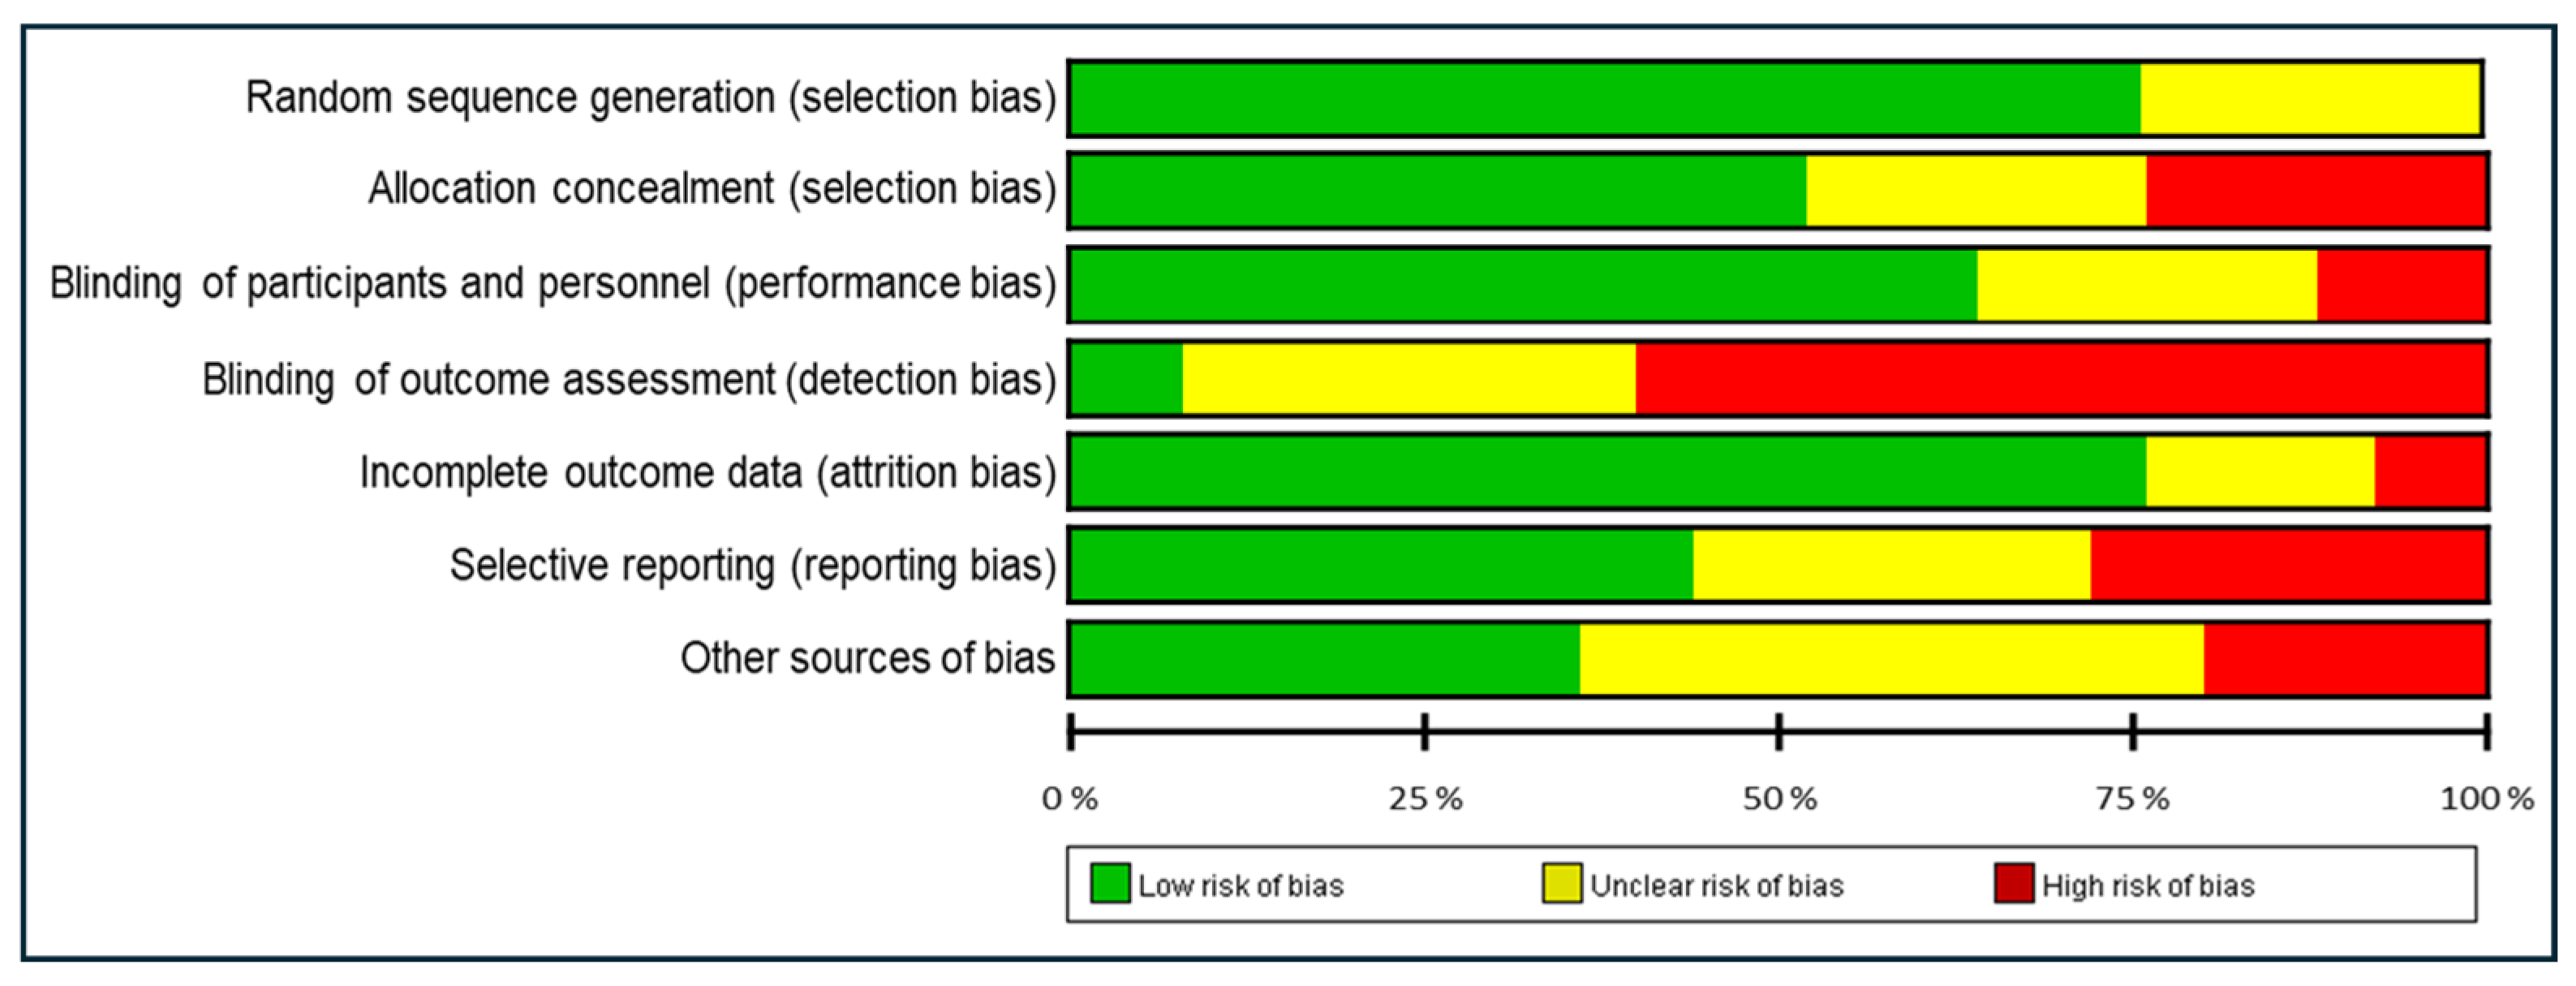
3.2. Quality Assessment
3.3. Study Characteristics
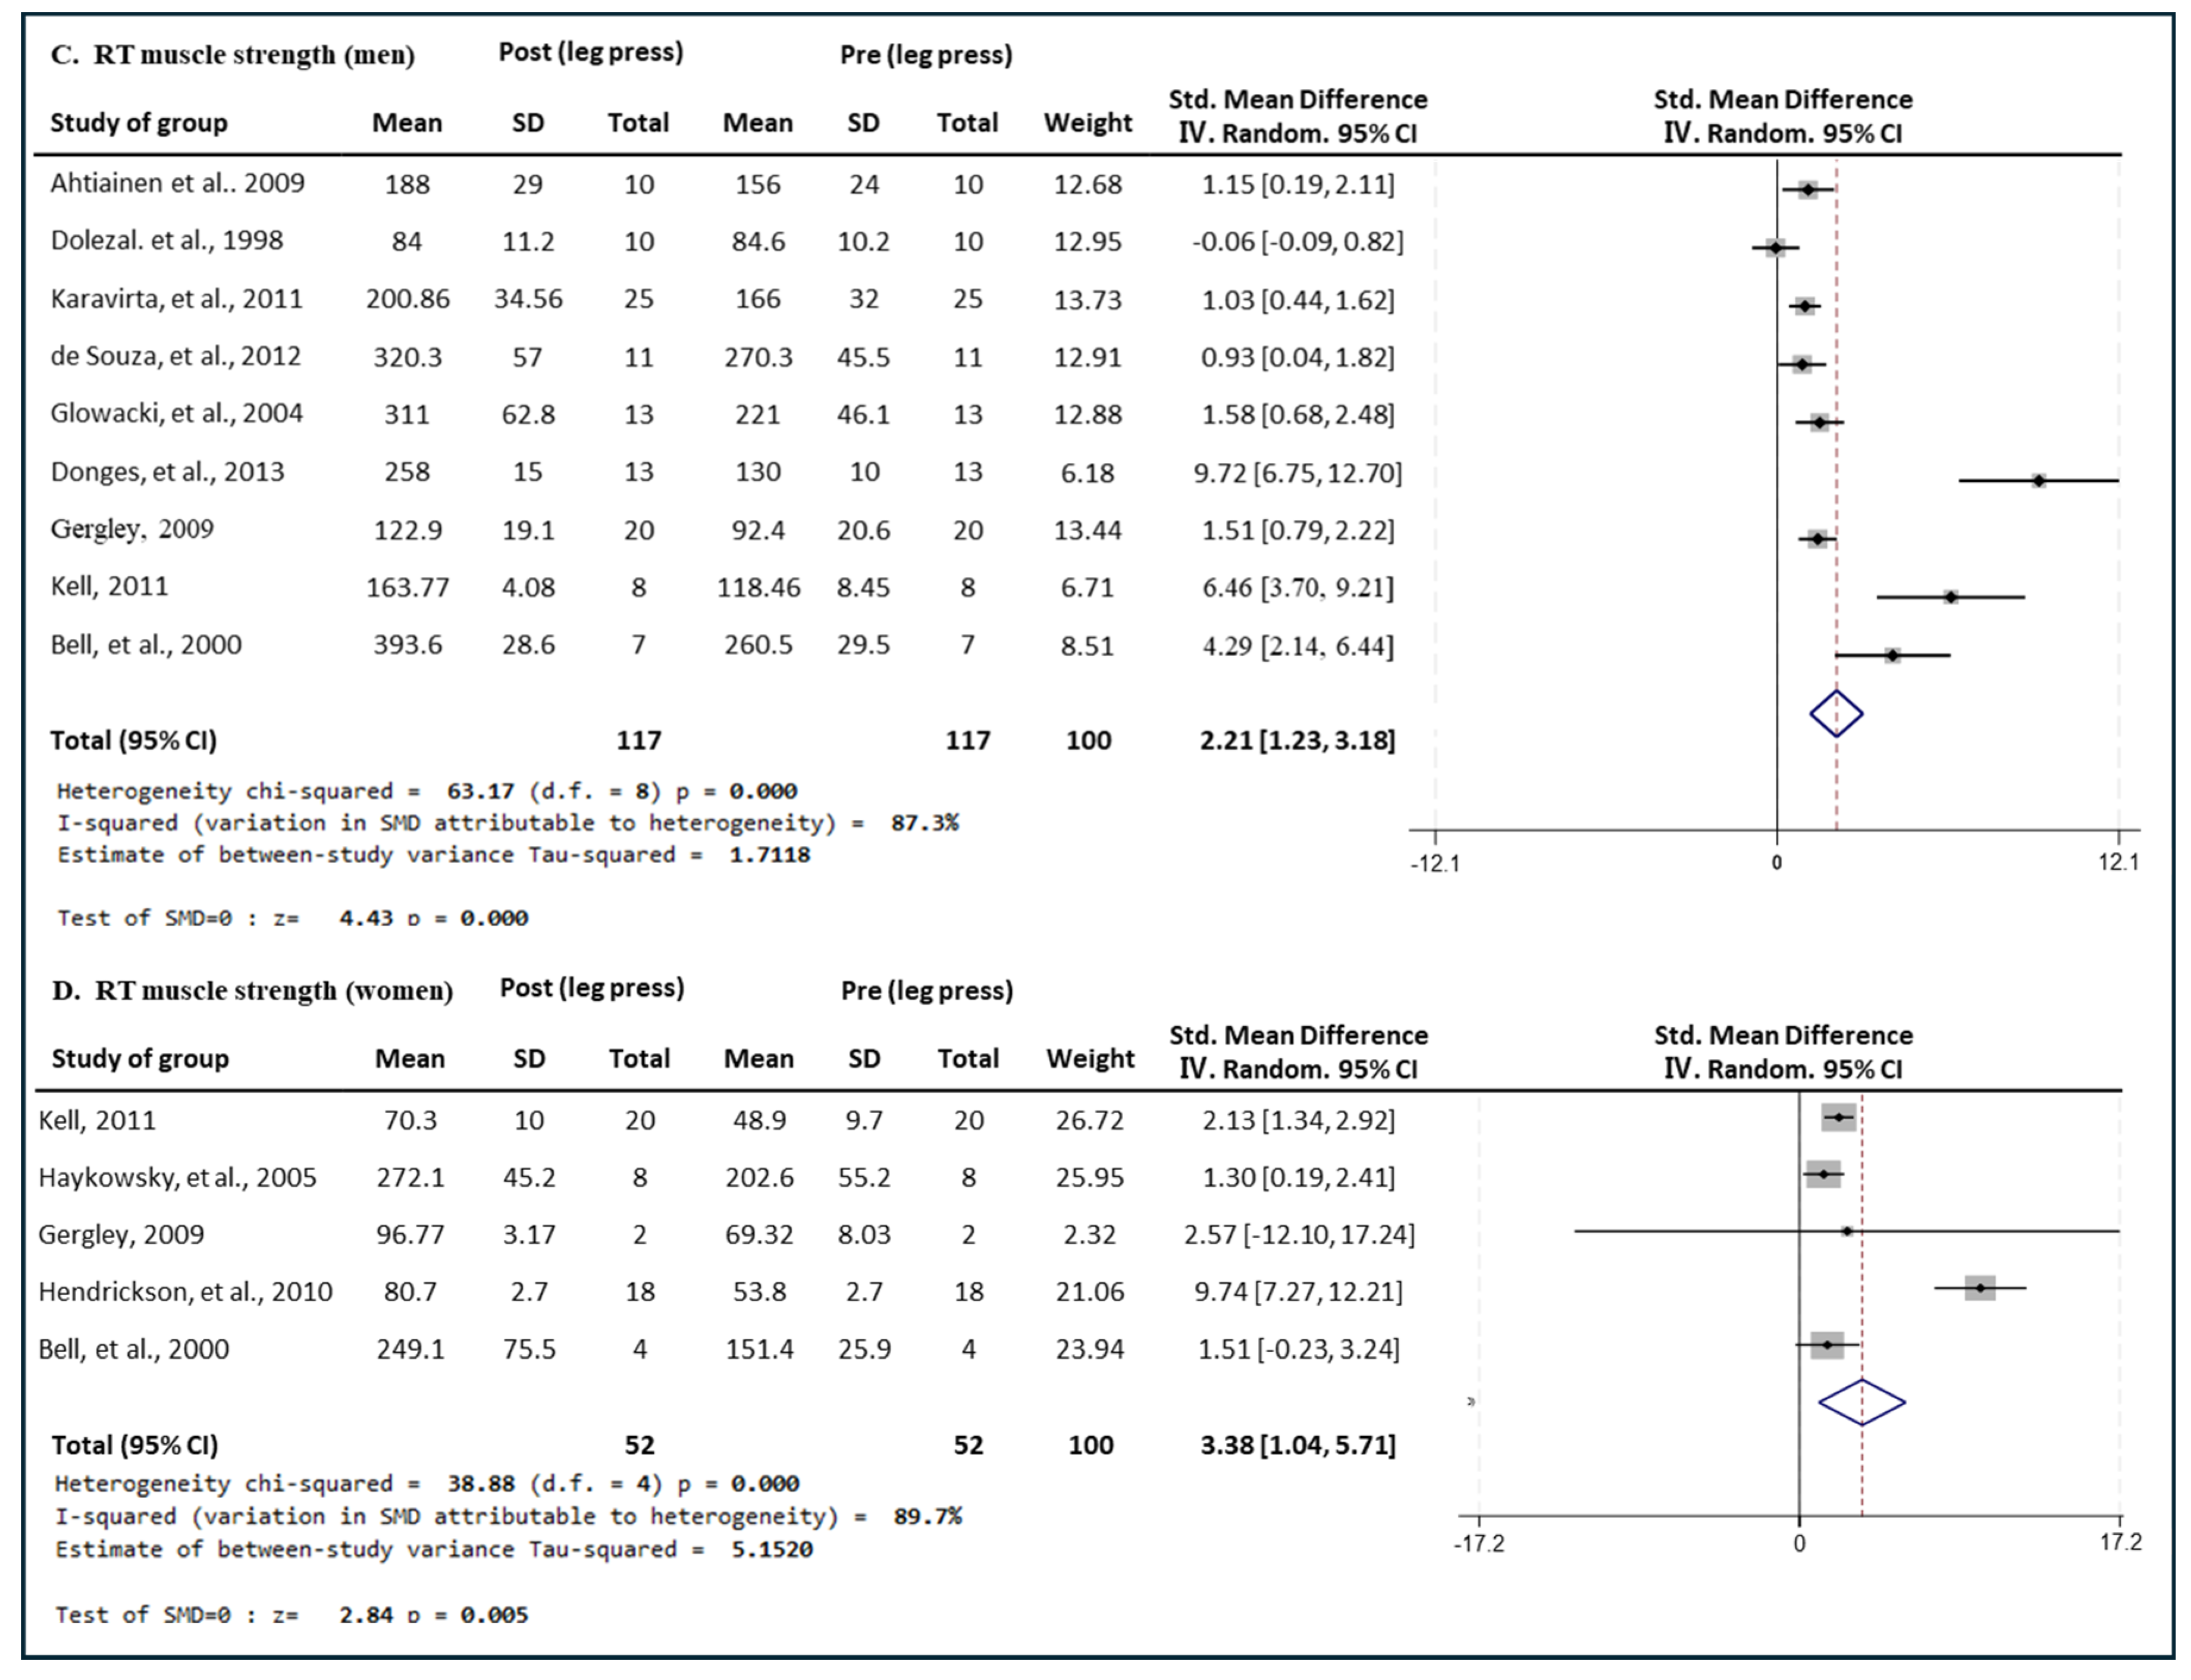
3.4. Effect of Exercise Type on Leg Press Muscle Strength in Men and Women
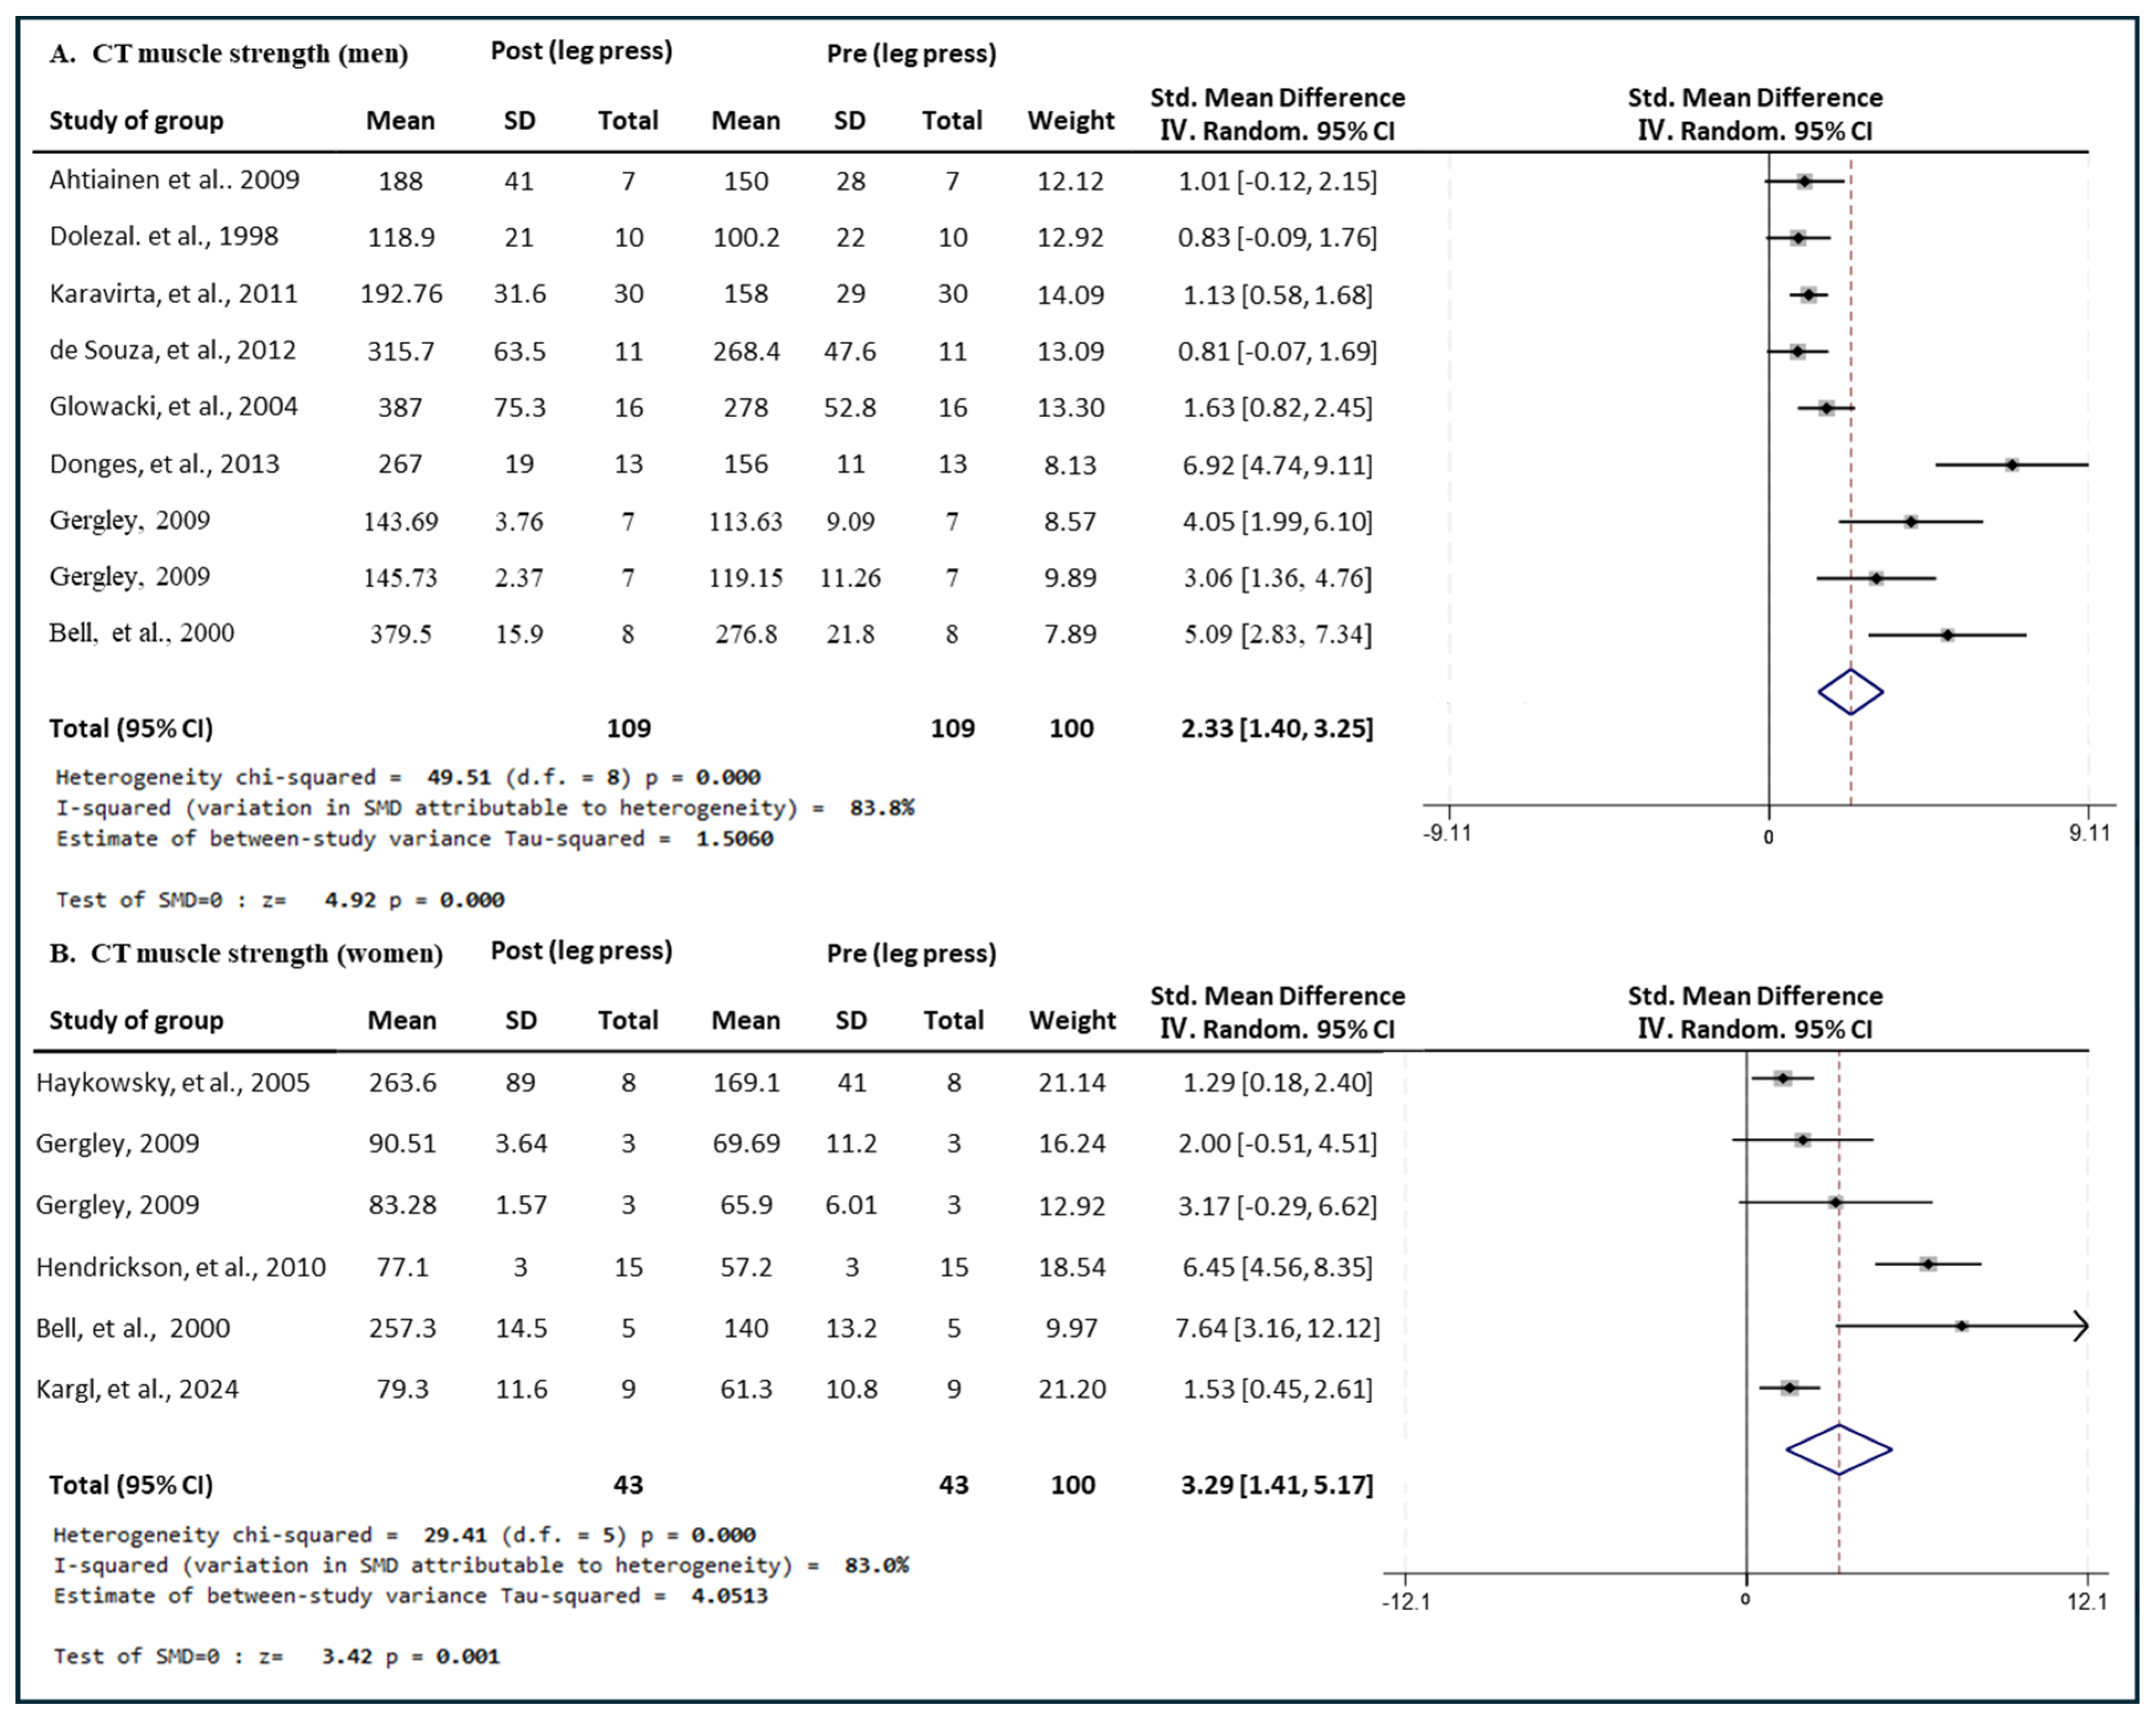
3.4.1. Effect of CT
3.4.2. Effect of RT
3.4.3. Effect of ET
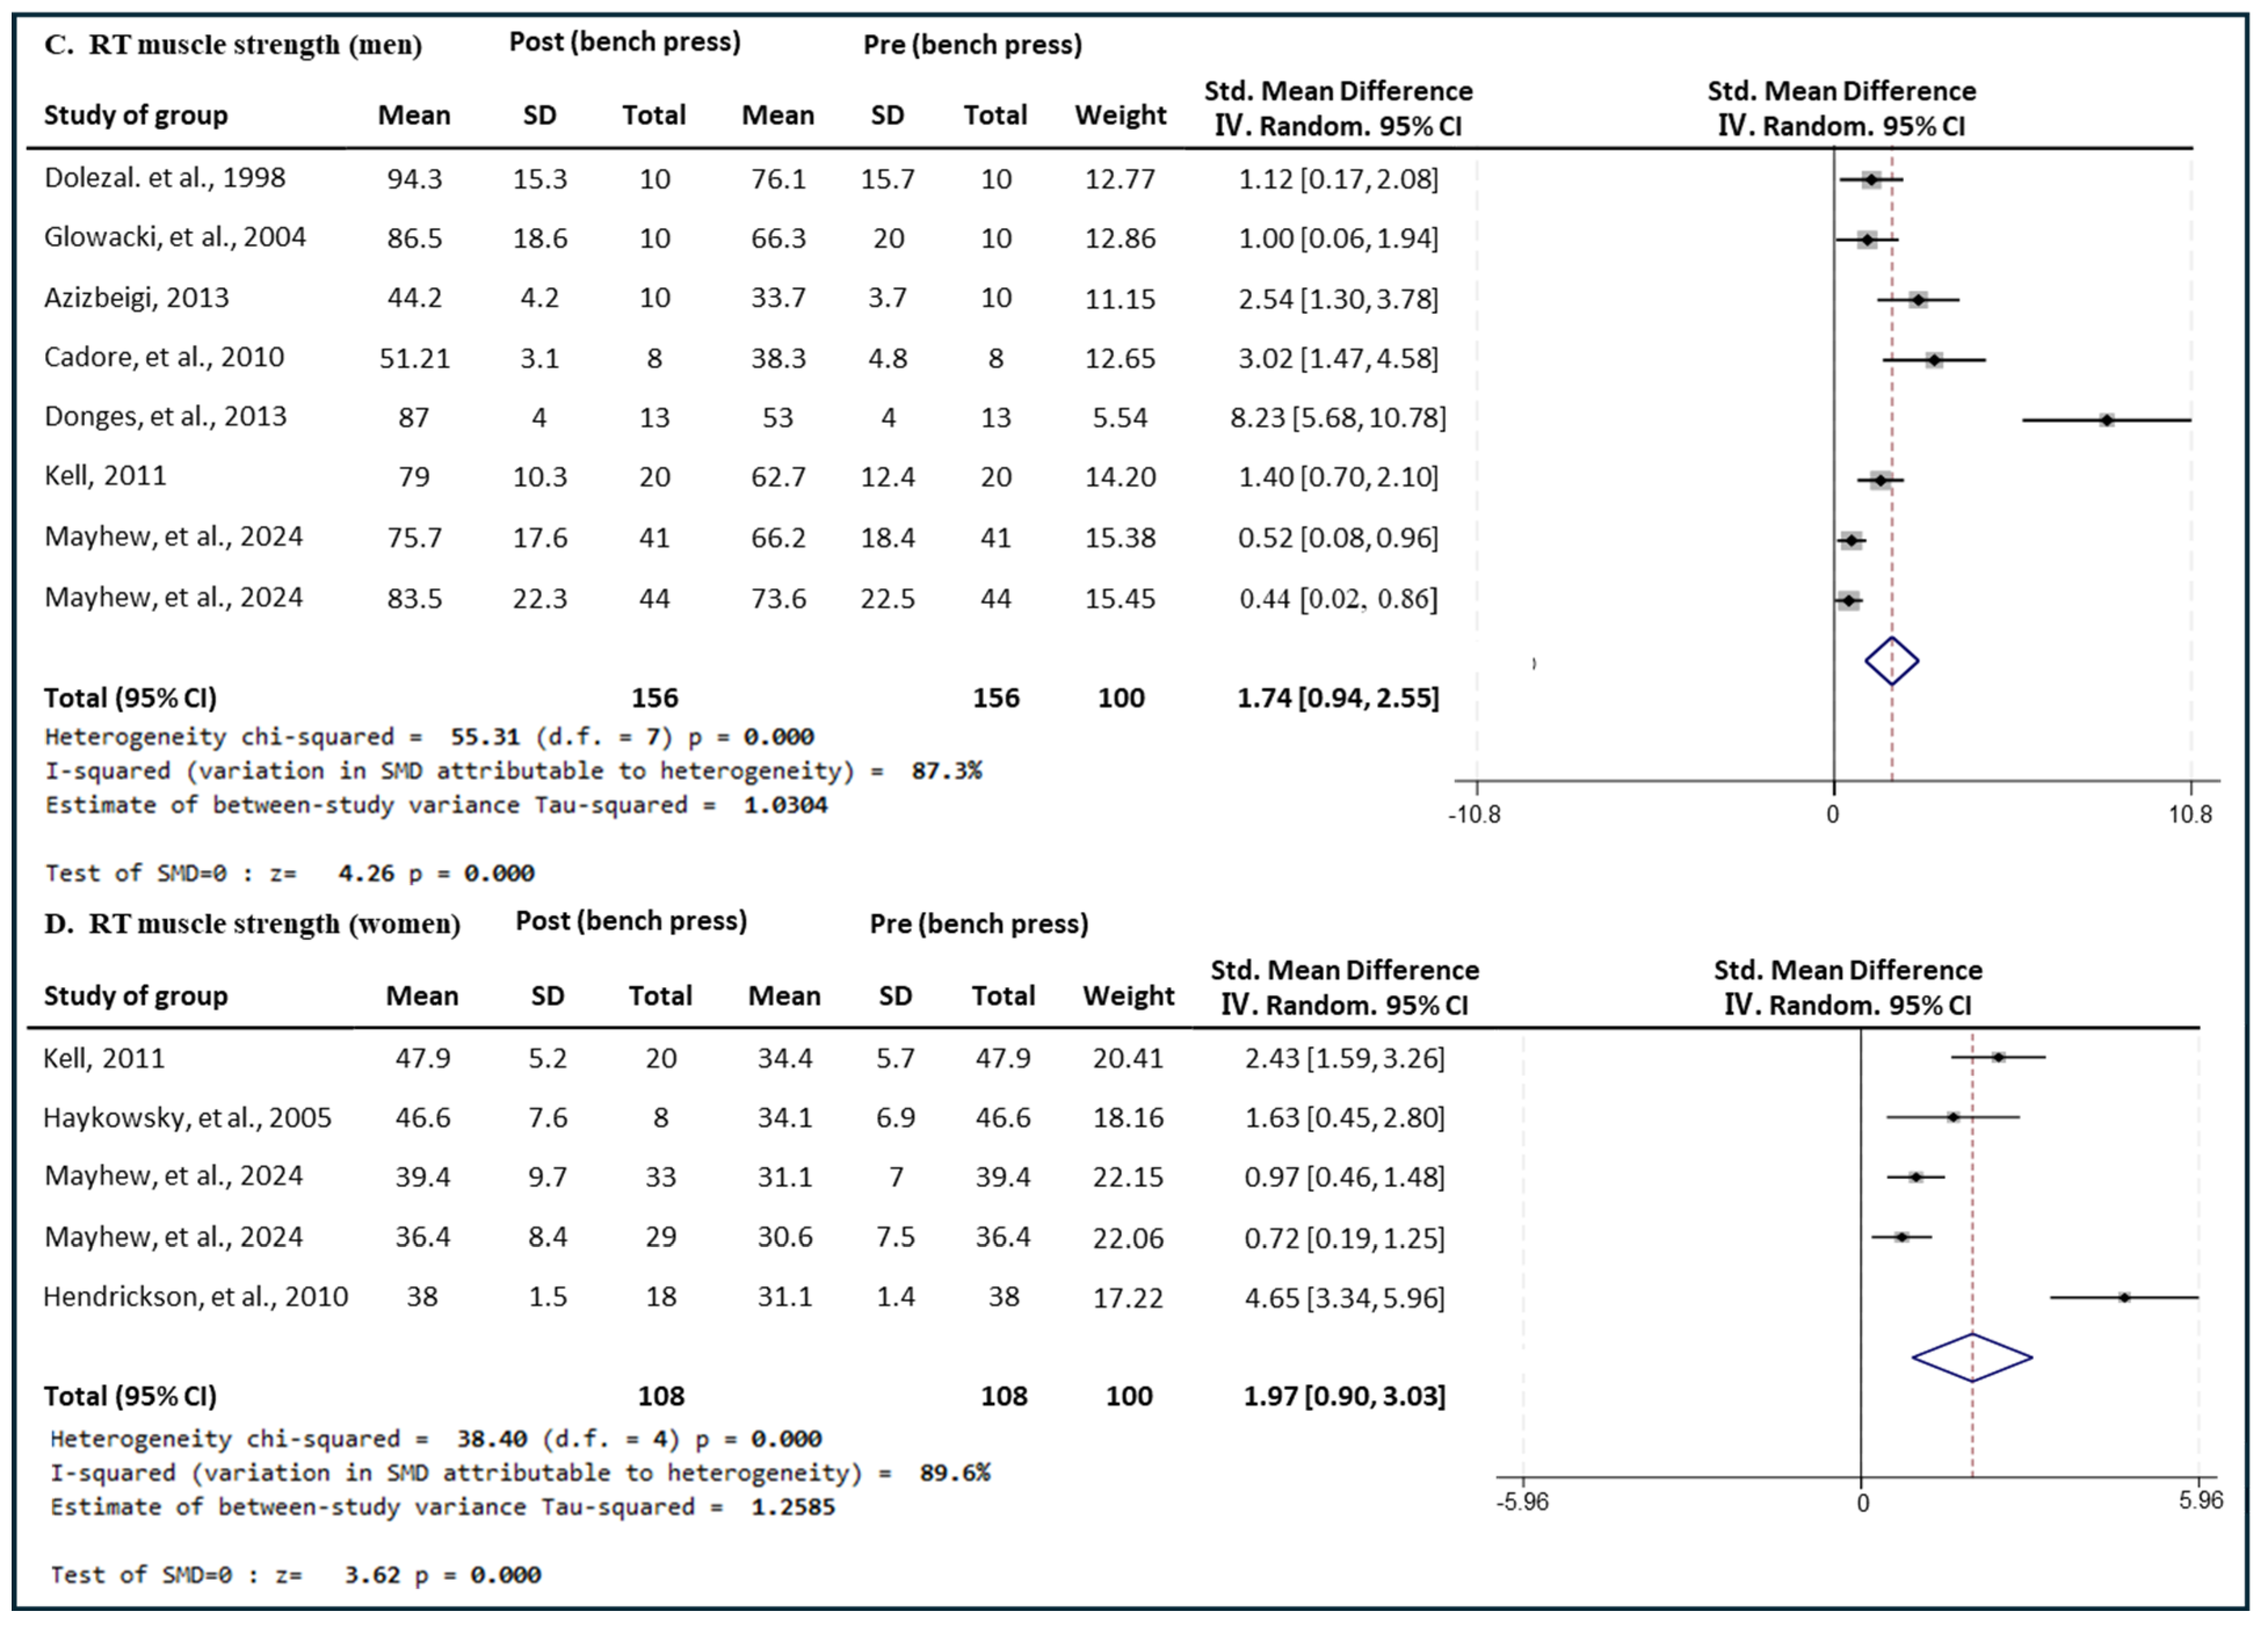
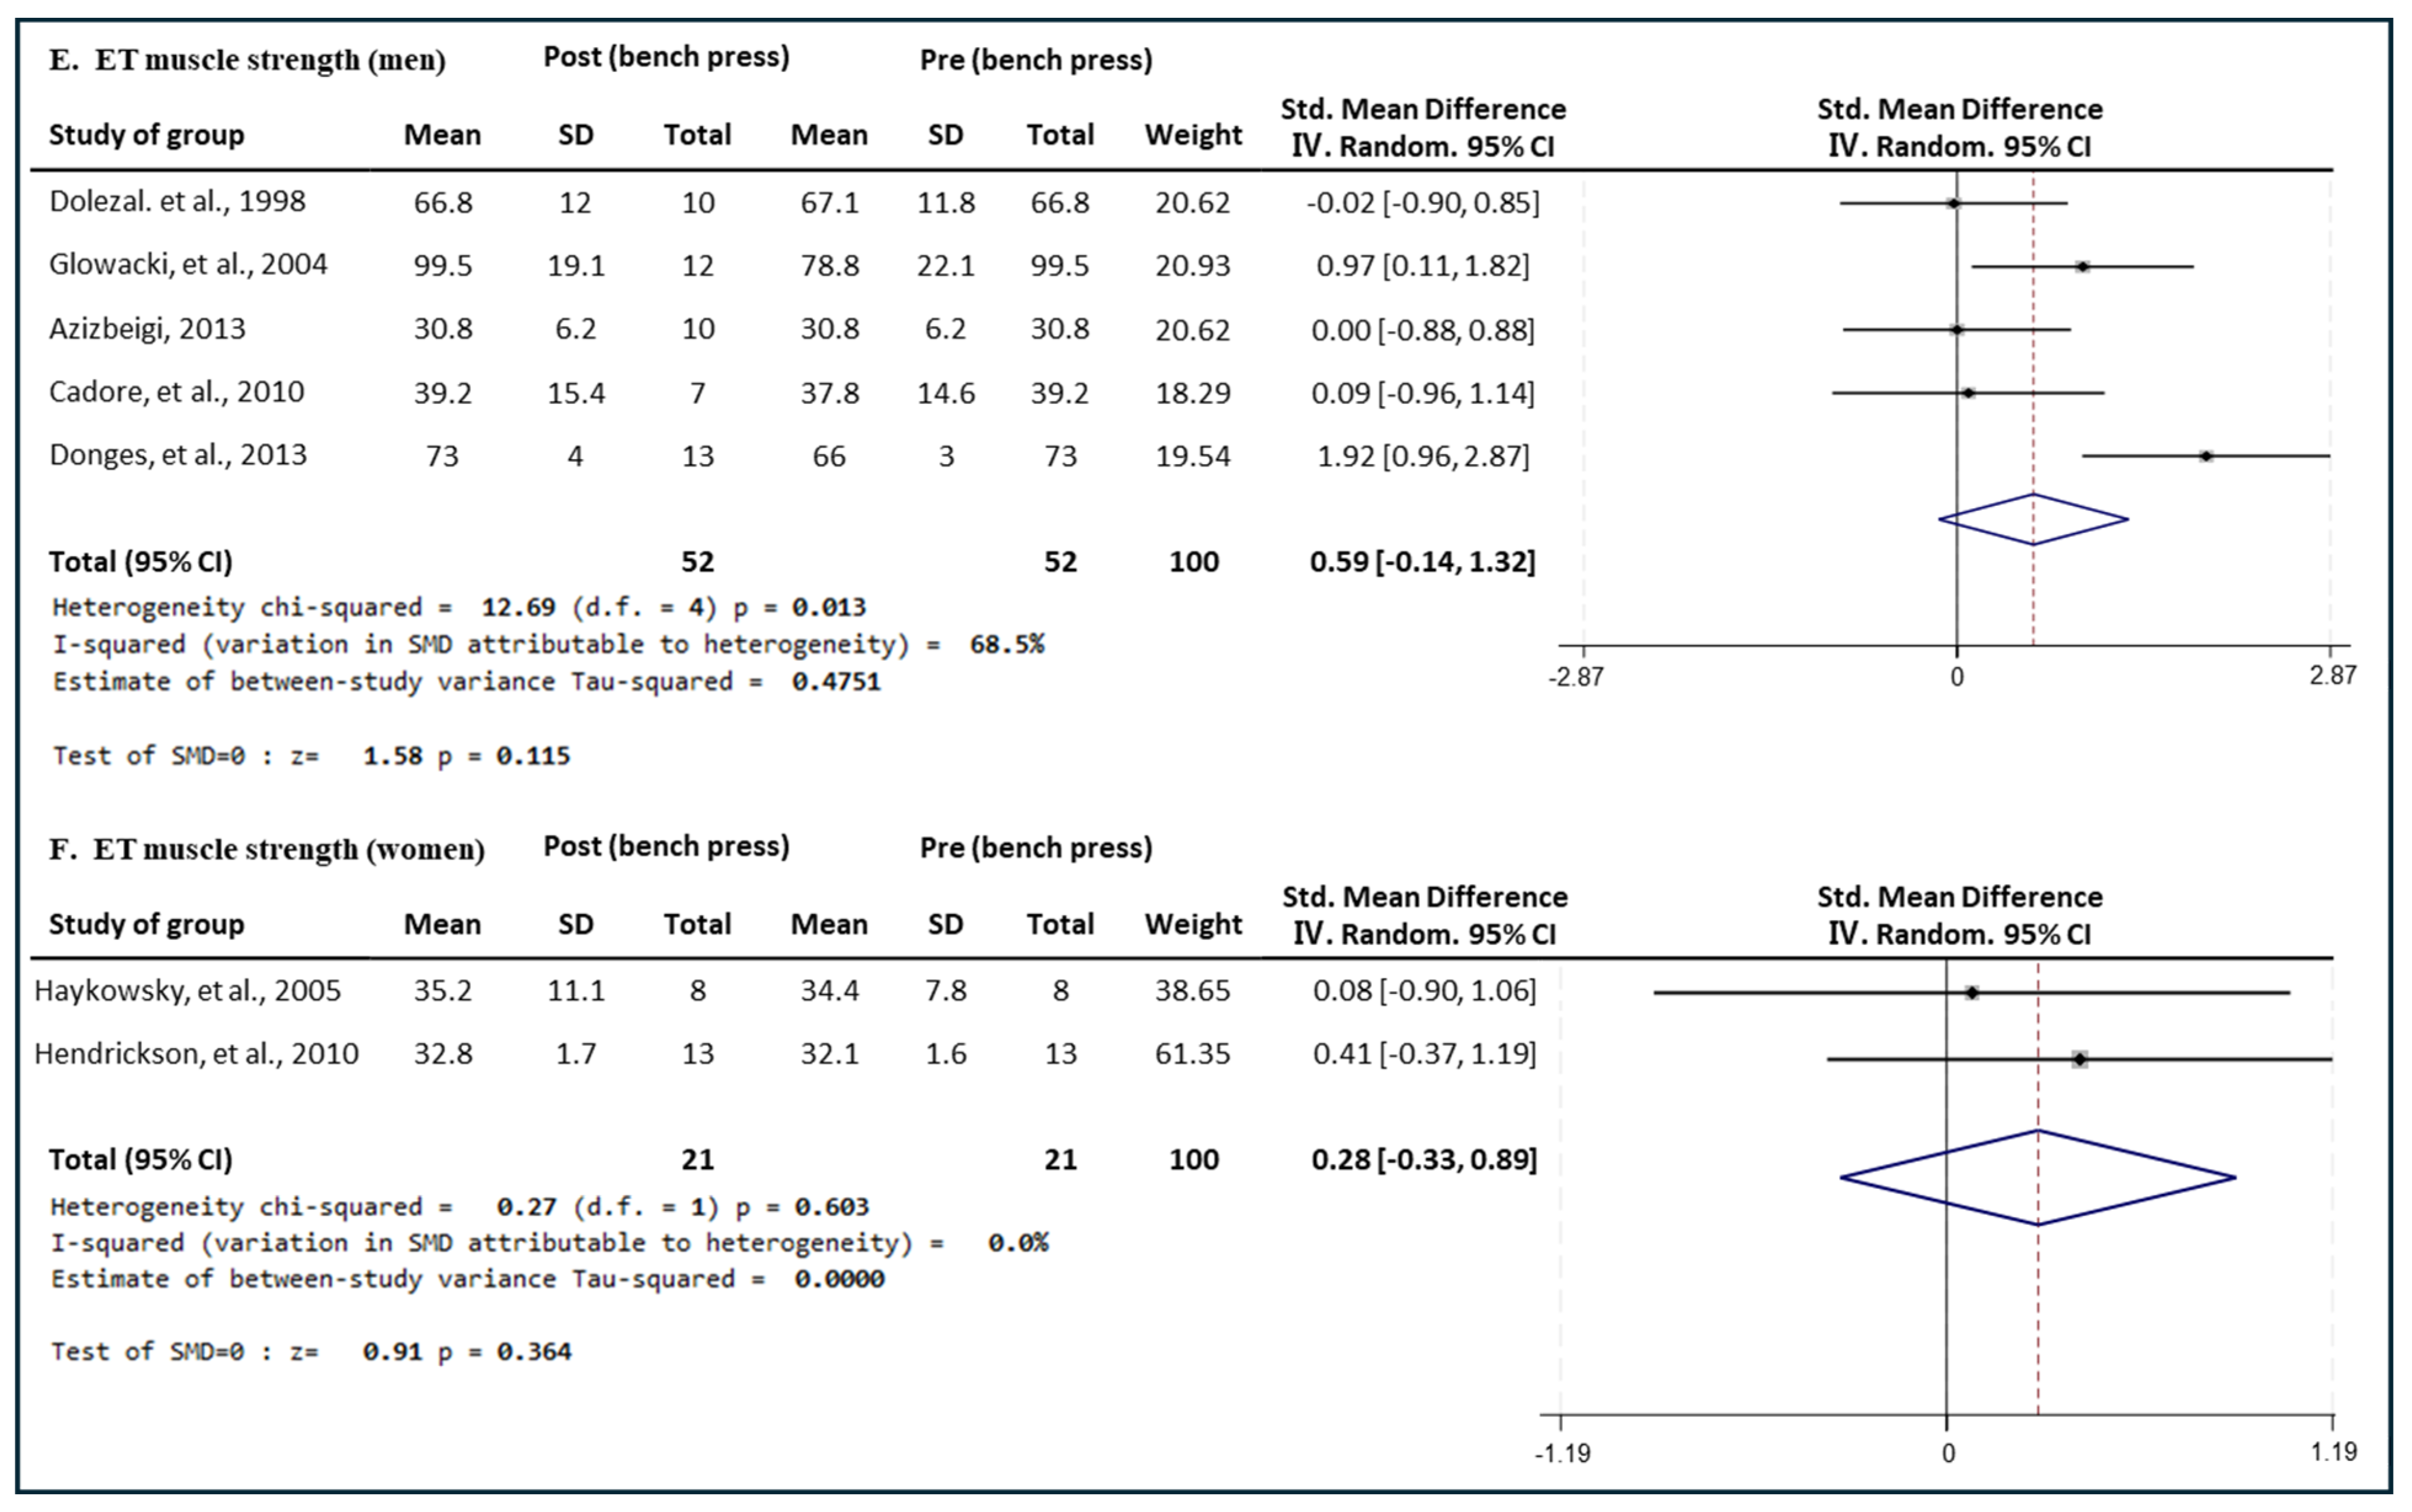
3.5. Effect of Exercise Type on Bench Press Muscle Strength in Men and Women
3.5.1. Effect of CT
3.5.2. Effect of RT
3.5.3. Effect of ET
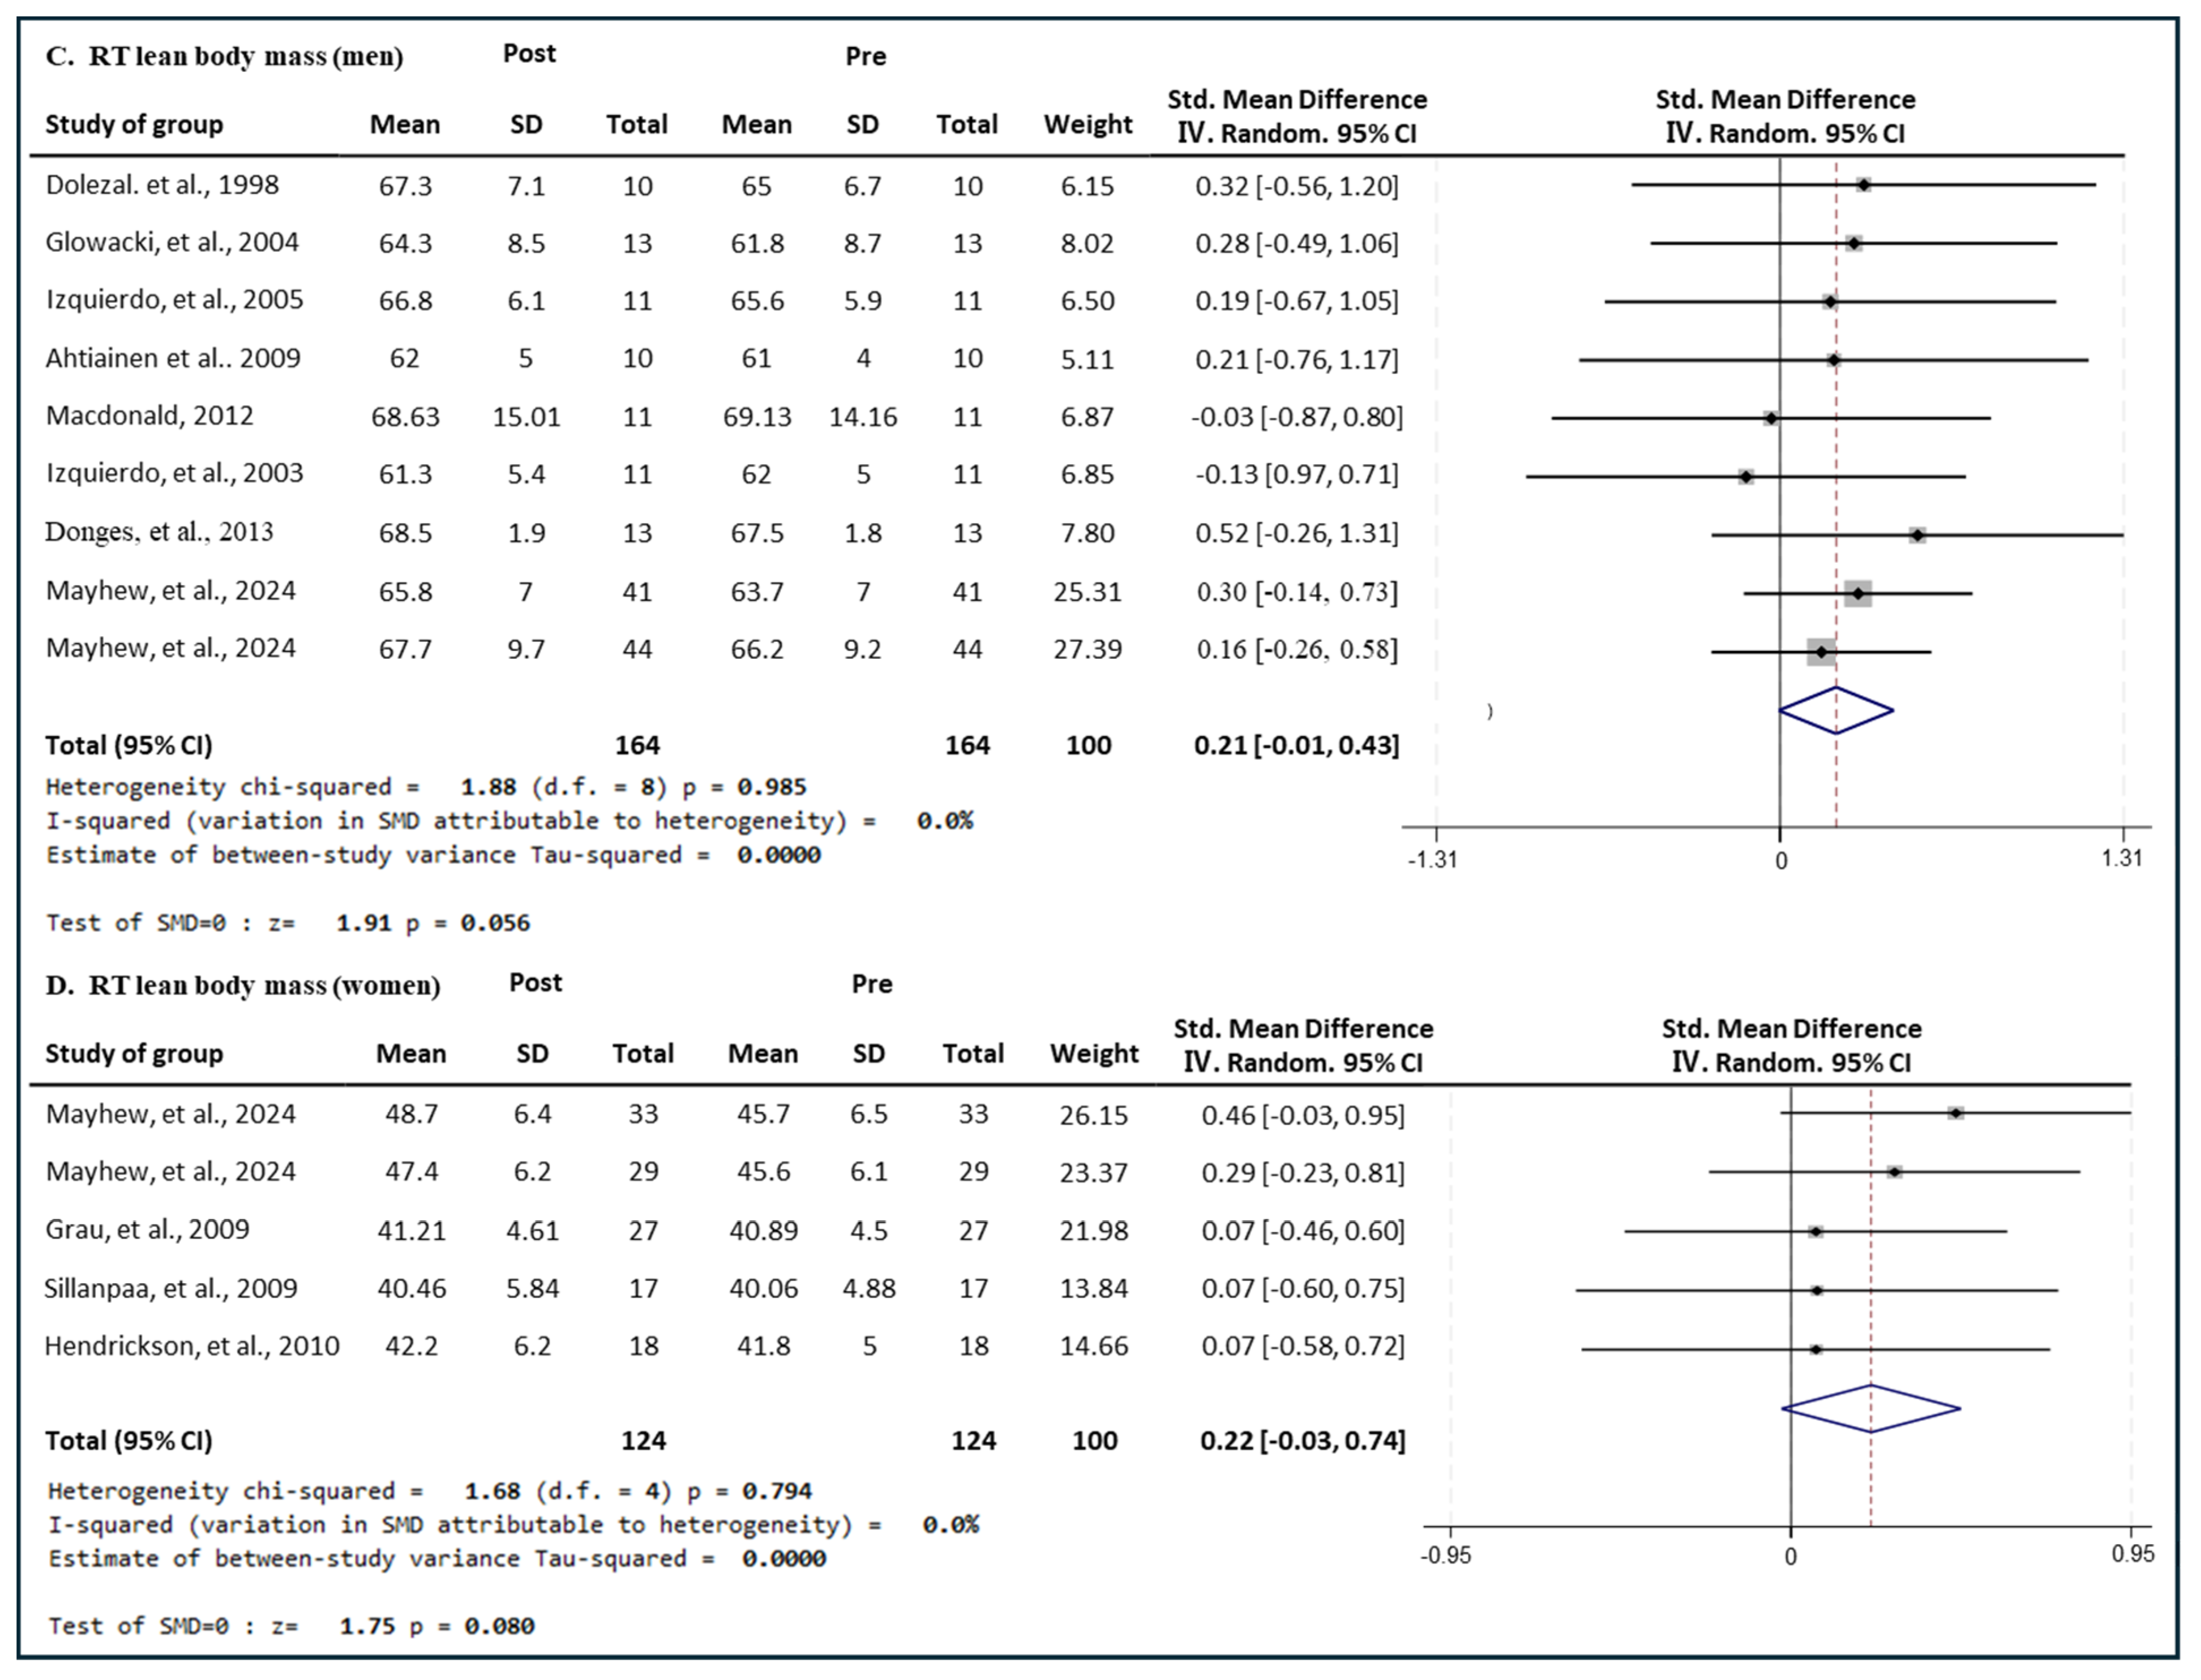
3.6. Effect of Exercise Type on Lean Body Mass in Men and Women
3.6.1. Effect of CT
3.6.2. Effect of RT
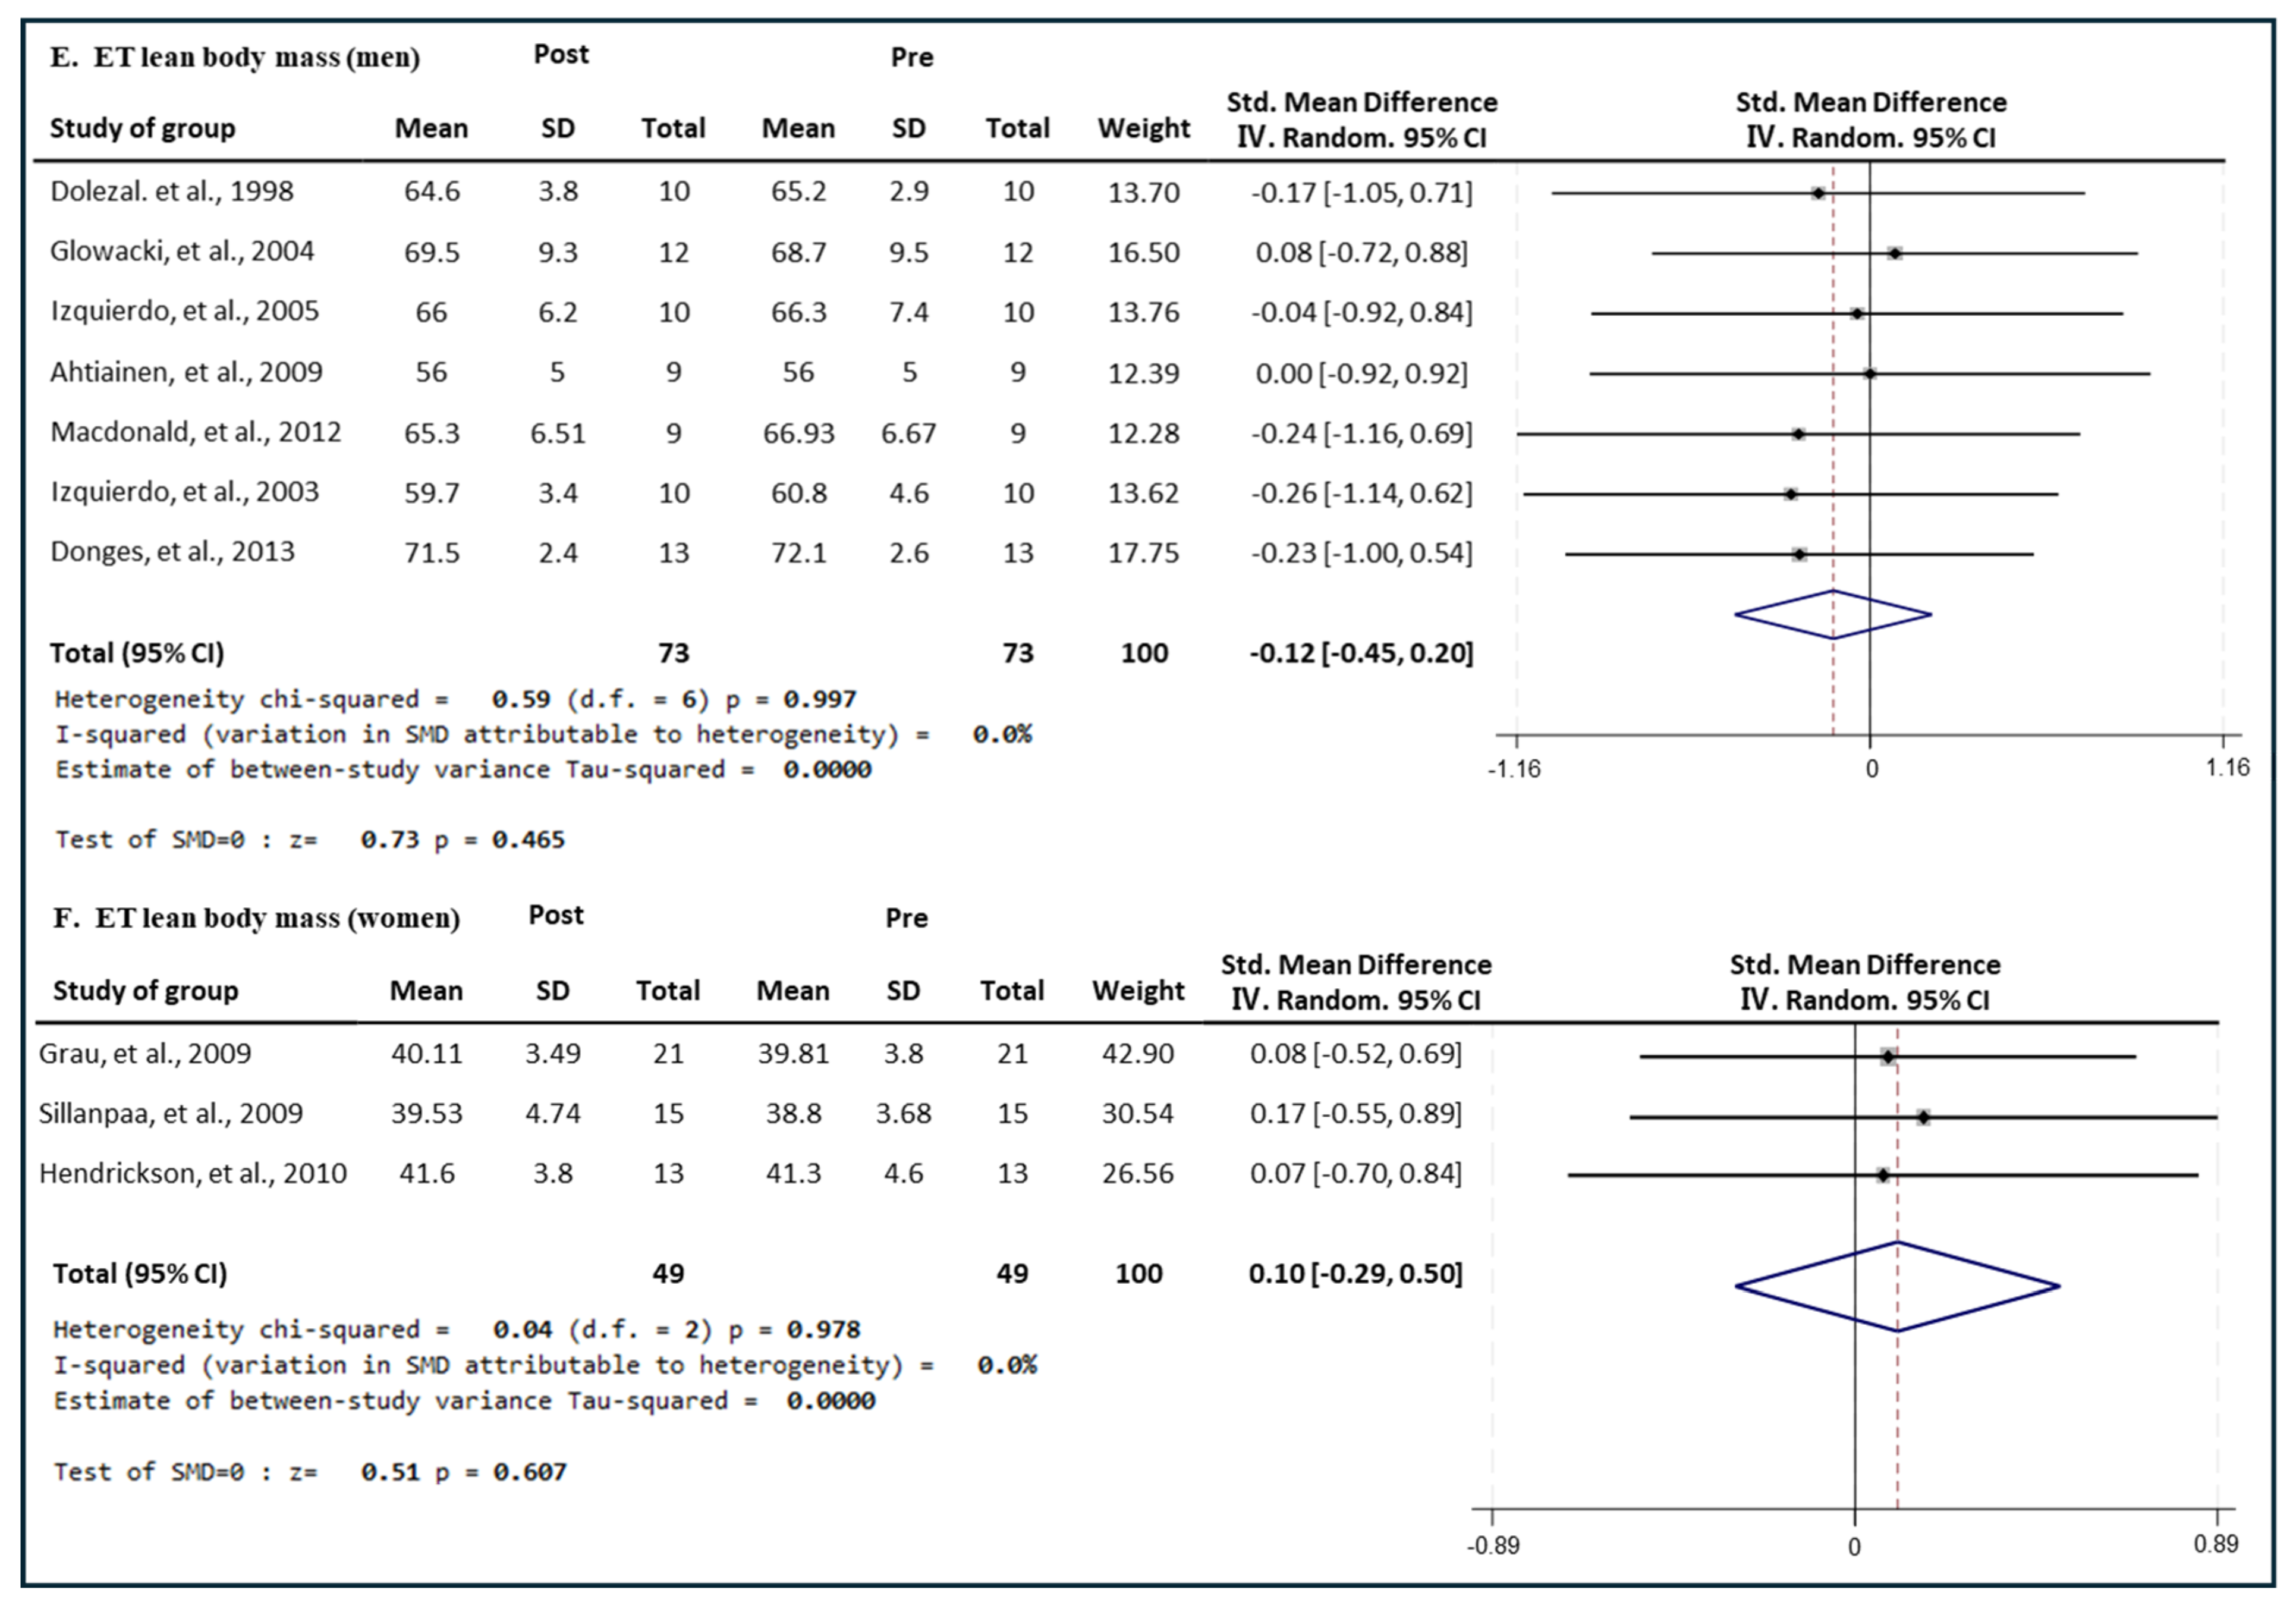
3.6.3. Effect of ET
3.7. Effect of Exercise Type on Fat Mass in Men and Women
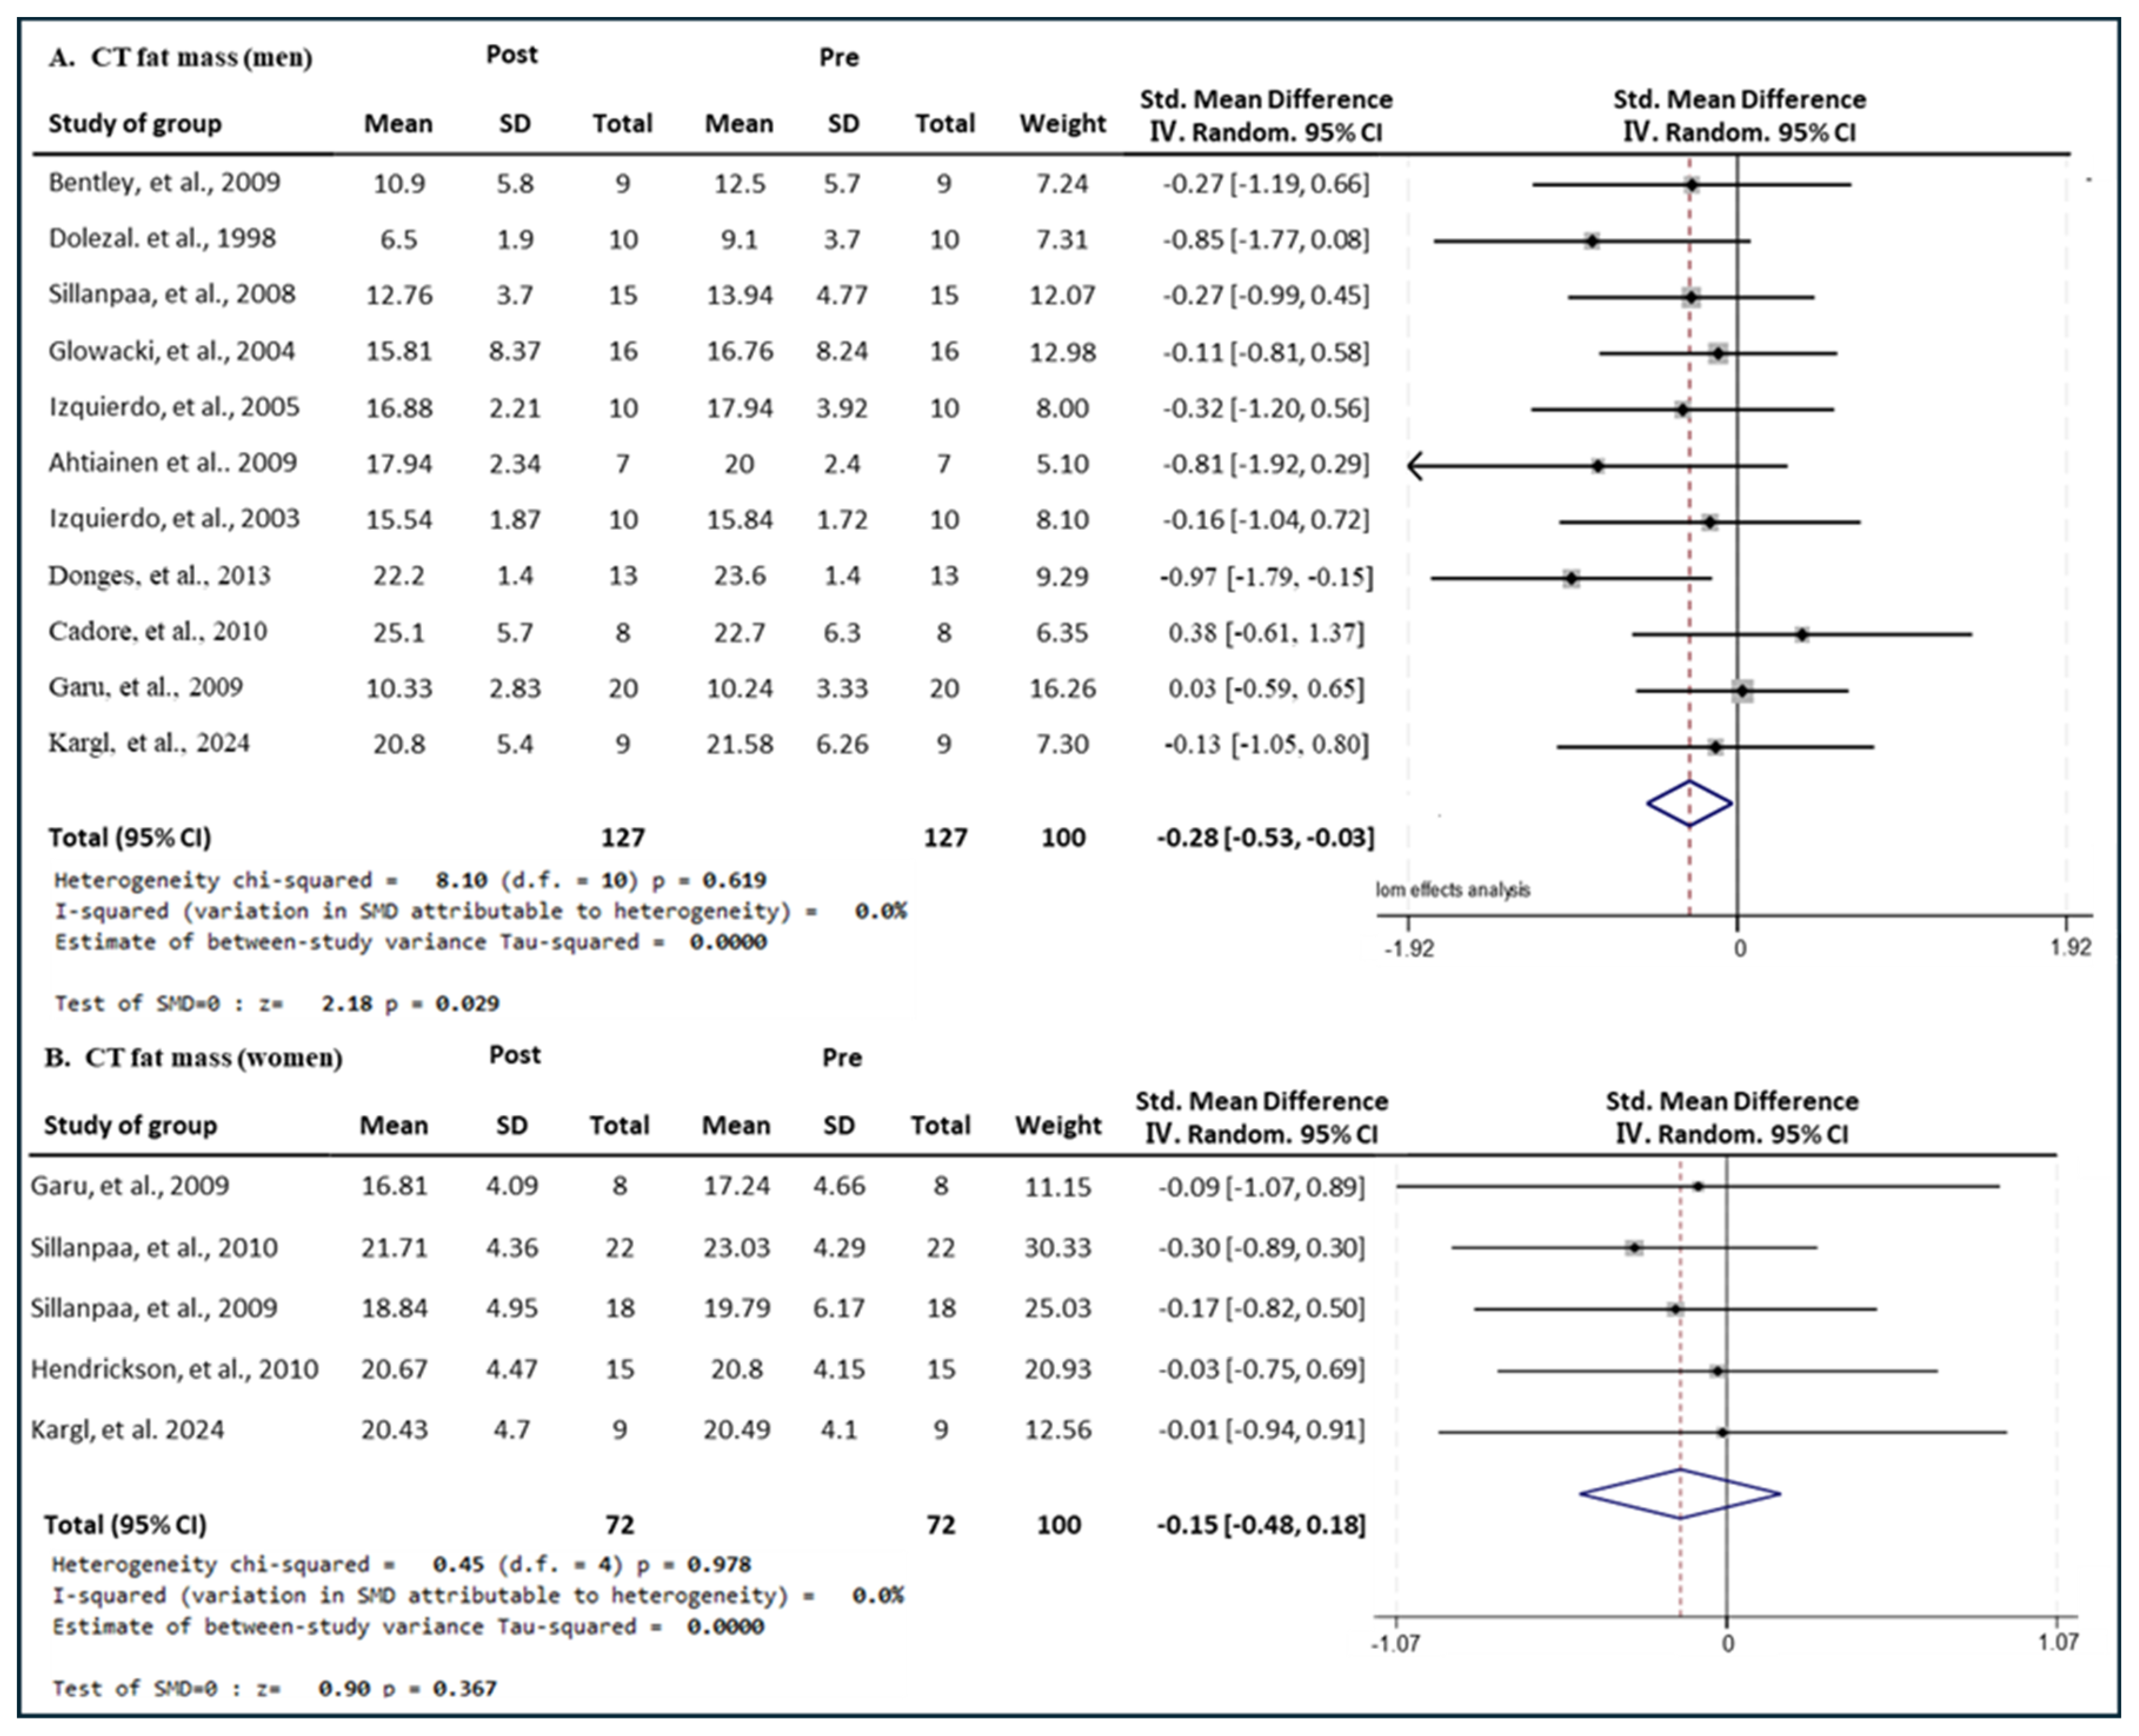
3.7.1. Effect of CT
3.7.2. Effect of RT
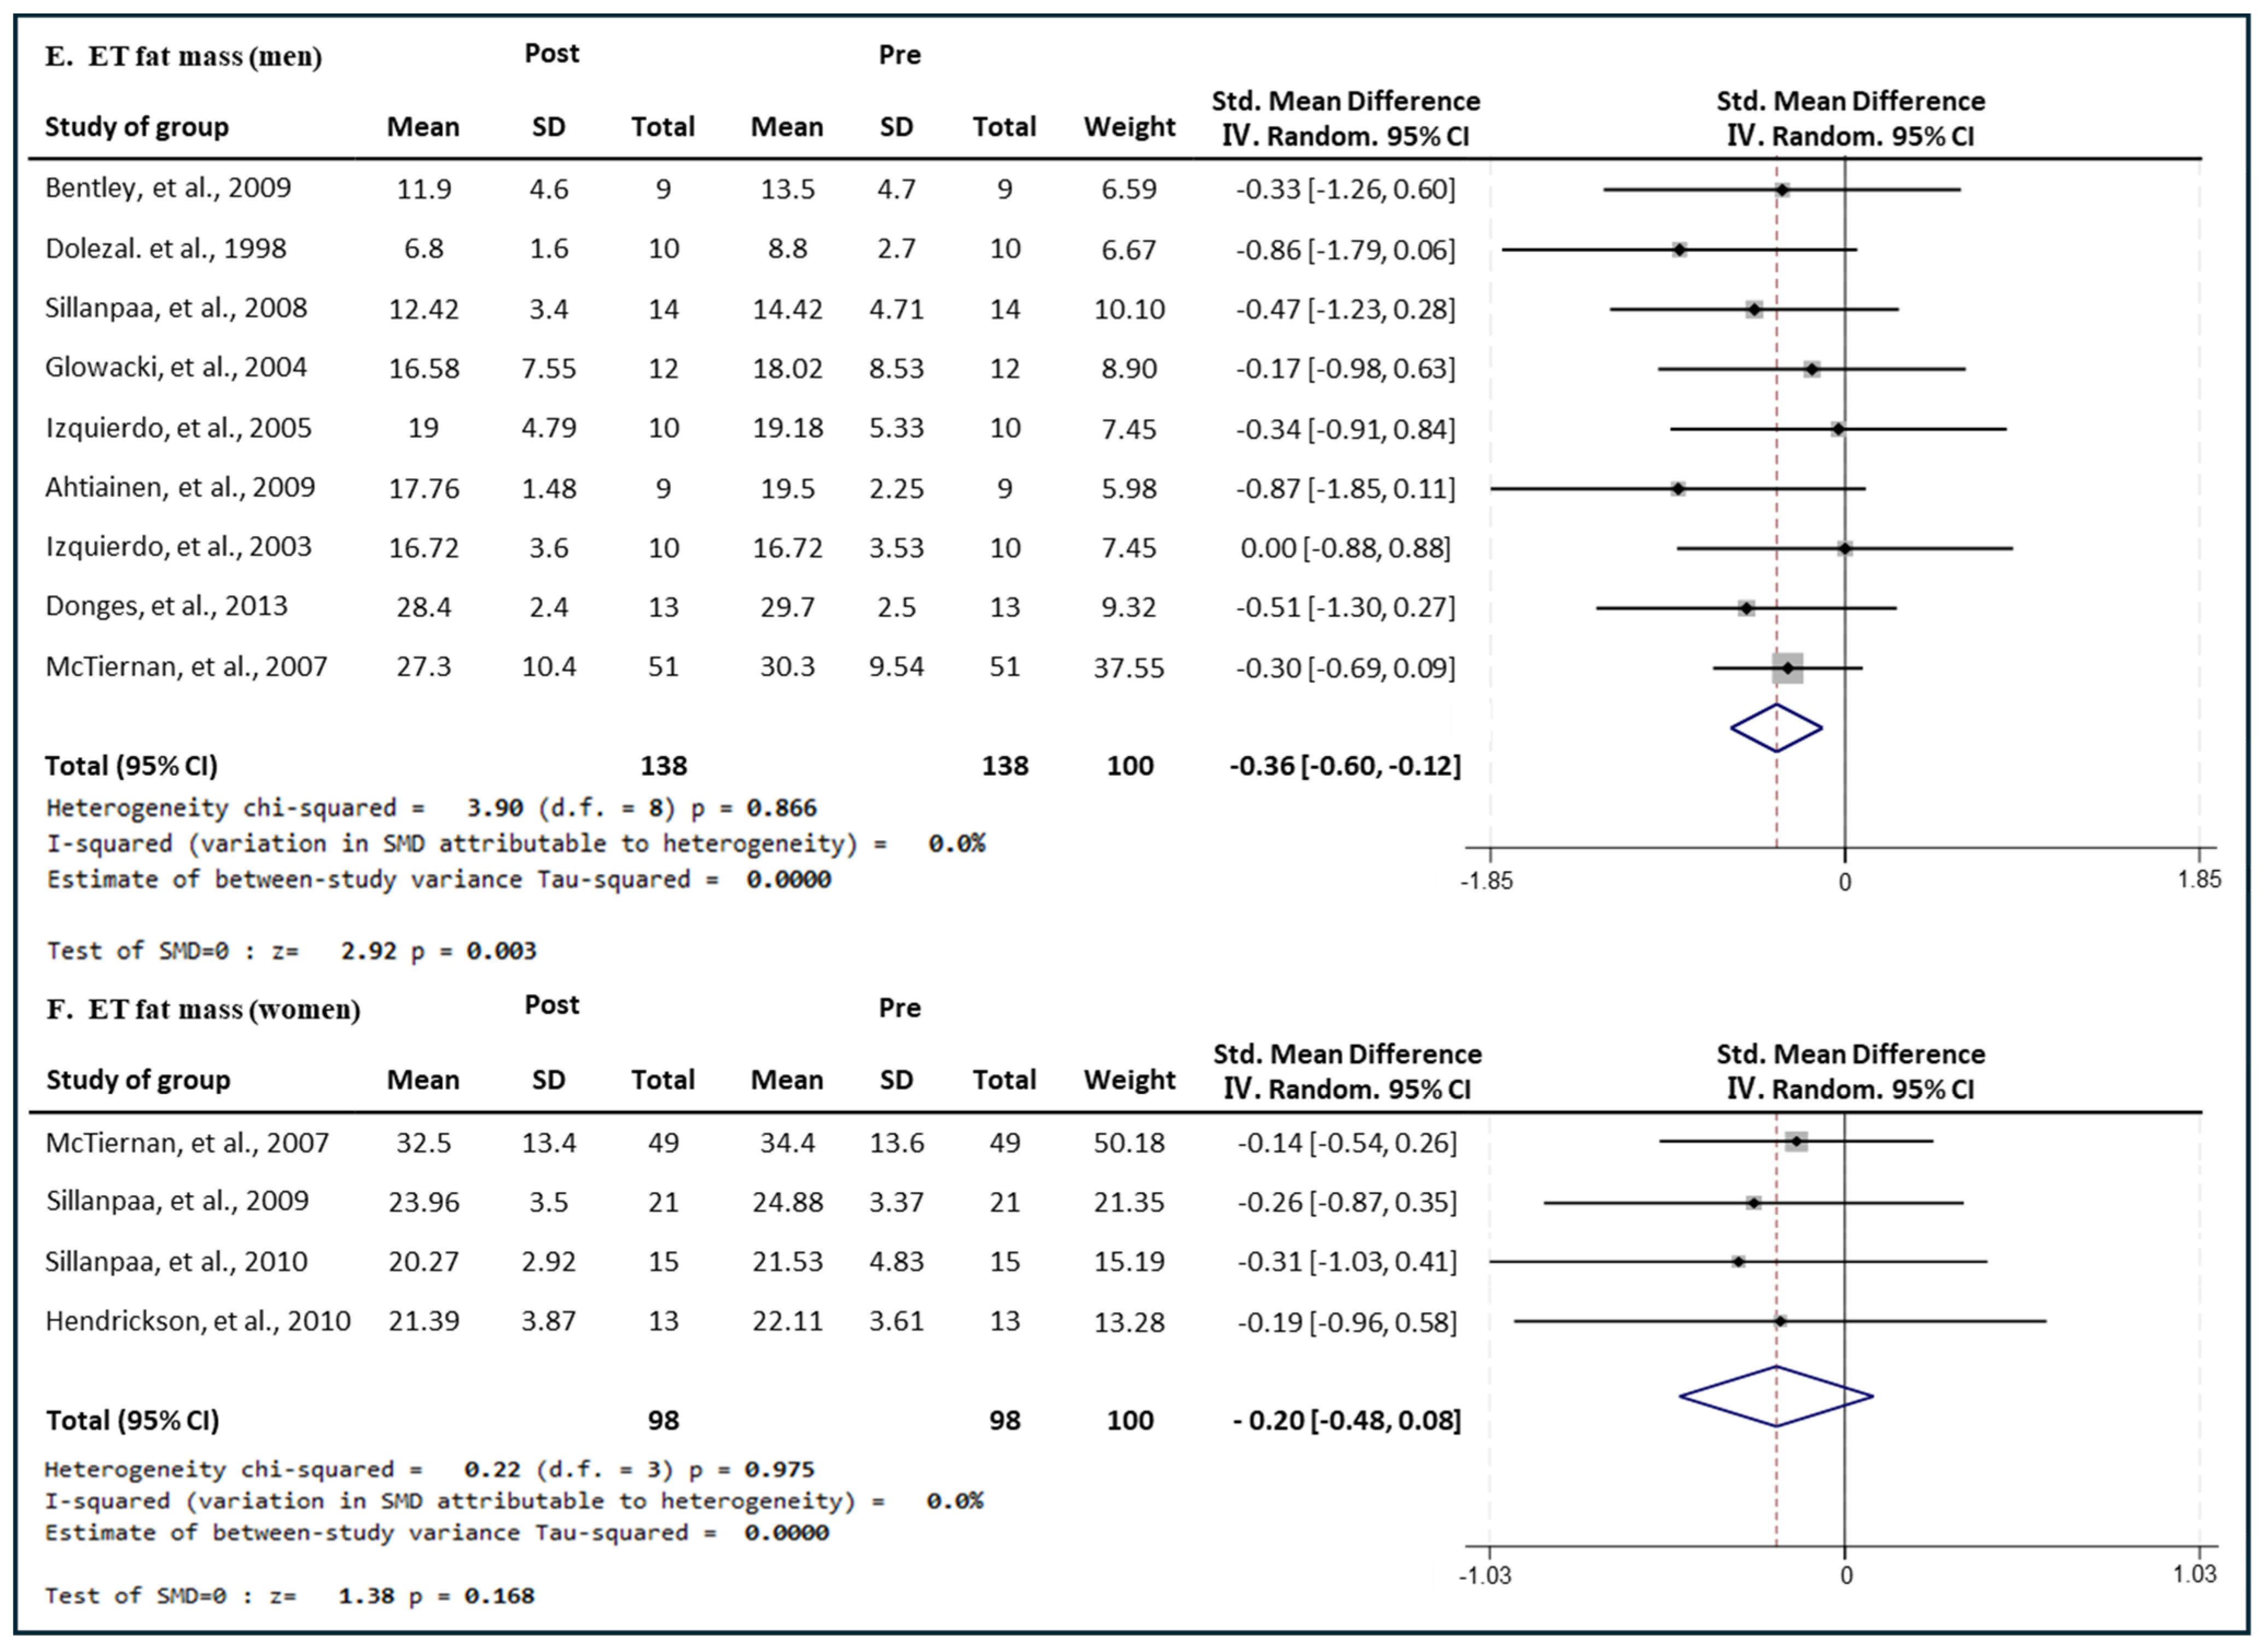
3.7.3. Effect of ET
4. Discussion
5. Conclusions
Author Contributions
Funding
Institutional Review Board Statement
Informed Consent Statement
Data Availability Statement
Conflicts of Interest
Abbreviations
References
- García-Hermoso, A.; Ramirez-Vélez, R.; Sáez De Asteasu, M.L.; Martínez-Velilla, N.; Zambom-Ferraresi, F.; Valenzuela, P.L.; Lucia, A.; Izquierdo, M. Safety and effectiveness of long-term exercise interventions in older adults: A systematic review and meta-analysis of randomized controlled trials. Sports Med. 2020, 50, 1095–1106. [Google Scholar] [CrossRef] [PubMed]
- Cruz-Jentoft, A.J.; Landi, F.; Schneider, S.M.; Zuniga, C.; Arai, H.; Boirie, Y.; Cederholm, T. Prevalence of and interventions for sarcopenia in ageing adults: A systematic review. Report of the International Sarcopenia Initiative (EWGSOP and IWGS). Age Ageing 2014, 43, 748–759. [Google Scholar] [CrossRef] [PubMed]
- Morley, J.E.; Anker, S.D.; von Haehling, S. Prevalence, incidence, and clinical impact of sarcopenia: Facts, numbers, and epidemiology-update 2014. J. Cachexia Sarcopenia Muscle 2014, 5, 253–259. [Google Scholar] [CrossRef] [PubMed]
- Doherty, T.J. Invited Review: Aging and sarcopenia. J. Appl. Physiol. 2003, 95, 1717–1727. [Google Scholar] [CrossRef]
- Church, T.S.; Blair, S.N.; Cocreham, S.; Johannsen, N.; Johnson, W.; Kramer, K.; Mikus, C.R.; Myers, V.; Nauta, M.; Rodarte, R.Q.; et al. Effects of aerobic and resistance training on hemoglobin a1c levels in patients with type 2 diabetes. JAMA 2010, 304, 2253–2262. [Google Scholar] [CrossRef] [PubMed]
- World Health Organization. World Health Statistics 2024: Monitoring Health for the SDGs, Sustainable Development Goals. Available online: https://www.who.int/data/gho/publications/world-health-statistics (accessed on 17 July 2024).
- European Society of Hypertension-European Society of Cardiology Guidelines Committee. 2003 European Society of Hypertension-European Society of Cardiology guidelines or the management of arterial hypertension. J. Hypertens. 2003, 21, 1011–1053. [Google Scholar] [CrossRef]
- Montero-Fernandez, N.; Serra-Rexach, J.A. Role of exercise on sarcopenia in the elderly. Eur. J. Phys. Rehabil. Med. 2013, 49, 131–143. [Google Scholar]
- Evans, W.J. Protein nutrition, exercise and aging. J. Am. Coll. Nutr. 2004, 23, 601S–609S. [Google Scholar] [CrossRef]
- Juha, P.A.; Simon, W.; Heikki, P.; Jarkko, H.; Elina, S.; Laura, K.; Janne, S.; Jussi, M.; Heli, V.; Antti, M.; et al. Heterogeneity in resistance traininginduced muscle strength and mass responses in men and women of different ages. Age 2016, 38, 10. [Google Scholar]
- Timpka, S.; Petersson, I.F.; Zhou, C.; Englund, M. Muscle strength in adolescent men and risk of cardiovascular disease events and mortality in middle age: A prospective cohort study. BMC Med. 2014, 12, 62. [Google Scholar] [CrossRef]
- Burgomaster, K.A.; Howarth, K.R.; Phillips, S.M.; Rakobowchuk, M.; Macdonald, M.J.; McGee, S.L.; Gibala, M.J. Similar metabolic adaptations during exercise after low volume sprint interval and traditional endurance training in humans. J. Physiol. 2008, 586, 151–160. [Google Scholar] [CrossRef]
- Kryger, A.I.; Andersen, J.L. Resistance training in the oldest old: Consequences for muscle strength, fiber types, fiber size, and MHC isoforms. Scand. J. Med. Sci. Sports 2007, 17, 422–430. [Google Scholar] [CrossRef]
- Staron, R.S.; Hikida, R.S.; Hagerman, F.C.; Dudley, G.A.; Murray, T.F. Human skeletal muscle fiber type adaptability to various workloads. J. Histochem. Cytochem. 1984, 32, 146–152. [Google Scholar] [CrossRef]
- Kraemer, W.J.; Patton, J.F.; Gordon, S.E.; Harman, E.A.; Deschenes, M.R.; Reynolds, K.; Newton, R.U.; Triplett, N.T.; Dziados, J.E. Compatibility of high-intensity strength and endurance training on hormonal and skeletal muscle adaptations. J. Appl. Physiol. 1995, 78, 976–989. [Google Scholar] [CrossRef] [PubMed]
- Karavirta, L.; Häkkinen, A.; Sillanpää, E.; García-López, D.; Kauhanen, A.; Haapasaari, A.; Alen, M.; Pakarinen, A.; Kraemer, W.J.; Izquierdo, M.; et al. Effects of combined endurance and strength training on muscle strength, power and hypertrophy in 40-67-year-old men. Scand. J. Med. Sci. Sports 2011, 21, 402–411. [Google Scholar] [CrossRef] [PubMed]
- Hakkinen, K.; Alen, M.; Kraemer, W.J.; Gorostiaga, E.; Izquierdo, M.; Rusko, H.; Mikkloa, J.; Hakkinen, A.; Valkeinen, H.; Kaarakainen, E.; et al. Neuromuscular adaptations during concurrent strength and endurance training versus strength training. Eur. J. Appl. Physiol. 2003, 89, 42–52. [Google Scholar] [CrossRef]
- Izquierdo, M.; Hakkinen, K.; Ibanez, J.; Kraemer, W.J.; Gorostiaga, E.M. Effects of combined resistance and cardiovascular training on strength, power, muscle cross-sectional area, and endurance markers in middle-aged men. Eur. J. Appl. Physiol. 2005, 94, 70–75. [Google Scholar] [CrossRef]
- Dudley, G.A.; Djamil, R. Incompatibility of endurance-and strengthtraining modes of exercise. J. Appl. Physiol. 1985, 59, 1446–1451. [Google Scholar] [CrossRef] [PubMed]
- Gallagher, D.; Visser, M.; De Meersman, R.E.; Sepulveda, D.; Pierson, R.N.; Harris, T.; Heymsfield, S.B. Appendicular skeletal muscle mass: Effects of age, gender, and ethnicity. J. Appl. Physiol. 1997, 83, 229–239. [Google Scholar] [CrossRef]
- Senior, H.E.; Henwood, T.R.; Beller, E.M.; Geoffrey, K.M.; Justin, W.L. Prevalence and risk factors of sarcopenia among adults living in nursing homes. Maturitas 2015, 82, 418–423. [Google Scholar] [CrossRef]
- Ishii, S.; Tanaka, T.; Shibasaki, K.; Yasutoshi, O.; Takeshi, K.; Higashiguchi, T.; Obuchi, S.P.; Ishikawa-Takata, K.; Hirano, H.; Kawai, H.; et al. Development of a simple screening test for sarcopenia in older adults. Geriatr. Gerontol. Int. 2010, 14 (Suppl. S1), 93–101. [Google Scholar] [CrossRef]
- Tipton, K.D. Gender differences in protein metabolism. Curr. Opin. Clin. Nutr. Metab. Care 2001, 4, 493–498. [Google Scholar] [CrossRef]
- Tay, L.; Ding, Y.Y.; Leung, B.P.; Ismail, N.H.; Yeo, A.; Yew, S.; Tay, K.S.; Tan, C.H.; Chong, M.S. Sex-specific differences in risk factors for sarcopenia amongst community-dwelling older adults. Age 2015, 37, 121. [Google Scholar] [CrossRef]
- Page, M.J.; McKenzie, J.E.; Bossuyt, P.M.; Boutron, I.; Hoffmann, T.C.; Mulrow, C.D. The PRISMA 2020 statement: An updated guideline for reporting systematic reviews Systematic reviews and Meta-Analyses. BMJ 2021, 372, 71. [Google Scholar] [CrossRef]
- Kim, S.Y.; Park, J.E.; Seo, H.J.; Lee, Y.J.; Jang, B.H.; Son, H.J.; Shin, C.M. NECA’s Guidance for Undertaking Systematic Reviews and Meta-Analyses for Intervention; National Evidence-based Healthcare Collaborating Agency, NECA: Seoul, Republic of Korea, 2011. [Google Scholar]
- Moher, D.; Liberati, A.; Tetzlaff, J.; Altman, D.G.; PRISMA Group. Preferred reporting items for systematic reviews and meta-analyses: The PRISMA statement. PLoS Med. 2009, 6, e1000097. [Google Scholar] [CrossRef] [PubMed]
- Higgins, J.P.T.; Green, S. Cochrane Handbook for Systematic Reviews of Interventions Version 5.1.0. The Cochrane Collaboration. 2010. Available online: www.cochrane-handbook.org (accessed on 1 April 2024).
- Cohen, J. Statistical Power Analysis for the Behavioral Sciences, 2nd ed.; Routledge: New York, NY, USA, 1998. [Google Scholar]
- Ahtiainen, J.P.; Hulmi, J.J.; Kraemer, Y.J.; Lehti, M.; Pakarinen, A.; Mero, A.A.; Karavirta, L.; Sillanpää, E.; Selänne, H.; Alen, M.; et al. Strength, Endurance or Combined Training Elicit Diverse Skeletal Muscle Myosin Heavy Chain Isoform Proportion but Unaltered Androgen Receptor Concentration in Older Men. Int. J. Sports Med. 2009, 30, 879–887. [Google Scholar] [CrossRef]
- Dolezal, B.A.; Potteiger, J.A. Concurrent resistance and endurance training influence basal metabolic rate in nondieting individuals. J. Appl. Physiol. 1985, 5, 695–700. [Google Scholar] [CrossRef]
- de Souza, E.O.; Tricoli, V.; Roschel, H.; Brum, P.C.; Bacurau, A.V.N.; Ferreira, J.C.B.; Aoki, M.S.; Neves Jr, M.; Aihara, A.Y.; Fernandes, A.D.R.C.; et al. Molecular adaptations to concurrent training. Int. J. Sports Med. 2013, 34, 207–213. [Google Scholar] [CrossRef] [PubMed]
- Glowacki, S.P.; Martin, S.E.; Maurer, A.; Baek, W.; Green, J.S.; Crouse, S.F. Effects of resistance, endurance, and concurrent exercise on training outcomes in men. Med. Sci. Sports Exerc. 2004, 36, 2119–2127. [Google Scholar] [CrossRef]
- Cadore, E.L.; Pinto, R.S.; Lhullier, F.L.R.; Correa, C.S.; Alberton, C.L.; Pinto, S.S.; Almeida, A.P.V.; Tartaruga, M.P.; Silva, E.M.; Kruel, L.F.M. Affiliations expand. Physiological Eff ects of Concurrent Training in Elderly Men. Int. J. Sports Med. 2010, 31, 689–697. [Google Scholar] [CrossRef]
- Donges, C.E.; Duffield, R.; Guelfi, K.J.; Smith, G.C.; Adams, D.R.; Edge, J.A. Comparative effects of single-mode vs. duration-matched concurrent exercise training on body composition, low-grade inflammation, and glucose regulation in sedentary, overweight, middle-aged men. Appl. Physiol. Nutr. Metab. 2013, 38, 779–788. [Google Scholar] [CrossRef] [PubMed]
- Bentley, D.J.; Ghahramanloo, E.; Midgley, A.W. The effect of concurrent training on blood lipid profile and anthropometrical characteristics of previously untrained men. J. Phys. Act. Health 2009, 6, 760–766. [Google Scholar]
- Azizbeigi, K.; Stannard, S.R.; Atashak, S.; Haghighi, M.M. Antioxidant enzymes and oxidative stress adaptation to exercise training: Comparison of endurance, resistance, and concurrent training in untrained males. J. Exerc. Sci. Fit. 2014, 12, 1–6. [Google Scholar] [CrossRef]
- MacDonald, C.J.; Lamont, H.S.; Garner, J.C. A comparison of the effects of 6 weeks of traditional resistance training, plyometric training, and complex training on measures of strength and anthropometrics. J. Strength Cond. Res. 2012, 26, 422–431. [Google Scholar] [CrossRef] [PubMed]
- Izquierdo, M.; Ibañez, J.; Hakkinen, K.; Kraemer, W.J.; Larrión, J.L.; Gorostiaga, E.M. Once weekly combined resistance and cardiovascular training in healthy older men. Med. Sci. Sports Exerc. 2003, 36, 435–443. [Google Scholar] [CrossRef] [PubMed]
- Kell, R.T. The influence of periodized resistance training on strength changes in men and women. J. Strength Cond. Res. 2011, 25, 735–744. [Google Scholar] [CrossRef] [PubMed]
- Haykowsky, M.; McGavock, J.; Muhll, I.V.; Koller, M.; Mandic, S.; Welsh, R.; Taylor, D. Effect of exercise training on peak aerobic power, left ventricular morphology, and muscle strength in healthy older women. J. Gerontol. A Biol. Sci. Med. Sci. 2005, 60, 307–311. [Google Scholar] [CrossRef] [PubMed]
- Mayhew, J.L.; Brechue, W.F.; Smith, A.E.; Kemmler, W.; Lauber, D.; Koch, A.J. Impact of testing strategy on expression of upper-body work capacity and one-repetition maximum prediction after resistance training in college-aged men and women. J. Strength Cond. Res. 2011, 25, 2796–2807. [Google Scholar] [CrossRef] [PubMed]
- McTiernan, A.; Sorensen, B.; Irwin, M.L.; Morgan, A.; Yasui, Y.; Rudolph, R.E.; Surawicz, C.; Lampe, J.W.; Lampe, P.D.; Ayub, K.; et al. Exercise effect on weight and body fat in men and women. Obesity 2007, 15, 1496–1512. [Google Scholar] [CrossRef]
- Grau, G.; Perez-Gomez, J.; Olmedillas, H.; Chavarren, J.; Dorado, C.; Santana, A.; Serrano-Sanchez, J.A.; Calbet, J.A.L. Strength training combined with plyometric jumps in adults: Sex differences in fat-bone axis adaptations. J. Appl. Physiol. (1985) 2009, 106, 1100–1111. [Google Scholar] [CrossRef]
- Sillanpää, E.; Häkkinen, A.; Laaksonen, D.E.; Karavirta, L.; Kraemer, W.J.; Häkkinen, K. Serum basal hormone concentrations, nutrition and physical fitness during strength and/or endurance training in 39–64-year-old women. Int. J. Sports Med. 2010, 31, 110–117. [Google Scholar] [CrossRef] [PubMed]
- Hendrickson, N.R.; Sharp, M.A.; Alemany, J.A.; Walker, L.A.; Harman, E.A.; Spiering, B.A.; Hatfield, D.L.; Yamamoto, L.M.; Maresh, C.M.; Kraemer, W.J.; et al. Combined resistance and endurance training improves physical capacity and performance on tactical occupational tasks. Eur. J. Appl. Physiol. 2010, 109, 1197–1208. [Google Scholar] [CrossRef] [PubMed]
- Bell, G.J.; Syrotuik, D.; Martin, T.P.; Burnham, R.; Quinney, H.A. Effect of concurrent strength and endurance training on skeletal muscle properties and hormone concentrations in humans. Eur. J. Appl. Physiol. 2000, 81, 418–427. [Google Scholar] [CrossRef] [PubMed]
- Taipale, R.S.; Forssell, J.; Ihalainen, J.K.; Kyröläinen, H.; Häkkinen, K. A 10-week block of combined high-intensity endurance and strength training produced similar changes in dynamic strength, body composition, and serum hormones in women and men. Front. Sports Act. Living 2020, 30, 581305. [Google Scholar] [CrossRef] [PubMed]
- Kargl, C.K.; Sterczala, A.J.; Santucci, D.; Conkright, W.R.; Krajewski, K.T.; Martin, B.J.; Greeves, J.P.; O’Leary, T.J.; Wardle, S.L.; Sahu, A.; et al. Circulating extracellular vesicle characteristics differ between men and women following 12 weeks of concurrent exercise training. Physiol. Rep. 2021, 12, e16016. [Google Scholar] [CrossRef] [PubMed]
- Sillanpää, E.; Laaksonen, D.E.; Häkkinen, A.; Karavirta, L.; Jensen, B.; Kraemer, W.J.; Nyman, K.; Häkkinen, K. Body composition, fitness, and metabolic health during strength and endurance training and their combination in middle-aged and older women. Eur. J. Appl. Physiol. 2009, 106, 285–296. [Google Scholar] [CrossRef] [PubMed]
- Gergley, J.C. Comparison of two lower-body modes of endurance training on lower-body strength development while concurrently training. J. Strength. Cond. Res. 2009, 23, 979–987. [Google Scholar] [CrossRef] [PubMed]
- Sillanpää, E.; Häkkinen, A.; Nyman, K.; Mattila, M.; Cheng, S.; Karavirta, L.; Laaksonen, D.E.; Huuhka, N.; Kraemer, W.J.; Häkkinen, K. Body composition and fitness during strength and/or endurance training in older men. Med. Sci. Sports Exerc. 2008, 40, 950–958. [Google Scholar] [CrossRef]
- Bondarev, D.; Laakkonen, E.K.; Finni, T.; Kokko, K.; Kujala, U.M.; Aukee, P.; Kovanen, V.; Sipilä, S. Physical performance in relation to menopause status and physical activity. Menopause 2018, 25, 1432–1441. [Google Scholar] [CrossRef]
- Maltais, M.L.; Desroches, J.; Dionne, I.J. Changes in muscle mass and strength after menopause. J. Musculoskelet. Neuronal Interact. 2009, 9, 186–197. [Google Scholar]
- Noh, K.W.; Sok, P. Effects of resistance exercise on older individuals with sarcopenia: Sex differences in humans. Exerc. Sci. 2023, 32, 1–11. [Google Scholar] [CrossRef]
- Donnelly, J.E.; Hill, J.O.; Jacobsen, D.J.; Potteiger, J.; Sullivan, D.K.; Johnson, S.L.; Heelan, K.; Hise, M.; Fennessey, P.V.; Sonko, B.; et al. Effects of a 16-month randomized controlled exercise trial on body weight and composition in young, overweight men and women: The midwest exercise trial. Arch. Intern. Med. 2003, 163, 1343–1350. [Google Scholar] [CrossRef]
- Cheng, R.; Maloney, A.; Moran, J.; Newman, T.H.; Gardner, E.C. Resistance training as treatment for sarcopenia: Examining sex-related differences in physiology and response. Clin. Ther. 2022, 44, 33–40. [Google Scholar] [CrossRef] [PubMed]
- Welle, S.; Tawil, R.; Thornton, C.A. Sex-related differences in gene expression in human skeletal muscle. PLoS ONE 2008, 3, e1385. [Google Scholar] [CrossRef] [PubMed]
- Cantrell, G.S.; Schilling, B.K.; Paquette, M.R.; Murlasits, Z. Maximal strength, power, and aerobic endurance adaptations to concurrent strength and sprint interval training. Eur. J. Appl. Physiol. 2014, 114, 763–771. [Google Scholar] [CrossRef]
- Cadore, E.L.; Izquierdo, M. How to combine strength and endurance training to maximize performance: A review. Scand. J. Med. Sci. Sports 2013, 23, 513–527. [Google Scholar]
- Wilson, J.M.; Marin, P.J.; Rhea, M.R.; Wilson, S.M.C.; Loenneke, J.P.; Anderson, J.C. Concurrent training: A meta-analysis examining interference of aerobic and resistance exercises. J. Strength. Cond. Res. 2012, 26, 2293–2307. [Google Scholar] [CrossRef] [PubMed]
- Schumann, M.; Küüsmaa, M.; Newton, R.U.; Sirparanta, A.I.; Syväoja, H.; Häkkinen, A.; Häkkinen, K. Fitness and lean mass increases during combined training independent of loading order. Med. Sci. Sports Exerc. 2014, 46, 1758–1768. [Google Scholar] [CrossRef]
- Charette, S.L.; McEvoy, L.; Pyka, G.; Snow-Harter, C.; Guido, D.; Wiswell, R.A.; Marcus, R. Muscle hypertrophy response to resistance training in older women. J. Appl. Physiol. 1991, 70, 1912–1916. [Google Scholar] [CrossRef]
- Paul, A.; Kevin, T.; Kirsty, M.H.; Sandra, K.H.; Glyn, H.; Goodall, S. Physiological sex differences affect the integrative response to exercise: Acute and chronic implications. Exp. Physiol. 2020, 105, 20072021. [Google Scholar]
- Smith, G.I.; Reeds, D.N.; Hall, A.M.; Chambers, K.T.; Finck, B.N.; Mittendorfer, B. Sexually dimorphic effect of aging on skeletal muscle protein synthesis. Biol. Sex Differ. 2012, 3, 11. [Google Scholar] [CrossRef] [PubMed]
- Aagaard, P.; Simonsen, E.B.; Andersen, J.L.; Magnusson, P.; Dyhre-Poulsen, P. Increased rate of force development and neural drive of human skeletal muscle following resistance training. J. Appl. Physiol. 2020, 93, 1318–1326. [Google Scholar] [CrossRef]
- Balabinis, C.P.; Psarakis, C.H.; Moukas, M.; Vassiliou, M.P.; Behrakis, P.K. Early phase changes by concurrent endurance and strength training. J. Strength Cond. Res. 2003, 17, 393–401. [Google Scholar] [CrossRef]
- Eklund, D.; Häkkinen, A.; Laukkanen, J.A.; Balandzic, M.; Nyman, K.; Häkkinen, K. Fitness, body composition and blood lipids following 3 concurrent strength and endurance training modes. Appl. Physiol. Nutr. Metab. 2016, 41, 767–774. [Google Scholar] [CrossRef]
- Lee, J.S.; Kim, C.G.; Seo, T.B.; Kim, H.G.; Yoon, S.J. Effects of 8-week combined training on body composition, isokinetic strength, and cardiovascular disease risk factors in older women. Aging Clin. Exp. Res. 2015, 27, 179–186. [Google Scholar] [CrossRef]
- Kelly, C.M.; Burnett, A.F.; Newton, M.J. The effect of strength training on three-kilometer performance in recreational women endurance runners. J. Strength Cond. Res. 2008, 22, 396–403. [Google Scholar] [CrossRef]
- Donnelly, J.E.; Honas, J.; Smith, B.K.; Mayo, M.S.; Gibson, C.A.; Sullivan, D.K.; Lee, J.H.; Herrmann, S.D.; Lambourne, K.; Washburn, R.A. Aerobic exercise alone results in clinically significant weight loss for men and women: Midwest exercise trial 2. Obesity 2013, 21, E219–E228. [Google Scholar] [CrossRef]
- Tobin, S.Y.; Cornier, M.A.; White, M.H.; Hild, A.K.; Simonsen, S.E.; Melanson, E.L.; Halliday, T.M. The effects of acute exercise on appetite and energy intake in men and women. Physiol. Behav. 2021, 241, 113562. [Google Scholar] [CrossRef]
- Horber, F.F.; Gruber, B.; Thomi, F.; Jensen, E.X.; Jaeger, P. Effect of sex and age on bone mass, body composition and fuel metabolism in humans. Nutrition 1997, 13, 524–534. [Google Scholar] [CrossRef]
- Lebeck, J.; Østergård, T.; Rojek, A.; Füchtbauer, E.M.; Lund, S.; Nielsen, S.; Praetorius, J. Genderspecific effect of physical training on AQP7 protein expression in human adipose tissue. Acta Diabetol. 2012, 49, S215–S226. [Google Scholar] [CrossRef]
- Nagareddy, P.R.; Kraakman, M.; Masters, S.L.; Stirzaker, R.A.; Gorman, D.J.; Grant, R.W.; Dragoljevic, D.; Hong, E.S.; AbdelLatif, A.; Smyth, S.S.; et al. Adipose tissue macrophages promote myelopoiesis and monocytosis in obesity. Cell Metab. 2014, 19, 821–835. [Google Scholar] [CrossRef] [PubMed]


| Study | Study Population | Groups | Sex | Age | N | Exercise Intervention | Outcome | |
|---|---|---|---|---|---|---|---|---|
| Exercise Program | Frequency × Duration | |||||||
| Ahtiainen et al., 2009 [30] | Middle aged men | ET | Men | 58 | 9 | Used to bicycle ergometer and HR, 45–90 min, progressive overload | 2 days/week × 21 weeks | LP, LBM, FM |
| RT | 61 | 10 | 1 RM 40–90%, 6–30 reps/set, progressive overload | |||||
| CT | 64 | 7 | ET + RT concurrent training | 4 days/week × 21 weeks | ||||
| Dolezal et al., 1998 [31] | Young aged men | ET | Men | 20.1 | 10 | Used to treadmill, intensity of HRmax 65~85%. Progressive overload | 3 days/week × 10 weeks | LP, BP, LBM, FM |
| RT | 10 | 4–15 reps/set, 3 sets, progressive overload | ||||||
| CT | 10 | Half of ET + RT | ||||||
| Karavirta et al., 2011 [16] | Middle aged men | ET | Men | 54 | 25 | Used to cycle ergometer and aerobic thresholds (30–60 min) | 2 days/week × 21 weeks | LP |
| RT | 56 | 25 | 1 RM 40–85% 5~20 reps/set, 2–4 sets, progressive overload | |||||
| CT | 56 | 30 | ET + RT concurrent training | 4 days/week × 21 weeks | ||||
| de Souza et al., 2012 [32] | Young aged men | ET | Men | 24 | 8 | Used to high intensity interval training on treadmill, VO2max 80–100% | 2 days/week × 8 weeks | LP |
| RT | 25.9 | 11 | 6–12 RM reps/set, lower body muscle | |||||
| CT | 22.5 | 11 | ET + RT concurrent training | |||||
| Glowacki et al., 2004 [33] | Young aged men | ET | Men | 25 | 12 | Used to treadmill, HR reserve 65~80%, progressive overload | 2–3 days/week × 12 weeks | LP, BP, LBM, FM |
| RT | 23 | 13 | 1 RM 75–85% progressive overload | |||||
| CT | 22 | 16 | RT (3 days/week) + ET (2 days/week) × 6 weeks, ET (3 days/week) + RT (2 days/week) × 6 weeks | 5 days/week × 12 weeks | ||||
| Cadore et al., 2010 [34] | Older men | ET | Men | 64.4 | 7 | Used to cycle ergometer, HRmax 80% 20 min (~10 week), HRmax 100% 6 sets × 4 min (11–12 week) | 3 days/week × 8 weeks | BP, FM |
| RT | 64.0 | 8 | 6–20 RM reps/set, progressive overload | |||||
| CT | 66.8 | 8 | ET + RT concurrent training | |||||
| Donges et al., 2013 [35] | Middle aged men | ET | Men | 45.4 | 13 | Used to cycle ergometer, HRmax 75–80% (40~60 min) | 3 days/week × 12 weeks | LP, BP, LBM, FM |
| RT | 51.7 | 13 | 1 RM 75–80%, 8–10 reps/set, 3–4 sets | |||||
| CT | 46.2 | 13 | Half of ET + RT concurrent training | |||||
| Bentley et al., 2009 [36] | Young aged men | ET | Men | 24.8 | 9 | HRmax 65% Progressive overload | 3 days/week × 8 weeks | FM |
| RT | 25.4 | 9 | 1 RM 50%, 10 reps, 2 set, progressive overload | |||||
| CT | 24.4 | 9 | Half of ET + RT concurrent | |||||
| Azizbeigi, 2018 [37] | Young aged men | ET | Men | 21.1 | 10 | HRmax 50–85%, progressive overload | 3 days/week × 8 weeks | BP |
| RT | 21.2 | 10 | 1 RM 50–85%, progressive overload | |||||
| CT | 22.8 | 10 | Alternatively every week, first week: RT, second week: ET | |||||
| Izquierdo et al., 2005 [18] | Middle aged men | ET | Men | 42.3 | 10 | Used to cycle ergometer, HRmax 70–90%, 30–40 min | 2 days/week × 12 weeks | LBM, FM |
| RT | 43.5 | 11 | 1 RM 50–70%, 5~10 reps/set, 3–4 sets, progressive overload | |||||
| CT | 41.8 | 10 | ET (1 day/week) + RT (1 day/week) | |||||
| Macdonald, 2012 [38] | Young aged men | ET | Men | 20.56 | 9 | Plyometric training, 3–7 reps/set 3 sets | 2 days/week × 9 weeks | LBM |
| RT | 22 | 11 | Training day 1 (1 RM 75–90%, 3–6 reps/set, 3 sets) Training day 2 (1 RM 45–67%, 3–6 reps/set, 3 sets) | |||||
| CT | 22.50 | 10 | ET + RT concurrent training | |||||
| Izquierdo et al., 2003 [39] | Older men | ET | Men | 68.2 | 10 | Used to cycle ergometer, HRmax 55–85%, 30–40 min | 2 days/week × 16 weeks | LBM, FM |
| RT | 64.8 | 11 | 1 RM 50–70%, 10–15 reps/set, 3–4 sets (1~8 week) 1 RM 70–80%, 5–6 reps/set, 3–5 sets (9–16 week) | |||||
| CT | 66.4 | 10 | ET (1 day/week) + RT (1 day/week) concurrent training | |||||
| Sillanpaa et al., 2009 [50] | Middle aged women | ET | Women | 51.7 | 15 | 1–7 weeks: 30 min cycling; 8–14 weeks: 45–60 min cycling; 15–21 weeks: 60–90 min cycling | 2 days/week × 21 weeks | LBM, FM |
| RT | 50.8 | 17 | 1–7 weeks: 1 RM 40–60%, 15–20 reps 8–14 weeks: 1 RM 60–80%, 10–12 reps 15–21 weeks: 1 RM 70–90%, 6–8 reps | |||||
| CT | 48.9 | 18 | ET + RT | |||||
| Hendrickson et al., 2010 [46] | Recreation-ally active women | ET | Women | 21 | 13 | HRmax 70–85%, 20–30 min, 400, 800, 1200, 1600 m jogging | 3 days/week × 12 weeks | LP, BP LBM, FM |
| RT | 21 | 18 | 1–2 weeks: Familiarization period 3–6 weeks: Light intensity: 12 RM (rest 90 sec), Moderate: 8–10 RM (rest 120 s), Heavy: 6–8 RM (rest 120 s) × 3 sets (all intensity) 8–11 weeks: Light intensity: 12 RM (rest 90 sec), Moderate: 6–8 RM (rest 150 s), Heavy: 3–5 RM (rest 180 s) × 3 sets (all intensity) | |||||
| CT | 20 | 15 | First week: ET (3 day/week)/Next week: RT (3 day/week) (Alternate week) | |||||
| Taipale et al., 2020 [48] | Recreation -ally trained men and women | CT | Men | 32.6 | 10 | 2 RT + 2 ET, Progressive overload RT: 1 RM 50–85% (Main exercise, 2 days/week), Plyometric A (Once per week), Plyometric B (Once per week) (After main exercise, core and upper body exercise) ET: HIIT HRmax 70–90% 4 min × 4 sets + HRmax 60–70% 4 min × 3 sets + 100 m running all-out | 4 days/week × 10 weeks | LBM |
| Women | 31.3 | 9 | ||||||
| Kargl et al., 2024 [49] | Healthy young men and women | CT | Men | 27.3 | 9 | RT General Physical Preparedness: 2 weeks, 3 sets, 10 reps, 1 RM 64–72% Preparation for Peak Force Production: 1 week, 3–4 sets, 5–6 reps, 1 RM 72–80% Peak Force Development: 3 weeks, 3–5 sets, 3 reps, 1 RM 79–88% Rate of Force Development: 3 weeks, 3–4 sets, 2–3 reps, 1 RM 81–90% ET HRmax 70–85%, 60–90 min, runs and sprints | 12 weeks | LP, LBM, FM |
| Women | 27.4 | 9 | ||||||
| Bell et al., 2000 [47] | Men and women | ET | Men | 20.75 | 7 | Cycle: Increasing every 4 min per 4 weeks (30–42 min) (2 days/week), Cycle interval: Increasing every 1 sets per 4 weeks (4–7 sets) (1 day/week) | 3 days/week × 12 weeks | LP |
| RT | 20 | 7 | Upper and lower body exercise Increasing every 4%/3 week (1 RM 72–84%), 4–12 reps, 2–6 sets | |||||
| CT | 19.42 | 8 | ET + RT alternating days (RT: 3 days/week; ET: 3 days/week) | 6 days/week × 12 weeks | ||||
| ET | Women | 20.5 | 4 | Same as the exercise program in the men group. | 3 days/week × 12 weeks | |||
| RT | 21 | 4 | ||||||
| CT | 20.33 | 5 | 6 days/week × 12 weeks | |||||
| Sillanpaa et al., 2008 [52] | Middle aged men | ET | Men | 54.1 | 14 | Used to cycle ergometer, progressive overload (30–90 min) | 2 days/week × 21 weeks | FM |
| RT | 54.6 | 13 | 1 RM 40–90%, progressive overload | |||||
| CT | 56.3 | 15 | ET + RT concurrent training (RT: 2 days/week; ET: 2 days/week) | 4 days/week × 21 weeks | ||||
| Kell, 2011 [40] | Young aged men and women | RT | Men | 22.7 | 20 | 4 weeks mesocycle Week 1–2: Whole-body workout session/moderate volume (3–4 set; 324–640 reps), lower intensity (55–57% 1 RM) Week 3: adding 4 new exercises (split routine 4 days/week) Week 4: week 4 was a testing and recovery week | 3–4 days/week × 12 weeks | LP, BP |
| RT | Women | 22.5 | 20 | |||||
| Haykowsky et al., 2005 [41] | Older women | ET | Women | 66 | 8 | Cycle exercise at an intensity between 60% and 80% of HR/progressive intensity (2.5 min every week up to a maximal duration of 42.5 min | 3 days/week × 12 weeks | LP, BP |
| RT | 70 | 8 | Upper and lower extremity/2 sets of 10 reps/progressive overload (2.5% every week) (progressively increased to 75% of 1 RM) | |||||
| CT | 68 | 8 | ET + RT concurrent training | |||||
| Mayhew et al., 2024 [42] | Young aged men and women | RT65% | Men | 19.5 | 41 | 1 RM 65% BP and Squat 3 sets × 10–12 reps (5 weeks)/3 sets × 6–8 reps (4 weeks)/3 × 3–5 RM (3 weeks) | 3 days/week × 12 weeks | LP |
| Women | 19.2 | 33 | ||||||
| RT90% | Men | 19.5 | 44 | 1 RM 90% BP and squat 3 set × 10–12 reps (5 weeks)/3 × 6–8 RM (4 weeks)/3 × 3–5 RM (3 weeks) | ||||
| Women | 19 | 29 | ||||||
| McTiernan et al., 2007 [43] | Men and women | ET | Men | 56.2 | 51 | 60 min session, moderate-to-vigorous aerobic exercise gradually achieved over the first 12 weeks. | 12 months, 6 days/week | FM |
| ET | Women | 54.4 | 49 | |||||
| Grau et al., 2009 [44] | Young aged men and women | CT | Men | 23.13 | 20 | RT + plyometric jumps: 1 RM 50%, 1 set × 12 reps/1 RM 70% 1–3 set × 6–10 reps/1 RM 90% 1–2 set × 2–3 reps + Drop jump 4–11 set × 5/hurdles 4–11 set × 5 | 3 days/week × 9 weeks | LBM, FM |
| Women | 22.3 | 8 | ||||||
| Gergley et al., 2009 [51] | Healthy young men, women | RT | Men | 20.75 | 8 | 1–3 weeks: 3 × 12 RM, (Leg extension/flexion), (Leg press); 4–6 weeks: 3 × 10 RM, (Leg extension/flexion), (Leg press); 7–9 weeks: 3 × 8 RM, rest 150 sec (Leg extension/flexion)/3 × 8 RM, rest 180 sec (Leg press) | 2 days/week × 9 weeks | LP |
| CT 1 | 20 | 7 | RT + 1–3 weeks: HRmax 65%, 20 min (Cycle) 4–6 weeks: HRmax 65% 30 min (Cycle) 7–9 weeks: HRmax 65% 40 min (Cycle) | |||||
| CT 2 | 19.42 | 7 | The same intensity as CT 1 (Treadmill) | |||||
| RT | Women | 20.5 | 2 | The same protocol as men’s groups | ||||
| CT 1 | 21 | 3 | ||||||
| CT 2 | 20.33 | 3 | ||||||
| Sillanpaa et al., 2010 [45] | Middle aged women | ET | Women | 53 | 21 | Progressive overload by cycling (1 cycle: 30 min, 2 cycle: 45 min, 3 cycle: 50–60 min | 2 days/week 21 weeks | LBM, FM, |
| RT | 52 | 27 | 10 rm, 3–4 sets: cycle 1 (1–7 week): 1 RM 40–60%, cycle 2 (8–14 week): 1 RM 60–80%, cycle 3 (15–21 week): 1 RM 70–90% | |||||
| CT | 51 | 22 | ET + RT | |||||
Disclaimer/Publisher’s Note: The statements, opinions and data contained in all publications are solely those of the individual author(s) and contributor(s) and not of MDPI and/or the editor(s). MDPI and/or the editor(s) disclaim responsibility for any injury to people or property resulting from any ideas, methods, instructions or products referred to in the content. |
© 2024 by the authors. Licensee MDPI, Basel, Switzerland. This article is an open access article distributed under the terms and conditions of the Creative Commons Attribution (CC BY) license (https://creativecommons.org/licenses/by/4.0/).
Share and Cite
Noh, K.-W.; Seo, E.-K.; Park, S. Effects of Exercise Type on Muscle Strength and Body Composition in Men and Women: A Systematic Review and Meta-Analysis. Medicina 2024, 60, 1186. https://doi.org/10.3390/medicina60071186
Noh K-W, Seo E-K, Park S. Effects of Exercise Type on Muscle Strength and Body Composition in Men and Women: A Systematic Review and Meta-Analysis. Medicina. 2024; 60(7):1186. https://doi.org/10.3390/medicina60071186
Chicago/Turabian StyleNoh, Ki-Woong, Eui-Kyoung Seo, and Sok Park. 2024. "Effects of Exercise Type on Muscle Strength and Body Composition in Men and Women: A Systematic Review and Meta-Analysis" Medicina 60, no. 7: 1186. https://doi.org/10.3390/medicina60071186