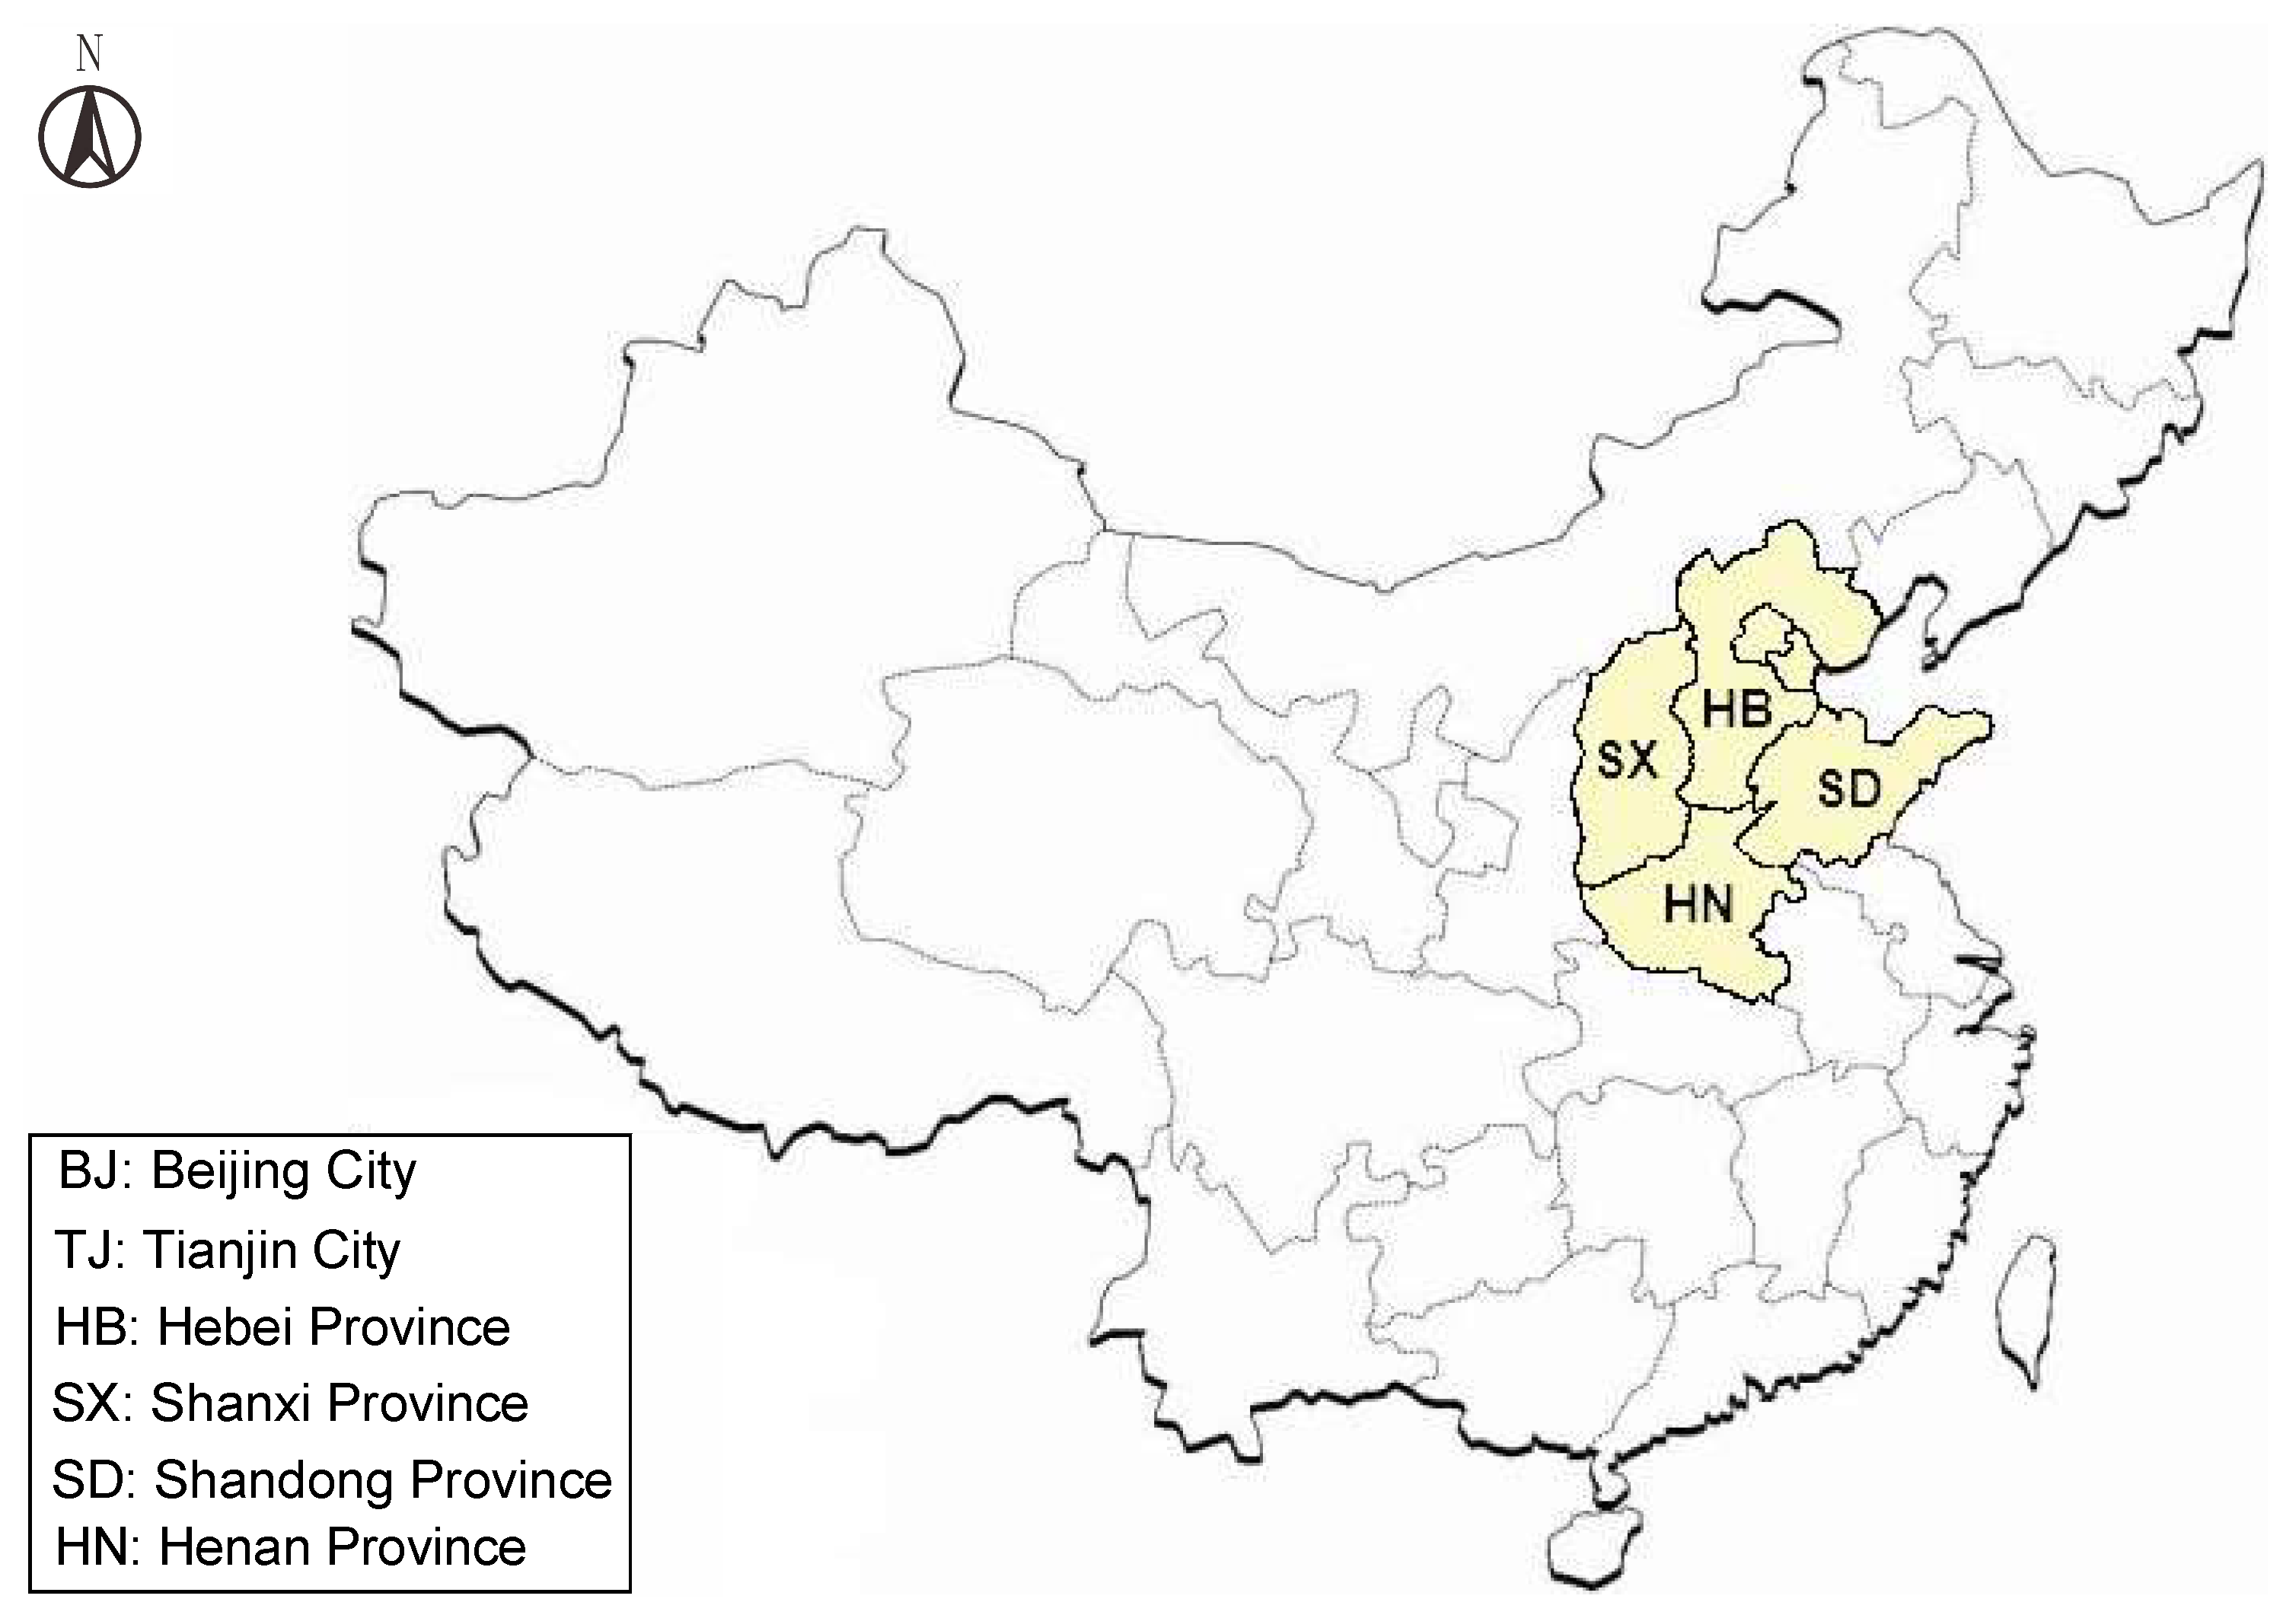
The water resources security evaluation method based on hybid fuzzy BWM-TOPSIS is applied here to North China, with six provinces and cities as evaluation regions: Beijing City (denoted as BJ,
), Tianjin City (denoted as TJ,
), Hebei Province (denoted as HB,
), Shanxi Province (denoted as SX,
), Shandong Province (denoted as SD,
), and Henan Province (denoted as HN,
). The evaluation regions are shown in
Figure 4, and the background and results of the evaluation are given below.
4.1. Case Description
China is a country with serious drought and water resource shortages. China’s total freshwater resources are 2.8 trillion m
, accounting for 6% of the world’s water resources. However, China’s per capita water resources are only 2300 m
, only 1/4 of the world average. In addition, China’s continental monsoon climate is so important that the water resources between the south and north are seriously unbalanced, resulting in the uneven distribution of water resources. At present, 47% of China’s total population is distributed in the northern region, which accounts for 45% of China’s GDP. In addition, the agricultural land in the southern region accounts for 35% of China’s land area, but its available water resources account for 81% of China’s total [
40]. In particular, the six provinces and cities in North China considered in this case have a total area of about 700,000 km
and a total population of about 346 million, accounting for about 25% of China’s population. Its total water resources are less than 4% of China’s total water resources; moreover, its per capita water resources are less than 13% of China’s average level, even lower than 5% of the world’s average level.
The security of water resources not only needs to consider the quantity, but it also should take the security of water quality in daily life into account. The economic development of the inland areas of North China mainly rely on traditional energy, heavy chemical industry, and traditional agriculture. For example, the coal industry of Shanxi Province used to be an important economic source of the whole province. Although the country has strengthened its environmental protection, a large amount of coal mining has caused serious damage to the water quality. Henan is a major agricultural province, with the main agricultural product output, ranking first in the country, and a cultivated land area of 6.87 million hectares, ranking second in the country. It has very large water resources consumption on agricultural land. Similarly, Hebei Province takes the resource processing type and the combination of industry and agriculture as the main economic structures. Moreover, Shandong Province and Tianjin City, as heavy chemical bases, occupy an important position in the national chemical industry. Once a chemical leak occurs, it will cause irreversible damage to nearby water sources and the offshore environment. Beijing, though dominated by service industry and high-tech industry, is the largest city in China, and water security is an important factor that cannot be ignored in this region. Once a security incident occurs, it will cause incalculable impacts. The industrial and agricultural activities to promote economic development and the activities of the service industry in these regions are heavily dependent on the water resources of the region. Compared with the coastal advantages of Shandong Province and Tianjin City, the situation of water shortages in other inland regions of North China is more severe. However, the highly developed industrial structure in coastal areas will also increase their dependence on seawater, and their impacts on water pollution may be greater than those in inland regions.
4.4. Comparison Analysis
Previous studies lacked consideration of using a triangle fuzzy linguistic set to express the importance comparisons between water resource security indicators; they preferred the importance of indicators with equal weight. However, it is worth mentioning that different indicators should have different degrees of importance in the evaluation system, for some indicators have more significant impacts on water resources security. Therefore, the triangle fuzzy linguistic set is integrated in BWM here for generating different indicator weights for the TOPSIS method. A comparison of results of the proposed fuzzy BWM-TOPSIS method and the traditional equal-weight TOPSIS is shown in
Table 7. It can be seen from
Table 7 that, compared with the traditional TOPSIS method with equal indicator weights,
ranked last, while
ranked better than other regions in both methods. This shows that Henan Province had a steadily better performance in water resources security, while Tianjin City should pay more attention to the improvement of water resources security. For analyzing the differences of the two methods, the relative proximity values in all regions were different, and the rankings of Shandong Province and Shanxi Province changed in these two methods because the introduction of fuzzy linguistics assigned different weights of importance to the indicators. Compared with the equal-weight TOPSIS method, the water resources security ranking of Shanxi Province using the proposed hybrid fuzzy BWM-TOPSIS method rose, which was mainly because the weights of some indicators (e.g., pollutants discharged into water per unit area (COD and ammonia nitrogen),
; exploitation and utilization level of surface water,
) increased when they were assigned a higher degree of importance in the proposed hybrid fuzzy BWM-TOPSIS method due to their more significant impacts on water resources security. While the weights of some indicators (e.g., water consumption per 10,000 yuan GDP,
; water consumption per 10,000 yuan industrial output value,
) for which Shanxi Province had relatively worse performance decreased.
The Analytical Hierarchy Process (AHP) is one of the most widely adopted MCDM techniques as TOPSIS [
41]; therefore, a comparison analysis between the proposed method with AHP method was conducted. For ensuring the fairness of comparison, the AHP method was given the same indicator weights obtained by fuzzy BWM method to avoid large differences in ranking caused by the different indicator weights, which means the proposed fuzzy BWM-TOPSIS method was compared with the fuzzy BWM-AHP method. The results are shown in
Table 7. It can be seen from
Table 7 that the rankings of Hebei Province and Beijing city changed, while the rankings of other regions remained unchanged for these two methods. The main reason is that TOPSIS and AHP have the following characteristics: for TOPSIS, the minimum distance to the positive ideal solution and the maximum distance to the negative ideal solution should be realized, and the ranking should be carried out according to the relative proximity degree, while AHP aims to determine the weights in regions (i.e., alternatives) hierarchy after obtaining the weights of indicators hierarchy and calculate the comprehensive index with the combination weight for sorting. What is more, the AHP method needs to decompose the decision-making problem into several subsystems, which requires a lot of pairwise comparisons, while the calculation process of the TOPSIS method is more convenient.
4.5. Sensitivity Analysis
The sensitivity analysis of the final ranking of the scheme to the weights assigned to different indicators is conducted here so as to verify the effectiveness of the indicators’ weights calculated by the fuzzy BWM method. Fourteen groups of experiments were carried out. For the first experiment, based on the original indicator weights, the weight of indicator
increased by 13%, while the sum of the other indicator weights reduced by 13%. Each of the other indicator weights will share this reduction percentage equally; in other words, all other indicator weights will be reduced by 1%. The same idea is applied to the other 13 groups of experiments on the other 13 indicators. Based on this consideration, the values of the final relative proximity degrees
in each experiment are calculated by Equations (
21)–(
26), and the rankings of the regions (i.e., alternatives) of 14 groups of experiments are operated in turn. The operation results are shown in
Table 8 and
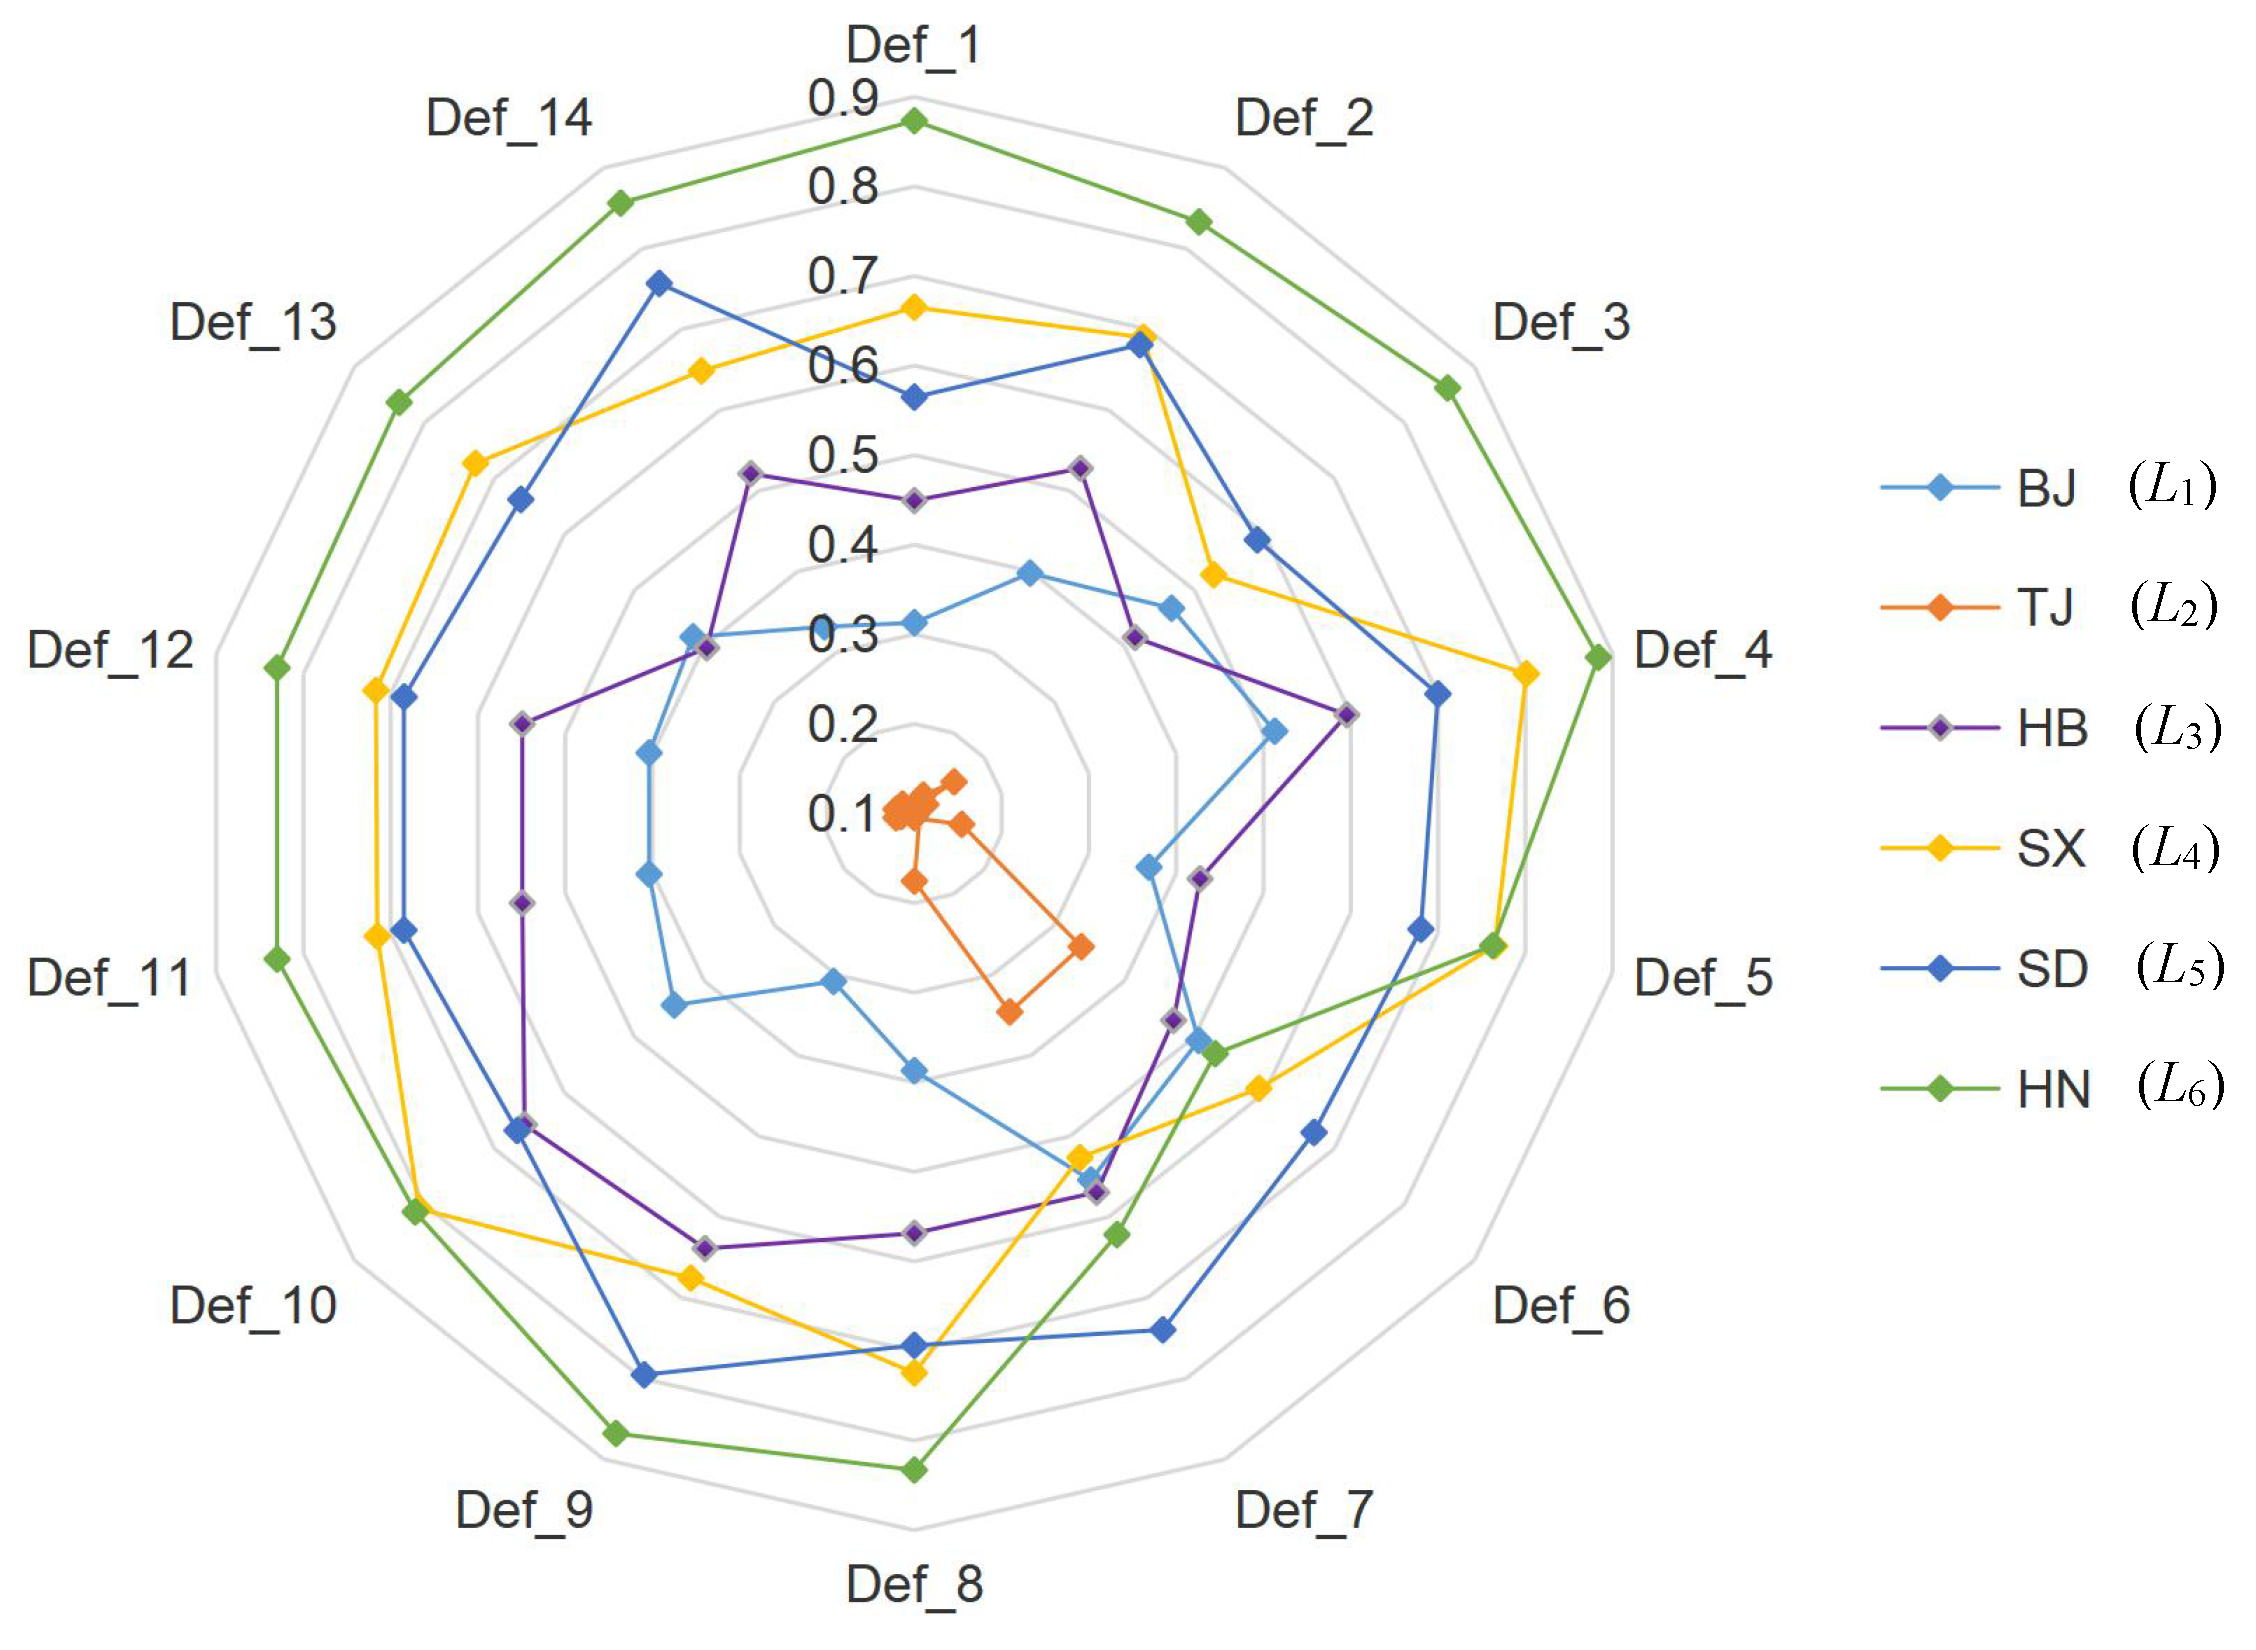
Figure 5.
It can be seen from
Figure 5 that the rankings of
values of six regions (i.e., alternatives) were relatively stable. Although there were some changes in various provinces and cities, the results generated from a number of experiments showed that the relative proximity
values of various provinces and cities fluctuated up and down only slightly. Therefore, the obtained results can be considered robust, to some extent. As shown in
Figure 5, the relative proximity value of Beijing City (i.e.,
) and that of Tianjin City (i.e.,
) had lower rankings, especially Tianjin City which was maintained in the center of spider diagram, meaning it always came last in all the experiments. The relative proximity values of Hennan Province (i.e.,
) and that of Shanxi Province (i.e.,
) were in relatively higher places. It can also be noticed from
Table 8 that the
value of Beijing City ranked fifth in 11 instances, and the
value of Tianjin City always ranked last. However, the relative proximity value of Henan Province (i.e.,
) ranked first in 11 instances and second for 2. The value of Shanxi Province (i.e.,
) ranked first once, second 9 times, and third 3 times. It should be noted that Shanxi Province has a large gap in the seventh sensitivity experiment, with its
value dropping from second to fifth. The reason is that the seventh experiment increased the weight of water consumption per 10,000 yuan industrial output value (i.e.,
) by 13%, and in terms of the performance of this indicator, Shanxi Province was the worst among the six regions. Synthesizing the above results, the water resources security levels in Henan Province and Shanxi Province are comparatively higher, while those of Tianjin City and Beijing City are comparatively lower in different weight combinations.
4.6. Suggestions
According to the collected indicator data and the final ranking results, some key problems of water resources are highlighted in North China.
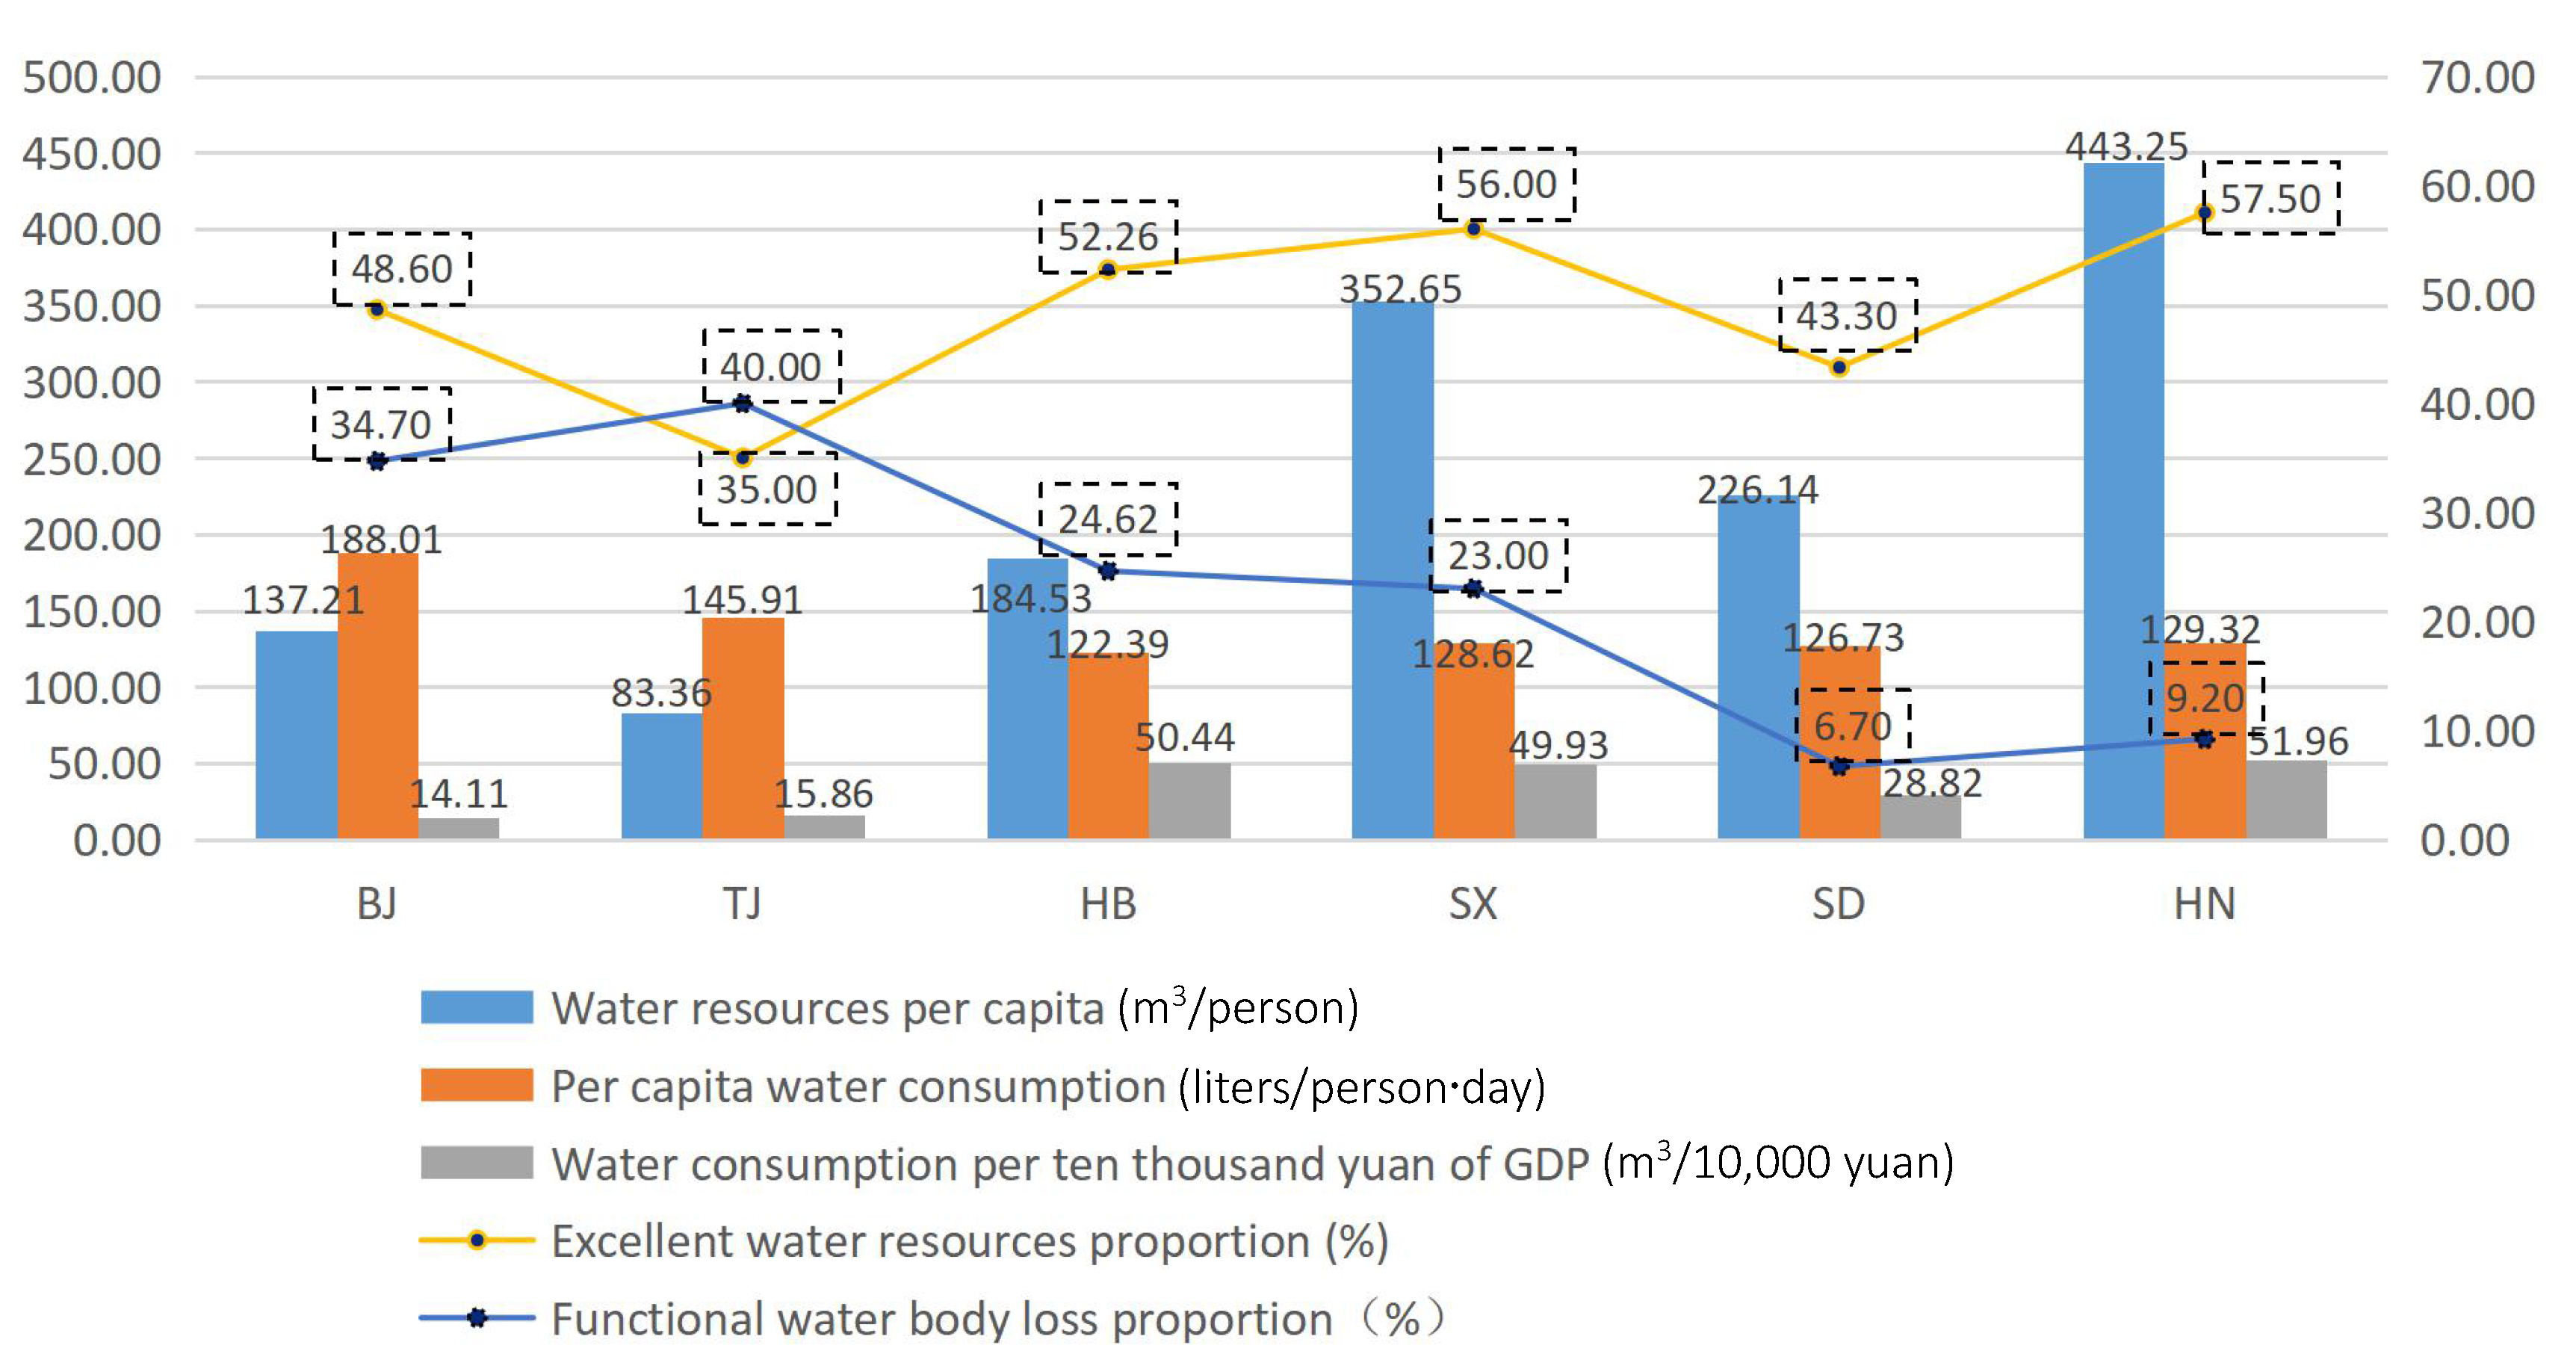
First, from the perspective of water quantity security, the distribution of water resources among regions is uneven. Relatively speaking, the economic development of the region is highly dependent on the water resources of the region, the more developed a region is, the higher its population will be, and the less its corresponding per capita share will be, which will further aggravate regional water resource disparities. As shown in
Figure 6, for example, Beijing City is relatively more developed than Henan Province, which can be seen from the water consumption per 10,000 yuan GDP. The value for Beijing City was as low as 14.11 m
/10,000 yuan, which is about 1/4 that of Henan Province; however, the the per capita water resources of Beijing City was 137.21 m
/person, which is about 1/3 that of Henan Pronvince. What is more, from
Figure 6, Beijing has a very large population, its water resources per capita (137.21 m
/person) ranked last but once; however, its daily water consumption of residents (188.01 L/person·day) ranked first in all regions. This shows that the regional water resources security in Beijing City is in poor condition and also explains the reason that the water resources security ranking of Beijing City stayed lower all the time.
Second, from the aspect of water quality security, water resources are seriously polluted from a general view. As seen in
Figure 6, water quality security situations in Tianjin and Beijing are worse than those in other regions, especially in Tianjin City. The proportion of excellent water resources was as low as 35.00%, which was the lowest among all regions; however, its functional water body loss proportion was as high as 40.00%, which was the worst among all regions. This shows that Tianjin has bad water quality security conditions, and some efficient measures should be taken to deal with these problems.
Integrating the above analysis, suggestions are put forward to promote the overall development of North China and make effective and reasonable use of water resources.
(1) Put forward the strategic plan of water use. The local government should optimize industrial structures, promote the adoption of innovative water-saving technology, and develop clean energy and other measures so as to improve water use and reduce water resources consumption and sewage discharge [
42]. At the same time, it is suggested that investment in laboratory infrastructure should be increased to promote the assurance of water quality monitoring. The local government should also encourage stakeholders to comprehensively solve the causes of water damage and actively respond to the water protection measures formulated by the government [
43,
44,
45]. Some policies or strategies should be adopted to coordinate the interrelated departments and stakeholders in order to achieve consensus among departments and individuals in reducing the harm human factors pose to the regional water resources environment.
(2) Crack down on factories and enterprises with severe water pollution, and slowly raise the standards for industrial waste water discharge. Water pollution is still an inevitable obstacle to the progress and development of modern society. Nearly 1/5 of water in rivers in North China cannot be used, and the unit area of pollutants discharged into the water is an important cause of water pollution; therefore, as China’s heavy industry base, the local governments in North China need to more strictly control industrial wastewater, and people should also play a role in supervising the local governments and enterprises.
(3) Focus on the development of seawater desalination technology to reduce the development and utilization of inland surface water and groundwater. With the increase in population and rapid development of the economy, the demand for water resources is constantly intensifying. In the process of urbanization, excessive exploitation of groundwater reduces the recycling of groundwater and intensifies damage to groundwater. Desalination technology could efficiently settle the shortage problem of water resources in North China (near the sea).
(4) Publicize the importance of water conservation, promote the installation of water-saving equipment in rural areas, and form good habits of recycling and water conservation, especially in the rural areas of villages and towns. At present, the awareness of water resources protection is still weak, and the water-saving facilities in a household are not complete. It should be noted that the potential for continuous development of water resources in the region is limited, while the potential for water conservation (i.e., multi-functional utilization of domestic water, industrial water reuse) is very large, so it is of significant importance to publicize water-saving ideas to the people. In addition, we can promote water-saving behaviors and mobilize people’s enthusiasm for water saving by appropriately raising water prices in different regions.
For the provinces and cities in North China, the following suggestions are put forward.
(1) Based on the evaluation results, Henan Province is closest to the optimal solution and farthest from the worst solution (i.e., ranking highest) among the six regions. Compared with the other five regions, Henan Province is rich in water resources, and its water quantity security and quality security are both at relatively better levels. However, its water consumption per 10,000 yuan GDP is highest among six regions (see
Figure 6); therefore, there is still a lot of room to improve the efficiency of economic operation. As a big agricultural province, Henan can reduce the water consumption per 10,000 yuan GDP by increasing the water reuse rate in agriculture. Based on this, it can improve its water resources security level even further.
(2) The water resources security level in Shanxi Province ranks second, but as a large coal mining province, it should be noted that the garbage and sewage treatment rates in the province still need to be improved, for its two indicators (i.e., harmless disposal rate of household garbage, municipal sewage treatment rate) have relatively worse performances among the six regions. Some centralized sewage or garbage treatment plants can be built on the original grounds to improve the treatment rate of pollution so as to prevent the re-pollution of industrial wastewater. In addition, it can also be seen from the seventh experiment for sensitivity analysis in
Table 8 and
Figure 5 that the water consumption per 10,000 yuan industrial output value had a great influence on the ranking of Shanxi Province. The local government should increase publicity to enterprises to eliminate the behavior of wasting water in industry, and at the same time enterprises should also reduce their industrial water consumption by adopting more industrial water-saving facilities and enhancing the reuse of industrial water. Through the above measures, its weak points can be improved which will apparently enhance its performance on water resources security.
(3) Shandong Province, ranking third among the six regions of North China, has a relatively poor performance in both functional water body loss proportion and the pollutants discharged into water per unit area (COD and ammonia nitrogen), which are the main reasons for it ranking lower than Shanxi Province. Therefore, it is imperative to strictly control the re-pollution of water bodies and the discharge amount of pollutants to strengthen its performance on water resources security.
(4) Hebei Province, oriented towards heavy industry and ranking relatively in the middle in the whole region, should try to change its industrial structure to light industry gradually. At present, the wastewater and residue produced by heavy industry is relatively high, as the effluent discharge per 10,000 yuan GDP of Hebei Province is larger than that of Shandong Province and Henan Province, so more strict examination and purification measures should be taken in order to control pollution and improve its water quality security level. In addition, exploitation and utilization levels of surface water and groundwater are relatively high, especially for groundwater, which should be controlled to avoid damage to the ecological environment caused by over exploitation and to narrow the gap with the top two regions.
(5) Beijing City, as a region with wide concerns, had the penultimate comprehensive score. Some indicators were close to the worst line in North China, such as daily domestic water consumption per capita, the effluent discharge per 10,000 yuan GDP, proportion of excellent water resources and functional water body loss proportion, and exploitation and utilization level of surface water. Therefore, the local government not only needs to strengthen the protection of rivers, which can promote to control the water pollution and protect water resources environment, but also control surface water exploitation in the meantime. Moreover, it should be noted that the daily domestic water consumption per capita in Beijing City is much higher than that in other regions, which does not match the per capita water resources in Beijing City. Therefore, it may be necessary to raise the water price to encourage people’s daily water saving. All in all, it can be seen from the above analysis that Beijing City did not perform well in water quantity and quality security subsystems. The local government should take active and forceful measures to build a better city image in water resources security.
(6) Tianjin City, always ranking last among the six regions, had the lowest per capita water resources and over developed surface water resources with high load (216% surface water exploitation and utilization degree). Therefore, the local government should limit local water resources exploitation. It can alleviate the shortage of water resources by purchasing water resources intensive products. While depending on the South-to-North Water Diversion Project for water supply, it should also rely on government propaganda to promote water-saving awareness among the people. In addition, the lower water resources security level in Tianjin City is not only reflected in the amount of water, water quality security is also under serious condition. Since 40% of the river water in Tianjin City has lost its function, it is necessary to formulate a comprehensive prevention and control plan for water pollution, adhere to the principle of comprehensive control, and cooperate with the economic growth mode transformation, so as to improve the efficiency of pollution control. With consideration of its very poor performance in water resources security, Tianjing City cannot change its situation at the bottom of the ranking without attaching great importance on the aforementioned water quantity and water quality measures.


