Abstract
Nutrition and health claims should be truthful and not misleading. We aimed to determine the use of nutrition and health claims in packaged foods sold in Mongolia and examine their credibility. A cross-sectional study examined the label information of 1723 products sold in marketplaces in Ulaanbaatar, Mongolia. The claim data were analysed descriptively. In the absence of national regulations, the credibility of the nutrition claims was examined by using the Codex Alimentarius guidelines, while the credibility of the health claims was assessed by using the European Union (EU) Regulations (EC) No 1924/2006. Nutritional quality of products bearing claims was determined by nutrient profiling. Approximately 10% (n = 175) of products carried at least one health claim and 9% (n = 149) carried nutrition claims. The credibility of nutrition and health claims was very low. One-third of nutrition claims (33.7%, n = 97) were deemed credible, by having complete and accurate information on the content of the claimed nutrient/s. Only a few claims would be permitted in the EU countries by complying with the EU regulations. Approximately half of the products with nutrition claims and 40% of products with health claims were classified as less healthy products. The majority of nutrition and health claims on food products sold in Mongolia were judged as non-credible, and many of these claims were on unhealthy products. Rigorous and clear regulations are needed to prevent negative impacts of claims on food choices and consumption, and nutrition transition in Mongolia.
1. Introduction
Lifestyle-related non-communicable diseases (NCDs) are the leading cause of global deaths, responsible for 71% of the 57 million global deaths in 2016. Almost eight in every ten deaths from NCDs occur in low- and middle-income countries (LMIC) [1]. Nutrition transition can result in higher rates of obesity and NCDs and is associated with shifts in diet, physical activity and other lifestyle changes that follow economic, demographic and epidemiological changes [2]. Changes in diet are one of the key characteristics of nutrition transition. Dietary changes include increased consumption of processed foods and shifts from traditional diets to Western pattern diets high in energy, sugars and fat [2]. Nutrition transition is a global phenomenon but is occurring much faster in LMICs [3]. LMICs are facing challenges in responding to nutrition transition and a faster growing burden of NCDs. These challenges relate to limited resources and time to adjust food policies to support healthy diets. Serious attempts to address the problem are limited to only a few countries [4].
Provision of accurate and sufficient information on the nutritional quality of food products is a key policy action for governments to support healthy diets, as recommended by the Codex Alimentarius Commission [5]. Claims are one form of nutrition labelling. Nutrition claims state, suggest or imply that a food has particular nutritional properties including but not limited to the energy value and to the content of protein, fat and carbohydrates, as well as the content of vitamins and minerals. Health claims refer to relationships between a food or a constituent of that food and health [6]. Nutrition labelling provides information to consumers about the nutritional content of foods and assists them in making healthier choices. It may also encourage product reformulation as food manufacturers seek to avoid making undesirable disclosures [7].
Claims on food labels should be truthful and not misleading [6]. However, food producers use claims for marketing purposes [8]. Claims can be misleading where they are present on foods deemed less healthy or when health claims are not scientifically substantiated [8]. Claims also can induce a “health halo” effect, by which they affect consumers’ perceptions of the overall healthfulness of foods. People are more likely to purchase products bearing claims and are not as restrained in their consumption [9].
Mongolia is an LMIC where little research on food labelling has been undertaken. Prior to shifting to a market economy in the early 1990s, Mongolia was under a centralised economy and had low levels of imported food products [10]. Consequently, Mongolian consumers are relatively unfamiliar with food labelling specifically and processed packaged food more generally. The country is experiencing rapid nutrition transition with commensurate NCD burdens. NCDs surpassed other causes of mortality in recent decades to become the leading cause of population mortality. Cardiovascular disease and cancer accounted for 60% of population deaths in 2017, compared to 58% in 1995 [11]. Of 15–49 years olds, 46.2% of women and 48.8% of men were overweight and obese in 2016, which represents an increase of 40% for women and 77% among men from 2010 levels [12].
In Mongolia, a new food labelling standard, MNS 6648:2016, which was largely based on the relevant Codex standards for food labelling [5,6,13], came to enforcement in 2018. Prior to this, there was effectively no regulation relating to nutrition and health claims on food packages. The previous guideline on nutrition labelling of 2007, which was an apparent translation of the Codex guidelines on nutrition labelling [5], lacked capability to provide proper regulation due to its poor translation (introducing errors) and voluntary nature. The new regulation of 2018 was progressive to the previous guideline as it stipulates mandatory nutrition labelling for all pre-packaged food products on the back or side of food packaging. Official label languages are Mongolian, Russian and English. Regulations relating to nutrition and health claims are still minimal in the new standard and include two main requirements: (1) the mandatory declaration of a nutrient when a nutrition or health claim is made, and; (2) the need for approval of health claims by a government-authorised organization. A definition of a nutrition claim was provided in the food labelling standard MNS 6648:2016, together with the requirement to declare the amount of the claimed nutrient. The standard also introduced the concept of scientific substantiation of health claims. However, the standard does not specify the types of nutrition and health claims that are permitted and lacks requirements regarding criteria for making claims [14].
Food labelling policy implementation, including for nutrition and health claims, has not been well studied in developing countries. Most evidence on the use of claims and their effects on diets are from developed countries [15,16,17]. The study aimed to determine the use of nutrition and health claims on packaged foods sold in Mongolia and examine the credibility of these claims. As food labelling regulations are currently in transition in this country, this study provides a critical baseline evaluation of the food labelling landscape to guide identification of areas of concern and provide a basis for assessing progress on policy implementation. Findings will be useful to other developing countries experiencing similar trajectories in the availability and population consumption of processed packaged foods in the absence of corresponding food labelling policies to guide healthier choices.
2. Materials and Methods
2.1. Data Collection and Coding
A survey of packaged food product labels was conducted in Ulaanbaatar, the capital city of Mongolia, during November and December 2017. University students studying nutrition, public health and nursing were engaged in data collection after undertaking training in the data collection tool. The students collected the label information of food products from supermarkets and grocery stores located throughout the city. They were instructed to collect the product information from any supermarket or grocery store at their convenience.
Approximately 100 student data collectors sampled food products from 50 food categories belonging to 11 major groups (Table A1). These food categories and subcategories were based on the food categories’ classification used in the household socio-economic survey of the National Statistics Office of Mongolia [18], which represented the common types of food products used by Mongolian households with some modifications to include other common types of processed food products. The pre-defined food categories were pre-tested in one supermarket by crosschecking them against the products placed on the shelves in the supermarket and missing food categories were added.
The food categories were assigned to the data collectors in order to avoid duplications and each student was asked to collect label photographs of at least 20 food products across all label language groups, capturing as many different brands as possible. They took photographs of product packaging and recorded details of label information, including the product’s name, category, brand, manufacturing country, label language and availability of nutrient declarations and claims. Students transferred electronic copies of the photographs to the lead author (NCh).
Photographs were coded by one person (NCh) for product name, type, manufacturing country, label language and the verbatim content of claims. If label photographs were of poor quality or did not fully capture the label, students were asked to retake photographs of the products and send them through, or the Internet was searched for images of the products.
2.2. Data Analysis
Data were entered into Microsoft Excel (2016) and converted into IBM SPSS Statistics for Windows, Version 23.0 (IBM Corp., Armonk, NY, USA) for analysis. The proportions of food products carrying nutrition and health claims and the rate of claims per 100 products (a number of claims per 100 products) were estimated for each food category. The rates of claims were compared by claim type and label language.
By the credibility of claims, we perceived trustworthiness and reliability of claims in terms of providing reliable and scientific evidence-based information to consumers, as well as providing supporting information on the content of claimed nutrients to back up the claimed nutritional characteristics or health effects of a product. The Codex guidelines and the claims regulation of the EU were used in the credibility analysis of claims as the current national food labelling standard (2018) did not contain criteria for making nutrition and health claims. Credibility of nutrition claims was determined by their compliance with the criteria of nutrient content claims established in the Codex guidelines for Use of Nutrition and Health Claims (CAC/GL 23-1997) [6]. Nutrition claims were considered credible if the value for the claimed nutrient was present and in correct amounts on the nutrient declaration. Health claims were assessed for their consistency with the list of acceptable claims of the EU Regulations (EC) No 1924/2006 [19]. The EU regulation was used because of the considerable share in the Mongolian food imports from EU countries [20]. Health claims were considered credible if they appeared in this list and were compliant with the criteria of nutrient content established for corresponding claims (Figure 1).
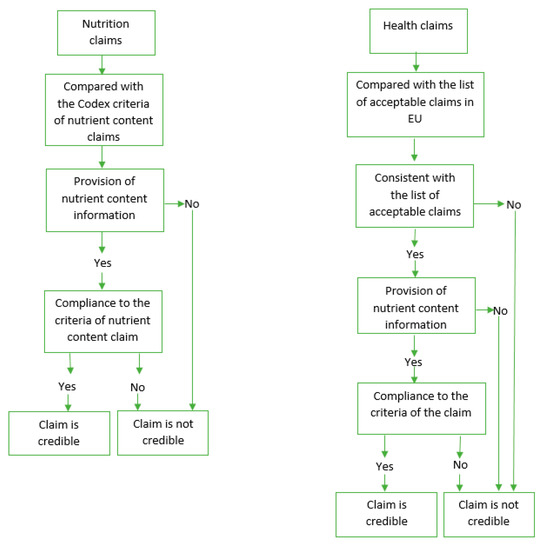
Figure 1.
Assessment of credibility of nutrition and health claims.
Products with nutrition and health claims were assessed for their healthiness by comparing their nutrient content against the WHO nutrient profile model for the Western Pacific Region (WPR) [21]. The purpose of the model is to restrict marketing of foods and non-alcoholic beverages to children and it is intended to differentiate between food and non-alcoholic beverages that are more likely to be part of a healthy diet from those that are less likely. The model consists a total of 18 food categories and marketing to children is prohibited for three categories (category 1—chocolate and sugar confectionary, energy bars and sweet toppings and desserts; category 2—cakes, sweet biscuits and pastries and sweet bakery products; and category 4c—energy drinks, tea and coffee). The nutrient content of the products was crosschecked against the nutrient thresholds for saturated fats, trans fatty acids, added sugar and sodium of the model. Products that exceeded any of the relevant thresholds were considered unhealthy.
The research was reviewed and approved by the Human Research Ethics Committee of University of Wollongong on 24 October 2017 (Project identification code: 2017/394).
Classification of Claims
Claim types were determined according to the Codex classifications [6]. In addition, therapeutic claims were included as a type of health claim (Table 1).

Table 1.
Types of claims.
3. Results
3.1. Characteristics of Food Products Surveyed
Label photos of 1723 food products were collected and analysed. The sample included nearly equal numbers of products labelled in Mongolian and other languages. The products belonged to 17 of 18 food categories of the WHO nutrient profile model for the WPR (Table 2). One-third of the products contained nutrient profiles in the categories (1, 2 and 4c), for which marketing to children is prohibited.
Table 2.
Food categories covered in the survey.
3.2. Prevalence of Nutrition and Health Claims on Products
Overall, 9% (n = 149) of products carried at least one nutrition claim and 10% (n = 175) of products carried at least one health claim. The most prevalent claims were nutrition claims, nutrient function claims and therapeutic claims. The median numbers of nutrition and health claims were 2 claims per product, respectively (Table 3). It was common for the same product to carry more than one claim so that 50.3% of products with nutrition claims and 81% of products with health claims had more than one claim per product.
Table 3.
Prevalence of nutrition and health claims.
3.2.1. Prevalence of Nutrition and Health Claims by Label Language
Products labelled in Mongolian had higher rates of claims than those labelled in other languages. The prevalence of claims was between 2.2 and 21.7 times higher for products labelled in Mongolian (n = 856) compared to other languages (n = 867). Per 100 products, the different rates of claims for Mongolian labels compared with labels in other languages were: reduction of disease risk claims 4.3 (n = 37) versus 0.2 (n = 2), other function claims 15.7 (n = 134) versus 1.6 (n = 14), therapeutic claims 16.8 (n = 144) versus 1.8 (n = 16) and nutrition claims 23.0 (n = 197) versus 10.5 (n = 91), respectively.
3.2.2. Products Carrying Nutrition and Health Claims
Product categories with the highest percentages of products with at least one nutrition claim and with the highest rates of nutrition claims were dried curd and curd (60.0%, n = 9), vegetable oil (31.0%, n = 9) and curd drink and yoghurt (26.8%, n = 11). Health claims were carried most frequently on labels for dried curd and curd (53.8%, n = 7), buckwheat, rice and millet (52.5%, n = 21) and curd drink and yoghurt (51.2%, n = 21). Higher rates of health claims were found in barley, flax and wheat flour, buckwheat, rice and millet and breakfast cereal.
3.3. Types of Health Claims
For most of the nutrient function (n = 129 of 176 claims) and other function claims (n = 116 of 148 claims), health benefits were related to a whole product or its ingredients, such as “Rye contained in the product supports the digestive system” (nutrient function claim) or “Pure chocolate contained in the product improves brain function” (other function claim) (Table A2 and Table A3). Therapeutic claims were the second most common claims with 160 claims found across the sample. Again, these claims were mostly based on a whole product or its ingredients (Table A4). Reduction of disease risk claims were the least prevalent health claims, identified 39 times across the sample (Table A5).
3.4. Credibility of Nutrition and Health Claims
The credibility of the claims was very low. For nutrition claims, this was mostly due to the lack of information about the claimed nutrients in the nutrient declaration or the absence of any nutrient declaration. Overall, 131 claims out of a total 288 nutrition claims (45.5%) had no information on the content of a claimed nutrient, no nutrient declaration or was a general claim. General claims were the claims regarding the high content of vitamins or minerals of a product, without referring to a specific vitamin or mineral. Example of a general claim is “The product is a source of vitamins and minerals”. Only 97 nutrition claims (33.7%) were accompanied by complete and accurate information on the claimed nutrients and their content and thus deemed as credible. For the remaining 60 nutrition claims (20.8%), nutrient content did not meet the established criteria for nutrition content claims from Codex, e.g., the criteria for a “good source of protein” claim is that the product’s protein content should not be less than 10% of the nutrient reference value (NRV) for protein (Table 4).
Table 4.
Credibility of nutrition claims by label language.
Even fewer health claims were credible. One-third of all health claims (n = 160 of 523 claims) were therapeutic claims, prohibited in the EU. Of the remaining types of health claims (n = 363), only 18 claims were found on the list of authorised claims of the EU. Of these, only six claims met the specific criteria of the claims for the nutrient content (Table 5). Claims regulations in the EU authorise claims for specific nutrients/substances or food/food categories, not for the food products carrying the claim [19]. Most of the non-therapeutic health claims on Mongolian products (n = 263 of 309 claims) would be disqualified for use in the EU countries as they were based on a whole food product or its ingredients.
Table 5.
Comparison of health claims with the authorised claims in the EU.
Claims that were in the Mongolian language were less credible than claims in other languages. Only 25.4% (n = 50/197 claims) of nutrition claims in Mongolian were credible versus 51.6% (n = 47 of 91 claims) of the claims in other languages. Nutrient information was not provided for over half of the nutrition claims (53.8%, n = 106) in Mongolian compared to 27.5% (n = 25) of the claims in other languages (Table 4). There were no health claims in the Mongolian language that met the relevant criteria in the comparison country (Table 5).
3.5. Healthiness of Products with Claims
Based on nutrient profiling, 54.2% (n = 140) of products with nutrition claims and 40.5% (n = 184) of products with health claims were less healthy products (Table 6).
Table 6.
Application of nutrient profiling model to the products with nutrition and health claims.
4. Discussion
In this study, approximately 10% (n = 175) of all products carried health claims and 9% (n = 149) carried nutrition claims. The rate of health claims was similar to the findings of other studies from Australia (11%) and South Africa (10.2%) but lower than the prevalence of claims identified in Ireland (17.8%) [17,22,23]. The rate of health claims was higher in Mongolia than previously reported on products from the EU, the USA, Malaysia and Indonesia (0–7.1%) [24,25]. The rate of nutrition claims was much lower than the other countries’ rates [16,23,24,25].
The proportion of unhealthy products with nutrition claims in our study (54.2%) was higher compared to the other studies from Australia, Canada and some EU countries where 29–42% of products carrying nutrition claims had less healthy nutrient profiles [26,27,28]. Likewise, products with health claims were less healthy in our study (40.5% were less healthy) compared to products with health claims in the studies from Australia (31%) and EU countries (30%) [27,28]. In order to prevent unhealthy products to have claims, some countries implement regulations to restrict making claims on certain types of foods or to endorse claims on foods meeting certain nutrient eligibility criteria [8].
This study identified that nutrition and health claims found on food and beverage products in Mongolia had very low levels of credibility. In particular, claims made on products labelled in Mongolian were less credible than claims in other languages. Most health claims were found on Mongolian language products and nearly all of them were not credible. Almost all of the 160 therapeutic health claims were on Mongolian language products. These types of claims are prohibited by Codex Alimentarius and in other countries. This contrasts to other studies, which have reported few cases of such claims on products [17,22,24]. A similar pattern was identified for nutrition claims, whereby only one-third of these claims (33.7%, n = 97) were deemed credible. Lack of supporting information on the content of the claimed nutrients (45.5%, n = 131 of 288 claims) largely contributed to the low credibility of nutrition claims. This finding is exceptional when compared to other studies. For example, a similar survey from Australia found only 7.2% (n = 322) of nutrition claims were not credible [16]. Again, nutrition claims on Mongolian language products were half as likely to be credible than claims on products labelled in other languages.
Such variations in the credibility of claims reflect the status of food labelling regulation in Mongolia and in other countries at the time of the study. A high prevalence of therapeutic claims was also reported in a Serbian study, in which 17% of products had therapeutic claims [29]. At the time of these studies, in both Mongolia and Serbia there was no government regulation on the use of nutrition and health claims, allowing these to be freely used without any independent validation or safeguards. Soon after this survey was conducted, a new Mongolian food labelling standard, MNS 6648:2016, came into force in January 2018 [14]. However, the new standard lacks a clear definition on nutrition and health claims, specification on different types of claims and criteria for making those claims or a substantiation framework for claims, such as minimum criteria for the healthfulness of products bearing a claim. The standard states that claims be approved by an authorised government organisation prior to use, however, a procedure for that has not been developed.
The potential negative impact of claims on food choices and consumption [15,30] can be particularly significant in Mongolia. The results of this study highlight the pervasiveness of poorly regulated food claim practices. In addition, the population has relatively poor levels of nutrition literacy [31] and low awareness on food labelling. The added burden of non-credible claims on less healthy food products may worsen the process of nutrition transition currently underway in Mongolia. Such labelling essentially disseminates misinformation and hinders healthy choices.
The study has several limitations. First, the survey sample does not represent all packaged food products available at the marketplaces in Mongolia. However, using a prior developed list of product categories and an attempt to ensure the representation of domestic and imported products and different brands, the sample captured all common types of packaged products in the marketplace. Second, due to the convenience sampling, calculation of percentages and statistical tests was not possible in some cases due to a small number of claims per comparison group.
5. Conclusions
Mongolia is experiencing rapid nutrition transition, similar to many developing nations. Nutrition labelling policy is increasingly important as marketplaces and population diets are being dominated by processed packaged foods. Major issues in the use of nutrition and health claims in Mongolia were identified, whereby most claims were not credible and not based on scientific evidence and many were found on unhealthy products due to the unregulated and voluntary use of nutrition and health claims by food producers. New food labelling regulation has been introduced in Mongolia since data were collected, however specifications on the use of nutrition and health claims remain weak. Given Mongolian consumers’ relative poor nutrition literacy, it is likely that they are at greater risk of the negative effects of misleading claims on their food choices and consumption. Regulations for food claims are in their early stages of development in Mongolia and more rigorous regulations providing clear guidance about the types of permitted claims and conditions under which claims can be made are needed. The current regulations regarding nutrition and health claims are needed to be upgraded in consultation with the Codex guidelines for use of nutrition and health claims as well as claims regulations of other countries. Awareness of consumers and food producers on nutrition and health claims is needed to be improved.
Author Contributions
Conceptualization, N.C., B.K. and H.Y.; methodology, N.C., B.K. and H.Y.; formal analysis, N.C.; investigation, N.C.; data curation, N.C.; writing—original draft preparation, N.C.; writing—review and editing, N.C., B.K., A.-T.M. and H.Y.; supervision, B.K., A.-T.M. and H.Y.; project administration, N.C. All authors have read and agreed to the published version of the manuscript.
Funding
N.C. is funded by an Endeavour Postgraduate Scholarship of Australian Government.
Acknowledgments
We would like to thank Batjargal Jamiyan (Head of Nutrition Department, National Centre for Public Health, Mongolia), Purevjav Mejeenov (Scientific Secretary, School of Production Technology, University of Science and Technology of Mongolia), Erdenechimeg Erdenebayar (Head of Faculty of Environmental Health, Public Health School, Mongolian National University of Medical Sciences) and Erdenetuya Tumurbaatar (Senior Lecturer, Faculty of Mother and Child Health, Nursing School, Mongolian National University of Medical Sciences), whom provided support in organizing of data collection, as well as students from School of Production Technology of University of Science and Technology of Mongolia and Public Health and Nursing Schools of Mongolian National University of Medical Sciences, whom participated in data collection.
Conflicts of Interest
The authors declare no conflict of interest. The funders had no role in the design of the study; in the collection, analyses, or interpretation of data; in the writing of the manuscript, or in the decision to publish the results.
Appendix A
Table A1.
Product groups and categories covered in the study.
Table A1.
Product groups and categories covered in the study.
| Product Groups and Categories | Number of Products | ||
|---|---|---|---|
| 1 | Milk and dairy products | ||
| 1 | 1.1 | Milk (natural or with added flavour) | 31 |
| 2 | 1.2 | Yogurt (natural or with added fruit) | 32 |
| 3 | 1.3 | Curds, dried curds | 17 |
| 4 | 1.4 | Skim, cream | 5 |
| 5 | 1.5 | Cheese imported | 13 |
| 6 | 1.6 | Other (curd drink, mare milk, ghee, evaporated milk, etc.) | 14 |
| 2 | Meat products | ||
| 7 | 2.1 | Sausage and frankfurter | 56 |
| 8 | 2.2 | Canned and vacuum packaged meat | 20 |
| 9 | 2.3 | Canned fish | 31 |
| 10 | 2.4 | Frozen dumpling and wonton | 38 |
| 11 | 2.5 | Other processed meat (minced meat, patties, meatballs, ham, liver paste, beef jerky, frozen chicken, frozen fish, seafood, sliced meat, chicken, etc.) | 53 |
| 3 | Cereals | ||
| 12 | 3.1 | Flour | 24 |
| 13 | 3.2 | Rice, other grain | 26 |
| 14 | 3.3 | Pasta, noodles | 48 |
| 15 | 3.4 | Bread, bread crumbs | 49 |
| 16 | 3.5 | Cookies, pastry | 177 |
| 17 | 3.6 | Breakfast cereal, oatmeal | 22 |
| 4 | Processed veg and fruit | ||
| 18 | 4.1 | Canned vegetables | 45 |
| 19 | 4.2 | Vacuumed vegetable salads | 22 |
| 20 | 4.3 | Fruit and vegetable purée and sauce | 16 |
| 21 | 4.4 | Fruit compote | 25 |
| 22 | 4.5 | Jam | 44 |
| 23 | 4.6 | Other (laver, kimchi, etc.) | 11 |
| 5 | Sweets | ||
| 24 | 5.1 | Biscuits, wafers | 102 |
| 25 | 5.2 | Chocolate | 56 |
| 26 | 5.3 | Candies (packaged caramels, soft candy, butterscotch, jelly candy, draje and marmalade, etc.) | 52 |
| 27 | 5.4 | Ice cream | 73 |
| 28 | 5.5 | Honey | 37 |
| 29 | 5.7 | Other (choco pie, assorted chocolate, chocolate biscuit, chocolate spread, sugar, etc.) | 54 |
| 6 | Snacks | ||
| 30 | 6.1 | Chips | 44 |
| 31 | 6.2 | Crackers, extruded snacks | 24 |
| 32 | 6.3 | Nuts (packed) | 34 |
| 33 | 6.4 | Dried fruits (packed) | 22 |
| 7 | Ready to eat meals | ||
| 34 | 7.1 | Meals (packaged meals, burger, sandwiches, pizza, bun, etc.) | 12 |
| 35 | 7.2 | Instant soups, instant noodles | 37 |
| 8 | Beverages | ||
| 36 | 8.1 | Soft drinks | 37 |
| 37 | 8.2 | Fruit drinks, 100% fruit juice | 64 |
| 38 | 8.3 | Bottle tea, energy drink, flavoured water | 29 |
| 39 | 8.4 | Bottle water, carbonated water, mineral water | 6 |
| 9 | Edible oils and fat | ||
| 40 | 9.1 | Butter, margarine | 11 |
| 41 | 9.2 | Vegetable oil | 29 |
| 42 | 9.3 | Mayonnaise | 12 |
| 10 | Seasonings | ||
| 43 | 10.1 | Ketchup, tomato pasta | 23 |
| 44 | 10.2 | Salad dressings, sauce, vinegar | 41 |
| 45 | 10.3 | Other spices and condiments | 40 |
| 11 | Other | ||
| 46 | 11.1 | Tea, coffee, coffee cream | 29 |
| 47 | 11.2 | Egg | 16 |
| 48 | 11.3 | Infant formula, weaning food | 11 |
| 49 | 11.4 | Tofu | 6 |
| 50 | 11.5 | Аlcohol, beer | 3 |
| 1723 | |||
Table A2.
Nutrient function claims by attributable health benefits.
Table A2.
Nutrient function claims by attributable health benefits.
| Health Benefit the Claim Refers to | Nutrients Linked to the Claim | Nutrition Claim (n) | ||
|---|---|---|---|---|
| Total | The Claim Based on | |||
| Nutrients | Ingredients or Whole Food | |||
| Prevents obesity; helps in weight control and maintaining normal weight; suitable for dieting; suppresses appetite | fibre, unsaturated fat, low fat, protein, vitamin D | 33 | 12 | 21 |
| Improves appetite; supports digestive system; helps in stomach discomfort; supports growth of bifidobacteria | vitamin B1, B12, fibre, high in protein, magnesium, galactooligosaccharide | 27 | 8 | 19 |
| Stabilizes/supports heart function, cardiovascular system and blood circulation; stabilizes blood pressure; favorable effects on blood vessels | vitamin B1, omega 7 | 26 | 2 | 24 |
| Facilitates excretion of toxic substances; cleansing the organism; has de-toxic effect | fibre, protein unsaturated fat | 22 | 4 | 18 |
| Supports bone development and maintains normal growth | calcium, iron, protein, carbohydrate, fat | 17 | 6 | 11 |
| Relieves fatigue | vitamin PP, E, folic acid, zinc, iron, manganese | 10 | 2 | 8 |
| Supports nervous system and brain development | vitamin B1, iodine | 9 | 4 | 5 |
| Supports immunity | selenium, vitamin C | 8 | 2 | 6 |
| Protects against flu and cold | vitamin PP, E, folic acid, zinc, iron, manganese, phosphorus | 6 | 2 | 4 |
| Supports blood cell formation | vitamin PP, E, folic acid, zinc, iron, manganese | 5 | 1 | 4 |
| Participates in/supports metabolism | vitamin B2 | 3 | 1 | 2 |
| Supports liver and gallbladder function | NA | 2 | 0 | 2 |
| Supports respiratory function | NA | 2 | 0 | 2 |
| Maintains normal sight | vitamin B2 | 2 | 1 | 1 |
| Supports kidney function | NA | 1 | 0 | 1 |
| Supports endocrine system | NA | 1 | 1 | 0 |
| Supports muscle development | NA | 1 | 1 | 0 |
| Healthy skin | NA | 1 | 0 | 1 |
| Total | 176 (100.0) | 47(26.7) | 129 (73.3) | |
NA—not applicable.
Table A3.
Other function claims by attributable health benefits.
Table A3.
Other function claims by attributable health benefits.
| Health Benefit the Claim Refers to | Nutrients Linked to the Claim | Substances Linked to the Claim | Other Function Claim (n) | ||
|---|---|---|---|---|---|
| Total | The Claim Based on | ||||
| Nutrients/Substances | Ingredients or Whole Food | ||||
| Improves colon function; helps in constipation; improves stomach function; normalize useful gut flora | fibre, protein, magnesium, inulin | probiotic bacteria bifidobacteria | 35 | 11 | 24 |
| Improves intestine peristalsis | fibre, unsaturated fat vitamin B, folic acid, calcium, iron | lignans | 29 | 3 | 26 |
| Improves immunity | nucleotides | NA | 21 | 4 | 17 |
| Improves/boosts metabolism | NA | probiotic bacteria | 11 | 4 | 7 |
| Improves mental capacity and memory; improves brain function | vitamin B1, B, iron | NA | 8 | 3 | 5 |
| improves heart function, cardiovascular system; decreases blood pressure | NA | NA | 8 | 0 | 8 |
| Builds strong bones and accelerates growth | NA | NA | 7 | 0 | 7 |
| Builds strong teeth and gums | NA | NA | 6 | 0 | 6 |
| Slows down aging | omega 7, unsaturated fat | NA | 6 | 2 | 4 |
| Releases edema | NA | NA | 5 | 0 | 5 |
| Facilitates excretion of toxic substances; cleansing the organism; has de-toxic effect | NA | lactic acid bacteria | 3 | 3 | 0 |
| Improves liver and gallbladder function | NA | NA | 2 | 0 | 2 |
| Increases breast milk production | vitamin E, F | NA | 2 | 1 | 1 |
| Reduces cough | NA | NA | 1 | 0 | 1 |
| Improves kidney function | NA | NA | 2 | 0 | 2 |
| Improves respiratory function | NA | NA | 1 | 0 | 1 |
| Improves eye sight; improves night sight | vitamin PP, E, folic acid, zinc, iron, manganese | NA | 1 | 1 | 0 |
| Total | 148 (100.0) | 32 (21.6) | 116 (78.4) | ||
NA—not applicable.
Table A4.
Therapeutic claims by attributable health benefits.
Table A4.
Therapeutic claims by attributable health benefits.
| Health Benefit the Claim Refers to | Nutrients Linked to the Claim | Substances Linked to the Claim | Therapeutic Claim (n) | ||
|---|---|---|---|---|---|
| Total | The Claim Based on | ||||
| Nutrients/Substances | Ingredients or Whole Food | ||||
| Prevents cancer | essential amino acids fibre, protein | flavonoids | 15 | 1 | 14 |
| Prevents osteoporosis | NA | NA | 9 | 0 | 9 |
| Prevents CVD, heart diseases and stroke | unsaturated fat, fibre low in saturated fat and cholesterol | Luteolin flavonoids | 9 | 3 | 6 |
| Prevents digestive system, gastritis, increased stomach acidity, and stomach and colon ulcers | fibre, protein | NA | 6 | 1 | 5 |
| Prevents high blood pressure | NA | lignans | 4 | 2 | 2 |
| Prevents diabetes | fibre | lignans | 3 | 1 | 2 |
| Prevents iron deficiency and anemia | NA | NA | 3 | 0 | 3 |
| Prevents iodine deficiency and goiter | NA | NA | 3 | 0 | 3 |
| Prevents paralysis, epilepsies and seizure | NA | NA | 3 | 0 | 3 |
| Prevents diseases | NA | NA | 2 | 0 | 2 |
| Prevents urinal diseases and kidney diseases | NA | NA | 2 | 0 | 2 |
| Prevents arthritis | NA | NA | 2 | 0 | 2 |
| Prevent allergy | NA | NA | 2 | 0 | 2 |
| Prevents kidney and bile stones | NA | NA | 1 | 0 | 1 |
| Prevents tooth diseases | NA | NA | 1 | 0 | 1 |
| Prevents vitamin and mineral deficiencies | NA | NA | 1 | 0 | 1 |
| Helps in diabetes; suitable for diabetics | fibre, protein, vitamin D magnesium | NA | 15 | 5 | 10 |
| Heals digestive system, gastritis, increased stomach acidity, and stomach and colon ulcers | omega 7, high in protein | NA | 11 | 1 | 10 |
| Helps in CVD and heart diseases | essential amino acids | NA | 9 | 2 | 7 |
| Reduces liver fat and bile condensation; heals liver and gallbladder diseases | NA | NA | 6 | 0 | 6 |
| Helps in kidney and bile stones | NA | NA | 5 | 0 | 5 |
| Heals bronchitis, pneumonia, tuberculosis and respiratory diseases | NA | NA | 5 | 0 | 5 |
| Helps in/suppresses the progression of cancer | NA | luteolin | 5 | 1 | 4 |
| Heals high blood pressure | fibre, unsaturated fat | NA | 5 | 2 | 3 |
| Helps in urinal diseases and kidney diseases | NA | NA | 4 | 0 | 4 |
| Heals atherosclerosis | fibre, unsaturated fat | NA | 4 | 1 | 3 |
| Heals skin diseases | NA | NA | 3 | 0 | 3 |
| Helps in iron deficiency and anemia | NA | NA | 3 | 0 | 3 |
| Heals arthritis | NA | NA | 3 | 0 | 3 |
| Accelerates healing of chronic hepatitis | vitamin PP | NA | 2 | 1 | 1 |
| Heals osteoporosis | NA | NA | 2 | 0 | 2 |
| Heals sore mouth | NA | NA | 2 | 0 | 2 |
| Helps in poor vision and eye diseases | NA | NA | 2 | 0 | 2 |
| Heals sore, wounds and burns; has anti-inflammatory effect | vitamin PP, fibre protein | NA | 2 | 1 | 1 |
| Heals bone fracture and injury | NA | NA | 1 | 0 | 1 |
| Alleviates pancreases | NA | NA | 1 | 0 | 1 |
| Helps in tympanitis | NA | NA | 1 | 0 | 1 |
| Effective against dementia | NA | NA | 1 | 0 | 1 |
| Has remedy effects | NA | NA | 1 | 0 | 1 |
| Heals vitamin and mineral deficiencies | NA | NA | 1 | 0 | 1 |
| Total | 160 (100.0) | 22 (13.8) | 138 (86.2) | ||
NA—not applicable.
Table A5.
Reduction of disease risk claims by attributable health benefits.
Table A5.
Reduction of disease risk claims by attributable health benefits.
| Health Benefit the Claim Refers to | Nutrients Linked to the Claim | Substances Linked to the Claim | Reduction of Disease Risk Claim (n) | ||
|---|---|---|---|---|---|
| Total | The Claim Based on | ||||
| Nutrients/Substances | Ingredients or Whole Food | ||||
| Reduces/maintains blood cholesterol level | fibre, omega 7 | NA | 13 | 2 | 11 |
| Reduces/maintains blood sugar level | omega 7, fibre, protein | NA | 9 | 2 | 7 |
| Reduces risk of CVD, heart diseases and stroke | unsaturated fat, fibre low in saturated fat and cholesterol | Luteolin flavonoids | 8 | 6 | 2 |
| Reduces risk of cancer | NA | bifidobacteria | 3 | 2 | 1 |
| Reduces risk of Alzheimer’s and Parkinson’s diseases | NA | NA | 1 | 1 | 0 |
| Reduces risk of osteoporosis | calcium | NA | 1 | 1 | 0 |
| Reduces risk of high blood pressure | NA | lignans | 1 | 1 | 0 |
| Reduces risk of diabetes | NA | lignans | 3 | 1 | 2 |
| Total | 39 (100.0) | 16 (41.0) | 23 (59.0) | ||
NA—not applicable.
References
- World Health Organization. Non-Communicable Diseases Country Profiles 2018; World Health Organization: Geneva, Switzerland, 2018; Available online: https://apps.who.int/iris/handle/10665/274512 (accessed on 10 June 2020).
- Popkin, B.M. Nutritional Patterns and Transitions. Popul. Dev. Rev. 1993, 19, 138–157. [Google Scholar] [CrossRef]
- Popkin, B.M. Part II. What is unique about the experience in lower-and middle-income less-industrialized countries compared with the very-high income industrialized countries? The shift in stages of the nutrition transition in the developing world differs from past experiences! Public Health Nutr. 2002, 5, 205–214. [Google Scholar] [PubMed]
- Popkin, B.M. Nutrition transition and the global diabetes epidemic. Curr. Diab. Rep. 2015, 15, 64–78. [Google Scholar] [CrossRef] [PubMed]
- Codex Alimentarius Commission. Guidelines on Nutrition Labelling (CAC/GL 2-1985). Available online: http://www.fao.org/ag/humannutrition/33309-01d4d1dd1abc825f0582d9e5a2eda4a74.pdf (accessed on 20 June 2020).
- Codex Alimentarius Commission. Guidelines for Use of Nutrition and Health Claims (CAC/GL 23-1997). Available online: http://www.fao.org/ag/humannutrition/32444-09f5545b8abe9a0c3baf01a4502ac36e4.pdf (accessed on 20 June 2020).
- Lartey, A.; Hemrich, G.; Amoroso, L. Introduction: Influencing food environments for healthy diets. In Influencing Food Environments for Healthy Diets; Food and Agriculture Organization of the United Nations: Rome, Italy, 2016; pp. 1–15. [Google Scholar]
- Hawkes, C. Nutrition Labels and Health Claims: The Global Regulatory Environment; World Health Organization: Paris, France, 2004; pp. 42–47. [Google Scholar]
- Kaur, A.; Scarborough, P.; Rayner, M. A systematic review, and meta-analyses, of the impact of health-related claims on dietary choices. Int. J. Behav. Nutr. Phys. Act. 2017, 14, 93. [Google Scholar] [CrossRef] [PubMed]
- Shagdar, E. Mongolia’s Foreign Trade, 1985–2003. ERINA Report. Available online: https://www.researchgate.net/publication/242783433_Mongolia’s_Foreign_Trade_1985–2003 (accessed on 24 June 2020).
- World Health Organisation. ЭРҮҮЛ МЭНДИЙН ҮЗҮҮЛЭЛТ. Available online: http://hdc.gov.mn/media/uploads/2020-02/Eruul_mendiin_uzuulelt-2017_on-2018.0625.pdf (accessed on 18 June 2020).
- Ministry of Health of Mongolia, National Center for Public Health (Mongolia), UNICEF. Nutrition Status of the Population of Mongolia, Fifth National Nutrition Survey Report; National Center for Public Health (Mongolia): Ulaanbaatar, Mongolia, 2017.
- Codex Alimentarius Commission. General Standard for the Labelling of Prepackaged Foods (CXS 1-1985). Available online: http://www.fao.org/fao-who-codexalimentarius/sh-proxy/en/?lnk=1&url=https%253A%252F%252Fworkspace.fao.org%252Fsites%252Fcodex%252FStandards%252FCXS%2B1-1985%252FCXS_001e.pdf (accessed on 20 June 2020).
- Mongolian Agency for Standardization and Metrology. Standard of Mongolia. Requirements for Labelling of Prepackaged Foods MNS 6648:2016; Mongolian Agency for Standardization and Metrology: Ulaanbaatar, Mongolia, 2016. [Google Scholar]
- Oostenbach, L.H.; Slits, E.; Robinson, E.; Sacks, G. Systematic review of the impact of nutrition claims related to fat, sugar and energy content on food choices and energy intake. BMC Public Health 2019, 19, 1296. [Google Scholar] [CrossRef] [PubMed]
- Williams, P.; Yeatman, H.; Zakrzewski, S.; Aboozaid, B.; Henshaw, S.; Ingram, K.; Rankine, A.; Walcott, S.; Ghani, F. Nutrition and related claims used on packaged Australian foods-implications for regulation. Asia Pac. J. Clin. Nutr. 2003, 12, 138–150. [Google Scholar]
- Williams, P.; Yeatman, H.; Ridges, L.; Houston, A.; Rafferty, J.; Ridges, A.; Roesler, L.; Sobierajski, M.; Spratt, B. Nutrition function, health and related claims on packaged Australian food products-prevalence and compliance with regulations. Asia Pac. J. Clin. Nutr. 2006, 15, 10–20. [Google Scholar]
- National Statistical Office of Mongolia, World Bank, United Nations Development Programme. Main Report of “Household Income and Expenditure Survey/Living standards Measurement Survey” 2002–2003; National Statistical Office of Mongolia: Ulaanbaatar, Mongolia, 2004. [Google Scholar]
- European Commission. EU Register on Nutrition and Health Claims. Available online: https://ec.europa.eu/food/safety/labelling_nutrition/claims/register/public/?event=search (accessed on 12 June 2020).
- World Integrated Trade Solution. Mongolia Food Product Imports by Country and Region. In USA Thousand 2018. Available online: https://wits.worldbank.org/CountryProfile/en/Country/MNG/Year/2018/TradeFlow/Import/Partner/all/Product/16-24_FoodProd/Show/Partner%20Name;MPRT-TRD-VL;MPRT-PRDCT-SHR;AHS-WGHTD-AVRG;MFN-WGHTD-AVRG;/Sort/MPRT-TRD-VL/Chart/top10 (accessed on 6 October 2020).
- World Health Organization. WHO Nutrient Profile Model for the Western Pacific Region: A Tool to Protect. Children from Food Marketing; WHO Regional Office for the Western Pacific Manila: Manila, Philippines, 2016. [Google Scholar]
- Kasapila, W.; Shaarani, S.M. A survey of nutrition labelling on packaged foodstuffs sold in Malawi: Manufacturer practices and legislative issues. Food Control 2013, 30, 433–438. [Google Scholar] [CrossRef]
- Lalor, F.; Kennedy, J.; Flynn, M.A.T.; Wall, P.G. A study of nutrition and health claims—A snapshot of whats on the Irish market. Public Health Nutr. 2010, 13, 704–711. [Google Scholar] [CrossRef] [PubMed]
- Lwin, M.O. Comparative practices of food label claims from US, EU and selected Southeast Asian countries. J. Consum. Mark. 2015, 32, 530–541. [Google Scholar] [CrossRef]
- Brecher, S.J.; Bender, M.M.; Wilkening, V.L.; McCabe, N.M.; Anderson, E.M. Status of nutrition labeling, health claims, and nutrient content claims for processed foods: 1997 Food Label and Package Survey. J. Am. Diet. Assoc. 2000, 100, 1057–1062. [Google Scholar] [CrossRef]
- Franco-Arellano, B.; Labonte, M.; Bernstein, J.T.; L’Abbe, M.R. Examining the nutritional quality of canadian packaged foods and beverages with and without nutrition claims. Nutrients 2018, 10, 832. [Google Scholar] [CrossRef] [PubMed]
- Hughes, C.; Wellard, L.; Lin, J.; Suen, K.L.; Chapman, K. Regulating health claims on food labels using nutrient profiling: What will the proposed standard mean in the Australian supermarket? Public Health Nutr. 2013, 16, 2154–2161. [Google Scholar] [CrossRef] [PubMed]
- Kaur, A.; Scarborough, P.; Hieke, S.; Kusar, A.; Pravst, I.; Raats, M.; Rayner, M. The nutritional quality of foods carrying health-related claims in Germany, The Netherlands, Spain, Slovenia and the United Kingdom. Eur. J. Clin. Nutr. 2016, 70, 1388–1395. [Google Scholar] [CrossRef] [PubMed]
- Davidović, D.B.; Tomić, D.V.; Paunović, K.Z.; Vasiljević, N.D.; Jorga, J.B. Nutrition labelling of pre-packaged foods in Belgrade, Serbia: Current situation. Public Health Nutr. 2015, 18, 1969–1978. [Google Scholar] [CrossRef] [PubMed]
- Kelly, B.; Hughes, C.; Chapman, K.; Louie, J.C.-Y.; Dixon, H.; Crawford, J.; King, L.; Daube, M.; Slevin, T. Consumer testing of the acceptability and effectiveness of front-of-pack food labelling systems for the Australian grocery market. Health Promot. Int. 2009, 24, 120–129. [Google Scholar] [CrossRef] [PubMed]
- Government of Mongolia; Food and Agriculture Organization. Country Programming Framework (CPF) 2012–2016, For Cooperation and Partnership between the Food and Agriculture Organization of the United Nations (FAO) and the Government of Mongolia (GOM). Available online: http://www.fao.org/documents/card/en/c/59f952f6-0f6b-4d99-9a37-109a16c68bcc/ (accessed on 18 July 2020).

© 2020 by the authors. Licensee MDPI, Basel, Switzerland. This article is an open access article distributed under the terms and conditions of the Creative Commons Attribution (CC BY) license (http://creativecommons.org/licenses/by/4.0/).