Optimization of Regional Water-Energy-Food Systems Based on Interval Number Multi-Objective Programming: A Case Study of Ordos, China


Abstract
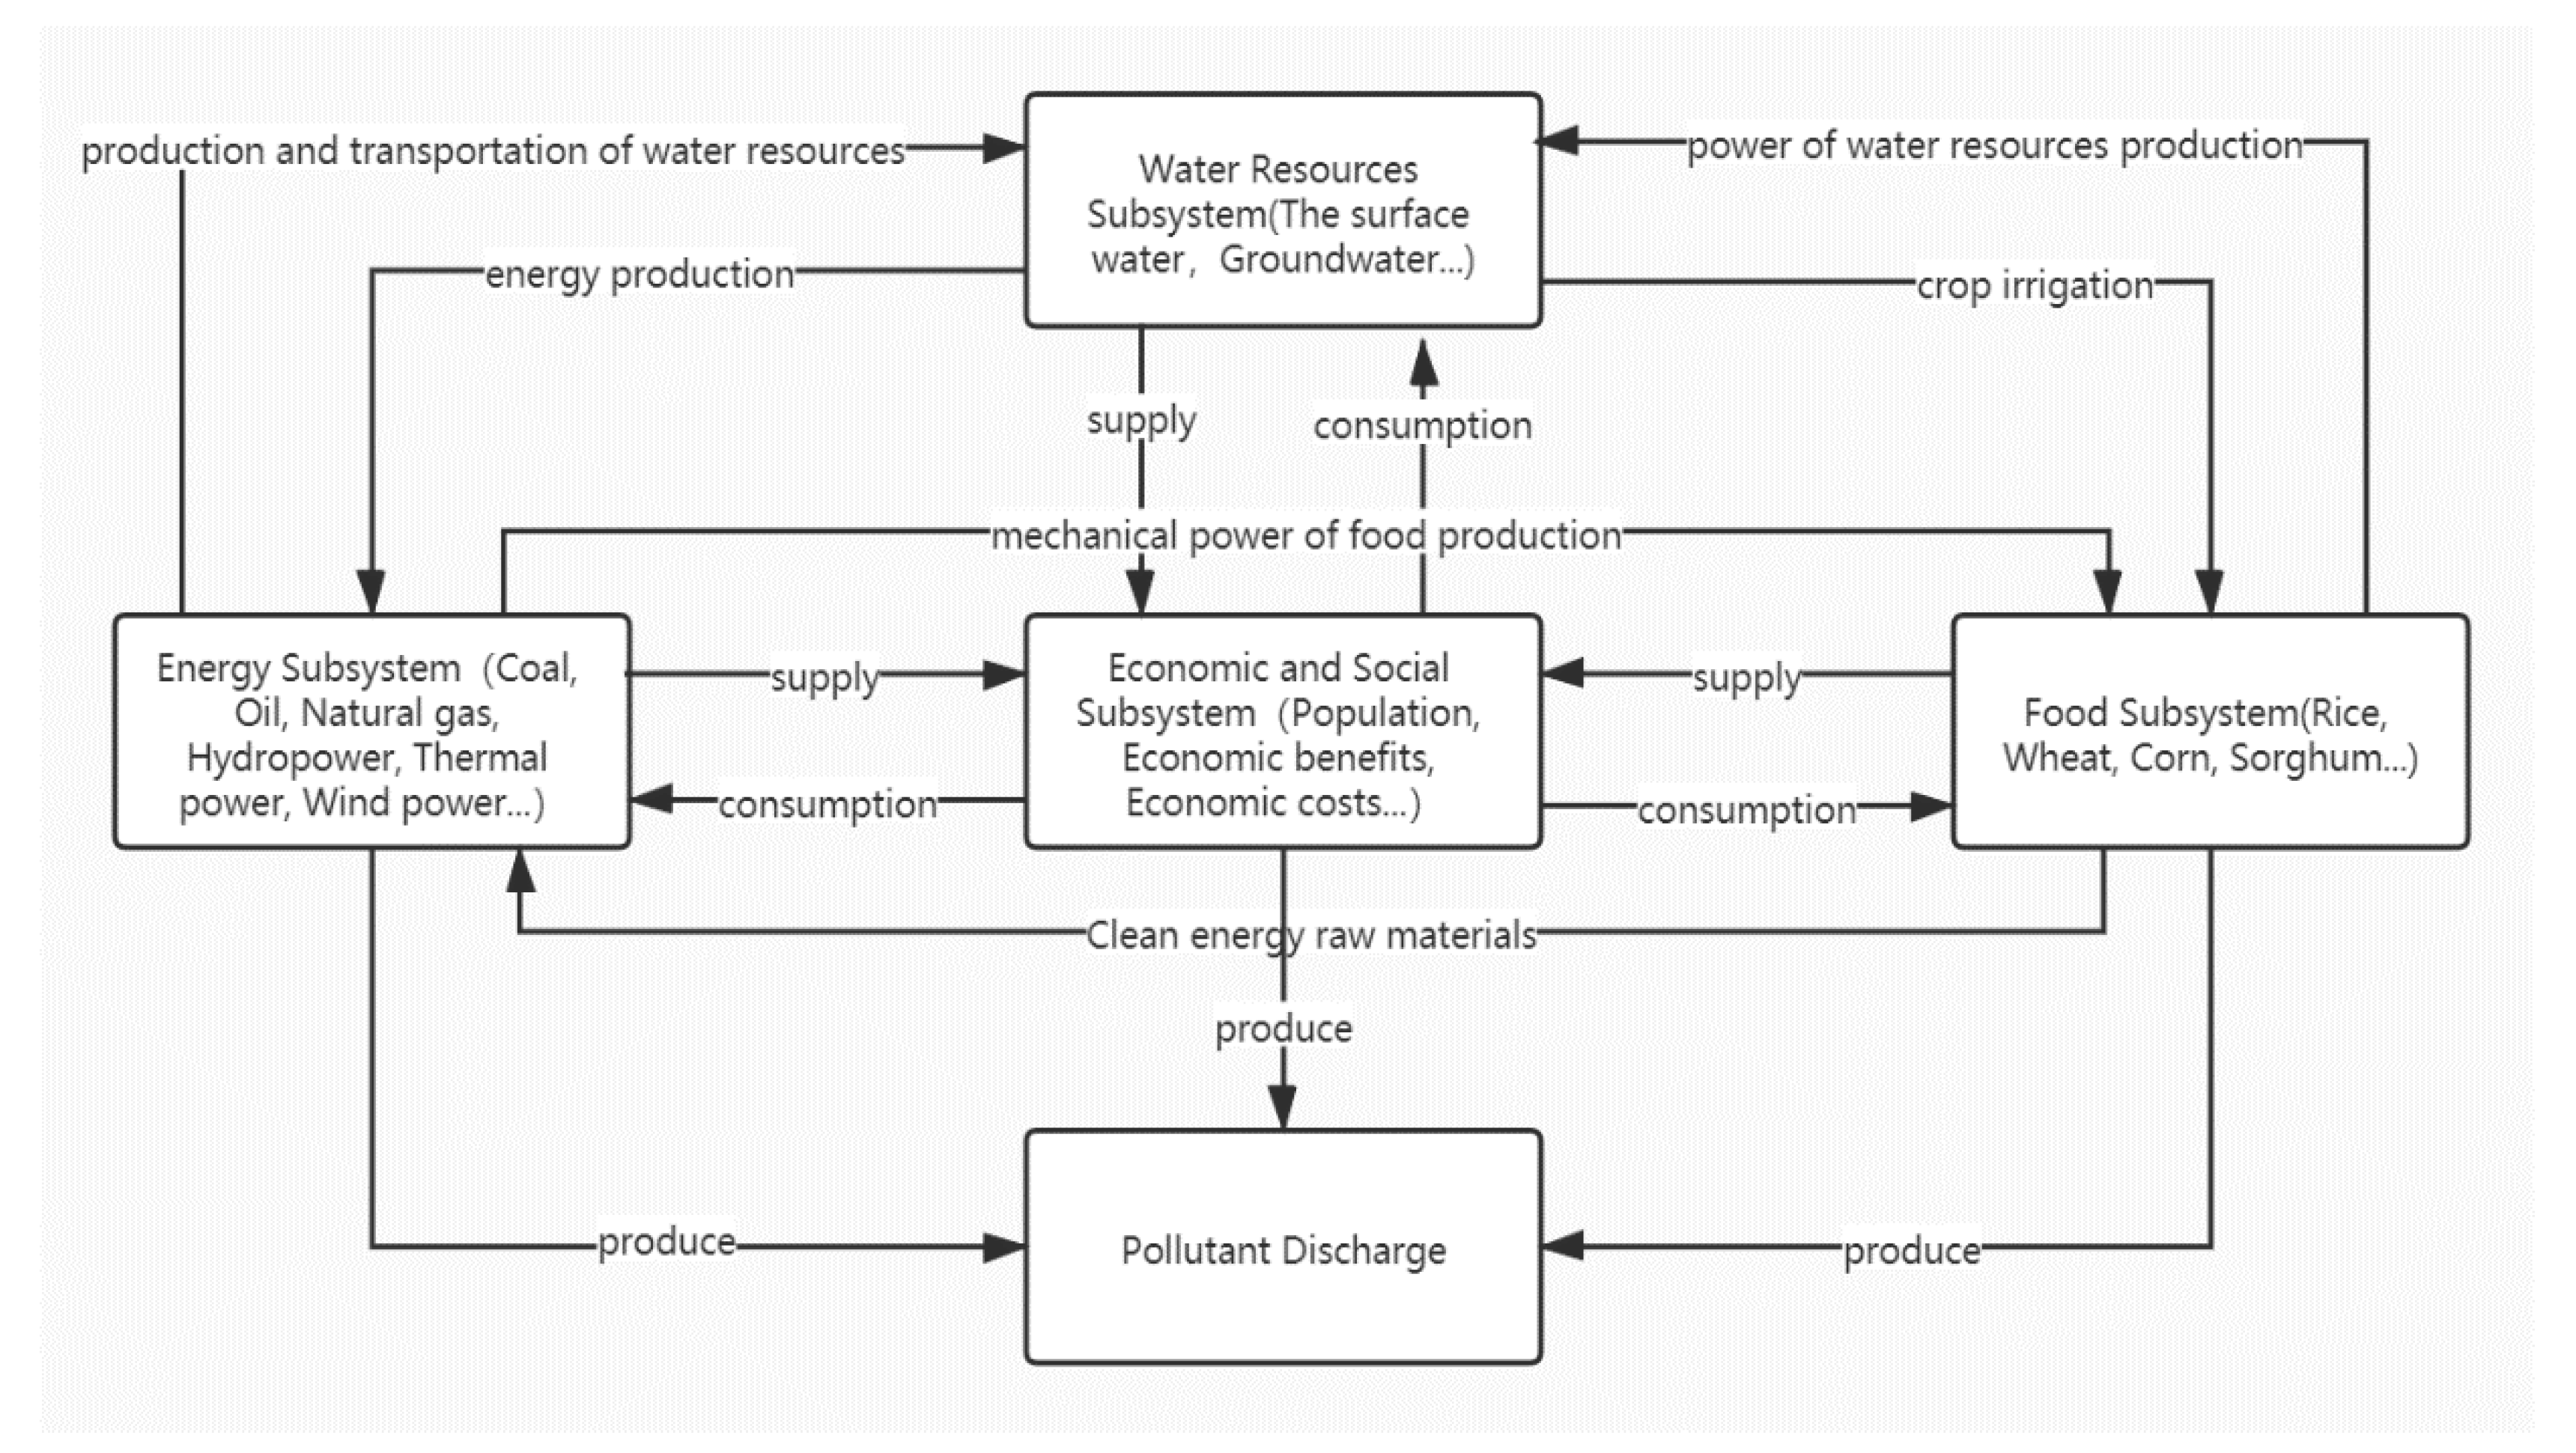
:1. Introduction
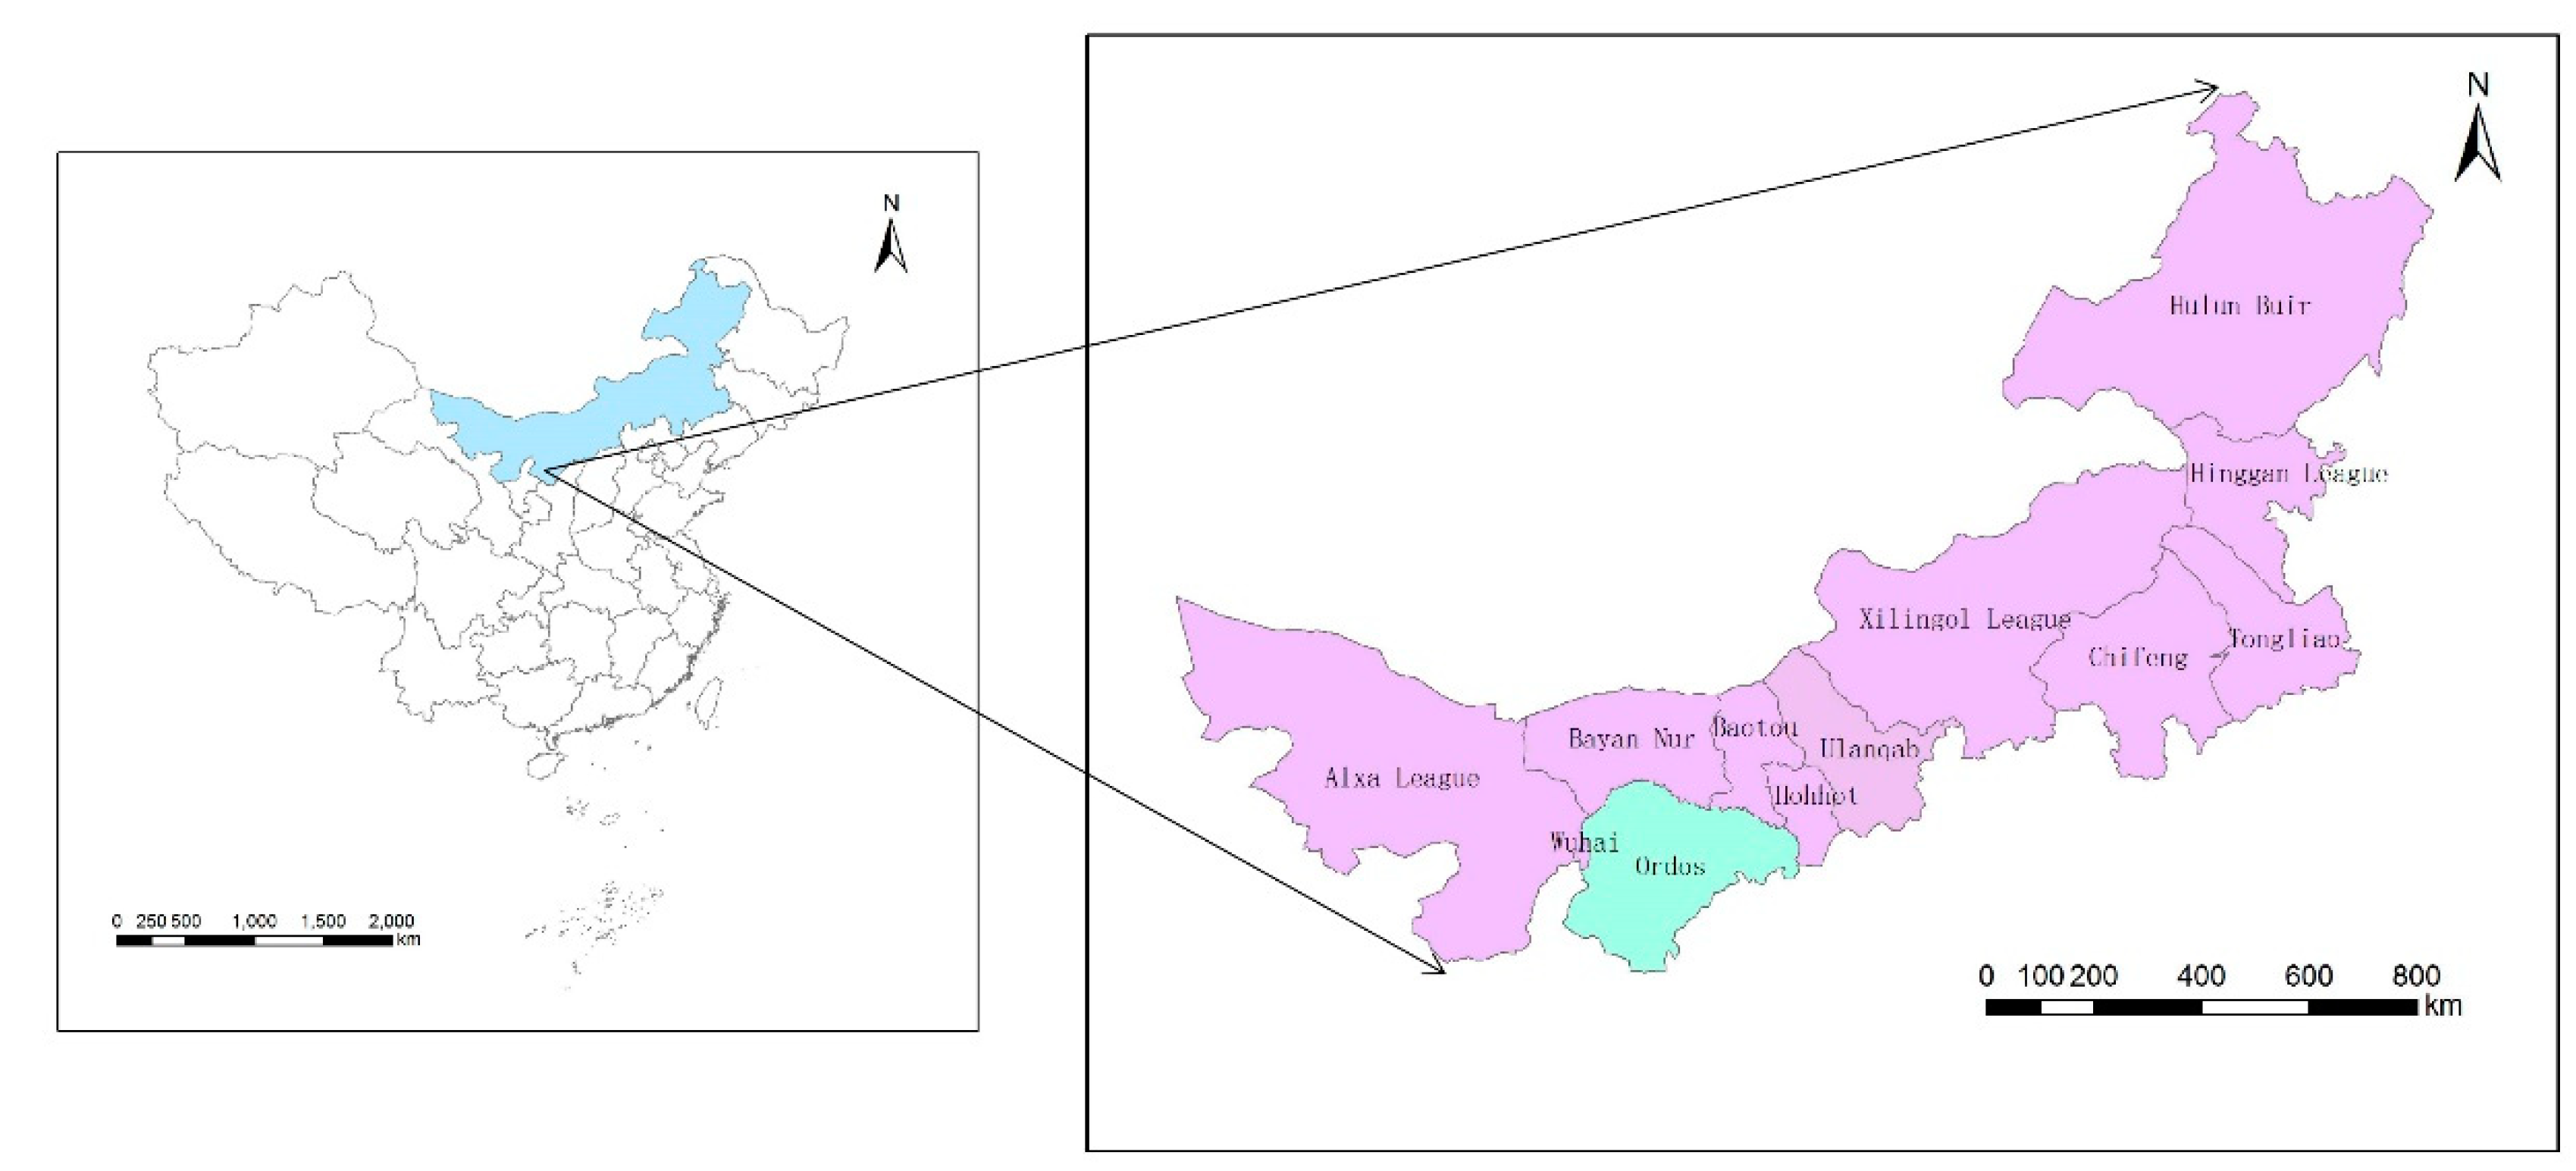
2. Study Area and Data Sources
3. Methodology
3.1. Decision Variables
3.2. Objective Function
3.3. Restrictions
3.3.1. Economic Benefit Constraints
3.3.2. The Supply and Demand of Water Resource Constraints
3.3.3. Energy Production Constraints
3.3.4. Food Production Constraints
3.3.5. Environmental Emission Constraints
3.3.6. Non-Negative Constraint
4. Results and Discussion
4.1. Parameter Estimation
4.1.1. Determination of Social Economic Parameters
4.1.2. Determination of Water Resources Utilization Parameters
4.1.3. Determination of Energy Production Parameters
4.1.4. Determination of Food Production Parameters
4.1.5. Determination of Environmental Pollution Parameters
4.2. Target Expectation Level
4.3. Determine Decision Variables
4.4. Result Analysis and Discussion
5. Conclusions
Supplementary Materials
Author Contributions
Funding
Conflicts of Interest
References
- Golam, R. Food, water, and energy security in South Asia: A nexus perspective from the Hindu Kush Himalayan region. Environ. Sci. Policy 2014, 39, 35–48. [Google Scholar]
- Putra, F.; Prajal, P.; Kropp, J.P. A systematic analysis of Water-Energy-Food security nexus: A South Asian case study. Sci. Total Environ. 2020, 728, 138451. [Google Scholar] [CrossRef] [PubMed]
- Jia, S.F. Dialogue with Researcher Jia Shaofeng-Seeking a win-win solution for water, energy and food security—A case study of Ordos City, Inner Mongolia Autonomous Region. China Water Resour. 2017, 11, 59–62. [Google Scholar]
- World Economic Forum. Global Risks 2011 Report, 6th ed.; World Economic Forum: Cologne, Germany, 2011. [Google Scholar]
- Guillaume, J.H.A.; Kummu, M.; Eisner, S.; Varis, O. Transferable Principles for Managing the Nexus: Lessons from Historical Global Water Modeling of Central Asia. Water 2015, 7, 4200–4231. [Google Scholar] [CrossRef] [Green Version]
- Yan, X.X.; Jiang, D.; Fu, J.Y.; Hao, M. Assessment of sweet sorghum-based ethanol potential in China within the water–energy–food nexus framework. Sustainability 2018, 10, 1046. [Google Scholar] [CrossRef] [Green Version]
- Chen, J.F.; Ding, T.H.; Li, M.; Wang, H.M. Multi-objective optimization of a regional water–energy–food system considering environmental constraints: A case study of Inner Mongolia, China. Int. J. Environ. Res. Public Health 2020, 17, 6834. [Google Scholar] [CrossRef]
- Endo, A.; Tsurita, I.; Burnett, K.; Orencio, P.M. A review of the current state of research on the water, energy, and food nexus. J. Hydrol. Reg. Stud. 2017, 11, 20–30. [Google Scholar] [CrossRef] [Green Version]
- Heard, B.R.; Miller, S.A.; Liang, S.; Xu, M. Emerging challenges and opportunities for the food-energy-water nexus in urban systems. Curr. Opin. Chem. Eng. 2017, 17, 48–53. [Google Scholar] [CrossRef]
- Chang, Y.; Xia, P.; Wang, J.P. An overview of the water-energy-food relationship and its enlightenment to my country. Water Dev. Res. 2016, 16, 67–70. [Google Scholar]
- Amorim, W.S.D.; Valduga, I.B.; Ribeiro, J.M.P.; Williamson, V.G.; Krauser, G.E.; Magtoto, M.K.; Andrade, J.B.S.O. The nexus between water, energy and food in the context of the global risks: An analysis of the interactions between food, water, and energy security. Environ. Impact Assess. Rev. 2018, 72, 1–11. [Google Scholar] [CrossRef]
- Hoff, H. Understanding the Nexus. In Proceedings of the Background Paper for the Bonn 2011 Conference: The Water, Energy and Food Security Nexus, Stockholm Environment Institute, Stockholm, Sweden, 11 November 2011. [Google Scholar]
- Nhamo, L.; Ndlela, B.; Nhemachena, C.; Mabhaudhi, T.; Mpandeli, S.; Matchaya, G. The Water-Energy-Food Nexus: Climate Risks and Opportunities in Southern Africa. Water 2018, 10, 567. [Google Scholar] [CrossRef] [Green Version]
- Howells, M.; Hermann, S.; Welsch, M.; Bazilian, M.; Segerstrom, R.; Alfstad, T.; Gielen, D.; Rogner, H.; Fischer, G.; van Velthnizen, H.; et al. Integrated analysis of climate change, land-use, energy and water strategies. Nat. Clim. Chang. 2013, 3, 621–626. [Google Scholar] [CrossRef]
- Yan, X.C.; Fang, L.; Mu, L. How does the water-energy-food nexus work in developing countries? An empirical study of China. Sci. Total Environ. 2020, 716, 134791. [Google Scholar] [CrossRef] [PubMed]
- Xu, S.S.; He, W.J.; Shen, J.Q.; Degefu, D.M.; Yuan, L.; Kong, Y. Coupling and coordination degrees of the core water–energy–food nexus in China. Int. J. Environ. Res. Public Health 2019, 16, 1648. [Google Scholar] [CrossRef] [PubMed] [Green Version]
- Chen, J.F.; Ding, T.H.; Wang, H.M.; Yu, X.Y. Research on total factor productivity and influential factors of the regional water–energy–food nexus: A case study on Inner Mongolia, China. Int. J. Environ. Res. Public Health 2019, 16, 3051. [Google Scholar] [CrossRef] [Green Version]
- Sahin, O.Z.; Stewart, R.A.; Richards, R.G. Addressing the Water-Energy-Climate Nexus Conundrum: A System Approach. In Proceedings of the 7th International Congress on Environment Modelling and Software, San Diego, CA, USA, 15–19 June 2014. [Google Scholar]
- Li, G.J.; Li, Y.L.; Jia, X.J.; Du, L.; Huang, D.H. Establishment and Simulation Study of System Dynamic Model on Sustainable Development of Water-Energy-Food Nexus in Beijing. Bus. Rev. 2016, 28, 11–26. [Google Scholar]
- Javadinejad, S.; Ostad-Ali-Askari, K.; Eslamian, S. Application of Multi-Index Decision Analysis to Management Scenarios Considering Climate Change Prediction in the Zayandeh Rud River Basin. Water Conserv. Sci. Eng. 2019, 4, 1–18. [Google Scholar] [CrossRef]
- Wang, B.; Li, W.; Huang, G.H.; Liu, L.; Ji, L.; Li, Y. Urban water resources allocation under the uncertainties of water supply and demand: A case study of Urumqi, China. Environ. Earth Sci. 2015, 74, 3543–3557. [Google Scholar] [CrossRef]
- Gong, X.H.; Zhang, H.B.; Ren, C.F.; Sun, D.Y.; Yang, J.T. Optimization allocation of irrigation water resources based on crop water requirement under considering effective precipitation and uncertainty. Agric. Water Manag. 2020, 239, 106264. [Google Scholar] [CrossRef]
- Ju, L.W.; Tan, Z.F.; Li, H.H.; Tan, Q.K.; Yu, X.B.; Song, X.H. Multi-objective operation optimization and evaluation model for CCHP and renewable energy based on hybrid energy system driven by distribute energy resources in China. Energy 2016, 111, 322–340. [Google Scholar] [CrossRef] [Green Version]
- Su, M.R.; Chen, C.; Yang, Z.F. Urban energy structure optimization at the sector scale: Considering environmental impact based on life cycle assessment. J. Clean. Prod. 2016, 112, 1464–1474. [Google Scholar] [CrossRef]
- Guo, Z.L.; Zhao, X. Evolution and structure optimization of grain and cash crops in Shandong province based on 1986~2015 statistics data. J. China Agric. Resour. Reg. Plan. 2017, 38, 164–171. [Google Scholar]
- Cai, Z.; Qian, W.R. Evaluation analysis and structural optimization of crop planting structure in northeast China. Fresenius Environ. Bull. 2017, 26, 7327–7333. [Google Scholar]
- Cao, X.; Shamxi, A.; Jin, X.B.; Zhou, Y.K. Planting Structure Optimization in the Arid Area with Constrained Water Resources: A Case Study of Korla Xinjiang. Resour. Sci. 2011, 33, 1714–1719. [Google Scholar]
- Zhen, J.L.; Wu, C.B.; Liu, X.R.; Huang, G.H.; Liu, Z.P. Energy-water nexus planning of regional electric power system within an inexact optimization model in Tangshan City, China. J. Clean. Prod. 2020, 266, 121997. [Google Scholar] [CrossRef]
- Chen, C.; Zheng, X.T.; Yu, L.; Huang, G.H.; Li, Y.P. Planning energy-water nexus systems based on a dual risk aversion optimization method under multiple uncertainties. J. Clean. Prod. 2020, 255, 120100. [Google Scholar] [CrossRef]
- Zhang, J.; Campana, P.E.; Yao, T.; Zhang, Y.; Lundblad, A.; Melton, F.; Yan, J.Y. The water-food-energy nexus optimization approach to combat agricultural drought: A case study in the United States. Appl. Energy 2017, 227, 449–464. [Google Scholar] [CrossRef]
- Karan, E.; Asadi, S.; Mohtar, R.; Baawain, M. Towards the optimization of sustainable food-energy-water systems: A stochastic approach. J. Clean. Prod. 2018, 171, 662–674. [Google Scholar] [CrossRef]
- Fan, C.H.; Lin, C.Y.; Hu, M.C. Empirical framework for a relative sustainability evaluation of urbanization on the water–energy–food nexus using simultaneous equation analysis. Int. J. Environ. Res. Public Health 2019, 16, 901. [Google Scholar] [CrossRef] [Green Version]
- Li, M.; Fu, Q.; Singh, V.P.; Ji, Y.; Liu, D.; Li, T.X. Stochastic multi-objective modeling for optimization of water-food-energy nexus of irrigated agriculture. Adv. Water Resour. 2019, 127, 209–224. [Google Scholar] [CrossRef]
- Peng, S.M.; Zheng, X.K.; Wang, Y.; Jiang, G.X. Collaborative optimization of water-energy-food in the Yellow River Basin. Adv. Water Sci. 2017, 5, 43–52. [Google Scholar]
- Xu, B.; Feng, Z.; Gates, A.M. Multi-Objective Particle Swarm Optimization Algorithm for the Minimum Constraint Removal Problem. Int. J. Comput. Intell. Syst. 2020, 13, 291–299. [Google Scholar] [CrossRef]
- Gao, Y. Research on Some Problems of Multi-Objective Optimization. Master’s Thesis, Inner Mongolia University, Huhehot, Mongolia, 2010. [Google Scholar]
- Chen, L. Research on Optimal Allocation of Logistics Resources in Pharmaceutical Enterprises. Master’s Thesis, Beijing Jiaotong University, Beijing, China, 2009. [Google Scholar]
- Fan, Y.L.; Xia, X.H. A multi-objective optimization model for energy efficiency building envelope retrofitting plan with. Appl. Energy 2017, 189, 327–335. [Google Scholar] [CrossRef] [Green Version]
- Ramirez-Atencia, C.; Camacho, D. Constrained multi objective optimization for multi-UAV planning. J. Ambient Intell. Hum. Comput. 2019, 10, 2479–2496. [Google Scholar] [CrossRef]
- Xu, Y.D.; Liu, Y.M.; Shen, J.F. Multi-objective Track Maintenance Plan Model and Solution. J. Tongji Univ. Nat. Sci. 2018, 46, 926–933. [Google Scholar]
- Sun, Y.; Xu, X.T. Evaluation of general land consolidation scheme based on grey multi objective decision model. J. Lanzhou Univ. Nat. Sci. 2017, 53, 194–198. [Google Scholar]
- Sharma, U.; Aggarwal, S.S. Solving Fully Fuzzy Multi-objective Linear Programming Problem Using Nearest Interval Approximation. Int. J. Fuzzy Syst. 2018, 20, 488–499. [Google Scholar] [CrossRef]
- Zhang, Z.H.; Tao, J. Efficient micro immune optimization approach solving constrained nonlinear interval number programming. Appl. Intell. 2015, 43, 276–295. [Google Scholar] [CrossRef]
- Jiang, C.; Han, X.; Li, D. A New Interval Comparison Relation and Application in Interval Number Programming for Uncertain. CMC Comput. Mater. Continua 2012, 27, 275–303. [Google Scholar]
- Yang, L.B.; Cui, C.Y.; Li, Y.S. Analysis of water resources utilization status and potential in Ordos city. Yellow River 2014, 9, 57–58. [Google Scholar]
- Peng, S.M.; He, L.Y.; Cui, C.Y.; Zheng, X.K.; Liu, Z.S. Analysis and allocation pattern of water resources supply and demand in Ordos City. Yellow River 2014, 36, 62–63. [Google Scholar]
- Kong, D.W.; Sun, J. Interval Multi-Objective Evolutionary Optimization Theory and Application; Science Press: Beijing, China, 2015; pp. 2–4. [Google Scholar]
- Wang, H.F.; Wang, M.L. A fuzzy multi objective linear programing. Fuzzy Sets Syst. 1997, 6, 61–72. [Google Scholar]
- Zhang, X.; Vesselinov, V.V. Integrated modeling approach for optimal management of water, energy and food security nexus. Adv. Water Resour. 2017, 101, 1–10. [Google Scholar] [CrossRef]
- OuYang, X.Y. Research on the optimal development of energy structure in the western region—Based on the perspective of cost. Master’s Thesis, Sichuan Academy of Social Sciences, Chengdu, China, 2011. [Google Scholar]
- Li, Y. Research on the production cost and benefit of main grain crops in Bayanzhuoer city. Master’s Thesis, Inner Mongolia Agricultural University, Huhehot, Inner Mongolia, China, 2016. [Google Scholar]
- Hong, S.Y.; Wang, H.R.; Lai, W.L.; Zhu, Z.F. Spatial Analysis and Coordinated Development Decoupling Analysis of Energy-consumption Water in China. J. Nat. Resour. 2017, 5, 800–813. [Google Scholar]
- Li, B.; Zhang, J.B. Research on the characteristics and spatial differences of carbon effect based on the change of agricultural land use in my country. Econ. Geogr. 2012, 32, 135–140. [Google Scholar]
- Tian, Y.; Li, B.; Zhang, J.B. Research on stage characteristics and factor decomposition of carbon Emissions from agricultural land use in my country. J. China Univ. Geosci. Soc. Sci. Ed. 2011, 11, 59–63. [Google Scholar]
- Chen, J.F.; Chen, L.; Liu, L.M.; Zhi, Y.L. Security Evaluation of Regional Water-Energy-Food System Based On Pressure-State-Response Model. In Proceedings of the 15th Annual Conference of The Chinese Academy of Soft Science, Beijing, China, 2019. [Google Scholar]


| Target | Expectation Level Lower Limit | Expectation Level Upper Limit | Expectation Level Tolerance |
|---|---|---|---|
| WEF system coordination deviation | 0.02 | 0.179 | 0.159 |
| Ecological environment goal | 37319.66 | 37319.66 | 0 |
| Decision Variables | Lower Limit after Optimization | Upper Limit after Optimization |
|---|---|---|
| Satisfaction | 0.884 | 0.915 |
| Coal production (10,000 tons of standard coal) | 46,489.41 | 46,429.5 |
| Natural gas production (10,000 tons of standard coal) | 3909.784 | 3300 |
| Thermal power generation (10,000 tons of standard coal) | 1267.48 | 1267.48 |
| Hydropower power generation (10,000 tons of standard coal) | 23.086 | 23.086 |
| Wind power generation (10,000 tons of standard coal) | 9.434 | 9.434 |
| Food production (10,000 tons) | 174.216 | 161.501 |
| Utilization of water resources in coal production (10,000 tons) | 14,347.20 | 14,347.20 |
| Utilization of water resources in natural gas production (10,000 tons) | 763.359 | 763.359 |
| Utilization of water resources for thermal power generation (10,000 tons) | 13,351.13 | 13,351.13 |
| Utilization of water resources for hydroelectric power generation (10,000 tons) | 996.16 | 996.16 |
| Utilization of water resources in food production (10,000 tons) | 110,862.1 | 110,862.1 |
Publisher’s Note: MDPI stays neutral with regard to jurisdictional claims in published maps and institutional affiliations. |
© 2020 by the authors. Licensee MDPI, Basel, Switzerland. This article is an open access article distributed under the terms and conditions of the Creative Commons Attribution (CC BY) license (http://creativecommons.org/licenses/by/4.0/).
Share and Cite
Chen, J.; Zhou, Z.; Chen, L.; Ding, T. Optimization of Regional Water-Energy-Food Systems Based on Interval Number Multi-Objective Programming: A Case Study of Ordos, China. Int. J. Environ. Res. Public Health 2020, 17, 7508. https://doi.org/10.3390/ijerph17207508
Chen J, Zhou Z, Chen L, Ding T. Optimization of Regional Water-Energy-Food Systems Based on Interval Number Multi-Objective Programming: A Case Study of Ordos, China. International Journal of Environmental Research and Public Health. 2020; 17(20):7508. https://doi.org/10.3390/ijerph17207508
Chicago/Turabian StyleChen, Junfei, Ziyue Zhou, Lin Chen, and Tonghui Ding. 2020. "Optimization of Regional Water-Energy-Food Systems Based on Interval Number Multi-Objective Programming: A Case Study of Ordos, China" International Journal of Environmental Research and Public Health 17, no. 20: 7508. https://doi.org/10.3390/ijerph17207508