Urban Water Consumption Patterns in an Adult Population in Wuxi, China: A Regression Tree Analysis

Abstract
:1. Introduction
2. Materials and Methods
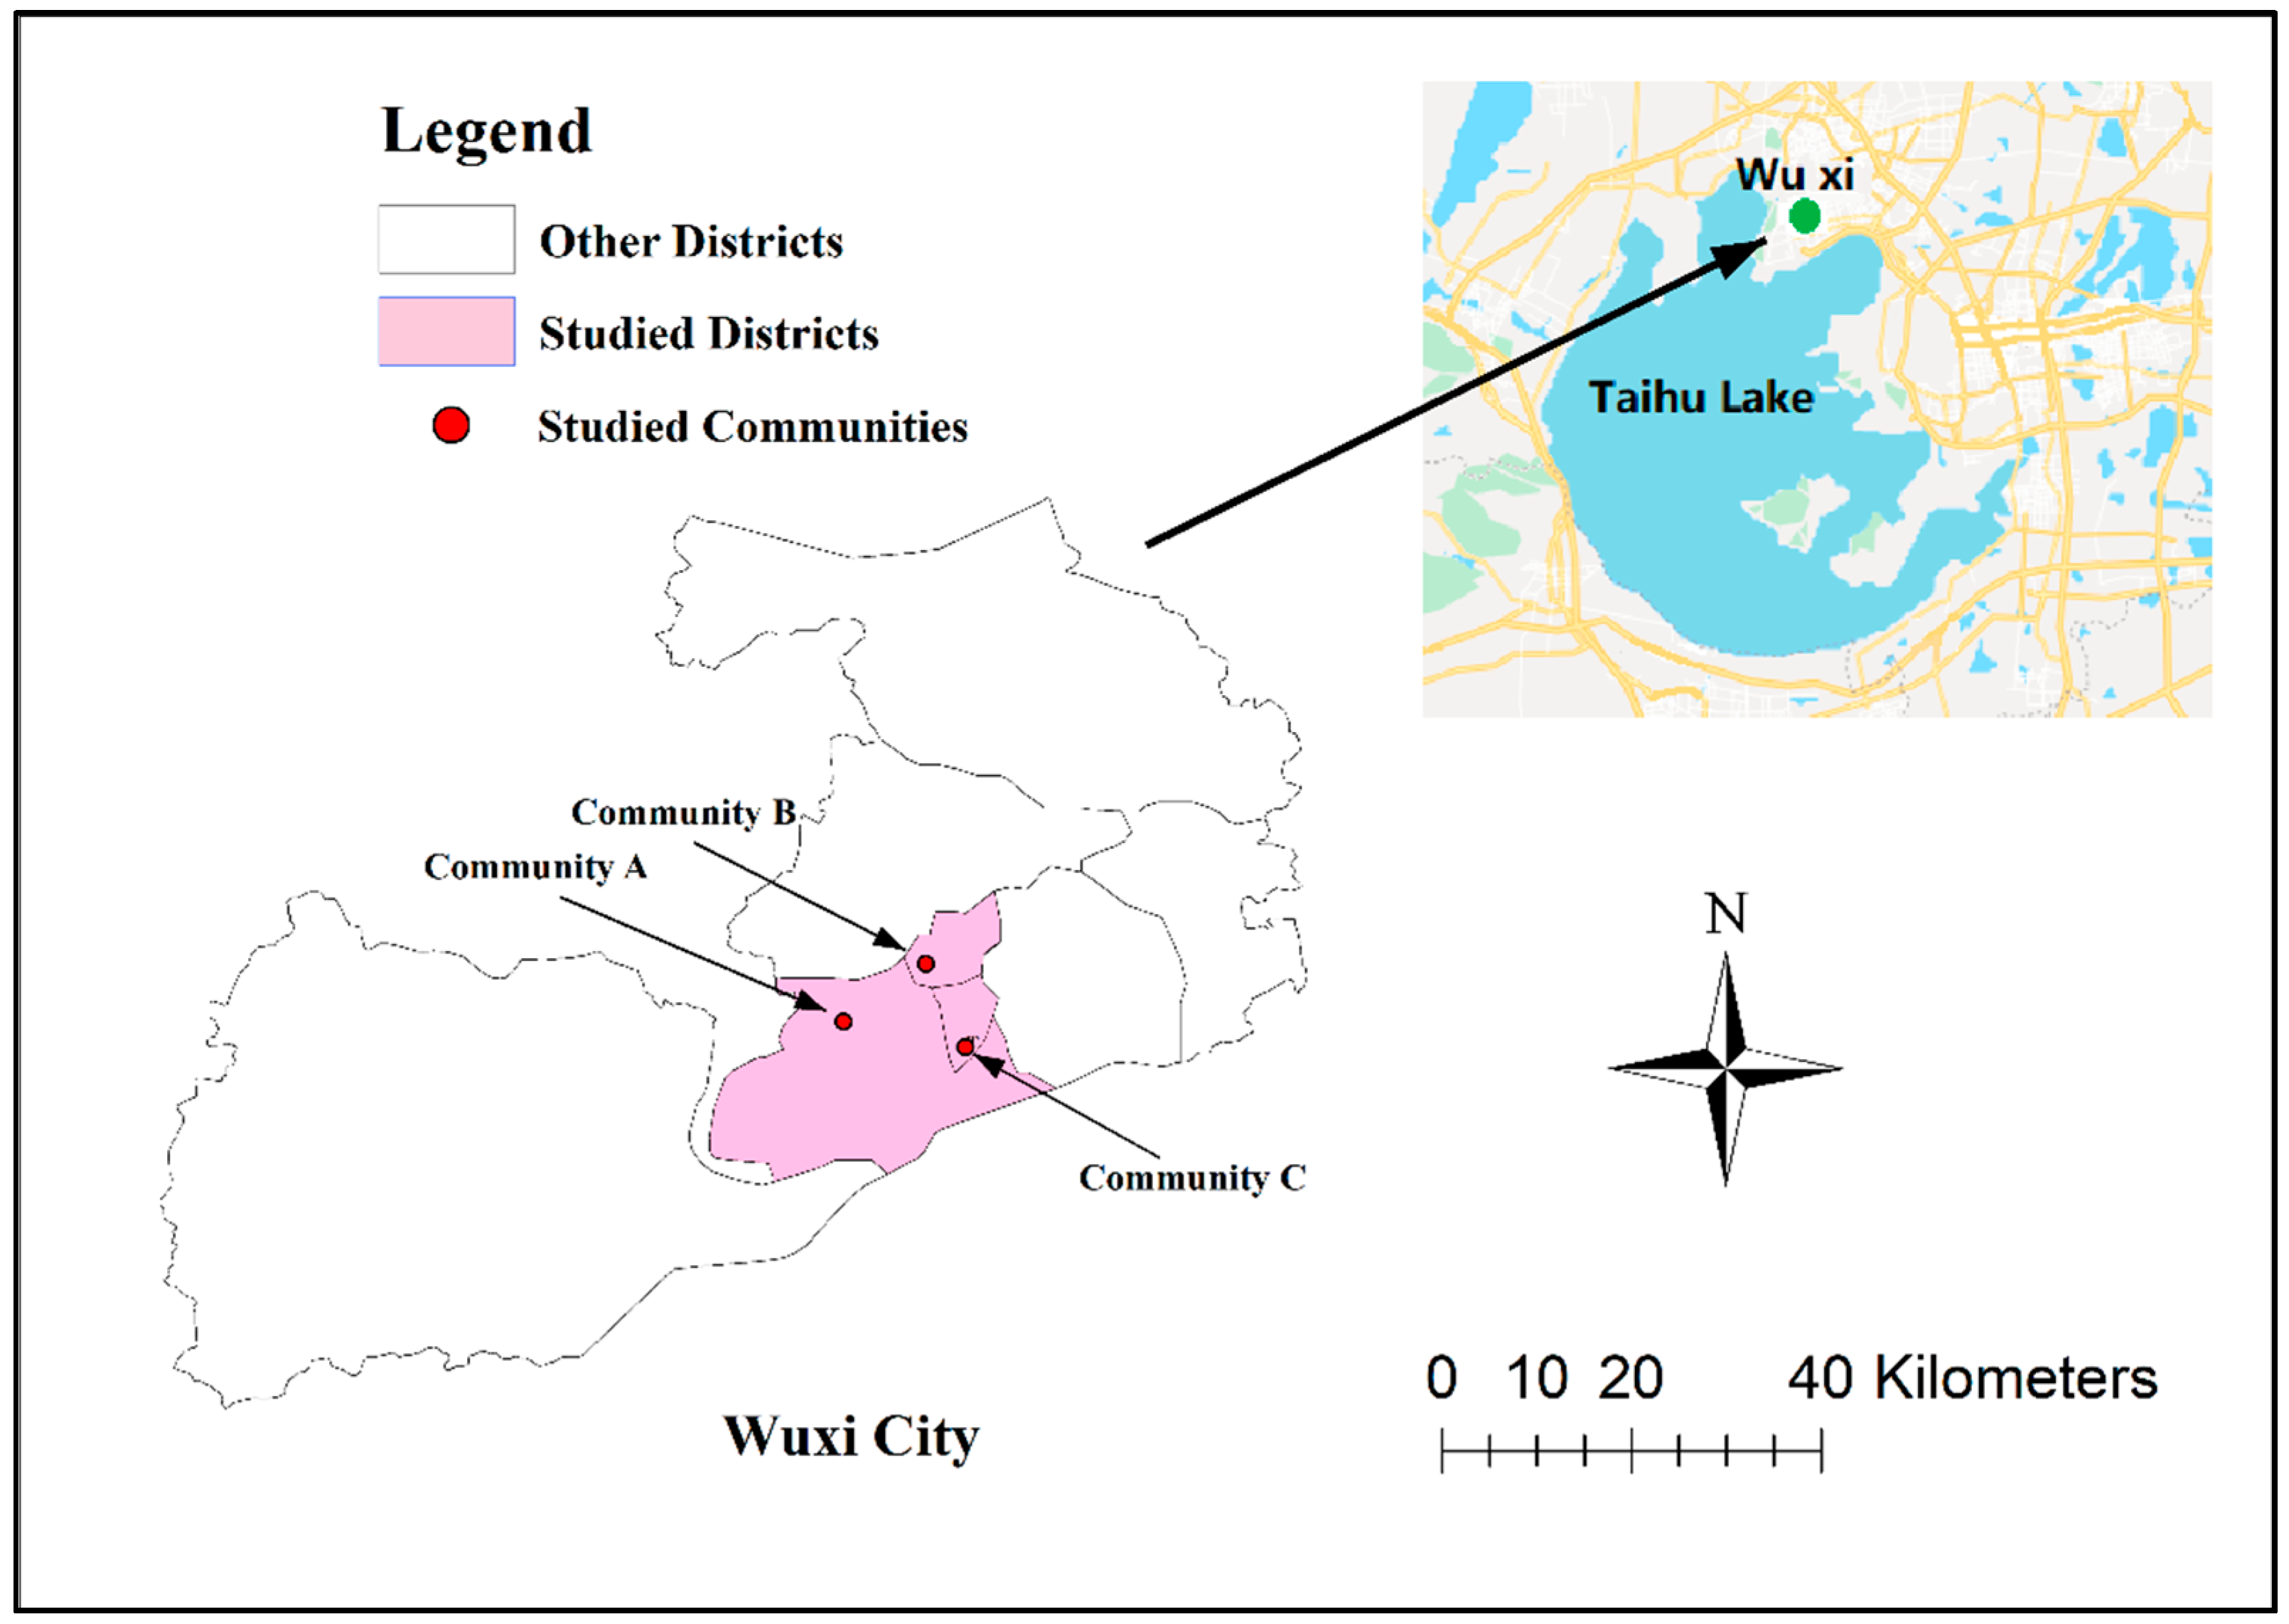
2.1. Study Area and Sample
2.2. Data Collection
2.3. Variables
2.4. Statistical Analyses
2.4.1. Descriptive Analysis
2.4.2. Univariate and Multivariate Analysis
2.4.3. CART Analysis
2.4.4. Comparisons of CART and Regression Models
3. Results
3.1. General Characteristics of the Participants
3.2. The Total Water, Direct Water and Indirect Water Consumptions of the Participants
3.3. Impacts of Demographic Variables on the Water Consumption According to Multivariate Analysis
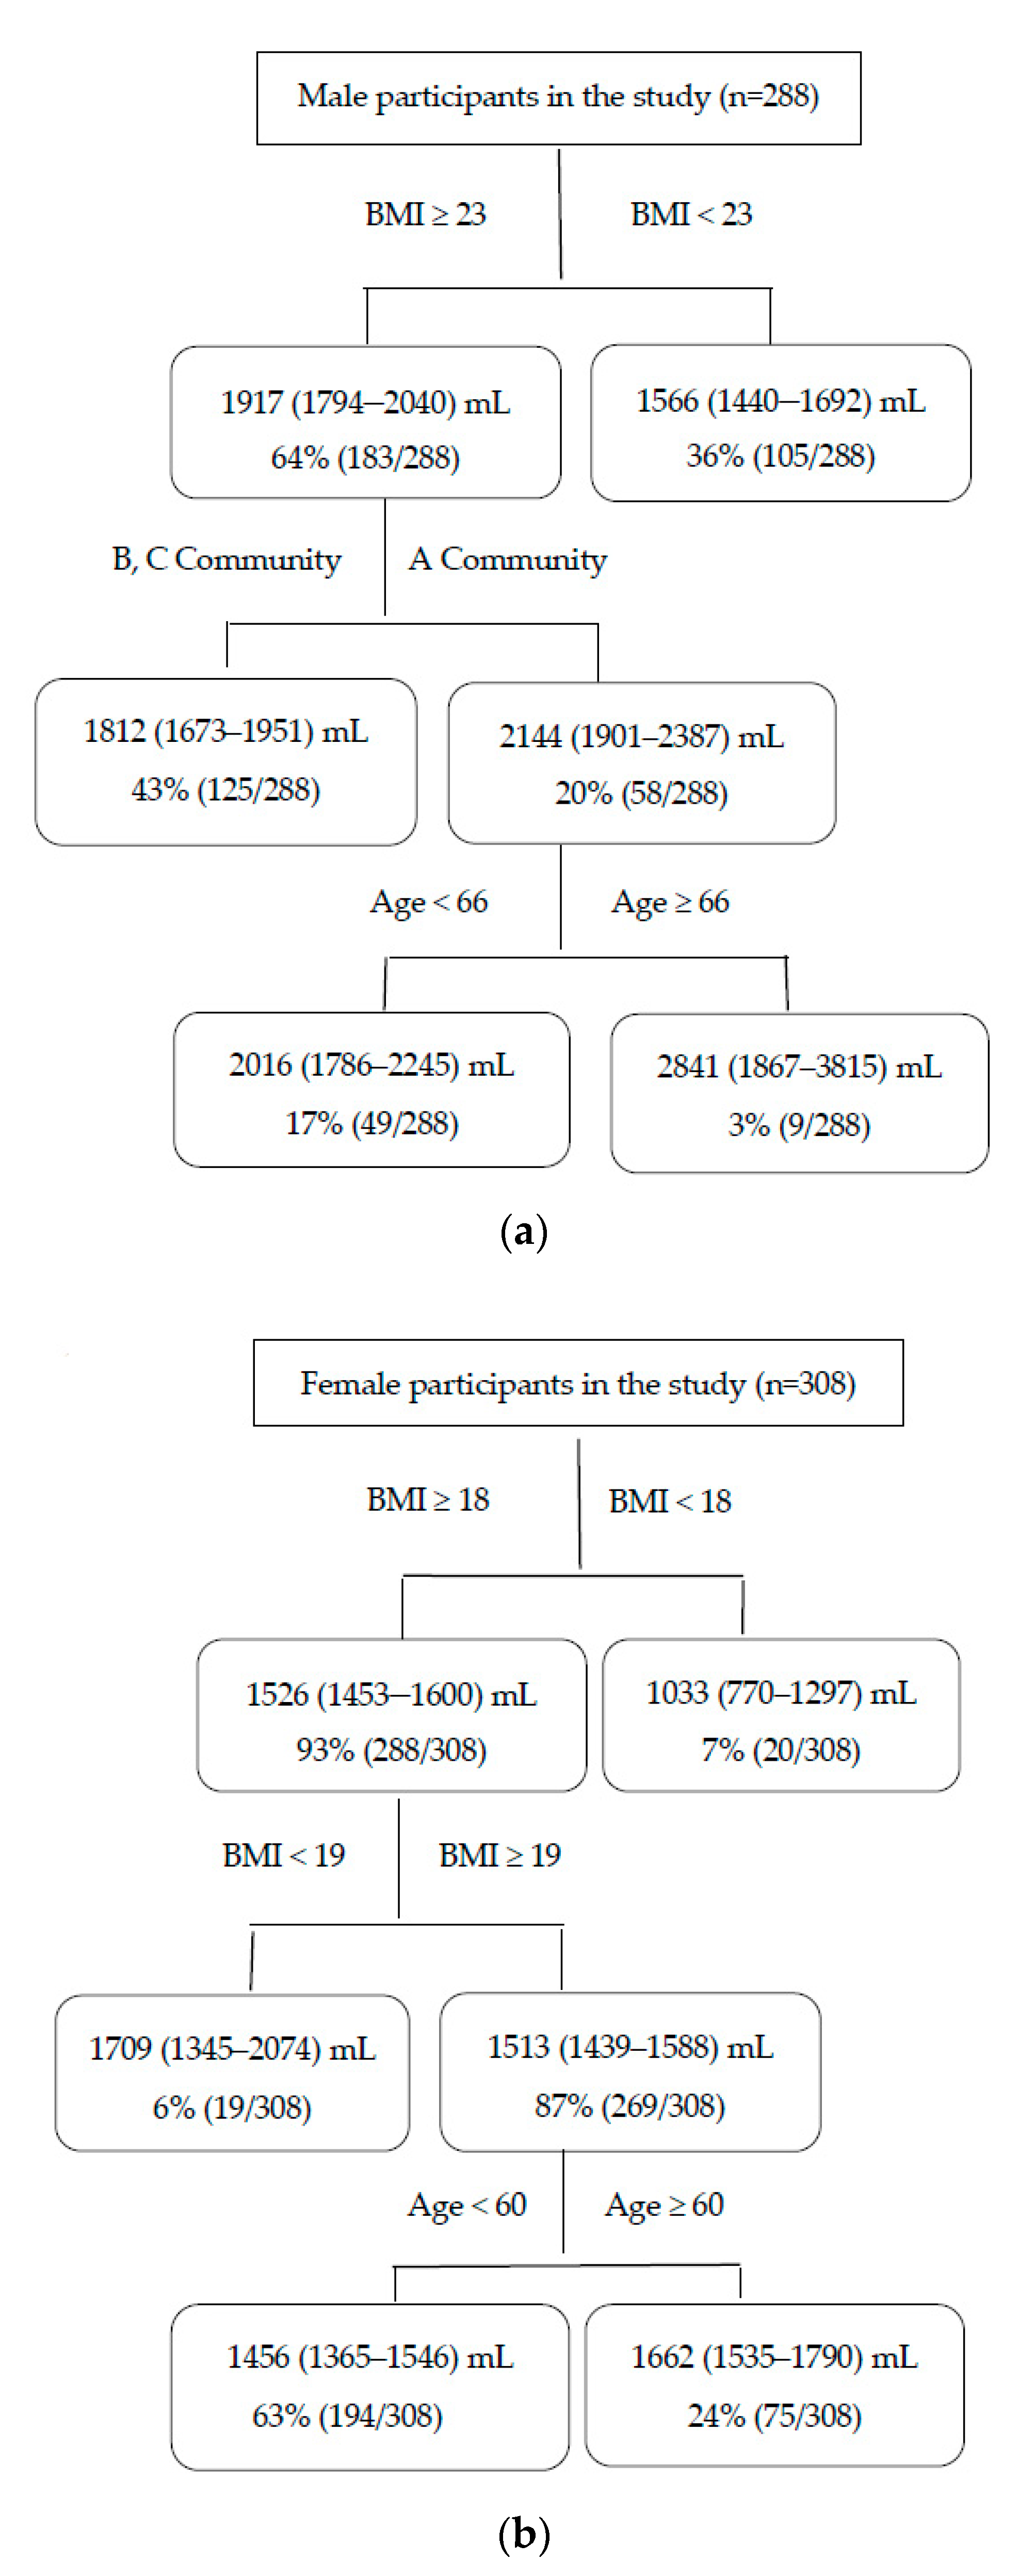
3.4. Impacts of Age, BMI, and Location on Water Consumption According to CART Analysis
3.5. Comparisons of the Results of Linear Regression and CART Analysis
4. Discussion
5. Conclusions
Supplementary Materials
Author Contributions
Funding
Acknowledgments
Conflicts of Interest
References
- USEPA. Guideline for Human Exposure Assessment; USEPA: Washington, DC, USA, 2019. [Google Scholar]
- Kahn, H.D.; Stralka, K. Estimated daily average per capita water ingestion by child and adult age categories based on USDA’s 1994–1996 and 1998 continuing survey of food intakes by individuals. J. Expo. Sci. Environ. Epidemiol. 2009, 19, 396–404. [Google Scholar] [CrossRef] [PubMed] [Green Version]
- Regnier, A.; Gurian, P.; Mena, K.D. Drinking water intake and source patterns within a US-Mexico border population. Int. J. Environ. Health Res. 2015, 25, 21–32. [Google Scholar] [CrossRef] [PubMed]
- Barraj, L.; Scrafford, C.; Lantz, J.; Daniels, C.; Mihlan, G. Within-day drinking water consumption patterns: Results from a drinking water consumption survey. J. Expo. Sci. Environ. Epidemiol. 2009, 19, 382–395. [Google Scholar] [CrossRef] [PubMed]
- Save-Soderbergh, M.; Toljander, J.; Mattisson, I.; Akesson, A.; Simonsson, M. Drinking water consumption patterns among adults-SMS as a novel tool for collection of repeated self-reported water consumption. J. Expo. Sci. Environ. Epidemiol. 2018, 28, 131–139. [Google Scholar] [CrossRef] [PubMed] [Green Version]
- Jones, A.Q.; Majowicz, S.E.; Edge, V.L.; Thomas, M.K.; MacDougall, L.; Fyfe, M.; Atashband, S.; Kovacs, S.J. Drinking water consumption patterns in British Columbia: An investigation of associations with demographic factors and acute gastrointestinal illness. Sci. Total Environ. 2007, 388, 54–65. [Google Scholar] [CrossRef]
- Roche, S.M.; Jones, A.Q.; Majowicz, S.E.; McEwen, S.A.; Pintar, K.D. Drinking water consumption patterns in Canadian communities (2001–2007). J. Water Health 2012, 10, 69–86. [Google Scholar] [CrossRef]
- Westrell, T.; Andersson, Y.; Stenstrom, T.A. Drinking water consumption patterns in Sweden. J. Water Health 2006, 4, 511–522. [Google Scholar] [CrossRef] [Green Version]
- Ji, K.; Kim, Y.; Choi, K. Water intake rate among the general Korean population. Sci. Total Environ. 2010, 408, 734–739. [Google Scholar] [CrossRef]
- Zhang, N.; Morin, C.; Guelinckx, I.; Moreno, L.A.; Kavouras, S.A.; Gandy, J.; Martinez, H.; Salas-Salvado, J.; Ma, G. Fluid intake in urban China: Results of the 2016 Liq.In (7) national cross-sectional surveys. Eur. J. Nutr. 2018, 57, 77–88. [Google Scholar] [CrossRef] [Green Version]
- Ma, G.; Zhang, Q.; Liu, A.; Zuo, J.; Zhang, W.; Zou, S.; Li, X.; Lu, L.; Pan, H.; Hu, X. Fluid intake of adults in four Chinese cities. Nutr. Rev. 2012, 70 (Suppl. 2), S105–S110. [Google Scholar] [CrossRef]
- Zhang, J.; Zhang, N.; Liang, S.; Wang, Y.; Liu, S.; Liu, S.; Du, S.; He, H.; Xu, Y.; Cai, H.; et al. The amounts and contributions of total drinking fluids and water from food to total water intake of young adults in Baoding, China. Eur. J. Nutr. 2019, 58, 2669–2677. [Google Scholar] [CrossRef] [PubMed]
- O’Connor, L.; Walton, J.; Flynn, A. Water intakes and dietary sources of a nationally representative sample of Irish adults. J. Hum. Nutr. Diet. Off. J. Br. Diet. Assoc. 2014, 27, 550–556. [Google Scholar] [CrossRef] [PubMed]
- Vieux, F.; Maillot, M.; Constant, F.; Drewnowski, A. Water and beverage consumption patterns among 4 to 13-year-old children in the United Kingdom. BMC Public Health 2017, 17, 479. [Google Scholar] [CrossRef] [PubMed] [Green Version]
- Wang, Z.; Shi, A.; Chen, Y.; Cheng, W.; Song, J.; Zhu, Z.; Zou, S.; Ma, G. Water intake and its influencing factors of children and adolescents in Shanghai. Wei Sheng Yan Jiu 2014, 43, 66–69. [Google Scholar]
- USEPA. Estimated per Capita Water Ingestion in the United States—An Update: Based on Data Collected by the United States Department of Agriculture’s 1994–1996 and 1998 Continuing Survey of Food Intakes by Individuals; Office of Water: Washington, DC, USA, 2004. [Google Scholar]
- Nissensohn, M.; Castro-Quezada, I.; Serra-Majem, L. Beverage and water intake of healthy adults in some European countries. Int. J. Food Sci. Nutr. 2013, 64, 801–805. [Google Scholar] [CrossRef]
- Senterre, C.; Dramaix, M.; Thiebaut, I. Fluid intake survey among schoolchildren in Belgium. BMC Public Health 2014, 14, 651. [Google Scholar] [CrossRef] [Green Version]
- Knudsen, V.K.; Fagt, S.; Trolle, E.; Matthiessen, J.; Groth, M.V.; Biltoft-Jensen, A.; Sorensen, M.R.; Pedersen, A.N. Evaluation of dietary intake in Danish adults by means of an index based on food-based dietary guidelines. Food Nutr. Res. 2012, 56. [Google Scholar] [CrossRef] [Green Version]
- Guelinckx, I.; Ferreira-Pego, C.; Moreno, L.A.; Kavouras, S.A.; Gandy, J.; Martinez, H.; Bardosono, S.; Abdollahi, M.; Nasseri, E.; Jarosz, A.; et al. Intake of water and different beverages in adults across 13 countries. Eur. J. Nutr. 2015, 54 (Suppl. 2), 45–55. [Google Scholar] [CrossRef] [Green Version]
- Guelinckx, I.; Iglesia, I.; Bottin, J.H.; De Miguel-Etayo, P.; Gonzalez-Gil, E.M.; Salas-Salvado, J.; Kavouras, S.A.; Gandy, J.; Martinez, H.; Bardosono, S.; et al. Intake of water and beverages of children and adolescents in 13 countries. Eur. J. Nutr. 2015, 54 (Suppl. 2), 69–79. [Google Scholar] [CrossRef] [Green Version]
- Johnson, E.C.; Peronnet, F.; Jansen, L.T.; Capitan-Jimenez, C.; Adams, J.D.; Guelinckx, I.; Jimenez, L.; Mauromoustakos, A.; Kavouras, S.A. Validation Testing Demonstrates Efficacy of a 7-Day Fluid Record to Estimate Daily Water Intake in Adult Men and Women When Compared with Total Body Water Turnover Measurement. J. Nutr. 2017, 147, 2001–2007. [Google Scholar] [CrossRef] [Green Version]
- Vergne, S. Methodological Aspects of Fluid Intake Records and Surveys. Nutr. Today 2012, 47, S7–S10. [Google Scholar] [CrossRef]
- Leo Breiman, J.F.; Charles, J.; Olshen, S.R.A. Classification and Regression Trees; Chapman & Hall/CRC: London, UK, 1984. [Google Scholar]
- Fonarow, G.C.; Adams, K.F.; Abraham, W.T.; Yancy, C.W.; Boscardin, W.J. Risk stratification for in-hospital mortality in acutely decompensated heart failure. Classification and regression tree analysis. JAMA 2005, 293, 572–580. [Google Scholar] [CrossRef] [Green Version]
- Zhang, Y.; Bambrick, H.; Mengersen, K.; Tong, S.; Feng, L.; Liu, G.; Xu, A.; Zhang, L.; Hu, W. Association of weather variability with resurging pertussis infections among different age groups: A non-linear approach. Sci. Total Environ. 2020, 719, 137510. [Google Scholar] [CrossRef] [PubMed]
- Zhang, Y.; Ye, C.; Yu, J.; Zhu, W.; Wang, Y.; Li, Z.; Xu, Z.; Cheng, J.; Wang, N.; Hao, L.; et al. The complex associations of climate variability with seasonal influenza A and B virus transmission in subtropical Shanghai, China. Sci. Total Environ. 2020, 701, 134607. [Google Scholar] [CrossRef] [PubMed]
- Lemon, S.C.; Roy, J.; Clark, M.A.; Friedmann, P.D.; Rakowski, W. Classification and regression tree analysis in public health: Methodological review and comparison with logistic regression. Ann. Behav. Med. 2003, 26, 172–181. [Google Scholar] [CrossRef] [PubMed]
- Lewis, R.J. An Introduction to Classification and Regression Tree Analysis. Available online: https://www.researchgate.net/publication/240719582_An_Introduction_to_Classification_and_Regression_Tree_CART_Analysis (accessed on 15 April 2020).
- Yang, J. Wuxi Statistical Yearbook 2015; China Statistical Press: Beijing, China, 2015. [Google Scholar]
- Collins, K.M.T.; Onwuegbuzie, A.J.; Jiao, Q.G. Prevalence of Mixed-methods Sampling Designs in Social Science Research. Eval. Res. Educ. 2006, 19, 83–101. [Google Scholar] [CrossRef]
- USEPA. Exposure Factors Handbook; 2011 Edition (final); USEPA: Washington, DC, USA, 2011. [Google Scholar]
- Yuexin, Y. China Food Composition; Peking University Medical Press: Beijing, China, 2014. [Google Scholar]
- Wu, Y. Overweight and obesity in China. BMJ 2006, 333, 362–363. [Google Scholar] [CrossRef]
- Theodorsson-Norheim, E. Kruskal-Wallis test: BASIC computer program to perform nonparametric one-way analysis of variance and multiple comparisons on ranks of several independent samples. Comput. Methods Programs Biomed. 1986, 23, 57–62. [Google Scholar] [CrossRef]
- Uyanık, G.K.; Güler, N. A Study on Multiple Linear Regression Analysis. Procedia Soc. Behav. Sci. 2013, 106, 234–240. [Google Scholar] [CrossRef] [Green Version]
- Gofti-Laroche, L.; Potelon, J.L.; Da Silva, E.; Zmirou, D. [Description of drinking water intake in French communities (E.MI.R.A. study)]. Rev. D’epidemiologie Et De Sante Publique 2001, 49, 411–422. [Google Scholar]
- Tani, Y.; Asakura, K.; Sasaki, S.; Hirota, N.; Notsu, A.; Todoriki, H.; Miura, A.; Fukui, M.; Date, C. The influence of season and air temperature on water intake by food groups in a sample of free-living Japanese adults. Eur. J. Clin. Nutr. 2015, 69, 907–913. [Google Scholar] [CrossRef] [PubMed]
- Zheng, C.; Yang, Y. Influencing factors of the amount of drinking water by Changsha college students: A multilevel model analysis. Wei Sheng Yan Jiu 2018, 47, 593–598. [Google Scholar] [PubMed]
- Wright, C.J.; Sargeant, J.M.; Edge, V.L.; Ford, J.D.; Farahbakhsh, K.; Shiwak, I.; Flowers, C.; Gordon, A.C.; Harper, S.L. How are perceptions associated with water consumption in Canadian Inuit? A cross-sectional survey in Rigolet, Labrador. Sci. Total Environ. 2018, 618, 369–378. [Google Scholar] [CrossRef] [PubMed] [Green Version]
- Kant, A.K.; Graubard, B.I.; Atchison, E.A. Intakes of plain water, moisture in foods and beverages, and total water in the adult US population—Nutritional, meal pattern, and body weight correlates: National Health and Nutrition Examination Surveys 1999–2006. Am. J. Clin. Nutr. 2009, 90, 655–663. [Google Scholar] [CrossRef] [PubMed] [Green Version]
- Muckelbauer, R.; Sarganas, G.; Gruneis, A.; Muller-Nordhorn, J. Association between water consumption and body weight outcomes: A systematic review. Am. J. Clin. Nutr. 2013, 98, 282–299. [Google Scholar] [CrossRef] [Green Version]


| Variables | Summer | Winter | Total | |||
|---|---|---|---|---|---|---|
| n | % | n | % | n | % | |
| Total | 596 | 100 | 592 | 100 | 1188 | 100 |
| Gender | ||||||
| Man | 288 | 48.3 | 285 | 48.1 | 573 | 48.2 |
| Woman | 308 | 51.7 | 307 | 51.9 | 615 | 51.8 |
| Age (years) | ||||||
| 18–34 | 198 | 33.2 | 198 | 33.4 | 396 | 33.3 |
| 35–54 | 193 | 32.4 | 192 | 32.4 | 385 | 32.4 |
| ≥55 | 205 | 34.4 | 202 | 34.1 | 407 | 34.3 |
| Location (Community) | ||||||
| A | 198 | 33.2 | 202 | 34.1 | 400 | 33.7 |
| B | 200 | 33.6 | 197 | 33.3 | 397 | 33.4 |
| C | 198 | 33.2 | 193 | 32.6 | 391 | 32.9 |
| Ethnicity | ||||||
| Han | 590 | 99.0 | 588 | 99.3 | 1178 | 99.2 |
| Others | 6 | 1.0 | 4 | 0.7 | 10 | 0.8 |
| labor worker | ||||||
| Yes | 76 | 12.8 | 73 | 12.3 | 149 | 12.5 |
| No | 520 | 87.2 | 519 | 87.7 | 1039 | 87.5 |
| BMI (kg/m2) | ||||||
| <18.5 | 35 | 5.9 | 20 | 3.4 | 55 | 4.6 |
| 18.5–23.9 | 347 | 58.2 | 377 | 63.7 | 724 | 60.9 |
| 24–27.9 | 172 | 28.9 | 166 | 28.0 | 338 | 28.5 |
| ≥28 | 42 | 7.0 | 29 | 4.9 | 71 | 6.0 |
| Variables | n | Water Total (mL/day) | Direct Water (mL/day) | Indirect Water (mL/day) | |||
|---|---|---|---|---|---|---|---|
| Median | P25–P75 | Median | P25–P75 | Median | P25–P75 | ||
| Summer | 596 | 1525 | 1101–1970 | 1000 | 700–1400 | 471 | 343–612 |
| Gender | |||||||
| Man | 288 | 1646 | 1203–2203 | 1100 | 750–1550 | 515 | 364–669 |
| Woman | 308 | 1442 | 1038–1825 | 960 | 600–1300 | 442 | 337–586 |
| p < 0.001 | p < 0.001 | p = 0.001 | |||||
| Age (years) | |||||||
| 18–34 | 198 | 1323 | 978–1886 | 865 | 600–1300 | 424b | 319–563 |
| 35–54 | 193 | 1511a | 1136–2006 | 1075a | 700–1400 | 463b | 346–592 |
| ≥55 | 205 | 1638a | 1237–2108 | 1100a | 750–1500 | 542 | 394–689 |
| p < 0.001 | p = 0.001 | p < 0.001 | |||||
| Location (Community) | |||||||
| A | 198 | 1531 | 1083–1902 | 950 | 673–1300 | 476 | 344–628 |
| B | 200 | 1640 | 1124–2107 | 1100 | 700–1500 | 504 | 359–621 |
| C | 198 | 1442 | 1097–1928 | 1000 | 650–1400 | 444 | 338–587 |
| p = 0.078 | p = 0.048 | p = 0.179 | |||||
| BMI (kg/m2) | |||||||
| <18.5 | 35 | 1074 | 840–1548 | 730 | 400–1100 | 381 | 284–471 |
| 18.5–23.9 | 347 | 1489c | 1099–1915 | 1000c | 680–1350 | 471c | 344–620 |
| 24–27.9 | 172 | 1638c | 1144–2190 | 1100c | 700–1500 | 507c | 344–612 |
| ≥28 | 42 | 1843c | 1268–2371 | 1225c | 750–1862 | 493 | 389–716 |
| p < 0.001 | p < 0.001 | p = 0.028 | |||||
| Winter | 592 | 1217 | 917–1555 | 850 | 600–1200 | 321 | 215–464 |
| Gender | |||||||
| Man | 285 | 1321 | 1050–1644 | 1000 | 668–1300 | 364 | 220–474 |
| Woman | 307 | 1119 | 808–1458 | 800 | 550–1050 | 313 | 209–432 |
| p < 0.001 | p < 0.001 | p = 0.004 | |||||
| Age (years) | |||||||
| 18–34 | 198 | 1116 | 773–1410 | 800 | 500–1100 | 275b | 211–413 |
| 35–54 | 192 | 1231a | 920–1617 | 915a | 650–1250 | 315b | 214–431 |
| ≥55 | 202 | 1315a | 1058–1613 | 900a | 650–1200 | 410 | 220–514 |
| p < 0.001 | p = 0.003 | p < 0.001 | |||||
| Location (Community) | |||||||
| A | 202 | 1276 | 1014–1567 | 900 | 700–1100 | 342 | 216–468 |
| B | 197 | 1163 | 887–1516 | 800 | 550–1200 | 304 | 211–472 |
| C | 193 | 1172 | 861–1565 | 850 | 550–1200 | 325 | 217–455 |
| p = 0.085 | p = 0.157 | p = 0.767 | |||||
| BMI (kg/m2) | |||||||
| <18.5 | 20 | 1009 | 821–1450 | 800 | 425–850 | 270 | 210–463 |
| 18.5–23.9 | 377 | 1208d | 906–1516 | 850 | 600–1200 | 316d | 209–455 |
| 24–27.9 | 166 | 1320 | 1017–1680 | 900 | 700–1250 | 365 | 224–511 |
| ≥28 | 29 | 1016d | 767–1414 | 800 | 425–975 | 274 | 214–418 |
| p = 0.003 | p = 0.021 | p = 0.025 | |||||
| Variables | Coefficient | p-Value | 95% (CI) |
|---|---|---|---|
| Summer (n = 596) | |||
| Gender | |||
| Woman | Referent | ||
| Man | 0.186 | <0.001 | 0.099, 0.273 |
| BMI | 0.019 | 0.008 | 0.005, 0.034 |
| Location (Community) | |||
| A | Referent | ||
| B | −0.113 | 0.034 | −0.217, −0.008 |
| C | −0.152 | 0.004 | −0.255, −0.049 |
| Constant | 6.678 | <0.001 | 6.343, 7.013 |
| Winter (n = 592) | |||
| Gender | |||
| Woman | Referent | ||
| Man | 0.128 | 0.001 | 0.051, 0.204 |
| Age | 0.004 | <0.001 | 0.002, 0.006 |
| Location (Community) | |||
| A | Referent | ||
| B | −0.024 | 0.621 | −0.118, 0.070 |
| C | 0.010 | 0.825 | −0.083, 0.104 |
| Constant | 6.679 | <0.001 | 6.541, 6.844 |
© 2020 by the authors. Licensee MDPI, Basel, Switzerland. This article is an open access article distributed under the terms and conditions of the Creative Commons Attribution (CC BY) license (http://creativecommons.org/licenses/by/4.0/).
Share and Cite
Zheng, H.; Zhou, W.; Zhang, L.; Li, X.; Cheng, J.; Ding, Z.; Xu, Y.; Hu, W. Urban Water Consumption Patterns in an Adult Population in Wuxi, China: A Regression Tree Analysis. Int. J. Environ. Res. Public Health 2020, 17, 2983. https://doi.org/10.3390/ijerph17092983
Zheng H, Zhou W, Zhang L, Li X, Cheng J, Ding Z, Xu Y, Hu W. Urban Water Consumption Patterns in an Adult Population in Wuxi, China: A Regression Tree Analysis. International Journal of Environmental Research and Public Health. 2020; 17(9):2983. https://doi.org/10.3390/ijerph17092983
Chicago/Turabian StyleZheng, Hao, Weijie Zhou, Lan Zhang, Xiaobo Li, Jian Cheng, Zhen Ding, Yan Xu, and Wenbiao Hu. 2020. "Urban Water Consumption Patterns in an Adult Population in Wuxi, China: A Regression Tree Analysis" International Journal of Environmental Research and Public Health 17, no. 9: 2983. https://doi.org/10.3390/ijerph17092983