Abstract
Cardiovascular disease (CVD) is the leading cause of mortality in post-renal transplant recipients (RTRs). Adequate nutrient intake is a protective factor for CVD. We examined the associations of macronutrients and micronutrients with traditional and nontraditional CVD risk factors. Conducted from September 2016 to June 2018, this cross-sectional study included 106 RTRs aged ≥18 years with a functioning allograft. Dietary intake data from 3-day dietary records were collected. Nutrient intake adequacy was defined using various instruments, including the National Kidney Foundation Kidney Disease Outcomes Quality Initiative (K/DOQI) guidelines. CVD risk factors were defined according to the K/DOQI guidelines. Bivariate and multivariate logistic regression models were used to analyze the associations. CVD risk was present in all patients; the lowest proportions of adequate intake were 2.8% for dietary fiber and 0.9% for calcium. Adequate nutrient intake was associated with a lower likelihood of the occurrence of traditional CVD risk factors (specifically, 1.9–31.3% for hyperlipidemia and 94.6% for diabetes mellitus). It was also associated with a lower likelihood of the occurrence of nontraditional CVD risk by 0.8% for hypophosphatemia and 34% for hyperuricemia. Adherence to dietary guidelines should be promoted among RTRs to decrease CVD risk.
1. Introduction
Among renal replacement therapies, renal transplant therapy (RTT) provides renal transplant recipients (RTRs) with the best quality of life [1]. RTT has a higher 5-year survival rate (89.6%) than end-stage renal disease (58.7%) and dialysis (57.3%) [2]. However, CVD remains the leading cause of mortality after RTT and accounts for 100% of deaths from chronic kidney disease in Taiwan [3].
CVD risk factors are outlined by the National Kidney Foundation according to the Kidney Disease Outcomes Quality Initiative (K/DOQI) [4,5,6,7] Clinical Practice Guidelines for CVD in chronic kidney disease. Traditional factors (e.g., older age, male gender, high blood pressure, high plasma glucose levels, abnormal lipid profile, and obesity) and nontraditional CVD risk factors (e.g., anemia, chronic inflammation, and electrolyte and mineral metabolism abnormalities) [8,9] alike are strongly associated with high CVD prevalence and mortality [10,11].
Various intervention strategies, such as medication, nutrition, and lifestyle modification, are needed for early CVD prevention [12]. Nutritional interventions, including better nutritional status and adherence to individual dietary recommendations, lead to lower metabolic risk and longer kidney survival rate, respectively [13,14]. However, most RTRs show improved appetite after the lifting of dietary restrictions and do not meet the dietary requirements for CVD risk reduction [15,16,17]. Poor adherence to dietary strategies can contribute to increasing morbidity and mortality, as shown in a previous study [18].
The role of dietary nutrient intake in CVD risk factors for RTRs remains to be examined. Therefore, we investigated the associations of adequate dietary macronutrient and micronutrient intake with traditional and nontraditional CVD risk factors in stable RTRs at a single medical center in Taiwan. We hypothesized that RTRs with adequate nutrient intake would have a lower likelihood of the occurrence of CVD risk factors.
2. Material and Methods
2.1. Study Design and Participants
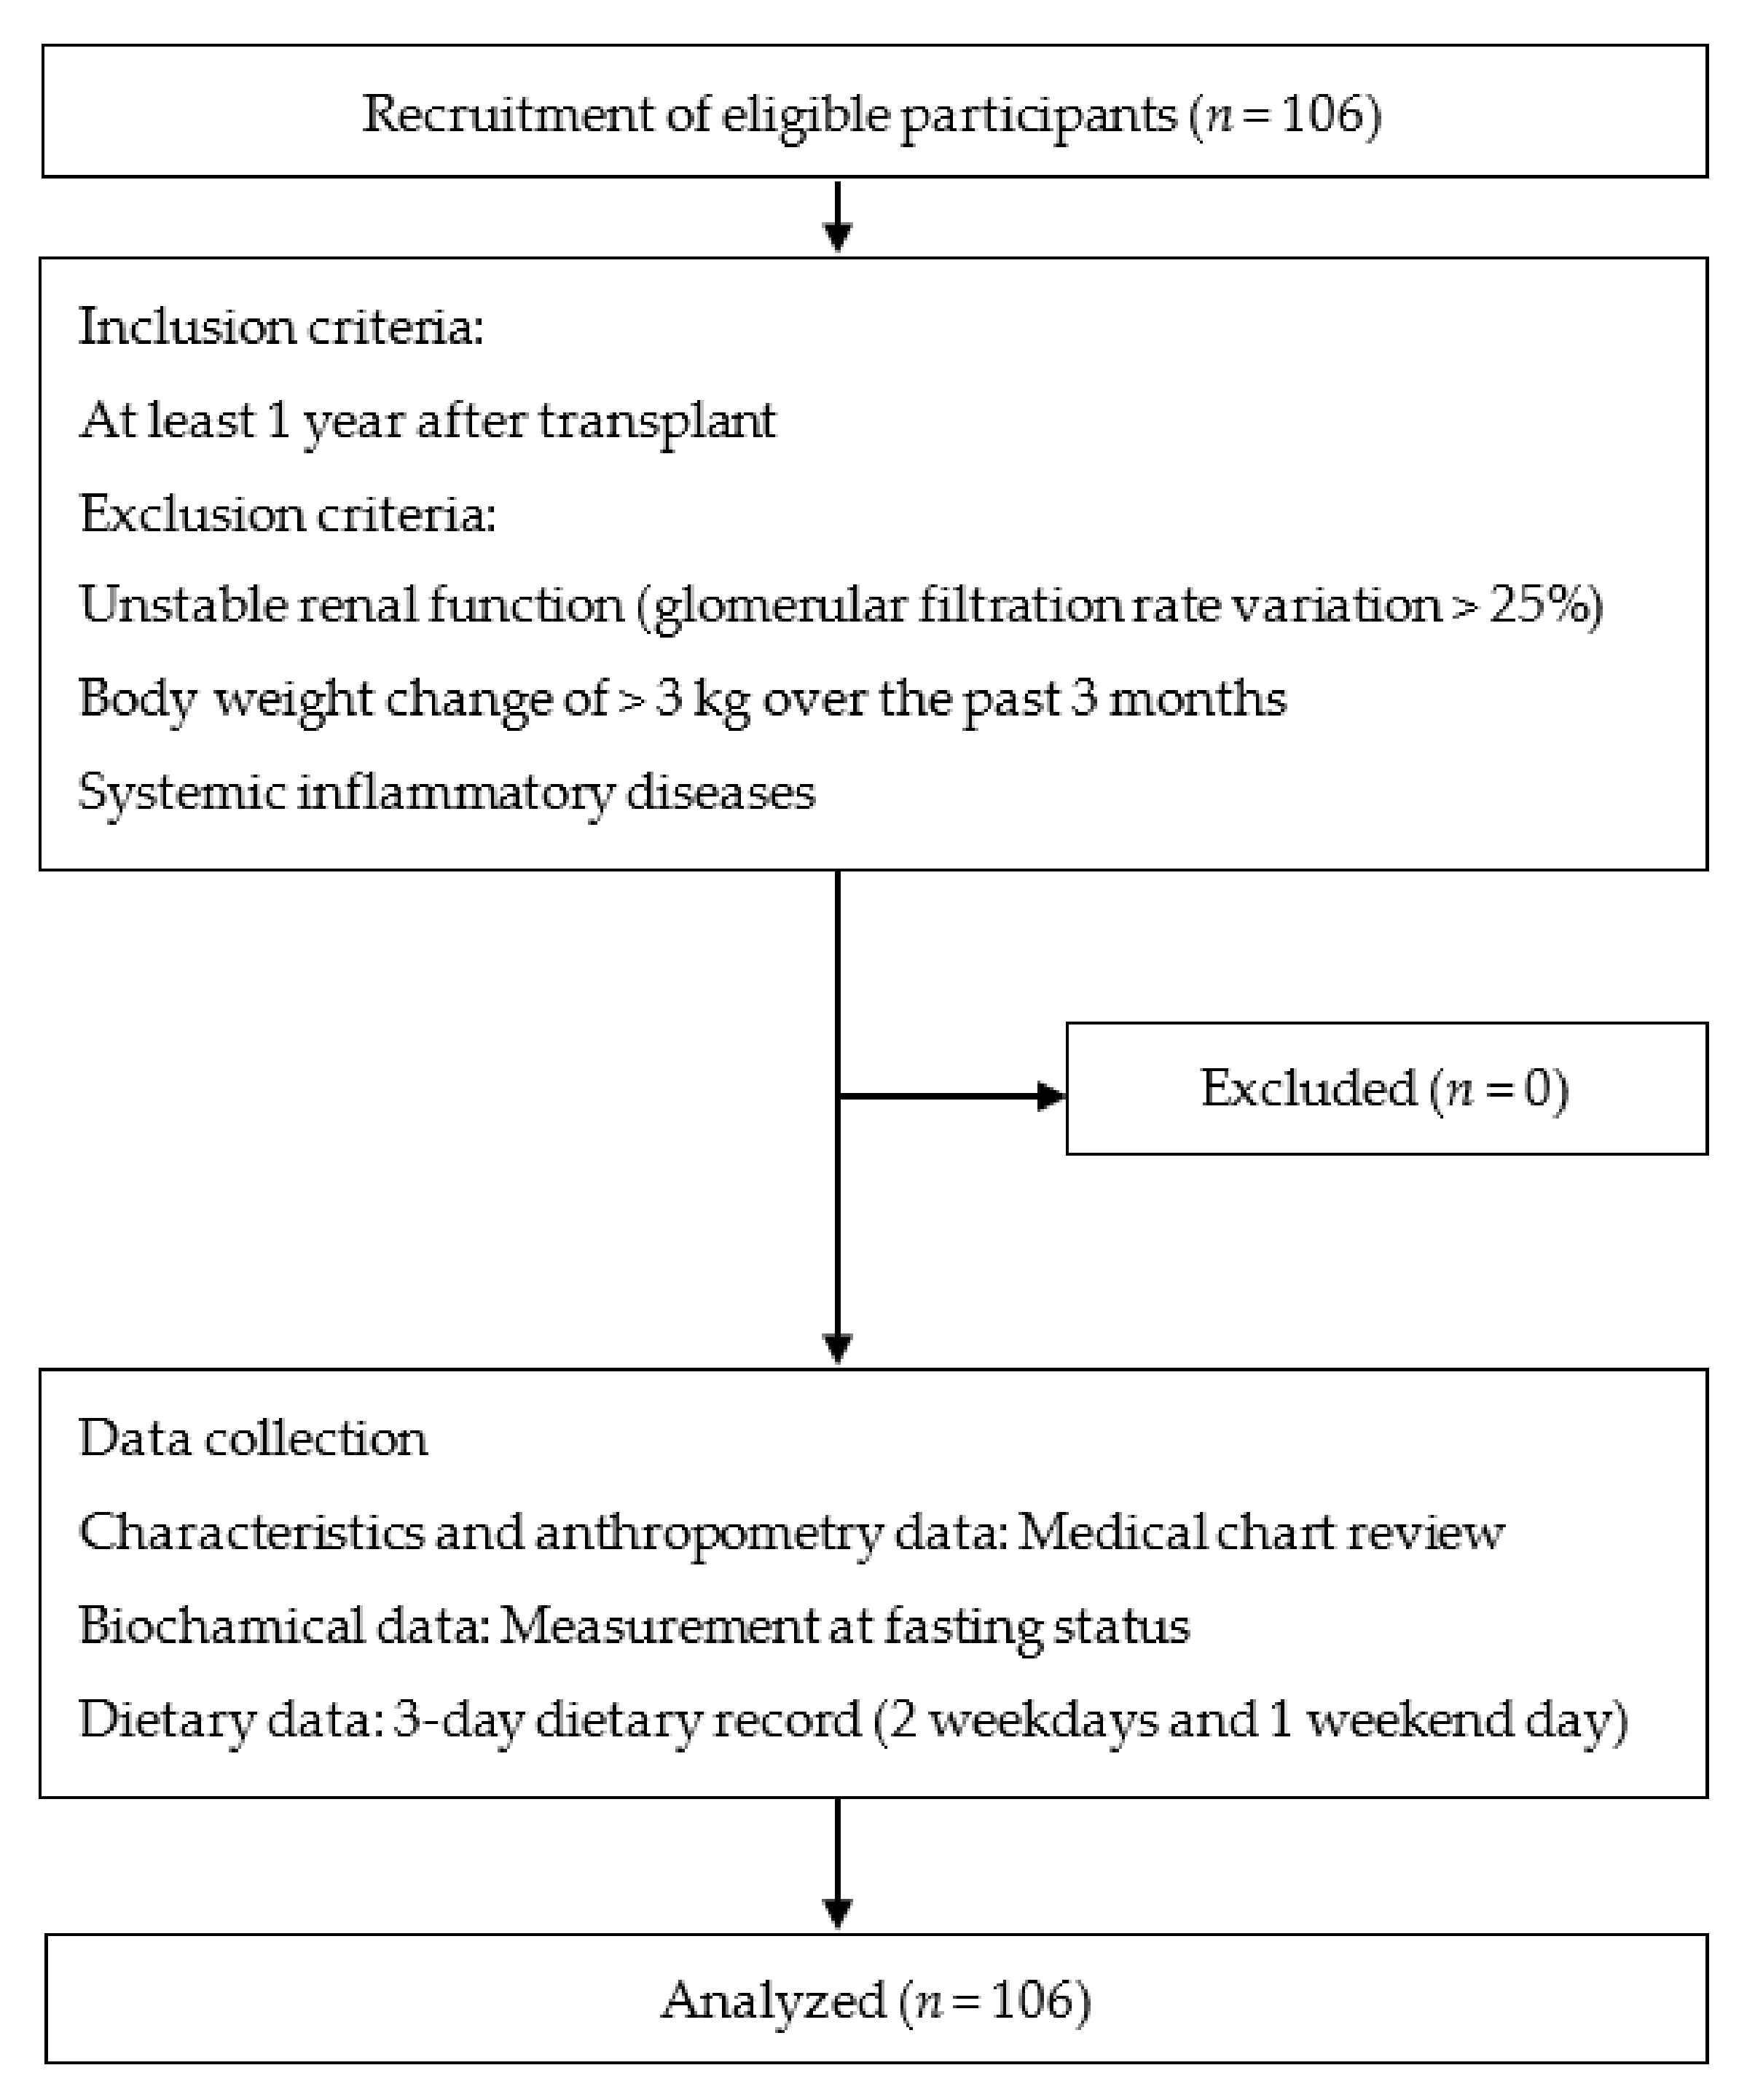
A total of 106 RTRs were enrolled in this cross-sectional study, which was conducted between September 2016 and June 2018 at Linkou Chang Gung Memorial Hospital, Taoyuan, Taiwan. We included patients aged ≥18 years who had had a functioning allograft for at least 1 year after transplant. Patients with unstable renal function, glomerular filtration rate variation >25%, body weight change of >3 kg over the past 3 months, and systemic inflammatory diseases were excluded [17]. The study sample was illustrated in Figure 1.
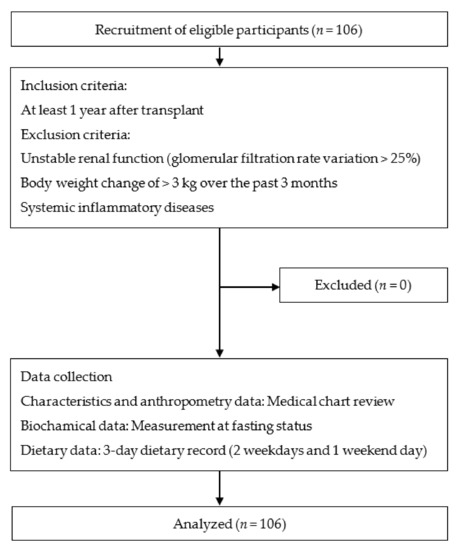
Figure 1.
Study procedure and flowchart with patients’ enrollment.
A registered dietitian at the participating hospital interviewed the participants in person. Data such as anthropometry, laboratory, and dietary intake were also collected according to standardized methods. Informed consent was obtained from each RTR before the interview. The study protocol was approved by the Chang Gung Medical Foundation’s Institutional Review Board (No. 201600954B0).
2.2. Patient Characteristics and Laboratory Parameters
Patient characteristics, which were obtained using medical records, included age, gender, dialysis history, transplant history, body height, body weight, and blood pressure. Body mass index (BMI) was calculated as weight in kilograms divided by the square of height in meters. Waist circumference (WC) in centimeters was noted, and body composition was assessed on Omron scales (HBF-375; Omron Healthcare, Kyoto, Japan) through bioelectrical impedance analysis. Patients fasted for >8 h before examination and wore indoor clothing.
The following parameters were analyzed with standardized methods, as described previously [17]: estimated glomerular filtrate rate (eGFR), fasting plasma glucose, total cholesterol (TC), triglycerides (TG), low-density lipoprotein cholesterol (LDL-C), high-density lipoprotein cholesterol (HDL-C), uric acid, albumin, high-sensitivity C-reactive protein (hs-CRP), serum calcium, phosphate, potassium, hemoglobin (Hb), and intact parathyroid hormone (iPTH). In the homeo-static model assessment of insulin resistance (HOMA-IR), the following formula was used [19]: HOMA-IR = fasting insulin (µU/mL) × fasting glucose (mmol/L)/22.5.
The characteristics and CVD risk factors of the participants are presented in Table 1.

Table 1.
Characteristics and cardiovascular risk factors in renal transplant recipients (n = 106).
2.3. Traditional and Nontraditional CVD Risk Factors
The traditional risk factors of CVD are older age (>65 years); male gender [20,21]; obesity, defined as BMI ≥ 24 kg/m2 [25] on the basis of the Taiwan Ministry of Health and Welfare (MOHW) guidelines; high WC, defined as ≥90 cm for men and ≥80 cm for women [26]; and total body fat (TBF) ≥ 25% and ≥30% for men and women, respectively [22]. Other risk factors include hypertension, diabetes mellitus, and dyslipidemia. Hypertension [27] was defined as systolic blood pressure ≥130 mmHg and diastolic blood pressure ≥80 mmHg. Diabetes mellitus [28] was defined as fasting plasma glucose ≥126 mg/dL and examined with regard to median HOMA-IR values ≥ 1.44. Dyslipidemia was defined according to the third report of the National Cholesterol Education Program in Adult Treatment Panel III (NCEP-ATP III) [29]: serum TC ≥ 200 mg/dL, serum TG ≥ 150 mg/dL, and serum LDL-C ≥ 100 mg/dL. The cutoff for serum HDL-C is under 40 mg/dL for men and under 50 mg/dL for women.
Among nontraditional CVD risk factors, anemia [6] was defined as Hb concentrations <12 g/dL for men and <13 g/dL for women. Poor renal function, chronic kidney disease stage 3b–5, was determined by an eGFR of <45 according to the K/DOQI guidelines. A concentration exceeding 0.5 mg/dL for hs-CRP, an inflammatory marker [23], was considered a risk factor for CVD. Hyperuricemia [30] was defined as uric acid concentration ≥7.0 mg/dL. Albumin-corrected calcium was measured as total calcium (mg/dL) + 0.8 × (4.0−serum albumin [in grams per deciliter]) [31]. The cutoffs for abnormal serum calcium, serum phosphorus, and serum potassium were <8.4 mg/dL, <3.5 mg/dL [5], and ≥5.0 mg/dL [31], respectively. Finally, the cutoff for intact parathyroid hormone (iPTH) was ≥150 pg/mL [6].
2.4. Dietary Intake
The participants completed dietary records over 3 days (2 weekdays and 1 weekend day) before visiting the dietitian for the latest follow-up session. In order to confirm dietary records, 24 h dietary recall was completed through face-to-face interviews by a well-trained dietitian. Dietary energy and nutrient intake were calculated using nutrition analysis software (Cofit Pro version 1.0.0, Cofit HealthCare Inc., Taipei, Taiwan) [32]. Macronutrient and micronutrient intakes were calculated according to guidelines presented in the database of the Taiwan MOHW [33]. The following guidelines were used for renal disease: the guidelines for the nutritional management of adult kidney transplant recipients [25], K/DOQI guidelines [4,5,6,7], the European Renal Best Practice Guidelines [34], and the MOHW dietary reference intakes [35]. The macronutrients and micronutrients examined and their intakes are presented by category in Table 2.
Table 2.
Dietary nutrient intake and the proportions of individuals within recommended target ranges (n = 106).
2.5. Statistical Analysis
Analyses were performed using SAS software, Version 9.4 of the SAS System (SAS Institute Inc., Cary, NC, USA). Data are presented as means ± standard deviations, medians (interquartile ranges), or percentages. To comprehensively evaluate the association between nutrient intake adequacy and CVD risk factors, multivariate logistic regression was conducted (with adjustments for age, gender, renal function, trans-plant vintage, and the Charlson comorbidity index) to estimate the odds ratios (ORs) and 95% confidence intervals (95% CIs). The significance level was set at p < 0.05.
3. Results
3.1. Characteristics and CVD Risk Factors of RTRs
A total of 106 eligible RTRs were analyzed. The means of patient age, duration of dialysis treatment, and transplant vintage were 48.9 ± 12.8, 6.5 ± 4.9, and 8.6 ± 5.9 years, respectively. CVD risk factors were as follows: around 7.5% of the patients were older adults and 57.5% were men; regarding obesity, 41.5% had high WC, 51.9% had high BMI, and 50.9% had high TBF and abnormal plasma glucose and lipid profiles, 88.7% had high fasting plasma glucose, 50.1% had high TC, 65.1% had high LDL-C, 38.7% had low HDL-C, and 30.2% had high TG. All RTRs had CVD risk factors ranging from 4 to 14 risks (Table 1).
3.2. The Proportion of RTRs with Adequate Nutrient Intake
Overall, 27.4%, 18.0%, 20.8%, and 21.7% of the patients had adequate intakes of energy, protein, carbohydrates, and fat, respectively. Less than half of the RTRs reached the recommendations of nutrient intake, except for dietary MUFA (95.3%), vitamin A (50.0%), and C (59.4%), which were noted (Table 2).
3.3. Nutrient Intake Adequacy and Traditional CVD Risk Factors
The proportions of nutrients by traditional CVD risk factors are presented in Table S1. Adequate energy intake was significantly associated with lower odds of high median of HOMA-IR (OR, 0.05; 95% CI, 0.01–0.81, p = 0.003). Adequate vitamin A intake was significantly associated with lower odds of high TC (OR, 0.69; 95% CI, 0.52–0.91, p = 0.009). Adequate vitamin E intake was significantly associated with lower odds of low HDL-C (OR, 0.98; 95% CI, 0.96–1.00, p = 0.04). An unexpected result was the significant association of adequate carbohydrate intake with higher odds of high TG (OR, 1.26; 95% CI, 1.01–1.57, p = 0.04) (Table 3).
Table 3.
Odds ratios of having traditional cardiovascular disease risk factors among renal transplant recipients with adequate nutrient intake.
3.4. Nutrient Intake Adequacy and Nontraditional CVD Risk Factors
The proportions of nutrients by non-traditional CVD risk factors are presented in Table S2. Adequate intake of polyunsaturated fatty acids was significantly associated with lower odds of having low serum phosphate (OR, 0.99; 95% CI, 0.99–1.00, p = 0.04). Adequate phosphate intake was significantly associated with lower odds of hyperuricemia (OR, 0.66; 95% CI, 0.46–0.94, p = 0.02). Unexpected results were the significant association of adequate vitamin B2 intake (OR, 1.23; 95% CI, 1.01–1.50, p = 0.046) and iron intake (OR, 1.34; 95% CI, 1.01–1.80, p = 0.048) with high odds of anemia, as well as the significant association of adequate protein intake with high odds of hyperuricemia (OR, 1.32; 95% CI, 1.03–1.70, p = 0.03) (Table 4).
Table 4.
Odds ratios of having non-traditional cardiovascular disease risk factors among renal transplant recipients with adequate nutrient intake.
4. Discussion
Only a low proportion of the participants had adequate macronutrient and micronutrient intakes, consistent with a previous observation of poor compliance with dietary guidelines in stable RTRs [17]. Adequate nutrient intake was significantly associated with lower likelihoods of the occurrence of multiple traditional and nontraditional CVD risk factors.
A lower proportion of RTRs in the present study had adequate energy intake compared with that in a previous study [36] (27.4% vs. 51.6%) in which 31 Japanese renal allograft recipients were followed for more than 10 years. However, the proportions of patients with adequate protein intake (87.4% vs. 87%) were comparable. A higher proportion of the present participants had adequate fat intake (39.8% vs. 29%) and high median carbohydrate intake (205.9 vs. 196 g). Notably, the present study had higher proportions of RTRs with high TC (50.1%) and high LDL-C (65.1%) than did a study on Taiwanese patients receiving hemodialysis treatment (18.7% and 48.4%, respectively). By contrast, the proportions of RTRs with low HDL-C and TG (38.7% and 30.2%, respectively) were lower than those in a previous study (65.9% and 42.7%, respectively) [37]. These comparisons indicate that patients’ lipid profiles may remain abnormal even after they receive renal transplants.
CVD is a major cause of mortality in RTRs [15]. Adequate intakes of energy, protein, and carbohydrates can reduce CVD risk in patients with chronic kidney disease [4,5,6,7,25,36]. No significant difference was noted in the present study between adequate protein and carbohydrate intakes and reductions in CVD risk, but adequate carbohydrate intake was associated with higher odds of high TG. Immunosuppression medication, such as a mammalian target of rapamycin (mTOR) inhibitor, among RTRs may affect serum lipid metabolism [38]. In the present study, a total of 61 RTRs (57.5%) were receiving mTOR medication and 12 RTRs (19.6%) had high serum TG (data were not shown in table.). In addition, the association of high serum TG with the high intake of simple sugars in RTRs, especially fructose, is attributable to high endotoxin concentrations [39], which reduces satiety and increases appetite [40] through the impaired or failed induction of the postprandial leptin response or the inhibition of ghrelin suppression. Further studies on various sugar-containing foods are warranted to examine the effect of carbohydrate or simple sugar intake on CVD risk factors.
Adequate protein intake was associated with high odds of hyperuricemia in the present study, in line with results from a cross-sectional study including 3978 middle-aged men—specifically, a positive association between hyperuricemia and high intake of animal protein (e.g., red meat and seafood) and a negative association between hyperuricemia with the high intake of purine-rich vegetables and soy-containing foods [41]. In the present study, 82% of RTRs had adequate or high protein intake (1.12 g ± 0.3 g/kg), suggesting that the association between hyperuricemia and different protein sources should be further examined to facilitate guidance in nutritional therapy.
Regarding fat intake, no significant difference was observed between fatty acid intake and serum TG, TC, LDL-C, and HDL-C, consistent with results from a study on patients receiving hemodialysis treatment [39,42]. However, adequate polyunsaturated fatty acid intake was associated with lower odds of hypophosphatemia in the present study, supporting the argument that adequate intake of the class of fatty acids is essential for RTRs [7]. Further research is required to evaluate the association between n-3 polyunsaturated fatty acids and CVD risk factors.
Adequate intakes of vitamins A and E were significantly associated with lower odds of hypercholesterolemia and low HDL-C, in line with the assertion that the abundance of dietary antioxidants in vitamins A, C, E, and D helps to prevent CVD [43]. Moreover, deficiencies in vitamins A, C, E, and D are correlated with high risk of metabolic syndrome [44]. This may be ascribable to the fact that adequate vitamin intake is associated with lower mean DNA methylation levels of ATP-binding cassette transporter A1, which is in turn inversely associated with HDL-C metabolism [45].
Adequate phosphate intake was associated with lower odds of hyperuricemia, a result supported by the inverse association between serum phosphate levels and hyperuricemia reported by Cao et al. [46]. This may be because low serum phosphate levels strongly induce DNA damage [47] and contribute to the release of purine nucleotides; the degradation of AMP to inosine monophosphate by adenosine deaminase in hypophosphatemia may accelerate the synthesis of uric acid [48]. Notably, a previous study also elucidated a link between dietary and serum phosphorus concentrations and CVD events in patients receiving hemodialysis treatment [49].
Our study has several strengths and limitations. First, to the best of our knowledge, this is the first study to investigate the associations between nutrient intake and CVD risk in RTRs. However, causality cannot be inferred from the results because of its cross-sectional nature; further well-designed prospective studies and randomized controlled trials are warranted to determine whether the present findings are generalizable to other populations of RTRs. Second, the contribution of diet to metabolic risk in RTRs may be dependent on food composition. Further studies should be conducted with subgroups of the various types of dietary carbohydrates, proteins, and fatty acids. Third, although this was not a randomized controlled trial, our results were analyzed using reliable laboratory data, epidemiological methods, and various comprehensive tools and measures (e.g., 3-day dietary records with 24 h recall) to determine dietary quality. These methods have been used to assess the dietary intake of RTRs, examine their nutrition-related problems [32,37,50], and raise awareness about their nutritional status and CVD risk. Finally, the results are not generalizable to other areas of world where the diet may be different, and the small sample size precluded the examination of the interactions between nutrients. For example, dietary calcium, phosphate, and magnesium can interact with fatty acids; they reduce the absorption of saturated fatty acids and are positively correlated with high serum TC, among other CVD risk factors [51].
5. Conclusions
The present study comprehensively analyzed the dietary intake of macronutrients and micronutrients and their associations with traditional and nontraditional CVD risk factors among RTRs. Adequate nutrient intake was associated with a 94.6% lower risk of CVD. Dietary recommendations for RTRs should emphasize adherence to dietary guidelines for CVD prevention. Further longitudinal studies and randomized controlled trials are warranted to verify our findings.
Supplementary Materials
The following are available online at https://www.mdpi.com/article/10.3390/ijerph18168448/s1, Table S1: Proportion of nutrient intake with traditional cardiovascular risk factors among renal transplant recipients (n = 106), Table S2: Proportion of nutrient intake with nontraditional cardiovascular risk factors among renal transplant recipients (n = 106).
Author Contributions
Conceptualization, I.-H.L., T.V.D., T.-C.W. and S.-H.Y.; methodology, I.-H.L. and T.V.D.; software, I.-H.L.; S.-W.N. and I.-H.T.; validation, T.V.D., T.-C.W. and S.-H.Y.; analysis and interpretation of data, I.-H.L., T.V.D.; investigation, I.-H.L., S.-W.N., H.-H.W. and Y.-J.C.; resources, H.-H.W. and Y.-J.C.; data curation, I.-H.L., T.V.D., S.-W.N. and I.-H.T.; writing—original draft, I.-H.L.; writing—review and editing, I.-H.L., T.V.D. and S.-H.Y.; visualization, I.-H.L.; supervision, T.V.D., T.-C.W. and S.-H.Y.; project administration, I.-H.L., S.-W.N., H.-H.W. and Y.-J.C. All authors have read and agreed to the published version of the manuscript.
Funding
This research was funded by Chang Gung Memorial Hospital, grant number CMRPG3F2001-2.
Institutional Review Board Statement
The study was conducted according to the guidelines of the Declaration of Helsinki and approved by the Institutional Review Board of Chang Gung Medical Foundation (No. 201600954B0).
Informed Consent Statement
Informed consent was obtained from all subjects involved in the study. Written informed consent has been obtained from the patient(s) to publish this paper.
Data Availability Statement
The original contributions presented in the study are included in the article/supplementary material; further inquiries can be directed to the corresponding author.
Acknowledgments
The authors thank the participants and the medical personnel at Linkou Chang Gung Memorial Hospital for their contributions. This work was supported by Chang Gung Memorial Hospital under grant number CMRPG3F2001-2. The manuscript was edited by Wallace Academic Editing and complies with ethical guidelines for authorship and publishing.
Conflicts of Interest
The authors declare no conflict of interest.
References
- Reimer, J.; Franke, G.H.; Lütkes, P.; Kohnle, M.; Gerken, G.; Philipp, T.; Heemann, U. Quality of life in patients before and after kidney transplantation. Psychother. Psychosom. Med. Psychol. 2002, 52, 16–23. [Google Scholar] [CrossRef]
- National Health Research Institutes. Annual Report on Kidney Disease in Taiwan 2018; National Health Research Institutes: Miaoli, Taiwan; Available online: http://w3.nhri.org.tw/nhri_org/rl/lib/NewWeb/nhri/ebook/39000000448683.pdf (accessed on 1 June 2019).
- Wen, C.P.; Cheng, T.Y.D.; Tsai, M.K.; Chang, Y.C.; Chan, H.T.; Tsai, S.P.; Chiang, P.H.; Hsu, C.C.; Sung, P.K.; Hsu, Y.H.; et al. All-cause mortality attributable to chronic kidney disease: A prospective cohort study based on 462293 adults in Taiwan. Lancet 2008, 371, 2173–2182. [Google Scholar] [CrossRef]
- Kopple, J.D. National kidney foundation K/DOQI clinical practice guidelines for nutrition in chronic renal failure. Am. J. Kidney Dis. 2001, 37, 66–70. [Google Scholar] [CrossRef]
- Massry, S.G.; Coburn, J.W.; Chertow, G.M.; Hruska, K.; Langman, C.; Malluche, H.; Martin, K.; McCann, L.M.; McCarthy, J.T.; Moe, S. K/DOQI clinical practice guidelines for bone metabolism and disease in chronic kidney disease. Am. J. Kidney Dis. 2003, 42, 1–201. [Google Scholar]
- Foundation, N.K., II. Clinical practice guidelines and clinical practice recommendations for anemia in chronic kidney disease in adults. Am. J. Kidney Dis. 2006, 47, 16–85. [Google Scholar]
- Ikizler, T.A.; Burrowes, J.D.; Byham-Gray, L.D.; Campbell, K.L.; Carrero, J.-J.; Chan, W.; Fouque, D.; Friedman, A.N.; Ghaddar, S.; Goldstein-Fuchs, D.J. KDOQI clinical practice guideline for nutrition in CKD: 2020 update. Am. J. Kidney Dis. 2020, 76, 1–107. [Google Scholar] [CrossRef] [PubMed]
- Liefeldt, L.; Budde, K. Risk factors for cardiovascular disease in renal transplant recipients and strategies to minimize risk. Transpl. Int. 2010, 23, 1191–1204. [Google Scholar] [CrossRef]
- Rigatto, C. Management of cardiovascular disease in the renal transplant recipient. Cardiol. Clin. 2005, 23, 331–342. [Google Scholar] [CrossRef]
- Kasiske, B.L.; Chakkera, H.A.; Roel, J. Explained and unexplained ischemic heart disease risk after renal transplantation. J. Am. Soc. Nephrol. 2000, 11, 1735–1743. [Google Scholar] [CrossRef]
- Rangaswami, J.; Mathew, R.O.; Parasuraman, R.; Tantisattamo, E.; Lubetzky, M.; Rao, S.; Yaqub, M.S.; Birdwell, K.A.; Bennett, W.; Dalal, P. Cardiovascular disease in the kidney transplant recipient: Epidemiology, diagnosis and management strategies. Nephrol. Dial. Transplant. 2019, 34, 760–773. [Google Scholar] [CrossRef]
- Gansevoort, R.T.; Correa-Rotter, R.; Hemmelgarn, B.R.; Jafar, T.H.; Heerspink, H.J.L.; Mann, J.F.; Matsushita, K.; Wen, C.P. Chronic kidney disease and cardiovascular risk: Epidemiology, mechanisms, and prevention. Lancet 2013, 382, 339–352. [Google Scholar] [CrossRef]
- Sezer, S.; Ozdemir, F.N.; Afsar, B.; Colak, T.; Kızay, U.; Haberal, M. Subjective Global Assessment Is a Useful Method to Detect Malnutrition in Renal Transplant Patients. Transplant. Proc. 2006, 38, 517–520. [Google Scholar] [CrossRef]
- Bernardi, A.; Biasia, F.; Pati, T.; Piva, M.; D’Angelo, A.; Bucciante, G. Long-Term Protein Intake Control in Kidney Transplant Recipients: Effect in Kidney Graft Function and in Nutritional Status. Am. J. Kidney Dis. 2003, 41, 146–152. [Google Scholar] [CrossRef]
- Chan, W.; Bosch, J.A.; Jones, D.; McTernan, P.G.; Phillips, A.C.; Borrows, R. Obesity in kidney transplantation. J. Ren. Nutr. 2014, 24, 1–12. [Google Scholar] [CrossRef]
- Zeltzer, S.M.; Taylor, D.O.; Tang, W.W. Long-term dietary habits and interventions in solid-organ transplantation. J. Heart Lung Transplant. 2015, 34, 1357–1365. [Google Scholar] [CrossRef] [Green Version]
- Lin, I.H.; Wong, T.C.; Nien, S.W.; Chou, Y.T.; Chiang, Y.J.; Wang, H.H.; Yang, S.H. Dietary compliance among renal transplant recipients: A single-center study in Taiwan. Transplant. Proc. 2019, 51, 1325–1330. [Google Scholar] [CrossRef] [PubMed]
- Cai, Q.; Osté, M.C.J.; Gomes-Neto, A.W.; Dekker, L.H.; Borgonjen-van den Berg, K.J.; Geleijnse, J.M.; Bakker, S.J.L.; de Borst, M.H.; Navis, G.J. Metabolic syndrome-related dietary pattern and risk of mortality inkidney transplant recipients. Nutr. Metab. Cardiovasc. Dis. 2021, 31, 1129–1136. [Google Scholar] [CrossRef]
- Matthews, D.R.; Hosker, J.; Rudenski, A.; Naylor, B.; Treacher, D.; Turner, R. Homeostasis model assessment: Insulin resistance and β-cell function9 from fasting plasma glucose and insulin concentrations in man. Diabetologia 1985, 28, 412–419. [Google Scholar] [CrossRef] [Green Version]
- Sarnak, M.J.; Levey, A.S. Cardiovascular disease and chronic renal disease: A new paradigm. Am. J. Kidney Dis. 2000, 35, 117–131. [Google Scholar] [CrossRef]
- Yerram, P.; Karuparthi, P.R.; Hesemann, L.; Horst, J.; Whaley-Connell, A. Chronic kidney disease and cardiovascular risk. J. Am. Soc. Hypertens. 2007, 1, 178–184. [Google Scholar] [CrossRef]
- Okorodudu, D.; Jumean, M.; Montori, V.M.; Romero-Corral, A.; Somers, V.; Erwin, P.; Lopez-Jimenez, F. Diagnostic performance of body mass index to identify obesity as defined by body adiposity: A systematic review and meta-analysis. Int. J. Obes. 2010, 34, 791–799. [Google Scholar] [CrossRef] [Green Version]
- Ridker, P.M. High-sensitivity C-reactive protein: Potential adjunct for global risk assessment in the primary prevention of cardiovascular disease. Circulation 2001, 1103, 1813–1818. [Google Scholar] [CrossRef] [Green Version]
- Kovesdy, C.P. Management of hyperkalaemia in chronic kidney disease. Nat. Rev. Nephrol. 2014, 10, 653–662. [Google Scholar] [CrossRef]
- Hwang, L.C.; Bai, C.H.; Chen, C.J. Prevalence of obesity and metabolic syndrome in Taiwan. J. Formos. Med. Assoc. 2006, 105, 626–635. [Google Scholar] [CrossRef] [Green Version]
- Alberti, K.G.M.; Zimmet, P.; Shaw, J. The metabolic syndrome—A new worldwide definition. Lancet 2005, 366, 1059–1062. [Google Scholar] [CrossRef]
- Fry, K.; Patwardhan, A.; Ryan, C.; Trevillian, P.; Chadban, S.; Westgarth, F.; Chan, M. Development of evidence-based guidelines for the nutritional management of adult kidney transplant recipients. J. Ren. Nutr. 2009, 19, 101–104. [Google Scholar] [CrossRef]
- Mellitus, D. Diagnosis and classification of diabetes mellitus. Diabetes Care 2014, 37, 81–90. [Google Scholar]
- James, I. Executive Summary of the Third Report of the National Cholesterol Education Program (NCEP) Expert Panel on Detection, Evaluation, and Treatment of High Blood Cholesterol in Adults (Adult Treatment Panel III). JAMA 2001, 285, 2486–2497. [Google Scholar] [CrossRef]
- Taiwan College of Rheumatology. Taiwan Guideline for the Management of Gout Andhyperuricemia-Updated 2016; Taiwan College of Rheumatology: Kaohsiung, Taiwan; Available online: http://www.rheumatology.org.tw/news/newsupload/N20161014151627_2016%E7%97%9B%E9%A2%A8%E6%8C%87%E5%BC%951014.pdf (accessed on 14 October 2016).
- Portale, A.A. Blood calcium, phosphorus, and magnesium. In Primer on the Metabolic Bone Diseases and Disorders of Mineral. Metabolism; Williams & Wilkins: Lippincott, PA, USA, 1999; pp. 115–118. [Google Scholar]
- Lin, I.H.; Duong, T.V.; Nien, S.W.; Tseng, I.; Wang, H.H.; Chiang, Y.J.; Chen, C.Y.; Wong, T.C. Dietary Diversity Score: Implications for Obesity Prevention and Nutrient Adequacy in Renal Transplant Recipients. Int. J. Environ. Res. Public Health 2020, 17, 5083. [Google Scholar] [CrossRef]
- Taiwan Food and Drug Administration. Taiwanese Food Composition and Nutrient Database. 2017. Available online: https://consumer.fda.gov.tw/Food/TFND.aspx?nodeID=178 (accessed on 7 December 2018).
- Fouque, D.; Vennegoor, M.; Ter Wee, P.; Wanner, C.; Basci, A.; Canaud, B.; Haage, P.; Konner, K.; Kooman, J.; Martin-Malo, A. EBPG guideline on nutrition. Nephrol. Dial. Transplant. 2007, 22, 45–87. [Google Scholar] [CrossRef] [Green Version]
- Taiwan Ministry of Health and Welfare. Seventh Revision of Taiwan Dietary Reference Intakes. 2019. Available online: https://www.hpa.gov.tw/File/Attach/725/File_1674.pdf (accessed on 16 October 2019).
- Sasaki, H.; Suzuki, A.; Kusaka, M.; Fukami, N.; Shiroki, R.; Itoh, M.; Takahashi, H.; Uenishi, K.; Hoshinaga, K. Nutritional status in Japanese renal transplant recipients with long-term graft survival. Transplant. Proc. 2015, 47, 367–372. [Google Scholar] [CrossRef]
- Duong, T.V.; Wong, T.C.; Su, C.T.; Chen, H.H.; Chen, T.W.; Chen, T.H.; Hsu, Y.H.; Peng, S.J.; Kuo, K.L.; Liu, H.C. Associations of dietary macronutrients and micronutrients with the traditional and nontraditional risk factors for cardiovascular disease among hemodialysis patients: A clinical cross-sectional study. Medicine 2018, 97, 11306–11314. [Google Scholar] [CrossRef] [PubMed]
- Peddi, V.R.; Wiseman, A.; Chavin, K.; Slakey, D. Review of combination therapy with mTOR inhibitors and tacrolimus minimizationafter transplantation. Transplant. Rev. 2013, 27, 97–107. [Google Scholar] [CrossRef] [PubMed]
- Chan, W.; Smith, B.; Stegall, M.; Borrows, R. Obesity and metabolic syndrome in kidney transplantation: The role of dietary fructose and systemic endotoxemia. Transplantation 2019, 103, 191–201. [Google Scholar] [CrossRef]
- Teff, K.L.; Elliott, S.S.; Tschöp, M.; Kieffer, T.J.; Rader, D.; Heiman, M.; Townsend, R.R.; Keim, N.L.; D’Alessio, D.; Havel, P.J. Dietary fructose reduces circulating insulin and leptin, attenuates postprandial suppression of ghrelin, and increases triglycerides in women. J. Clin. Endocrinol. Metab. 2004, 89, 2963–2972. [Google Scholar] [CrossRef]
- Villegas, R.; Xiang, Y.B.; Elasy, T.; Xu, W.-H.; Cai, H.; Cai, Q.; Linton, M.; Fazio, S.; Zheng, W.; Shu, X.O. Purine-rich foods, protein intake, and the prevalence of hyperuricemia: The Shanghai Men’s Health Study. Nutr. Metab. Cardiovasc. Dis. 2012, 22, 409–416. [Google Scholar] [CrossRef] [Green Version]
- Kooshki, A.; Taleban, F.A.; Tabibi, H.; Hedayati, M. Effects of omega-3 fatty acids on serum lipids, lipoprotein (a), and hematologic factors in hemodialysis patients. Ren. Fail. 2011, 33, 892–898. [Google Scholar] [CrossRef] [Green Version]
- Jung, K.; Kim, S.; Woo, J.; Chang, Y. The effect of dietary intervention through the modification of fatty acids composition and antioxidant vitamin intake on plasma TXB (2) level in Korean postmenopausal women with hypercholesterolemia. J. Korean Med. Sci. 2002, 17, 307–315. [Google Scholar] [CrossRef] [PubMed] [Green Version]
- Godala, M.; Materek-Kuśmierkiewicz, I.; Moczulski, D.; Rutkowski, M.; Szatko, F.; Gaszyńska, E.; Tokarski, S.; Kowalski, J. The risk of plasma vitamin A, C, E and D deficiency in patients with metabolic syndrome: A case-control study. Adv. Clin. Exp. Med. 2017, 26, 581–586. [Google Scholar] [CrossRef] [Green Version]
- Fujii, R.; Yamada, H.; Munetsuna, E.; Yamazaki, M.; Ando, Y.; Mizuno, G.; Tsuboi, Y.; Ohashi, K.; Ishikawa, H.; Hagiwara, C. Associations between dietary vitamin intake, ABCA1 gene promoter DNA methylation, and lipid profiles in a Japanese population. Am. J. Clin. Nutr. 2019, 110, 1213–1219. [Google Scholar] [CrossRef]
- Cao, J.; Zhang, J.; Li, Q.; Jiang, C.; Song, Y.; Liu, C.; Liu, L.; Wang, B.; Li, J.; Zhang, Y. Serum phosphate and the risk of new-onset hyperuricemia in hypertensive patients. Hypertension 2019, 74, 102–110. [Google Scholar] [CrossRef]
- Takeda, E.; Taketani, Y.; Sawada, N.; Sato, T.; Yamamoto, H. The regulation and function of phosphate in the human body. Biofactors 2004, 21, 345–355. [Google Scholar] [CrossRef] [PubMed]
- Nishida, Y.; Ito, K. Decreased renal phosphate threshold in patients with gout. Nephron 1992, 62, 142–144. [Google Scholar] [CrossRef]
- Tentori, F.; Blayney, M.J.; Albert, J.M.; Gillespie, B.W.; Kerr, P.G.; Bommer, J.; Young, E.W.; Akizawa, T.; Akiba, T.; Pisoni, R.L. Mortality risk for dialysis patients with different levels of serum calcium, phosphorus, and PTH: The Dialysis Outcomes and Practice Patterns Study (DOPPS). Am. J. Kidney Dis. 2008, 52, 519–530. [Google Scholar] [CrossRef]
- Rho, M.R.; Lim, J.H.; Park, J.H.; Han, S.S.; Kim, Y.S.; Lee, Y.H.; Kim, W.G. Evaluation of nutrient intake in early post kidney transplant recipients. Clin. Nutr. Res. 2013, 2, 1–11. [Google Scholar] [CrossRef] [Green Version]
- Vaskonen, T. Dietary minerals and modification of cardiovascular risk factors. J. Nutr. Biochem. 2003, 14, 492–506. [Google Scholar] [CrossRef]
Publisher’s Note: MDPI stays neutral with regard to jurisdictional claims in published maps and institutional affiliations. |
© 2021 by the authors. Licensee MDPI, Basel, Switzerland. This article is an open access article distributed under the terms and conditions of the Creative Commons Attribution (CC BY) license (https://creativecommons.org/licenses/by/4.0/).