Abstract
Dementia was one of the conditions focused on in an EU (European Union) project called “PARADISE” (Psychosocial fActors Relevant to brAin DISorders in Europe) that later produced a measure called PARADISE 24, developed within the biopsychosocial model proposed in the International Classification of Functioning Disability and Health (ICF). The aims of this study are to validate PARADISE 24 on a wider sample of patients with mild to moderate dementia to expand PARADISE 24 by defining a more specific scale for dementia, by adding 18 questions specifically selected for dementia, which eventually should be reduced to 12. We enrolled 123 persons with dementia, recruited between July 2017 and July 2019 in home care and long-term care facilities, in Italy, and 80 participants were recruited in Warsaw between January and July 2012 as part of a previous cross-sectional study. The interviews with the patient and/or family were conducted by health professionals alone or as a team by using the Paradise data collection protocol. The psychometric analysis with the Rasch analysis has shown that PARADISE 24 and the selection of 18 additional condition-specific items can be expected to have good measurement properties to assess the functional state in persons with dementia.
1. Introduction
Dementia is a syndrome that causes deterioration of cognitive functions that also affects the quality of life, and causes distress in families and communities, increasing demand for healthcare and social services. Nowadays it is a global epidemic involving 50 million patients worldwide representing the 7th leading cause of death [1].
In May 2017, the World Health Assembly endorsed the “Global action plan on the public health response to dementia 2017–2025” [2], recognizing dementia as a public health main target. Among the tools developed by WHO, the International Classification of Functioning, Disability and Health (ICF), systematically groups different health domains and health-related domains (e.g., what a person can do or does do when he or she has a given health condition). Indeed, clinical information alone is not able to depict the health experience of a person with disabilities, thus limiting the possibility to plan adequate health services, required level of assistance, use of appropriate aids and social integration, etc. [3].
As for dementia, clinicians should be able to assess functional performance, where this information is integral to understanding health and for the optimal provision of clinical care and implementation of individual measures of rehabilitation designed to improve executive function. Functional status can be conceptualized as the ability to perform self-care, self-maintenance, and physical activity. A person with dementia usually requires help with more complex tasks, such as managing bills and finances or simply maintaining a household. Good functional performance is fundamental for elderly people to maintain independence and avoid institutionalization [4].
In dementia patients, functional capacity and functional impairment are not a uniform construct nowadays; rather, they are multifaceted and can be measured with various clinical instruments. Many scales have been validated for use in patients with Alzheimer’s disease (AD) in order to characterize functional impairment and to evaluate the clinical staging of dementia or the efficacy of treatment. Several methods, such as psychometric testing, evaluate only one dimension, typically cognition, mood, communication capability, or behavioral problems [5,6,7]. Therefore, many combinations of simpler psychometric and behavioral evaluations have been variously used for the assessment of dementia patients with different degrees of severity. Reliability, validity, and correlational data are discussed if the test is used alone or in a different combination of assessing methods [8].
The ICF represents a good chance for a better understanding of the functional issues associated with dementia. ICF is a classification that can provide a basis to select relevant categories from functioning domains that describe functioning with dementia. To date, an ICF core-set containing the full spectrum of the problems of patients with dementia does not exist. An assessment tool, ideally personalized, multidimensional, and a complete scale for easier and more suitable use in dementia patients is also still missing.
The assessment of disability in patients with dementia, through the ICF model, allows for the ability to formulate a dynamic functional profile and identify the associations among the health condition, comorbidities, environmental and personal factors with disability levels. A previous study was carried out across a network of Calabrian Long Term Care (LTC) Facilities conducted by ANASTE (Associazione Nazionale Strutture e Territorio), which aimed to describe disability by means of ICF profiles for the Activity and Participations domains in a cohort of residents suffering from moderate-severe Alzheimer’s Disease (AD) and Vascular Dementia (VD), showed that the goals of care processed according to the indicators of ICF Capacity and Performance, allow an improvement of disability assessment in the two forms of dementia. The use of the ICF can guide the planning of health care interventions for patients with dementia, taking into account important aspects of daily life, usually less considered, such as communication, social relationships, and leisure activities [9].
Dementia was listed as one of the conditions focused on in an EU (European Union) project called “PARADISE” (Psychosocial fActors Relevant to brAin DISorders in Europe) that later produced a measure called PARADISE 24. This scale was used to assess the impact of psychosocial difficulties on the lives of people with nine different brain disorders (dementia was one of these conditions) through 24 questions [10,11]. The severity of these Psychosocial Difficulties (PSDs) depends on many factors including social, physical, and political environments within the biopsychosocial model proposed in the ICF [12]. The items included in PARADISE 24 presented generally good measurement properties and a few limitations [11]. The authors further advised testing the instrument on a larger number of people affected by specific brain disorders to complete the process of validation on larger sample sizes. Furthermore, instead of one metric for brain disorders, it could be necessary to develop scales dedicated to specific neurologic or psychiatric conditions [11].
The ANASTE Humanitas Foundation, a scientific branch of ANASTE, started a project aimed, first of all, at testing PARADISE 24 on a wider sample of patients with mild to moderate dementia in different care settings (facilities, day-care centers, and homes). Further, the project expanded PARADISE 24 by defining a more specific scale for dementia and adding to the 24 questions of PARADISE, 12 questions specifically selected for dementia.
The aims of this study are to validate PARADISE 24 on a wider sample of patients with mild to moderate dementia, to corroborate the 18 condition-specific selected items, and to gather recommendations to reduce the set of items towards a PARADISE-EDEN (Empowering DEmentia Narrative), 24 + 12 items version, specific for dementia patients. The specific aims are to test the metric properties of the 24-items and the 18-items scale through a psychometric analysis with the Rasch analysis [13].
2. Methods
2.1. Study Design and Samples
This study is aimed at testing the metric properties of the PARADISE 24 items, selected for the assessment of brain injuries, in a population of persons with Dementia. In addition to these 24 items, the EDEN collection included 18 functioning items from the original 64 items version that were expected to be more sensitive in a dementia population (Table 1: Item 25 to Item 42).

Table 1.
Fit of items including infit and outfit statistic and presence of DIF for the 24 Paradise items, the 18 additional Eden items, and the two combined.
In order to reach the second target, it is important to take into account that the original questions addressing 64 PSDs were finally reduced in previous studies to include only 24 items in the PARADISE 24 metric [11]. In fact, the PARADISE 24 assessment scale kept the items with the best psychometric properties and most representative for the assessment of functioning across the nine brain disorders. It can so be expected, that the original pool still contains items suitable for the assessment of a single condition such as dementia. In that sense, further items useful to develop a scale specific for dementia were chosen from the 40 discarded items that were originally included in the PARADISE research project. Eighteen additional items were selected based on the expertise of clinical and health care professionals, with wide experience in treating persons with dementia in a focus group exercise. The additional items were selected from the original 64 items pool used in PARADISE. Items from the pool were selected if they represented a problem for at least 33% of the patients with dementia. These items were further narrowed considering only those ranked in the first six positions among the most common items reporting difficulties in patients with dementia. Thus, a total of 18 items were selected that should ideally be reduced to 12 items to be more manageable, resulting in a set of 24 + 12 items, called PARADISE-EDEN (Empowering DEmentia Narrative), suitable for assessment of patients with dementia.
The data used for this study came from two different data collections. Originally, only data collected in a multi-setting cross-sectional study carried out in Italy between July 2017 and July 2019 in the realm of the PARADISE-EDEN project was intended for this study. This collection included data from N = 123 persons with dementia that were recruited between July 2017 and July 2019. The persons had a clinical diagnosis of dementia or a more specific diagnosis of probable or possible VD or AD [14,15,16]. The clinical diagnosis of dementia was firstly investigated through a detailed personal interview, as well as family history and, subsequently, confirmed by the administration of psychometric tests. The cognitive evaluation was conducted by Folstein’s Mini-Mental State Examination (MMSE) [17]. According to MMSE, the patients were affected by slight cognitive impairment, if MMSE scores ranged from 21–23. The functional state was evaluated by use of the Activity Daily Living scale (ADL) [18], according to which a lower score indicates a worse functional state. The EDEN data collection was conducted in conformity with the ethical principles of the European Commission Research Ethics Committee. The study and the informed consent used were approved by the Ethics Committee of Calabria Region.
A sample size of N = 123 appeared small to perform a reliable Rasch analysis. To increase the power of the psychometric analysis, it was decided to add the observations from the PARADISE survey that included adult participants having a main ICD-10 diagnosis of dementia. The PARADISE survey aimed to understand the impact of brain disorders on people’s lives, based on the Psychosocial Difficulties (PSDs) that are experienced in common across brain disorders. The data were collected as part of a cross-sectional study using convenience sampling and retained N = 80 participants who were at the Institute of Psychiatry and Neurology in Warsaw between January and July 2012. The interviews with the patient and/or family were conducted by health professionals alone or as a team, specifically trained on ICF, by using the PARADISE data collection protocol. More information about the PARADISE data can be found in other papers [10,11]. The PARADISE data collection was conducted in conformity with the ethical principles of the EC Research Ethics as well as by the Ethics Committee of the Institute of Psychiatry and Neurology in Warsaw, Poland. Participants were informed of the purpose and rationale of the study and signed a consent form.
Differences in the functioning of the questionnaire items based on the data collection were undertaken as part of a so-called analysis of differential item functioning (DIF), as further explained in the next section.
2.2. Statistical Analysis
Psychometric analyses using the Rasch analysis, here more specifically a Partial Credit Model (PCM) for polytomous data [19], typically test a series of metric assumptions to determine the good fit of the psychometric model to the data. A Rasch analysis observes if the data collected through an assessment form with ordinally scaled items present specific characteristics essential for measurement. In practice, beyond the general fit to the model, the measurement assumptions that are tested are: reliability, targeting, item fit, monotonicity, absence of local item dependencies (LID), unidimensionality, and absence of differential item functioning (DIF) [20]. If these assumptions are met, a test form is considered “fit” for measurement and delivers an interval scaled raw score [21]. The psychometric analyses of the different selection of PSD items, i.e., PARADISE 24, EDEN 18, and the two sets combined, followed a strictly identical approach in terms of assumptions that were tested, the methods that were applied, therefore, and the interpretation of the statistical outputs.
Reliability: When reporting psychometric analyses, the reliability coefficient is considered a critical statistic to support the quality of an assessment scale [22]. The Cronbach α is the most widely used measure of reliability and is a measure of the internal consistency of the data, i.e., how well the items work to describe one construct [23]. In modern test theory, reliability is discussed in terms of separation, specifically the person and item separation. Two ways to formalize the separation are the Separation Indices and the Separation Coefficients. Typically, reliability is supported with an Index of 0.8, indicating good reliability and excellent reliability with values above 0.9 [20]. A low Item Separation Index means that the sample is not large enough to locate the items on the latent variable. A low Person Separation Index indicates that the measure fails to discriminate between different levels of ability. The Person and Item Coefficients describe the ‘true’ spread of items or individuals along the measurement continuum. A Person Separation Coefficient of 1.5 represents an acceptable level of separation and is considered the minimum required to divide the sample into two distinct strata (i.e., low and high levels of functioning). A Person Separation Coefficient of 2.0 represents a good level of separation. Strata can be derived from the Separation Coefficient and indicate the expected number of statistically distinguishable levels of functioning that the scale can assess [24].
Targeting: Good targeting of a test form indicates that the difficulty of an assessment matches the ability level of the respondents. In general, targeting requires that the mean item difficulty and mean person ability correspond, supporting that the test form is neither too difficult nor too easy for the respondents. The dispersion of the ability and difficulty estimates should also overlap, and ideally, the assessment spectrum should address the ability continuum of the sample.
Item Fit is supported when responses to test items are a function of the abilities of the respondents and the item difficulties. The good fit of the model function to the data is reflected through the analysis residuals. If the items are fitting the PCM, the mean squared residuals (MSQ) values per item are expected close to one, also called the Outfit. The Infit is a weighted total statistic for the MSQ that is less sensitive to outliers than the Outfit. In this analysis, the cut-off for good fit was determined using an approach that takes into account the sample size so that Outfit values > 1.42 and Infit values > 1.14 were indicative of misfit [25].
Monotonicity implies strictly increasing difficulty estimates for the item response thresholds. In practice, disordered response thresholds in some items are more the rule than the exception. Especially, items with many response options and poorly discriminating middle categories tend to show breaches of the threshold ordering [26,27]. The Paradise items were originally developed with five response options, but metric analyses showed that to respect the intended ordering, three options would perform better [10]. In that sense, the data collected in Italy used three response options, 1 = None, 2 = Mild to Moderate, and 3 = Severe to Extreme functioning problems. The additional original Paradise data, still rated on the 5-point response scale, was recoded accordingly. We also note here, that Item 16 assessing ’Problems in grooming, dressing, toileting or eating” was assessed as separate variables in the original data collection. They were now, aggregated into one item using the maximum score [11] and further recoded into three response options to be in line with the Eden collection.
Local Item Dependencies: LID often occurs when items are redundant and measure approximately the same or very similar aspects of a latent construct. Typically, high positive correlations of the standardized Rasch residuals, also named the fit statistic [28], indicate LID. Negative residual correlation can reveal the multidimensionality of the form. LID leads to inflated reliability estimates and may give a false impression of reliability [29,30]. For this analysis, with a sample size of N = 201, a non-conservative cut-off of was used to mainly flag items with a higher dependency.
Unidimensionality: For a valid score, the test form should measure only one construct. With several separate dimensions, one total score is not valid anymore. Principal Component Analysis (PCA) of the standardized Rasch residuals tests the unidimensionality by searching for non-random patterns in the analysis residuals [31]. A first eigenvalue < 1.8 was deemed indicative of unidimensionality.
Differential Item Functioning: The analysis of Differential Item Functioning (DIF) flags variables that lack invariance of the item difficulty across subgroups [32]. A two-way ANOVA was used to test for uniform and non-uniform (DIF variable × score level) DIF including the variables: gender, age grouped (1 = (70,80], 2 = (80,85], 3 = (85,95] years), the data collection (PARADISE versus EDEN), the diagnosis (vascular dementia, Alzheimer’s or other type of dementia) and Residency (home or inpatient care). The DIF analysis with ANOVA was corrected for multiple testing using the Benjamini-Hochberg correction for the false discovery rate [33]. For the DIF analysis, missing values were inputted to avoid the deletion of cases with missing values and consequent reduction of the already smaller sample size. The data were imputed using the R-Package missForest [34] which provides a robust imputation algorithm for data of mixed types.
3. Results
Sample and Item Descriptives: Table 2 shows the descriptive statistics of the sample and stratified by data collection, i.e., PARADISE versus EDEN. Groupwise significance tests are performed to compare the data collections using the t-test for continuous variables and -Test for categorical variables as a default [35]. The mean age was 82.55 years (SD = 6.95), and the mean ages in the two surveys were close to the sample average. The gender distributions and marital status also did not differ significantly across data collections. Most participants were female (76%), about half of the participants were widowed (56.7%), and more than a quarter were married (26.4%). In the Paradise data, most participants had completed high school or an equivalent level of education (40%), and about one-third (27.5%) had completed university. In the Eden collection, about one-third (27.3%) were illiterate, and most of the participants (55.4%) had completed primary school. Another significant difference was observed for the living situation where only 27% were living at home in the Eden collection, while for Paradise it was 87.5%. Overall, the entire sample presented a 44.3% diagnosis of Alzheimer’s disease and 47.4% vascular dementia, and the remaining participants had other forms of dementia. The percentages of diagnoses significantly differ across the two data collections with 61.3% of Alzheimer’s disease in the Paradise collection and 32.5% of the same diagnosis in the Eden collection. The mean MMSE was 21.1 (SD = 2.89) in the Paradise collection and 18.03 (SD = 3.83) for the Eden collection indicating on average mild to moderate levels of dementia. With regard to activities of daily living (ADL), most participants of the Paradise survey indicated being neither satisfied nor dissatisfied with their capacity to perform ADLs (41.2%). In the Eden data collection, most participants indicated a severe dependence in ADL (41.7%).
Table 2.
Sample Descriptives Stratified by Data Collection/Origin.
Appendix A presents the descriptive statistics, i.e., frequency and percentages, of the responses to the questionnaire items, also stratified by data collection. The numbers in the Appendix A show that the items were answered very differently and point to different levels of functioning between the two data collections. An explanation could be the significantly different percentages of persons living at home, where the Paradise sample included participants with higher levels of independence. This difference is not expected to harm the calibration of the questionnaire items as the mode of functioning of the items can still be apprehended independently of the levels of functioning. What matters is that the probability of an answer is a function of the difficulty of the question and the level of functioning of the respondent.
Missing Values: A few items showed a very high percentage of missing values. Item 17 ‘Difficulty with sexual activities’ had the highest number of missing values with a total N = 93 (46.3%) missing values. Among these N = 68 (85%) belonged to the Paradise collection and N = 25 (20.7%) to Eden. The lower percentage of missing values in the Eden data collection may be due to a higher emphasis on affection and desire to describe the libido than in the original data collection. Item 18 ‘Staying by yourself’ has also a noticeable number of missing values with N = 32 (15.9%) missing values overall, N = 18 (22.5%) missing values in the Paradise collection, and N = 14 (11.6%) in Eden. Item 22 ‘Difficulty in day-to-day work or school’ had a total of N = 77 (38.3%) missing values, with N = 54 (67.5%) in the original Paradise data collection, and N = 23 (19%) in the Eden collection. The Eden collection had a more relaxed definition of work than Paradise, where supervised occupations within the health care institution, for example, were considered as work.
Reliability: As shown in Table 3, the reliability of the PARADISE 24 items was very good, with an index of 0.9 and of 0.91. The supplementary EDEN 18 items, when calibrated separately, showed lower but still good reliability with an index of 0.88 and of 0.91. In the joint analyses with 42 items, the reliability index of 0.94 and 0.95 also support a very high reliability. However, it must be noted that at this stage, without further adjustments for local dependencies, the reliability estimates are inflated. If addressing these, the Person Separation reliability will decrease. However, starting at such a high level of reliability, at least some acceptable reliability can be expected if aggregating dependent items. All separation indices lie above 2.5 at this stage and indicate that several levels of functioning are distinguished statistically. More specifically, the strata indicate that more than four levels of functioning were found in the separate calibrations and at least six levels when analyzed jointly. The Paradise 24 items differentiate a little below six levels of functioning (5.89) while the Eden 18 items 6.58, and all items together 6.08.
Table 3.
Model fit including person-item targeting and reliability indices for the 24 Paradise items, the 18 additional Eden items, and the two combined.
Targeting: All three approaches presented good targeting with a difference between the mean level of difficulty and mean level of ability below 0.5 logits. The highest discrepancy is found in the analysis with the EDEN 18 items and represents 0.23 logits. The higher difference may be due to the specific targeting of dementia that this selection represents, making it a scale where the respondents were more likely to indicate higher levels of problems and difficulties.
Item fit was determined based on a sample size adjusted cut-off [25]. With a total sample size of N = 201, Infit < 1.14 and Outfit < 1.42 support absence of underfit. The item fit statistics are shown in Table 1. Based on Outfit, all items of PARADISE 24 showed good fit. Two items showed Infit values above the acceptable cut-off, namely Item 3Problems with appetite (Infit = 1.33), and Item 15Walking a long distance (Infit = 1.24). The supplementary items from the EDEN 18 selection presented all good item fit. When analyzed jointly, Item 3Problems with Appetite showed the worst fit of all items (Infit = 1.41, Outfit = 1.44). A few other items presented Infit values above cut-off: Item 10Bodily pain (Infit = 1.19), Item 12Difficulty in remembering (Infit = 1.15), Item 15Walking a long distance (Infit = 1.23), and Item 17Sexual activities (Infit = 1.19).
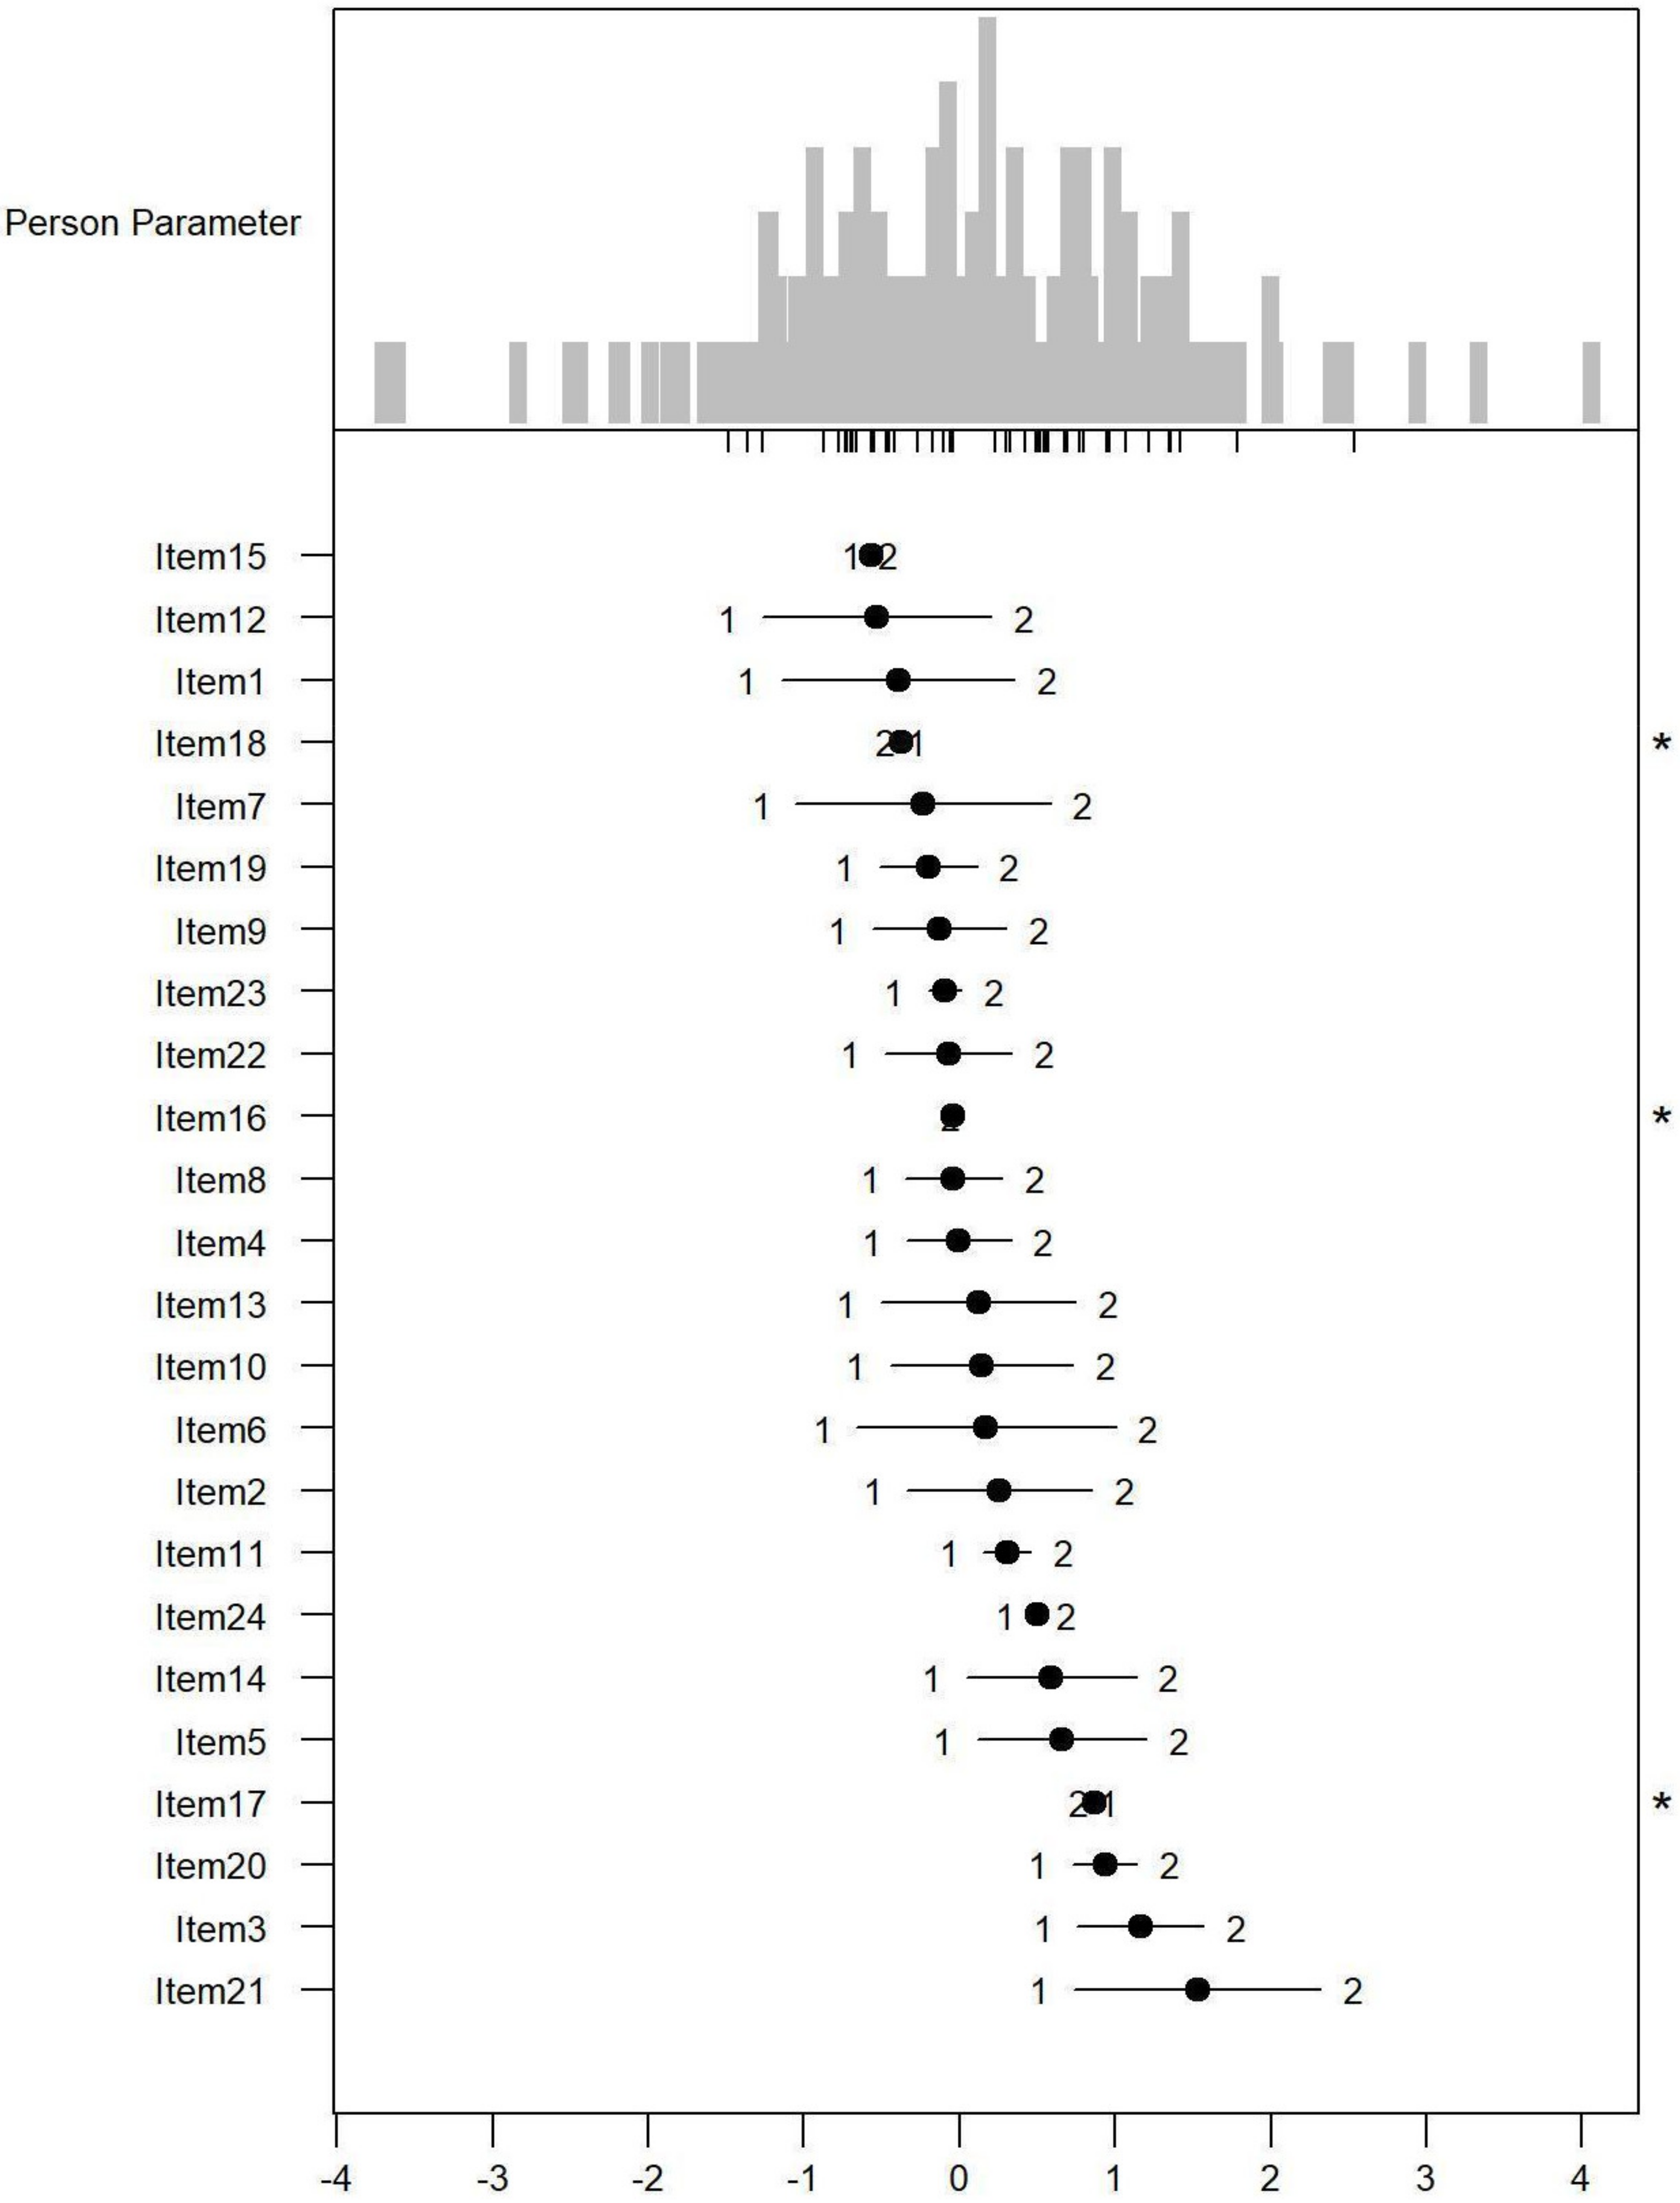
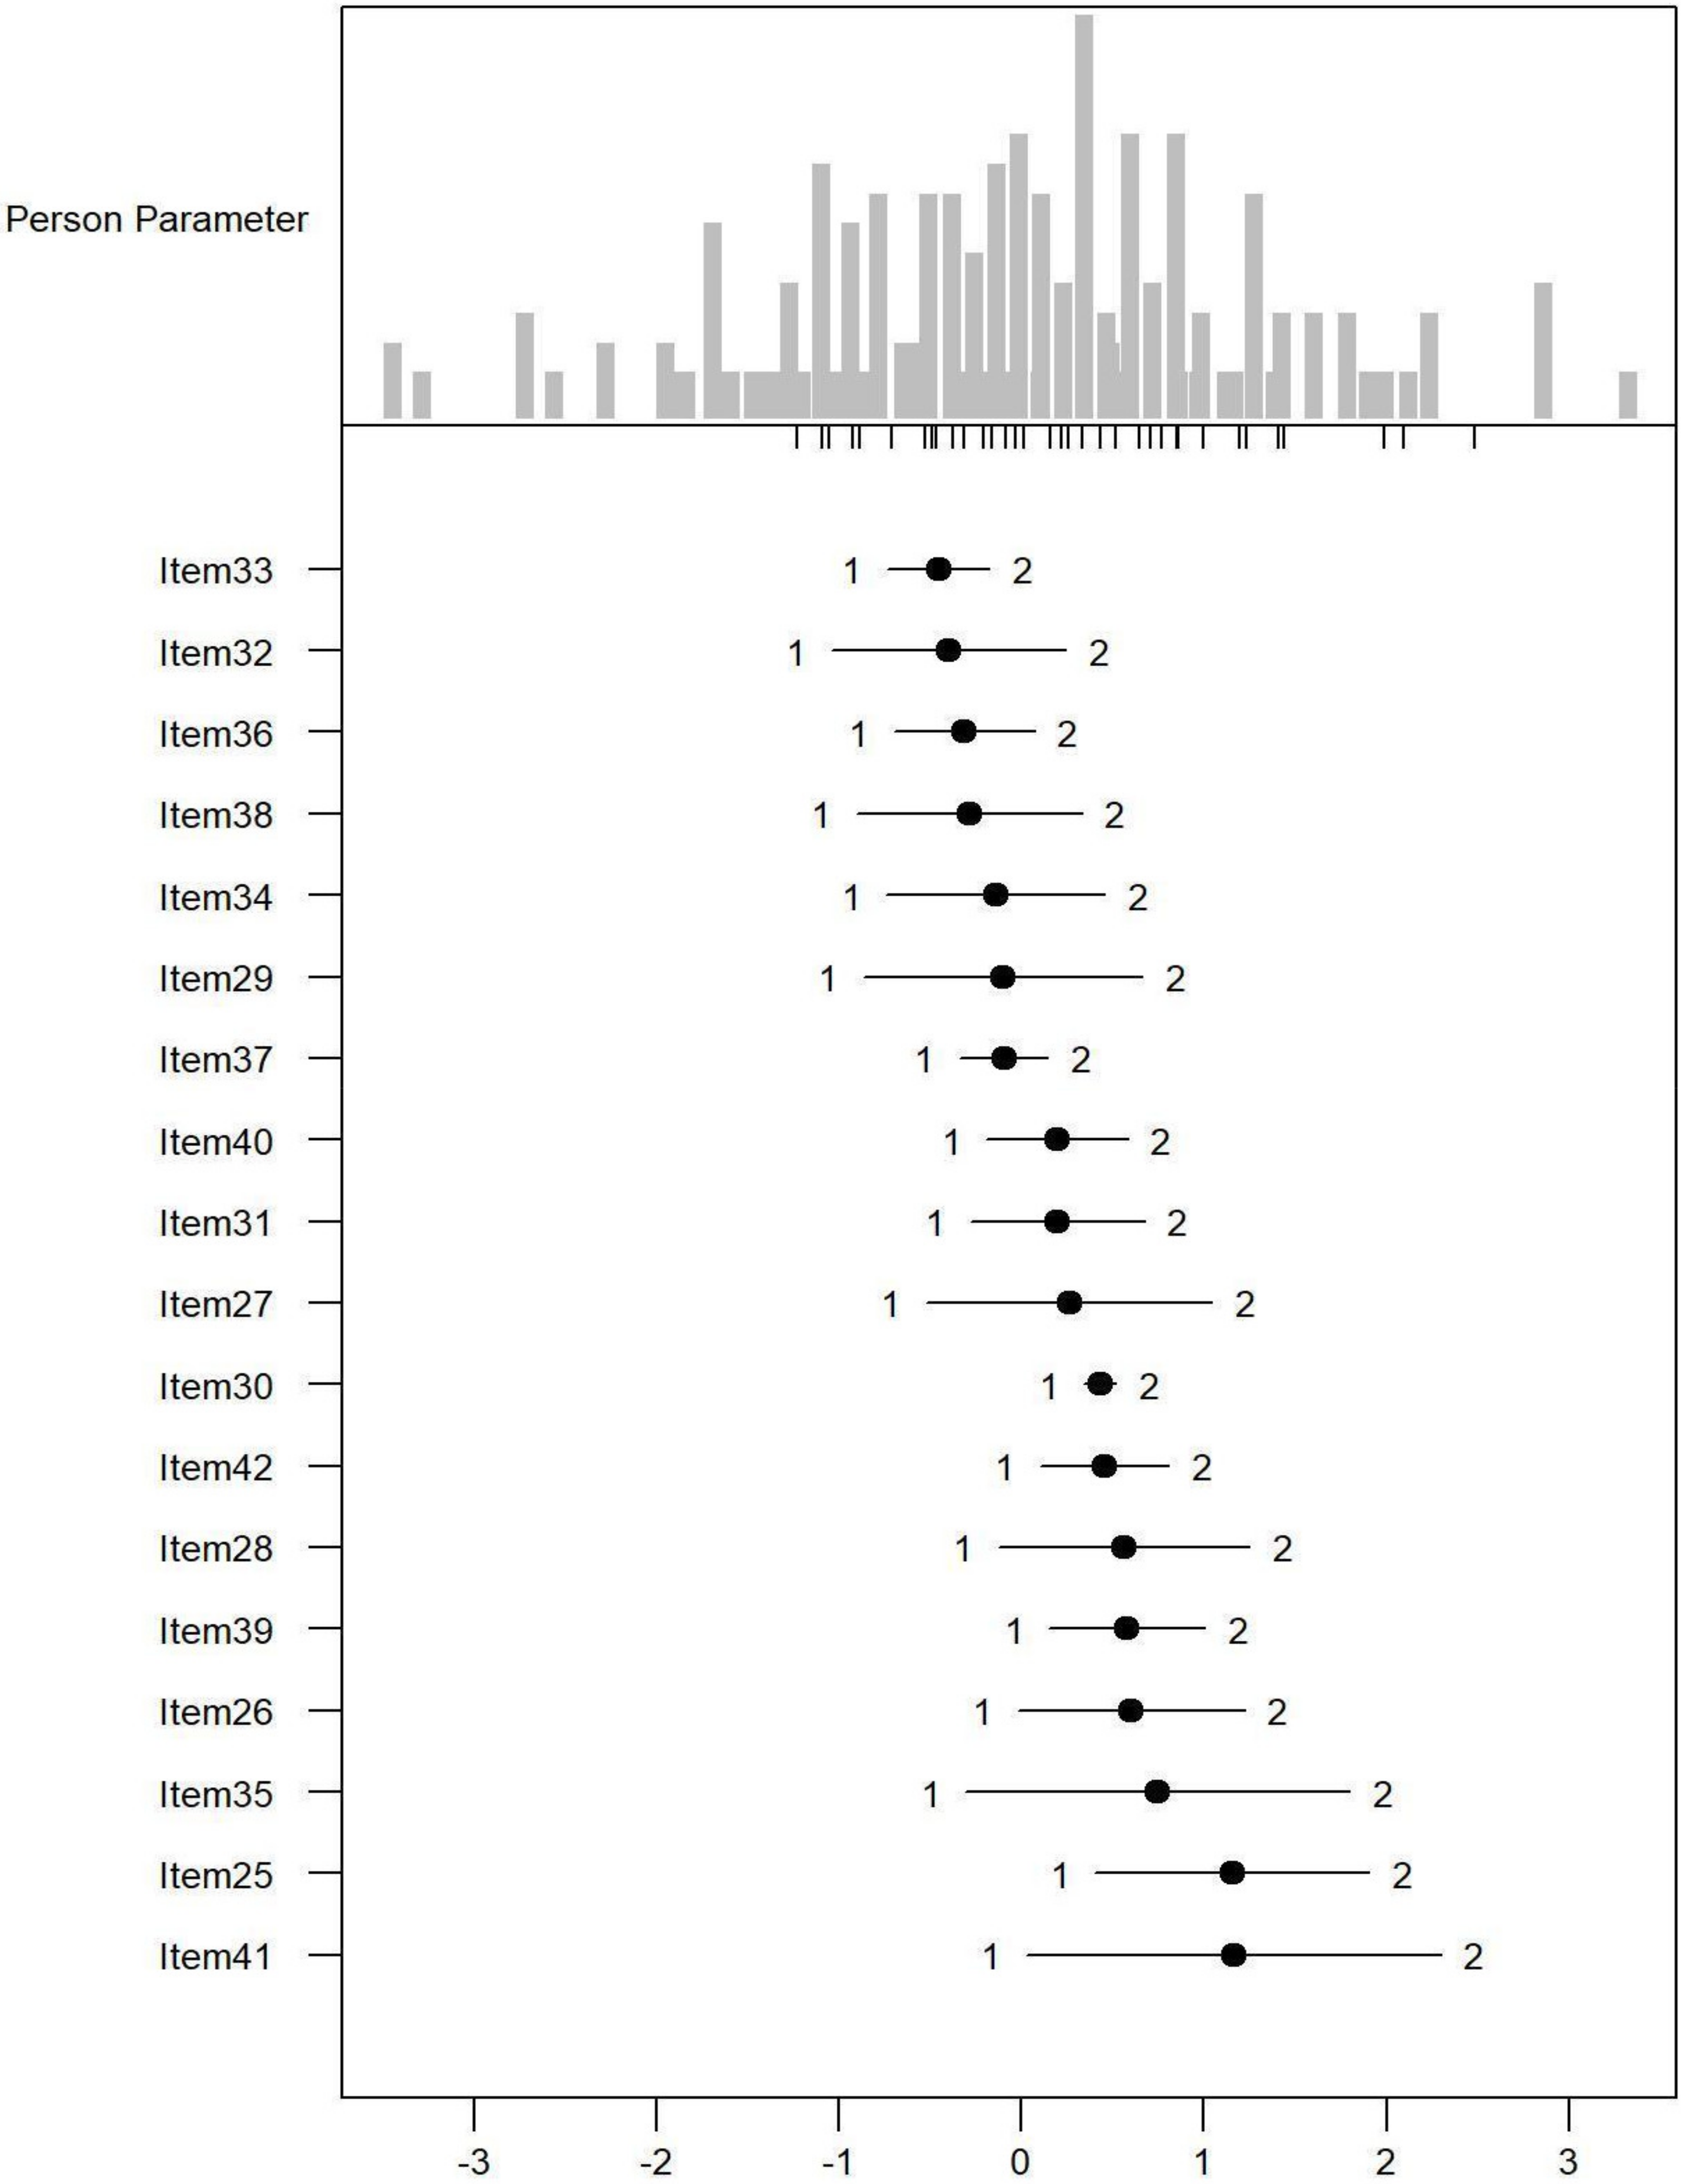
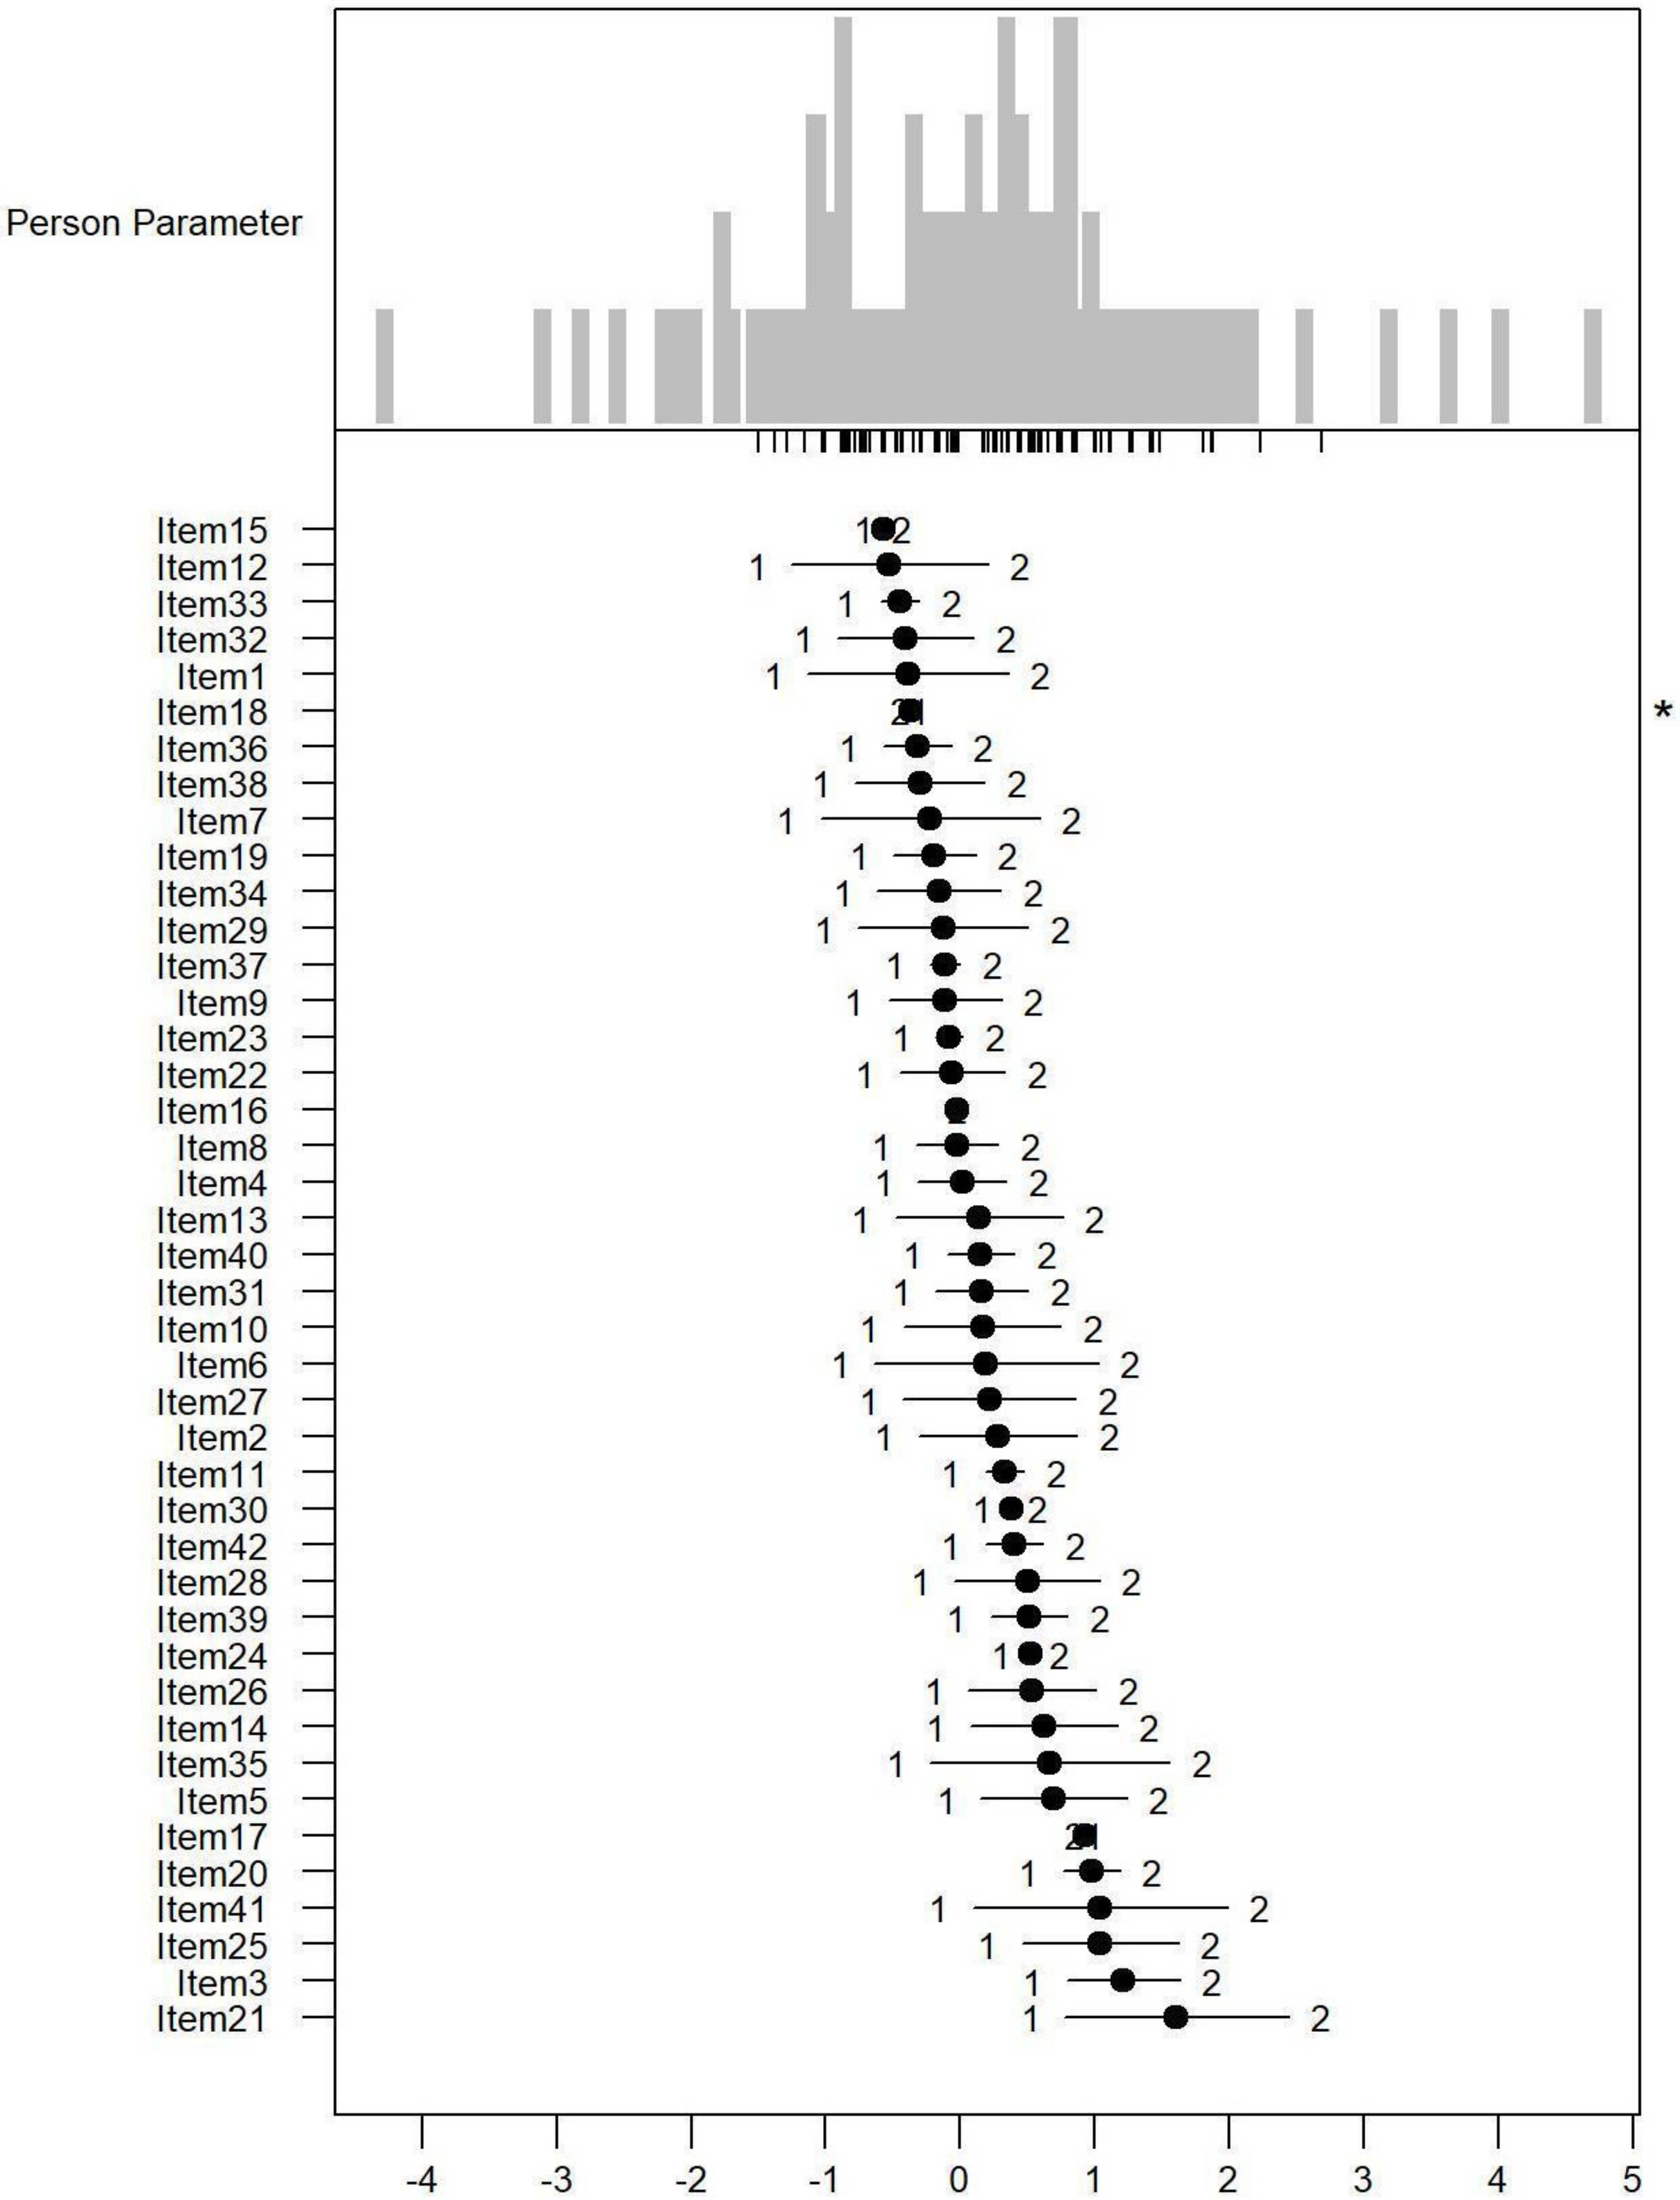
Monotonicity: Figure 1, Figure 2 and Figure 3 show the person item maps of the distribution of the person parameter, i.e., the participants’ Rasch-based scores, and the distribution of the item parameter. Smaller item parameters indicate response categories of items that are more likely to be endorsed as being a problem. Smaller person parameters indicate persons with fewer PSDs. Three items of the PARADISE 24 scale presented disordered thresholds: Item 16 assessing ‘Problems in grooming, dressing, toileting or eating,’ Item 17 assessing ‘Difficulties in sexual activities, and Item 18 assessing ‘Difficulties in staying by yourself’ (Figure 1). All the items from the Eden-18 selection presented ordered difficulty thresholds (Figure 2). When analyzed jointly, only Item 17 ‘Difficulties in sexual activities’, and Item 18 ‘Difficulties in staying by yourself’ presented disordered thresholds again but the monotonicity of the remaining items did not suffer (Figure 3).
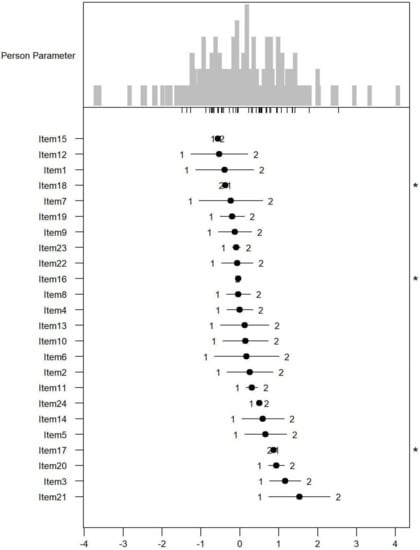
Figure 1.
Person-item map for the person parameter and item parameter distribution of the 24 Paradise items having response categories (1 = none, 2 = mild to moderate, and 3 = severe to extreme PSDs). * Disordered thresholds are flagged by means of a ‘*’ in the margin of the figures.
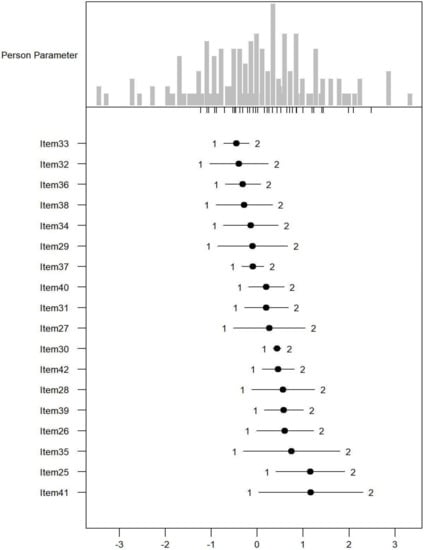
Figure 2.
Person-item map for the person parameter and item parameter distribution of the 18 additional Eden items having three response categories (1 = none, 2 = mild to moderate, and 3 = severe to extreme PSDs).

Figure 3.
Person-item map for the person parameter and item parameter distribution of the Paradise and Eden items combined having three response categories (1 = none, 2 = mild to moderate, and 3 = severe to extreme PSDs). * Disordered thresholds are flagged by means of a ‘*’ in the margin of the figures.
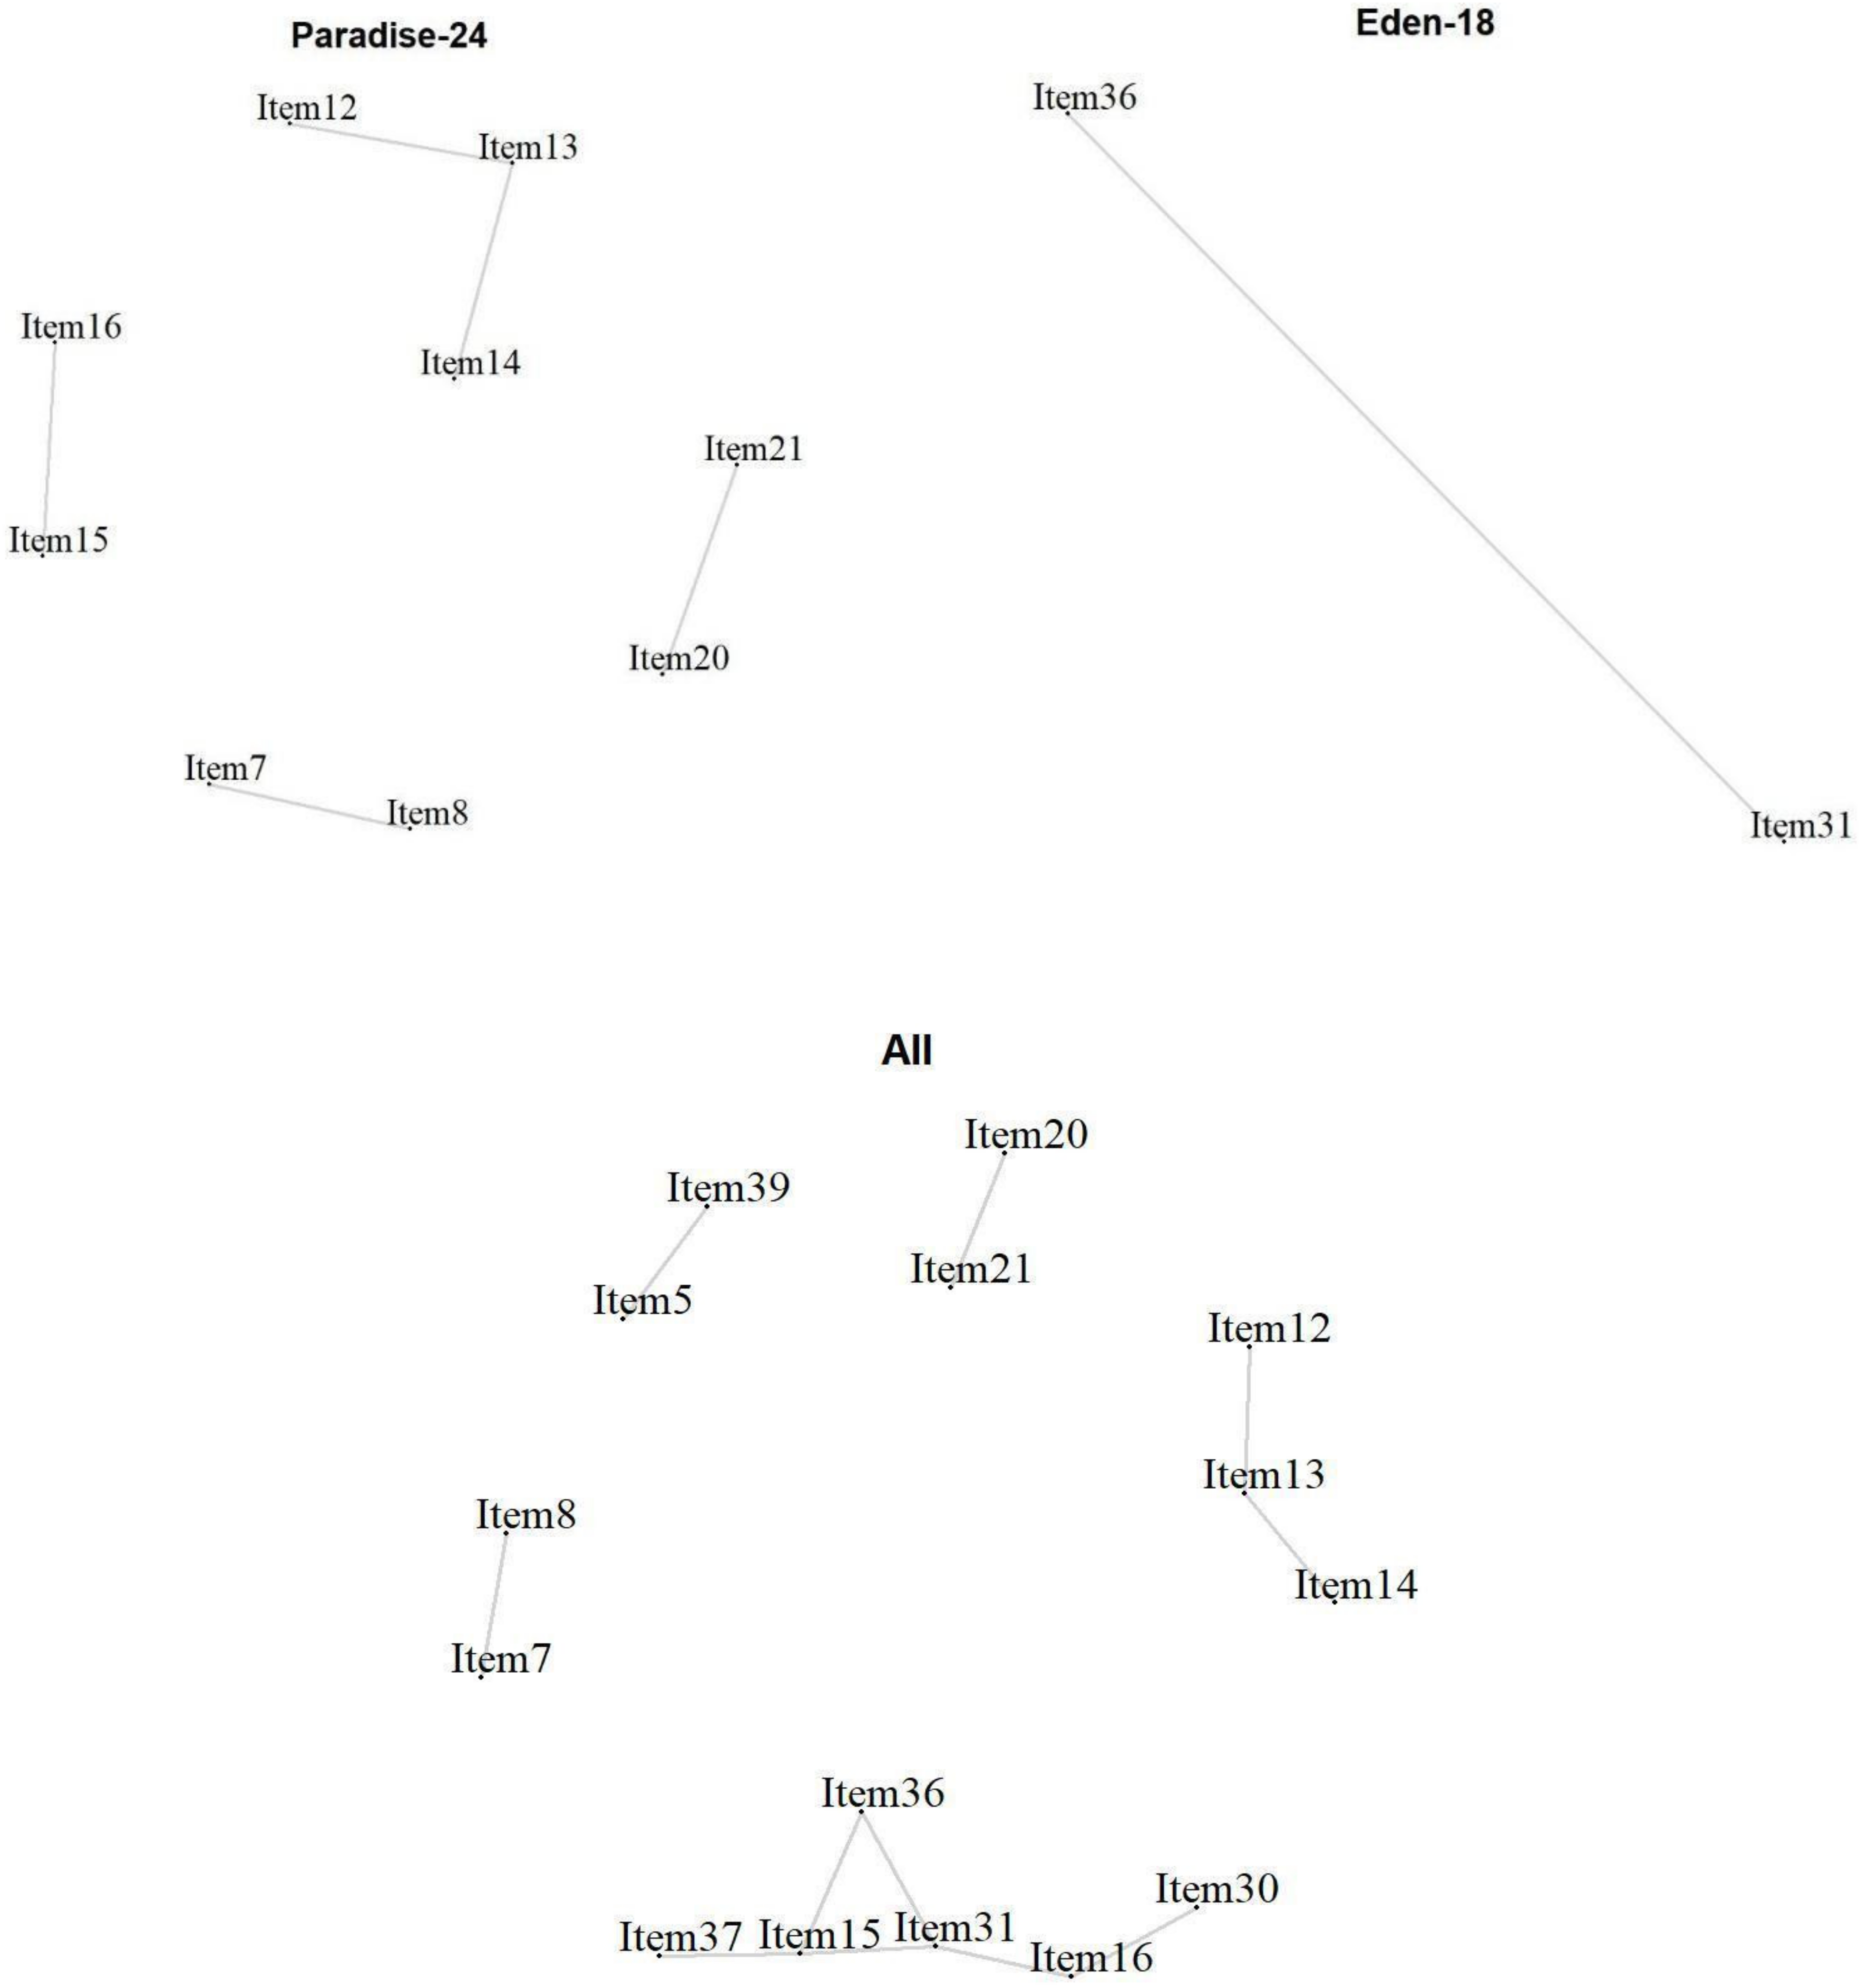
Local Item Dependencies: All analyses showed locally dependent items (Figure 4). In the PARADISE 24 scale, Item 7 ‘Feeling sad, low or depressed’ and 8 ‘Worry or anxiety’ (r = 0.36) correlated above the cut-off. Item 20 ‘Initiating and maintaining a friendship’ and Item 21 ‘Getting along with people close to you’ (r = 0.49) also showed a high dependency, as well as Item 15 ‘Walking a long distance’, and Item 16 ‘Grooming, dressing, toileting, or eating’ (r = 0.32), Item 14 ‘Starting and maintaining a conversation’ and Item 13 ‘Making decisions’ (r = 0.32), as well as Item 13 with Item 12 ‘Remembering to do important things’ (r = 0.35). For the Eden-18 selection, only a couple of items showed a high dependency, namely Item 31 ‘Balance’ and Item 36 ‘Lifting and carrying things’ (). When analyzed together, some dependencies are observed again, but with the occurrence of new dependencies across the two sets of items. Item 39 ‘Dealing with conflicts and tensions’ and Item 5 ‘Being so irritable that you started arguments and shouted or hit at people’ correlated highly (r = 0.36). The previously observed dependencies between Item 15 and Item 16 for PARADISE 24, and Item 31 and Item 36 for EDEN 18 were in one cluster with, in addition, Item 30 ‘Urinating and incontinence’ that correlated highly with Item 16 ‘Grooming, dressing, toileting, or eating’ (r = 0.37).
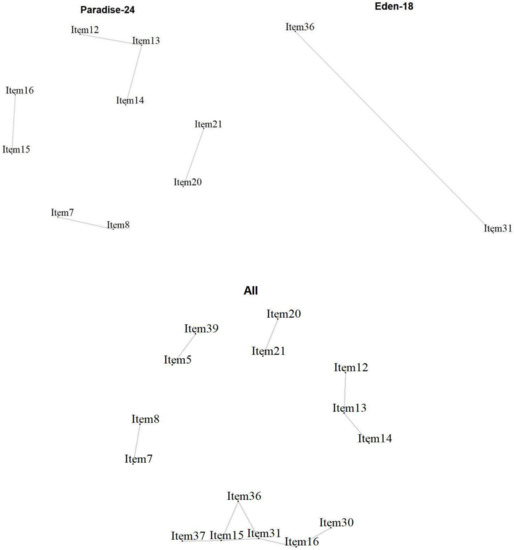
Figure 4.
Local item dependencies above cut-off for the 24 Paradise items, the 18 additional Eden items, and the two combined.
Unidimensionality: Unsurprisingly, at this stage the PARADISE 24 item set shows multidimensionality with the 1. eigenvalue of 2.81, explaining 11.7% of the variance. This is not unexpected, given the many item dependencies. A calibration using testlets may alleviate, probably even solve, this issue. The EDEN 18 item selection also indicates multidimensionality, with the 1. eigenvalue of 2.52 and a first component explaining 14.01% of the variance. Analysed jointly the dimensionality is high with a 1st component of 4 explaining 9.54% of the variance.
Differential Item Functioning: The DIF analysis tested subgroup effects of gender, age groups, data collection, diagnosis, and the living situation. No DIF was observed for age groups, gender, and diagnosis (Table 1). Paradise-24 Item 11 ‘Difficulty in concentrating for ten minutes’ showed DIF for the data collection, and Item 16 ‘Difficulty in grooming, dressing, toileting, or eating’ showed DIF for the data collection and living situation. Eden-18 Item 30 ‘Urinating and incontinence’ showed DIF for the data collection, Item 31 ‘Problem with balance,’ Item 32 ‘Difficulty in learning a new task,’ as well as Item 37 ‘Difficulty in moving around’ showed DIF for the living situation and data collection. The same and no additional items presented DIF in the joint analyses of the two sets of items.
4. Discussion
This study is a first attempt to create an ICF-based functioning metric for dementia. The psychometric analysis shows first that the PARADISE 24 and the selection of 18 additional condition-specific items can be expected to have good measurement properties to assess functioning in persons with dementia. A division of the items into subscales may be advised, given clusters of redundant items. On the other hand, the reduction of the length of the scale can be discussed in light of the dependencies. However, the number of dependent items is most significant in the PARADISE 24 metric in the assessment of persons with dementia.
The aim of the study was not only to investigate the metric properties of the PARADISE 24 items in a population with dementia but also to improve the scale by adding dementia-specific items (EDEN 18). Ultimately, the analysis should help reduce the EDEN 18 selection to twelve items based on the metric properties of the scale. However, based on this analysis, the choice of which item to discard from the supplementary 18-item selection is a challenge. The supplementary items selected for assessment in a population with dementia, the so-called Eden-18 items showed good measurement properties. The PCM analysis did not point to any item misfit, the response thresholds worked well, and reliability is good. In the co-calibration of the PARADISE-24 and EDEN-18, four items from the 18 items condition-specific selection showed strong dependencies: Item 30 ‘Urinating and incontinence,’ Item 31 ‘Balance’, Item 36 ‘Lifting Carrying’, and Item 37 ‘Moving around.’ With regard to Item 37 ‘Moving around,’ the PARADISE 24 scale has Item 15 ‘Difficulty in walking a long distance’ that also assesses mobility. If selecting between the two mobility items, it would be somewhat better to remove Item 15 from the PARADISE 24 selection, because it showed worse fit than Item 37. A selection may be also made between Item 31 ‘Balance’ and Item 36 ’Lifting and Carrying’, by only keeping Item 31 which is expected to have higher clinical relevance with persons with dementia. Understanding the difference in specific indices of balance and gait among patients with different degrees of cognitive impairments and healthy controls could help to develop better balance-oriented rehabilitation programs in older adults with early-stage cognitive impairment [36].
Other items could be good candidates for removal if the preservation of the PARADISE 24 scale is not the aim but rather a selection of items from the larger pool of PSD items. Some of the original items may not be as sound in a population with dementia as they presented a very high amount of missing values. These are Item 22 ‘Difficulty in day-to-day work or school,’ Item 17 ‘Difficulty with sexual activities’, with this item also presenting disordered thresholds. The prevalence of sexual dysfunction increases with age: cognitive impairment affects the frequency of and satisfaction with sexual activity, as well as the capacity to consent. The identification of sexual dysfunction in people with dementia in the early stage requires a clinical assessment of sexual behaviors and an understanding of the patient’s internal experience, which can be challenging and cannot be resolved with a single item. Research does suggest utility in the validation of specific assessment tools and habilitative, psychotherapeutic, and pharmacologic approaches specifically for this population [37]. This may explain the missing and disordered responses to Item 17 and the possibility of removing it, given the lack of reliability at this stage of the disease.
On the other hand, dementia-related inappropriate sexual behaviors are prevalent in the advanced stage of dementia and require management through both non-pharmacologic and pharmacologic approaches [38].
Item 18’Staying by yourself’ also had a noticeable number of missing values and showed disordered thresholds. The item with the worst fit was Item 3 ‘Appetite,’ which seems to be an item that is not frequently endorsed as being a big problem. It may be that this item does not make sense in this population as appetite is not directly correlated to dementia at these stages of the disease and only possibly makes sense at later stages of the disease when functioning is generally diminished. Prevalence of malnutrition and risk of malnutrition is higher in institutionalized elderly patients with advanced dementia and increases with the progression of the disease. A previous study confirmed that long-term care facility residents affected by severe cognitive impairment are characterized by a poor nutritional state, a serious impairment of functional conditions, and increased mortality [39]. An accurate evaluation of the nutritional status becomes necessary in the more advanced stages of the disease rather than in the early stages. Given that the new metric is targeted toward earlier stages of dementia, this item would be a good candidate for reducing the item pool.
Therefore, to fit a population with dementia, the statistical analysis indicated that the Item 3 ‘Appetite,’ Item 17 ‘Sexuality,’ Item 22 ‘Work or School,’ and Item 37 ‘Moving around’, or Item 15 ‘Walking 1 kilometer’ could be considered for removal. In any case, the clinical implications on the progression of disease suggest performing further studies in order to assess the possible contribution of appetite and sexuality for a better definition of a functional profile. Two further items from PARADISE 24 are also highly redundant, these are Item 20 ‘Initiating and maintaining friendship’ and Item 21 ‘Getting along with people close to you,’ and a selection between the two could be made. At this stage, we do not want to remove any items from the PARADISE 24 scale, however, as since the original scale was defined for a broader population with various brain disorders, the removal of items to fit a sample with only persons with dementia could be discussed and justified.
From a demographic point of view, this is a typical elderly population with a diagnosis of dementia. The most frequent diagnosis of dementia is vascular type according to the epidemiological data available for the elderly admitted to a nursing home, which is the prevalent condition in the population recruited in this research. A lower education level is considered a risk factor for the development of this disease, even if not all the studies agree with this topic [40]. It is also suggested that the relationship between education and dementia may not be unique to Alzheimer’s Disease, but the correlation between vascular dementia and education needs further ascertainment. However, we could refer to the correlation between stroke and education level that was found to be significant in previous research [41], considering that stroke and vascular dementia share risk factors that are quite the same.
Limitations: it is challenging to recruit a sample of patients with mild to moderate dementia, since a majority of these patients are still at home, cared for by family. Furthermore, this is a chronic condition, in which the patient turnover is extremely slow. The analysis of an assessment tool with up to 32 items based on a smaller sample of 200 persons with dementia could only be achieved by combining data from two different surveys that used the same assessment items. Fortunately, an analysis of differential item functioning did not show any effect of the combined survey.
It can be expected that the precision of parameter estimates at the extreme of the scales, where observations are less precise, is diminished. A validation of this analysis, in the future, with more data, will be necessary to further develop the metric.
5. Conclusions
The current study, as a first attempt to create an ICF-based functioning tool specific for dementia, has reported the findings of an exploratory psychometric analysis, showing that the PARADISE24 and the selection of 18 additional condition-specific items (EDEN18) have good measurement properties to assess functioning in persons with dementia. A proposal for a selection to reduce the number of additional items from 18 to 12 has been discussed. Future research with a larger sample will explore strategies to handle the item dependencies. A division of the item set into subscales may not be excluded. Future research, towards a smaller set of supplementary items, may also consider expert-based approaches to keep the most relevant items for this health condition. Given that some items showed different levels of difficulty according to the living situation, two versions of the tool for independent versus assisted living might also be considered.
Awareness of dementia as a public health problem has increased in more recent times, particularly in the last two decades. Even so, while it is quite well studied from a clinical point of view, there is a lack of understanding of functional ascertainment. The literature available is very limited and it is not sufficient to produce a theoretical framework. We hope with this research paper to stimulate a debate about the necessity of a deeper understanding of the functional issues associated with dementia.
Author Contributions
Conceptualization, F.T. and A.M. (Alba Malara); methodology, F.T., A.M. (Alba Malara), C.F., P.G., F.P. and A.M. (Andrea Melendugno); software, C.F. and G.A.D.B.; validation, F.T., A.M. (Alba Malara) and C.F.; formal analysis, C.F.; investigation, F.T., A.M. (Alba Malara), P.G., A.C., V.C., E.G., M.M. (Monica Malerba), L.M., M.M. (Maria Mauro), M.M. (Maria Magro), A.M. (Andrea Melendugno), F.P., L.P., C.P., A.P., V.R., F.S., P.M. and A.V.; resources, F.T., A.M. (Alba Malara), P.G., A.C., V.C., E.G., M.M. (Monica Malerba), L.M., M.M. (Maria Mauro), M.M. (Maria Magro), A.M. (Andrea Melendugno), F.P., L.P., C.P., A.P., V.R., F.S. and A.V.; data curation, F.T., A.M. (Alba Malara), C.F., G.A.D.B., P.G., A.C., V.C., E.G., M.M. (Monica Malerba), L.M., M.M. (Maria Mauro), M.M. (Maria Magro), A.M. (Andrea Melendugno), F.P., L.P., C.P., A.P., V.R., F.S. and A.V.; writing—original draft preparation, F.T., A.M. (Alba Malara) and C.F.; writing—review and editing, F.T., A.M. (Alba Malara) and C.F.; visualization, F.T., C.F. and A.M. (Alba Malara); supervision, F.T., C.F. and A.M. (Alba Malara); project administration, A.M. (Alba Malara), S.C.; funding acquisition, A.M. (Alba Malara) and S.C. All authors have read and agreed to the published version of the manuscript.
Funding
This research received no external funding.
Institutional Review Board Statement
The study was conducted in accordance with the Declaration of Helsinki, and approved by Ethics Committee of Ethikkommission Bei Der Lmu München (Projekt-Nr. 487-11) and Comitato Etico Sezione Area Centro-Regione Calabria (N. 10 del 18 Gennaio 2018).
Informed Consent Statement
Informed consent was obtained from all subjects involved in the study.
Data Availability Statement
Data are available on a digital devise belonging to ANASTE Humanitas Foundation, in Via dei Gracchi 137, Rome (Italy).
Conflicts of Interest
The authors declare no conflict of interest.
Appendix A
Table A1.
Response frequencies (percentages) for all the selected items, the 24 Paradise items, and the 18 additional Eden items with significance test on the response frequencies per item (p-value).
Table A1.
Response frequencies (percentages) for all the selected items, the 24 Paradise items, and the 18 additional Eden items with significance test on the response frequencies per item (p-value).
| Item | Option | All | PARADISE 24 Data | EDEN18 Data | p-Value |
|---|---|---|---|---|---|
| Item 1 | None | 40 (19.9) | 13 (16.2) | 27 (22.3) | <0.001 |
| Mild to moderate | 93 (46.3) | 55 (68.8) | 38 (31.4) | ||
| Severe to extreme | 68 (33.8) | 12 (15.0) | 56 (46.3) | ||
| Item 2 | None | 68 (33.8) | 25 (31.2) | 43 (35.5) | 0.001 |
| Mild to moderate | 85 (42.3) | 46 (57.5) | 39 (32.2) | ||
| Severe to extreme | 46 (22.9) | 8 (10.0) | 38 (31.4) | ||
| Missing | 2 (1.0) | 1 (1.2) | 1 (0.8) | ||
| Item 3 | None | 115 (57.2) | 48 (60.0) | 67 (55.4) | 0.043 |
| Mild to moderate | 62 (30.8) | 28 (35.0) | 34 (28.1) | ||
| Severe to extreme | 24 (11.9) | 4 (5.0) | 20 (16.5) | ||
| Item 4 | None | 64 (31.8) | 34 (42.5) | 30 (24.8) | 0.004 |
| Mild to moderate | 75 (37.3) | 31 (38.8) | 44 (36.4) | ||
| Severe to extreme | 62 (30.8) | 15 (18.8) | 47 (38.8) | ||
| Item 5 | None | 88 (43.8) | 37 (46.2) | 51 (42.1) | 0.074 |
| Mild to moderate | 78 (38.8) | 35 (43.8) | 43 (35.5) | ||
| Severe to extreme | 35 (17.4) | 8 (10.0) | 27 (22.3) | ||
| Item 6 | None | 58 (28.9) | 21 (26.2) | 37 (30.6) | 0.026 |
| Mild to moderate | 97 (48.3) | 47 (58.8) | 50 (41.3) | ||
| Severe to extreme | 45 (22.4) | 11 (13.8) | 34 (28.1) | ||
| Missing | 1 (0.5) | 1 (1.2) | 0 (0.0) | ||
| Item 7 | None | 44 (21.9) | 19 (23.8) | 25 (20.7) | 0.001 |
| Mild to moderate | 97 (48.3) | 50 (62.5) | 47 (38.8) | ||
| Severe to extreme | 59 (29.4) | 11 (13.8) | 48 (39.7) | ||
| Missing | 1 (0.5) | 0 (0.0) | 1 (0.8) | ||
| Item 8 | None | 63 (31.3) | 28 (35.0) | 35 (28.9) | <0.001 |
| Mild to moderate | 74 (36.8) | 43 (53.8) | 31 (25.6) | ||
| Severe to extreme | 64 (31.8) | 9 (11.2) | 55 (45.5) | ||
| Item 9 | None | 56 (27.9) | 26 (32.5) | 30 (24.8) | 0.017 |
| Mild to moderate | 79 (39.3) | 38 (47.5) | 41 (33.9) | ||
| Severe to extreme | 65 (32.3) | 16 (20.0) | 49 (40.5) | ||
| Missing | 1 (0.5) | 0 (0.0) | 1 (0.8) | ||
| Item 10 | None | 64 (31.8) | 25 (31.2) | 39 (32.2) | 0.064 |
| Mild to moderate | 86 (42.8) | 41 (51.2) | 45 (37.2) | ||
| Severe to extreme | 51 (25.4) | 14 (17.5) | 37 (30.6) | ||
| Item 11 | None | 82 (40.8) | 46 (57.5) | 36 (29.8) | <0.001 |
| Mild to moderate | 65 (32.3) | 28 (35.0) | 37 (30.6) | ||
| Severe to extreme | 53 (26.4) | 5 (6.2) | 48 (39.7) | ||
| Missing | 1 (0.5) | 1 (1.2) | 0 (0.0) | ||
| Item 12 | None | 36 (17.9) | 7 (8.8) | 29 (24.0) | <0.001 |
| Mild to moderate | 91 (45.3) | 49 (61.3) | 42 (34.7) | ||
| Severe to extreme | 74 (36.8) | 24 (30.0) | 50 (41.3) | ||
| Item 13 | None | 60 (29.9) | 21 (26.2) | 39 (32.2) | 0.005 |
| Mild to moderate | 86 (42.8) | 40 (50.0) | 46 (38.0) | ||
| Severe to extreme | 50 (24.9) | 14 (17.5) | 36 (29.8) | ||
| Missing | 5 (2.5) | 5 (6.2) | 0 (0.0) | ||
| Item 14 | None | 84 (41.8) | 25 (31.2) | 59 (48.8) | <0.001 |
| Mild to moderate | 79 (39.3) | 46 (57.5) | 33 (27.3) | ||
| Severe to extreme | 37 (18.4) | 8 (10.0) | 29 (24.0) | ||
| Missing | 1 (0.5) | 1 (1.2) | 0 (0.0) | ||
| Item 15 | None | 46 (22.9) | 27 (33.8) | 19 (15.7) | <0.001 |
| Mild to moderate | 53 (26.4) | 30 (37.5) | 23 (19.0) | ||
| Severe to extreme | 94 (46.8) | 22 (27.5) | 72 (59.5) | ||
| Missing | 8 (4.0) | 1 (1.2) | 7 (5.8) | ||
| Item 16 | None | 74 (36.8) | 45 (56.2) | 29 (24.0) | <0.001 |
| Mild to moderate | 52 (25.9) | 24 (30.0) | 28 (23.1) | ||
| Severe to extreme | 75 (37.3) | 11 (13.8) | 64 (52.9) | ||
| Item 17 | None | 63 (31.3) | 6 (7.5) | 57 (47.1) | <0.001 |
| Mild to moderate | 24 (11.9) | 5 (6.2) | 19 (15.7) | ||
| Severe to extreme | 21 (10.4) | 1 (1.2) | 20 (16.5) | ||
| Missing | 93 (46.3) | 68 (85.0) | 25 (20.7) | ||
| Item 18 | None | 48 (23.9) | 17 (21.2) | 31 (25.6) | <0.001 |
| Mild to moderate | 42 (20.9) | 26 (32.5) | 16 (13.2) | ||
| Severe to extreme | 79 (39.3) | 19 (23.8) | 60 (49.6) | ||
| Missing | 32 (15.9) | 18 (22.5) | 14 (11.6) | ||
| Item 19 | None | 56 (27.9) | 23 (28.7) | 33 (27.3) | 0.010 |
| Mild to moderate | 74 (36.8) | 38 (47.5) | 36 (29.8) | ||
| Severe to extreme | 71 (35.3) | 19 (23.8) | 52 (43.0) | ||
| Item 20 | None | 107 (53.2) | 38 (47.5) | 69 (57.0) | 0.006 |
| Mild to moderate | 58 (28.9) | 31 (38.8) | 27 (22.3) | ||
| Severe to extreme | 31 (15.4) | 7 (8.8) | 24 (19.8) | ||
| Missing | 5 (2.5) | 4 (5.0) | 1 (0.8) | ||
| Item 21 | None | 118 (58.7) | 41 (51.2) | 77 (63.6) | <0.001 |
| Mild to moderate | 68 (33.8) | 39 (48.8) | 29 (24.0) | ||
| Severe to extreme | 15 (7.5) | 0 (0.0) | 15 (12.4) | ||
| Item 22 | None | 29 (14.4) | 6 (7.5) | 23 (19.0) | <0.001 |
| Mild to moderate | 49 (24.4) | 20 (25.0) | 29 (24.0) | ||
| Severe to extreme | 46 (22.9) | 0 (0.0) | 46 (38.0) | ||
| Missing | 77 (38.3) | 54 (67.5) | 23 (19.0) | ||
| Item 23 | None | 62 (30.8) | 29 (36.2) | 33 (27.3) | <0.001 |
| Mild to moderate | 61 (30.3) | 31 (38.8) | 30 (24.8) | ||
| Severe to extreme | 60 (29.9) | 9 (11.2) | 51 (42.1) | ||
| Missing | 18 (9.0) | 11 (13.8) | 7 (5.8) | ||
| Item 24 | None | 94 (46.8) | 37 (46.2) | 57 (47.1) | 0.474 |
| Mild to moderate | 55 (27.4) | 26 (32.5) | 29 (24.0) | ||
| Severe to extreme | 47 (23.4) | 15 (18.8) | 32 (26.4) | ||
| Missing | 5 (2.5) | 2 (2.5) | 3 (2.5) | ||
| Item 25 | None | 102 (50.7) | 50 (62.5) | 52 (43.0) | 0.004 |
| Mild to moderate | 72 (35.8) | 27 (33.8) | 45 (37.2) | ||
| Severe to extreme | 26 (12.9) | 3 (3.8) | 23 (19.0) | ||
| Missing | 1 (0.5) | 0 (0.0) | 1 (0.8) | ||
| Item 26 | None | 83 (41.3) | 41 (51.2) | 42 (34.7) | 0.007 |
| Mild to moderate | 77 (38.3) | 32 (40.0) | 45 (37.2) | ||
| Severe to extreme | 40 (19.9) | 7 (8.8) | 33 (27.3) | ||
| Missing | 1 (0.5) | 0 (0.0) | 1 (0.8) | ||
| Item 27 | None | 64 (31.8) | 26 (32.5) | 38 (31.4) | 0.008 |
| Mild to moderate | 88 (43.8) | 43 (53.8) | 45 (37.2) | ||
| Severe to extreme | 48 (23.9) | 10 (12.5) | 38 (31.4) | ||
| Missing | 1 (0.5) | 1 (1.2) | 0 (0.0) | ||
| Item 28 | None | 79 (39.3) | 39 (48.8) | 40 (33.1) | 0.001 |
| Mild to moderate | 80 (39.8) | 33 (41.2) | 47 (38.8) | ||
| Severe to extreme | 40 (19.9) | 6 (7.5) | 34 (28.1) | ||
| Missing | 2 (1.0) | 2 (2.5) | 0 (0.0) | ||
| Item 29 | None | 49 (24.4) | 18 (22.5) | 31 (25.6) | 0.096 |
| Mild to moderate | 86 (42.8) | 39 (48.8) | 47 (38.8) | ||
| Severe to extreme | 59 (29.4) | 18 (22.5) | 41 (33.9) | ||
| Missing | 7 (3.5) | 5 (6.2) | 2 (1.7) | ||
| Item 30 | None | 88 (43.8) | 51 (63.7) | 37 (30.6) | <0.001 |
| Mild to moderate | 57 (28.4) | 26 (32.5) | 31 (25.6) | ||
| Severe to extreme | 54 (26.9) | 3 (3.8) | 51 (42.1) | ||
| Missing | 2 (1.0) | 0 (0.0) | 2 (1.7) | ||
| Item 31 | None | 70 (34.8) | 37 (46.2) | 33 (27.3) | <0.001 |
| Mild to moderate | 75 (37.3) | 40 (50.0) | 35 (28.9) | ||
| Severe to extreme | 54 (26.9) | 3 (3.8) | 51 (42.1) | ||
| Missing | 2 (1.0) | 0 (0.0) | 2 (1.7) | ||
| Item 32 | None | 42 (20.9) | 11 (13.8) | 31 (25.6) | 0.008 |
| Mild to moderate | 80 (39.8) | 36 (45.0) | 44 (36.4) | ||
| Severe to extreme | 74 (36.8) | 28 (35.0) | 46 (38.0) | ||
| Missing | 5 (2.5) | 5 (6.2) | 0 (0.0) | ||
| Item 33 | None | 48 (23.9) | 27 (33.8) | 21 (17.4) | <0.001 |
| Mild to moderate | 64 (31.8) | 35 (43.8) | 29 (24.0) | ||
| Severe to extreme | 81 (40.3) | 18 (22.5) | 63 (52.1) | ||
| Missing | 8 (4.0) | 0 (0.0) | 8 (6.6) | ||
| Item 34 | None | 54 (26.9) | 22 (27.5) | 32 (26.4) | 0.001 |
| Mild to moderate | 81 (40.3) | 43 (53.8) | 38 (31.4) | ||
| Severe to extreme | 66 (32.8) | 15 (18.8) | 51 (42.1) | ||
| Item 35 | None | 76 (37.8) | 31 (38.8) | 45 (37.2) | 0.033 |
| Mild to moderate | 94 (46.8) | 43 (53.8) | 51 (42.1) | ||
| Severe to extreme | 31 (15.4) | 6 (7.5) | 25 (20.7) | ||
| Item 36 | None | 52 (25.9) | 20 (25.0) | 32 (26.4) | 0.012 |
| Mild to moderate | 71 (35.3) | 38 (47.5) | 33 (27.3) | ||
| Severe to extreme | 75 (37.3) | 22 (27.5) | 53 (43.8) | ||
| Missing | 3 (1.5) | 0 (0.0) | 3 (2.5) | ||
| Item 37 | None | 62 (30.8) | 43 (53.8) | 19 (15.7) | <0.001 |
| Mild to moderate | 65 (32.3) | 32 (40.0) | 33 (27.3) | ||
| Severe to extreme | 70 (34.8) | 5 (6.2) | 65 (53.7) | ||
| Missing | 4 (2.0) | 0 (0.0) | 4 (3.3) | ||
| Item 38 | None | 47 (23.4) | 16 (20.0) | 31 (25.6) | <0.001 |
| Mild to moderate | 80 (39.8) | 49 (61.3) | 31 (25.6) | ||
| Severe to extreme | 66 (32.8) | 13 (16.2) | 53 (43.8) | ||
| Missing | 8 (4.0) | 2 (2.5) | 6 (5.0) | ||
| Item 39 | None | 87 (43.3) | 39 (48.8) | 48 (39.7) | 0.007 |
| Mild to moderate | 69 (34.3) | 32 (40.0) | 37 (30.6) | ||
| Severe to extreme | 44 (21.9) | 8 (10.0) | 36 (29.8) | ||
| Missing | 1 (0.5) | 1 (1.2) | 0 (0.0) | ||
| Item 40 | None | 64 (31.8) | 19 (23.8) | 45 (37.2) | <0.001 |
| Mild to moderate | 66 (32.8) | 27 (33.8) | 39 (32.2) | ||
| Severe to extreme | 56 (27.9) | 19 (23.8) | 37 (30.6) | ||
| Missing | 15 (7.5) | 15 (18.8) | 0 (0.0) | ||
| Item 41 | None | 89 (44.3) | 31 (38.8) | 58 (47.9) | 0.041 |
| Mild to moderate | 87 (43.3) | 40 (50.0) | 47 (38.8) | ||
| Severe to extreme | 22 (10.9) | 6 (7.5) | 16 (13.2) | ||
| Missing | 3 (1.5) | 3 (3.8) | 0 (0.0) | ||
| Item 42 | None | 83 (41.3) | 35 (43.8) | 48 (39.7) | <0.001 |
| Mild to moderate | 67 (33.3) | 37 (46.2) | 30 (24.8) | ||
| Severe to extreme | 49 (24.4) | 6 (7.5) | 43 (35.5) | ||
| Missing | 2 (1.0) | 2 (2.5) | 0 (0.0) |
References
- World Health Organization. The Global Dementia Observatory Reference Guide (CC BY-NC-SA 3.0 IGO); World Health Organization: Geneva, Switzerland, 2018. [Google Scholar]
- World Health Organization. The Global Action Plan on the Public Health Response to Dementia 2017–2025; World Health Organization: Geneva, Switzerland, 2017. [Google Scholar]
- Jakob, R.; Üstün, B.; Madden, R.; Sykes, C. The WHO Family of International Classifications. Bundesgesundheitsblatt Gesundh. Gesundh. 2007, 50, 924–931. [Google Scholar] [CrossRef]
- Cipriani, G.; Danti, S.; Picchi, L.; Nuti, A.; Fiorino, M. Daily functioning and dementia. Dement. Neuropsychol. 2020, 14, 93–102. [Google Scholar] [CrossRef]
- Gitlin, L.N.; Marx, K.A.; Stanley, I.H.; Hansen, B.R.; van Haitsma, K.S. Assessing neuropsychiatric symptoms in people with dementia: A systematic review of measures. Int. Psychogeriatr. 2014, 26, 1805–1848. [Google Scholar] [CrossRef] [PubMed] [Green Version]
- Yu, S.T.S.; Yu, M.-L.; Brown, T.; Andrews, H. Association between older adults’ functional performance and their scores on the Mini Mental State Examination (MMSE) and Montreal Cognitive Assessment (MoCA). Ir. J. Occup. Ther. 2018, 46, 4–23. [Google Scholar] [CrossRef] [Green Version]
- Krein, L.; Jeon, Y.H.; Amberber, A.M.; Fethney, J. The Assessment of Language and Communication in Dementia: A Synthesis of Evidence. Am. J. Geriatr. Psychiatry 2019, 27, 363–377. [Google Scholar] [CrossRef] [PubMed]
- Lin, J.S.; O’Connor, E.; Rossom, R.C.; Perdue, L.A.; Burda, B.U.; Thompson, M.; Eckstrom, E. Screening for Cognitive Impairment in Older Adults: An Evidence Update for the U.S. Preventive Services Task Force [Internet]; Evidence Synthesis, No. 189; Agency for Healthcare Research and Quality (US): Rockville, MD, USA, 2020. Available online: https://www.ncbi.nlm.nih.gov/books/NBK554654/ (accessed on 1 March 2022).
- Malara, A.; Sgrò, G.; Ceravolo, F.; Curinga, G.; Renda, G.F.; Spadea, F.; Rispoli, V. Profiles of ICF disability in Alzheimer and Vascular dementia. J. Aging Res. Clin. Pract. 2015, 4, 154–158. [Google Scholar] [CrossRef]
- Cieza, A.; Anczewska, M.; Ayuso-Mateos, J.L.; Baker, M.; Bickenbach, J.; Chatterji, S.; Consortium, P. Understanding the Impact of Brain Disorders: Towards a ‘Horizontal Epidemiology’ of Psychosocial Difficulties and Their Determinants. PLoS ONE 2015, 10, e0136271. [Google Scholar] [CrossRef] [PubMed] [Green Version]
- Cieza, A.; Sabariego, C.; Anczewska, M.; Ballert, C.; Bickenbach, J.; Cabello, M.; et Consortium, P. PARADISE 24: A Measure to Assess the Impact of Brain Disorders on People’s Lives. PLoS ONE 2015, 10, e0132410. [Google Scholar] [CrossRef]
- World Health Organization. ICF: International Classification of Functioning, Disability and Health; World Health Organization: Geneva, Switzerland, 2001. [Google Scholar]
- Rasch, G.W. Probabilistic Models for some Intelligence and Attainment Tests Copenhagen; MESA Press: San Diego, CA, USA, 1960. [Google Scholar]
- American Psychiatric Association. Diagnostic and Statistical Manual of Mental Disorders: DSM-IV, 4th ed.; American Psychiatric Association: Washington, DC, USA, 1995. [Google Scholar]
- Roman, G.C.; Tatemichi, T.K.; Erkinjuntti, T.; Cummings, J.L.; Masdeu, J.C.; Garcia, J.H.; Amaducci, L.; Orgogozo, J.-M.; Brun, A.; Hofman, A.; et al. Vascular dementia: Diagnostic criteria for research studies: Report of the NINDS-AIREN International Workshop. Neurology 1993, 43, 250–260. [Google Scholar] [CrossRef]
- McKhann, G.; Drachman, D.; Folstein, M.; Katzman, R.; Price, D.; Stadlan, E.M. Clinical diagnosis of Alzheimer’s disease: Report of the NINCDS-ADRDA Work Group under the auspices of Department of Health and Human Services Task Force on Alzheimer’s Disease. Neurology 1984, 34, 939–944. [Google Scholar] [CrossRef] [Green Version]
- Folstein, M.F.; Folstein, S.E.; McHugh, P.R. “Mini-mental state”: A practical method for grading the cognitive state of patients for the clinician. J. Psychiatr. Res. 1975, 12, 189–198. [Google Scholar] [CrossRef]
- Katz, S. Assessing self-maintenance: Activities of daily living, mobility, and instrumental activities of daily living. J. Am. Geriatr. Soc. 1983, 31, 721–727. [Google Scholar] [CrossRef] [PubMed]
- Masters, G.N. A rasch model for partial credit scoring. Psychometrika 1982, 47, 149–174. [Google Scholar] [CrossRef]
- Tennant, A.; Conaghan, P.G. The Rasch measurement model in rheumatology: What is it and why use it? When should it be applied, and what should one look for in a Rasch paper? Arthritis Rheum. 2007, 57, 1358–1362. [Google Scholar] [CrossRef] [PubMed]
- Wright, B.D.; Linacre, J.M.; Gustafson, J.E.; Martin-Loef, P. Reasonable Mean-Square Fit Values. Rasch Meas. Trans. 1994, 8, 370. [Google Scholar]
- Colton, D.A.; Gao, X.; Harris, D.J.; Kolen, M.J.; Martinovich-Barhite, D.; Wang, T.; Welch, C.J. Reliability Issues with Performance Assessments: A Collection of Papers; ACT Research Report Series 97-3; ACT, Inc.: Iowa City, IA, USA, 1997; pp. 1–137. [Google Scholar]
- Nunnally, J.C. Psychometric Theory, 2nd ed.; McGraw-Hill: New York, NY, USA, 1978. [Google Scholar]
- Wright, B.D. Reliability and separation. Rasch Meas. Trans. 1996, 9, 472. [Google Scholar]
- Smith, R.M.; Schumacker, R.E.; Bush, M.J. Using item mean squares to evaluate fit to the Rasch model. J. Outcome Meas. 1998, 2, 66–78. [Google Scholar] [PubMed]
- Andrich, D.; Luo, G. Conditional Pairwise Estimation in the Rasch Model for Ordered Response Categories Using Principal Components. J. Appl. Meas. 2003, 4, 205–221. [Google Scholar]
- Andrich, D.; Marais, I. A Course in Rasch Measurement Theory: Measuring in the Educational, Social and Health Sciences; Springer: Singapore, 2019. [Google Scholar]
- Yen, W.M. Effects of Local Item Dependence on the Fit and Equating Performance of the Three-Parameter Logistic Model. Appl. Psychol. Meas. 1984, 8, 125–145. [Google Scholar] [CrossRef]
- Baghaei, P. Local Dependency and Rasch Measures. Rasch Meas. Trans. 2008, 21, 1105–1106. [Google Scholar]
- Marais, I. Local dependence. In Rasch Models in Health; John Wiley & Sons: Hoboken, NJ, USA, 2012; pp. 111–130. [Google Scholar]
- Smith, E.V.J. Detecting and Evaluating the Impact of Multidimensionality Using Item Fit Statistics and Principal Component Analysis of Residuals. J. Appl. Meas. 2002, 3, 205–231. [Google Scholar]
- Holland, P.W.; Wainger, H. Differential Item Functioning; Erlbaum: Hillsdale, NJ, USA, 1993. [Google Scholar]
- Benjamini, Y.; Hochberg, Y. Controlling the False Discovery Rate: A Practical and Powerful Approach to Multiple Testing. J. R. Stat. Soc. Ser. B 1995, 57, 289–300. [Google Scholar] [CrossRef]
- Stekhoven, D.J.; Bühlmann, P. MissForest—Non-parametric missing value imputation for mixed-type data. Bioinformatics 2011, 28, 112–118. [Google Scholar] [CrossRef] [Green Version]
- Yoshida, K.; Bartel, A. Tableone: Create ’Table 1’ to Describe Baseline Characteristics with or without Propensity Score Weights. 2021. Available online: https://CRAN.R-project.org/package=tableone (accessed on 1 June 2022).
- Kuan, Y.-C.; Huang, L.-K.; Wang, Y.-H.; Hu, C.-J.; Tseng, I.-J.; Chen, H.-C.; Lin, L.-F. Balance and gait performance in older adults with early-stage cognitive impairment. Eur. J. Phys. Rehabil. Med. 2021, 57, 560–567. [Google Scholar] [CrossRef]
- Thom, R.P.; Grudzinskas, A.J., Jr.; Saleh, F.M. Sexual Behavior Among Persons with Cognitive Impairments. Curr. Psychiatry Rep. 2017, 19, 25. [Google Scholar] [CrossRef]
- Srinivasan, S.; Glover, J.; Tampi, R.R.; Tampi, D.J.; Sewell, D.D. Sexuality and the Older Adult. Curr. Psychiatry Rep. 2019, 21, 97. [Google Scholar] [CrossRef]
- Malara, A.; Sgrò, G.; Caruso, C.; Ceravolo, F.; Curinga, G.; Renda, G.F.; Rispoli, V. Relationship between cognitive impairment and nutritional assessment on functional status in Calabrian long-term-care. Clin. Int. Aging 2014, 9, 105–110. [Google Scholar] [CrossRef] [Green Version]
- Sharp, E.S.; Gatz, M. Relationship between education and dementia: An updated systematic review. Alzheimer Dis. Assoc. Disord. 2011, 25, 289–304. [Google Scholar] [CrossRef] [Green Version]
- Jackson, C.A.; Sudlow, C.L.M.; Mishra, G.D. Education, sex and risk of stroke: A prospective cohort study in New South Wales, Australia. BMJ Open 2018, 8, e024070. [Google Scholar] [CrossRef] [PubMed] [Green Version]
Publisher’s Note: MDPI stays neutral with regard to jurisdictional claims in published maps and institutional affiliations. |
© 2022 by the authors. Licensee MDPI, Basel, Switzerland. This article is an open access article distributed under the terms and conditions of the Creative Commons Attribution (CC BY) license (https://creativecommons.org/licenses/by/4.0/).