Abstract
The acoustic environment of residential areas is critical to the health of the residents. To reveal the impact of the acoustic environment on people’s mental health and create a satisfactory acoustic setting, this study took a typical old residential area in Harbin as an example, conducted a field measurement and questionnaire survey on it, and took typical acoustic sources as the research object for human body index measurement. The relationship between heart rate (HR), skin conductivity level (SCL), physiological indicators, semantic differences (SD), and psychological indicators was studied. The sound distribution in the old community was obtained, determining that gender, age, and education level are significant factors producing different sound source evaluations. Music can alleviate residents’ psychological depression, while traffic sounds and residents’ psychological state can affect the satisfaction evaluation of the sound environment. There is a significant correlation between the physiological and psychological changes produced by different sounds. Pleasant sounds increase a person’s HR and decrease skin conductivity. The subjects’ HR increased 3.24 times per minute on average, and SCL decreased 1.65 times per minute on average in relation to hearing various sound sources. The SD evaluation showed that lively, pleasant, and attractive birdsongs and music produced the greatest HR and SCL changes, and that the sound barrier works best when placed 8 m and 18 m from the road.
1. Introduction
A “healthy building” is a new requirement in modern society to ensure functionality and the quality of architecture. For this, concept and practice must break through the shackles of traditional disciplines to develop towards achieving multi-discipline and cross-field integration. The acoustic environment of buildings and cities is an essential part of the quality of healthy buildings. As such, the impact of the acoustic environment on human health and the corresponding soundscape design has been the focus of research in recent years [1]. The acoustic environment directly impacts the health of residents, especially in old communities, making it an important part of the urban renewal policy of China.
The old communities are always located in the city center with spatial openness, and they are accompanied by diverse sound sources, such as road traffic noises and the cries of children. Due to the lack of focus on effective community planning, cars are parked in a disorderly fashion, and illegal buildings are constructed, making it hard to dissipate the noise. Moreover, the greening rate of old communities is relatively low. It is difficult to create natural sounds, such as wind blowing leaves and animal sounds, such as birds singing and cicadas chirping. With the development of the current society, people are unsatisfied with outdoor acoustic comfort.
The noise of the living environment may lead to cardiovascular and cerebrovascular diseases, sleep problems, irritability, and cognitive disorders in children [2,3,4]. Exposure to traffic sounds has been associated with an increased risk of adverse health outcomes, both physiologically and psychologically [5]. Bergomi et al. [6] conducted physiological tests on students, showing that high decibel noise could affect the neuroendocrine system of the human body and damage sensory function. However, most of the earlier studies only focus on the negative factors of sound instead of considering the physiological effects of the positive impact of sound. In recent years, soundscape research has gradually become independent of noise research. The focus of research has shifted from the adverse effects of environmental sounds to their overall impact, taking human perception into account and treating sound as a possible resource for promoting health and supporting the environment [7]. The ISO 12913-1 standard defines “soundscape” as “the acoustic environment perceived, experienced, and/or understood by an individual or group of people in a particular setting” [8].
The association between positive soundscape perception (e.g., happiness, calmness, etc.) and positive health effects (e.g., increased recovery rates, reduced stress-induced mechanisms, etc.) is one of the key questions in soundscape research. A two-dimensional emotional assessment was carried out for 60 groups of sounds and their corresponding pictures, and the changes in ECG, EEG, and skin resistance induced by these sounds were recorded. It was found that the physiological changes were highly correlated with the results of self-emotional evaluation [9]. Chuen et al. [10] studied the influence of changes in single parameters of sound on physiological indicators. They analyzed the effect of sound on heart rate (HR), skin resistance, respiratory rate, and facial muscles. The results show that changes in all sound parameters lead to an increase in HR. The response of the skin’s electrical signals is affected by changes in timbre, intensity, and rhythm, among which respiratory rate is susceptible to changes in rhythm. Blood [11], Schmidt [12], and Sammler [13] find that happy and exciting music clips were associated with electrical activity in the left frontal lobe. In contrast, fearful and sad music increased electrical activity in the right frontal lobe. Meng et al. [14] revealed the relationship between low-frequency noises and fatigue in the working environment. Kang [15] found that the physiological response of human beings was strongly affected by the measurement time and soundscape type and the relationship between the physiological signal and the subjective restorative scale.
The attention restoration theory suggests that nature (such as exposure to natural sounds, like the sound of waterfalls) improves cognition and helps with recovering from stress [16,17,18,19]. By reviewing literature with the keywords soundscape, health, and quality of life, 130 research papers were retrieved which supported that positive soundscapes were significantly associated with self-reported good health. The primary method of soundscape physiology research is an experimental design based on passive listening and event-related or stimulus locking. The experimental subjects are mainly homogenous. The physiology and neurophysiology of the soundscape are still in their infancy, and there are many aspects worthy of further study.
Old communities are a part of urban modernization, with Chinese characteristics. Old communities carry generational information, such as unique perspectives and traditions, though they face many health challenges brought about by rapidly changing urban environments and lifestyles. According to environmental recovery theory [20], an appropriate setting can promote the recovery of individuals within it from a consumption state; otherwise, consumption will increase. Therefore, this paper studies the correlation between the soundscape of old communities and human physiological health. Then, according to the analysis, the study obtains sound sources with positive effects on human health to provide a reference point for improving the sound environment in reconstructing old communities.
2. Methodology
2.1. Study Area and Measurement of dB(A)
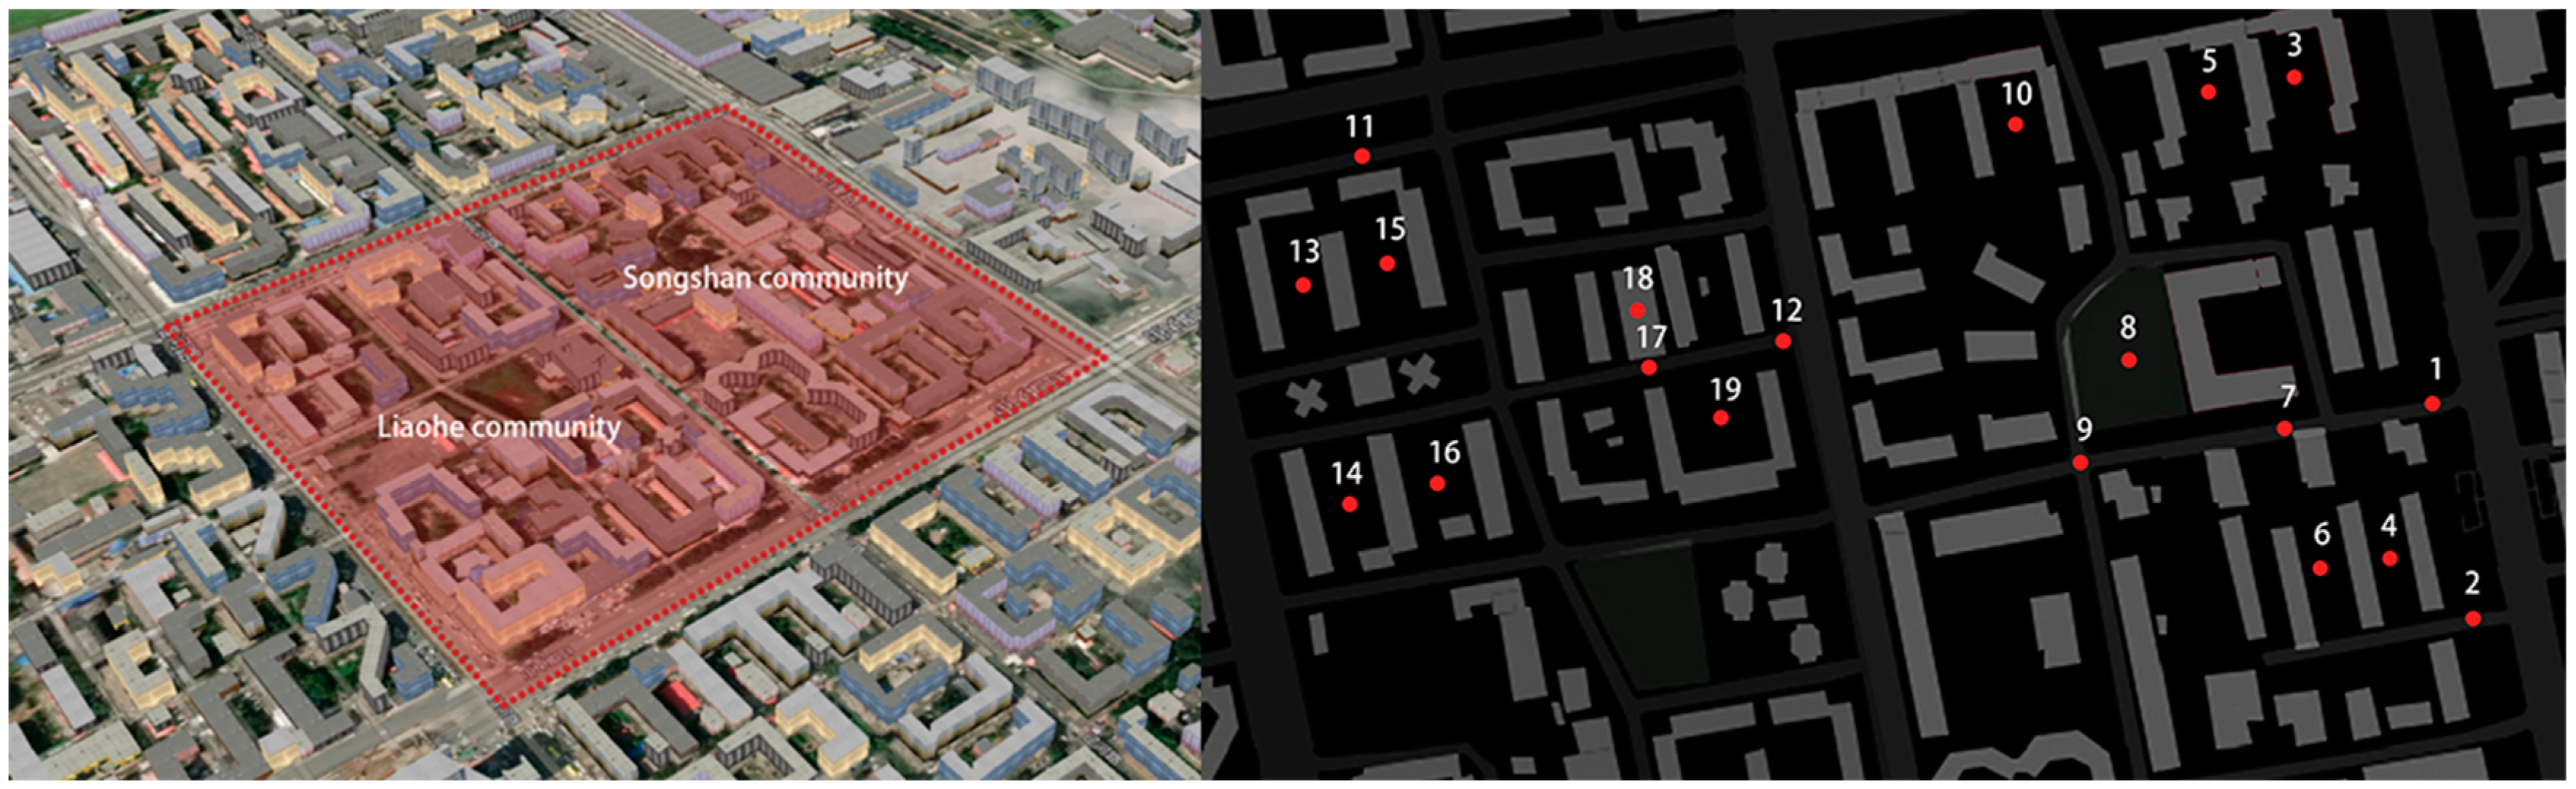
Harbin (125°420–130°440 E longitude, 10°040–46°400 N latitude) is the capital of Heilongjiang Province, China. The city is characterized by long winters, short and dry summers, and relatively short spring and autumn seasons. The present study selects the typical representative old residential areas of the Songshan community (Site A) and the Liaohe community (Site B) in Harbin as the research fields. The layout of Site A possesses a peripheral and determinant architecture, and the layout of Site B is an enclosed mode. As Figure 1 shows, the measuring points were arranged in a network format. P1, P2, P11, and P12 were located in the exterior walkway to test the sound pressure level (SPL) of the arterial street. P7, P9, and P17 were located inside the community to focus on the impact of noise on multi-story buildings. P8 and P18 were set in the square to focus on the effects of square dancing. Another test point was established to study the influence of different architectural forms on the acoustic environment.
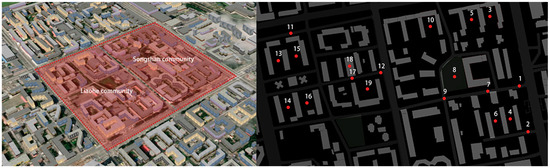
Figure 1.
Layout of the study area and measurements of the points set.
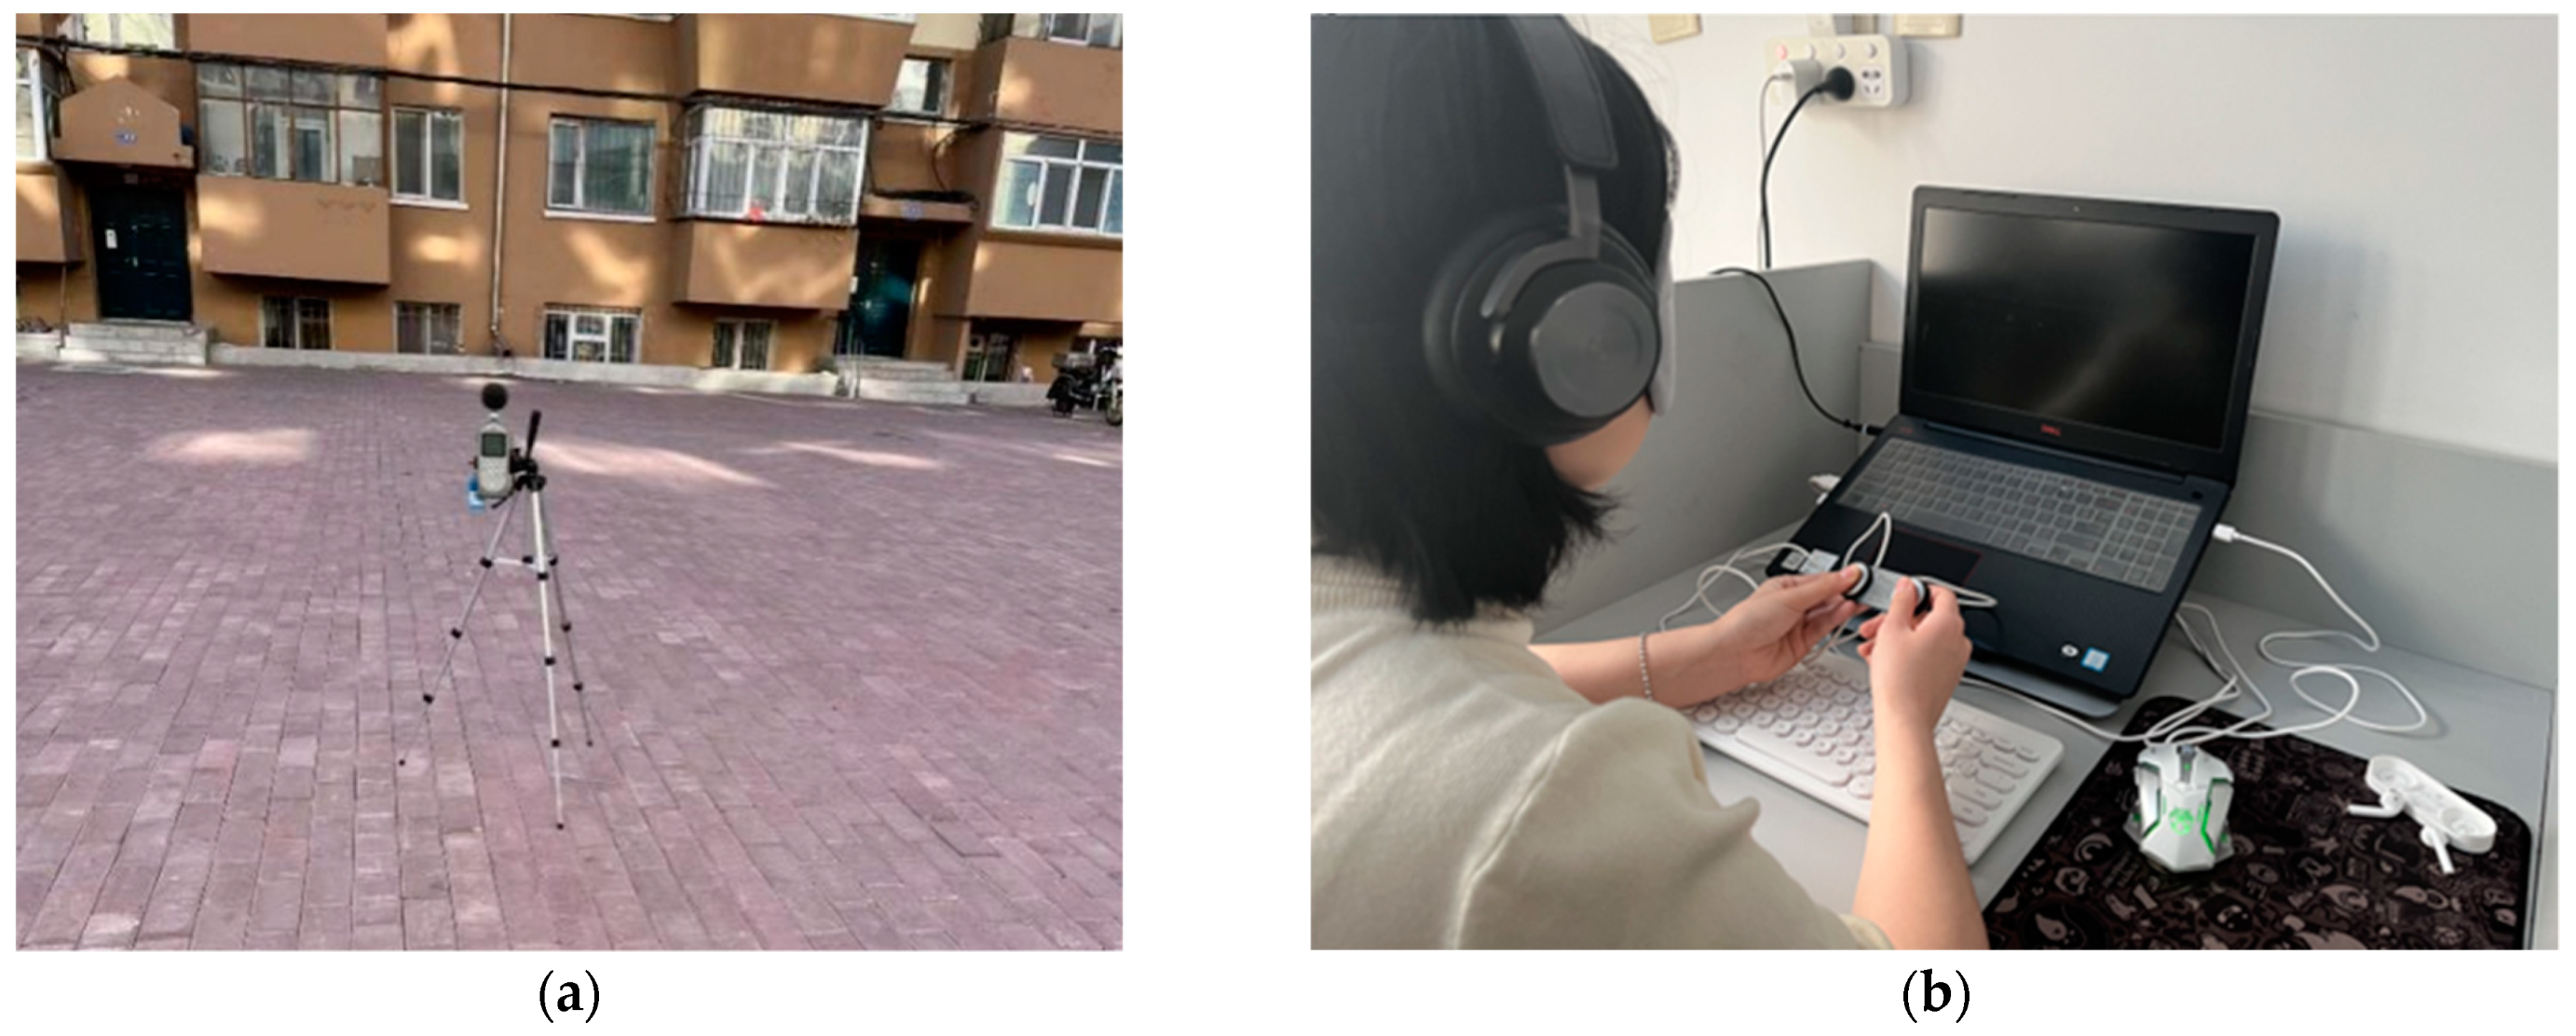
An AWA5680 sound level meter with a measurement range of 30–130 dB(A) was selected for this study [21]. According to the Acoustic Environmental Noise Measurement Method (GB/T 3222-94), the three daytime periods of 8:00–10:00, 14:00–16:00, and 19:00–21:00 were selected for measurement. In this test, the sound level meter was set to count every 10 s. Each point was continuously tested for 10 min, and each measuring point was tested for a total of 12 times. The distances between the measuring point, the reflector, and the outer wall were greater than 3.5 m and 1 m, respectively, and the probe height was set at 1.5 m (Figure 2a).
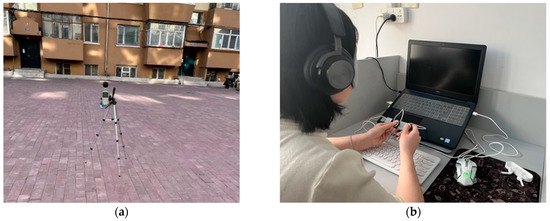
Figure 2.
Test instruments: (a) acoustic environment test and (b) physiological measurement.
2.2. Questionnaire Design
To explore the acoustic environment characteristics of the old residential area and residents’ preference for each acoustic source, a questionnaire was used to obtain the psychological data of the subjects with the following questions: the sound source, degree of preference for the sound source, the social background of the subjects, and psychological perceptions. The PHQ-9 depression scale was used to obtain psychological perceptions.
In the questionnaire, the attitudes of the subjects were measured using a five-point Likert-type scale (Table 1), which has been widely used in survey research on the environmental effects of subjective comfort [22]. A total of 300 residents were surveyed from September 2021 to March 2022. The reliability coefficient of the questionnaire was estimated at 0.87 (Cronbach’s alpha). The KMO coefficient was 0.861, and Bartlett’s spherical test results were significant (p < 0.001).

Table 1.
Contents of the questionnaire.
2.3. Subjective Evaluation of Sound Perception
Electrodermal activity (EDA) and HR are widely used to assess the physiological response to sound stimuli and are suggested as sensitive indicators for evaluating the impact of sounds [23,24,25]. The EDA was measured using two electrodes (HKR-11, range: 100 to 2500 kΩ; accuracy: 2.5 kΩ; sample frequency: 50 Hz) attached to the subject’s index and middle fingers of the non-dominant hand. The HR was measured by a photoplethysmography (PPG) sensor (HKG-07, range: 30 to 250 bpm; accuracy: 1 bpm; sample frequency: 16 Hz) attached to the ring finger [26].
According to the feasibility of the experiment, the requirements of sample size for data analysis, and to ensure that the subjects had good hearing conditions, the subjects of this study were determined to be young people (average age: 30) with high hearing sensitivity [27]. Thirty residents were selected to voluntarily join the test in NEFU’s building physics laboratory. They were then informed of the purpose and process of the experiment. All participants had normal hearing, were healthy, and did not take prescription drugs. The physiological environment was in a stable state (temperature = 21–23 °C; background SPL < 25 dBA).
Participants were asked to wear blindfolds during the experiment and listen intently using headphones (Figure 2b). White noise was played first, and other audio was played randomly. Each audio lasted two minutes, and the interval between each sound was 60 s [9,28]. The subjects were required to fill in the simple mood state scale to evaluate their mental state, and the degree of pleasure and excitement were used as evaluation items during the interval time.
The semantic difference method was used to obtain residents’ evaluation of different sound sources [29]. Participants’ psychological ratings were obtained by asking them to choose their feelings on a verbal scale. The SD method selects multiple pairs of adjectives to represent the psychological feelings of the subjects towards the evaluated objects, which is beneficial for the quantitative evaluation. This study refers to the adjective pairs commonly used in the existing research and summarizes the evaluation items into 11 items. Participants were asked to rate the sounds they heard in the audio using the five-point Likert scale (Table 2).
Table 2.
Contents of the questionnaire.
3. Results
3.1. SPL Distribution of the Study Area
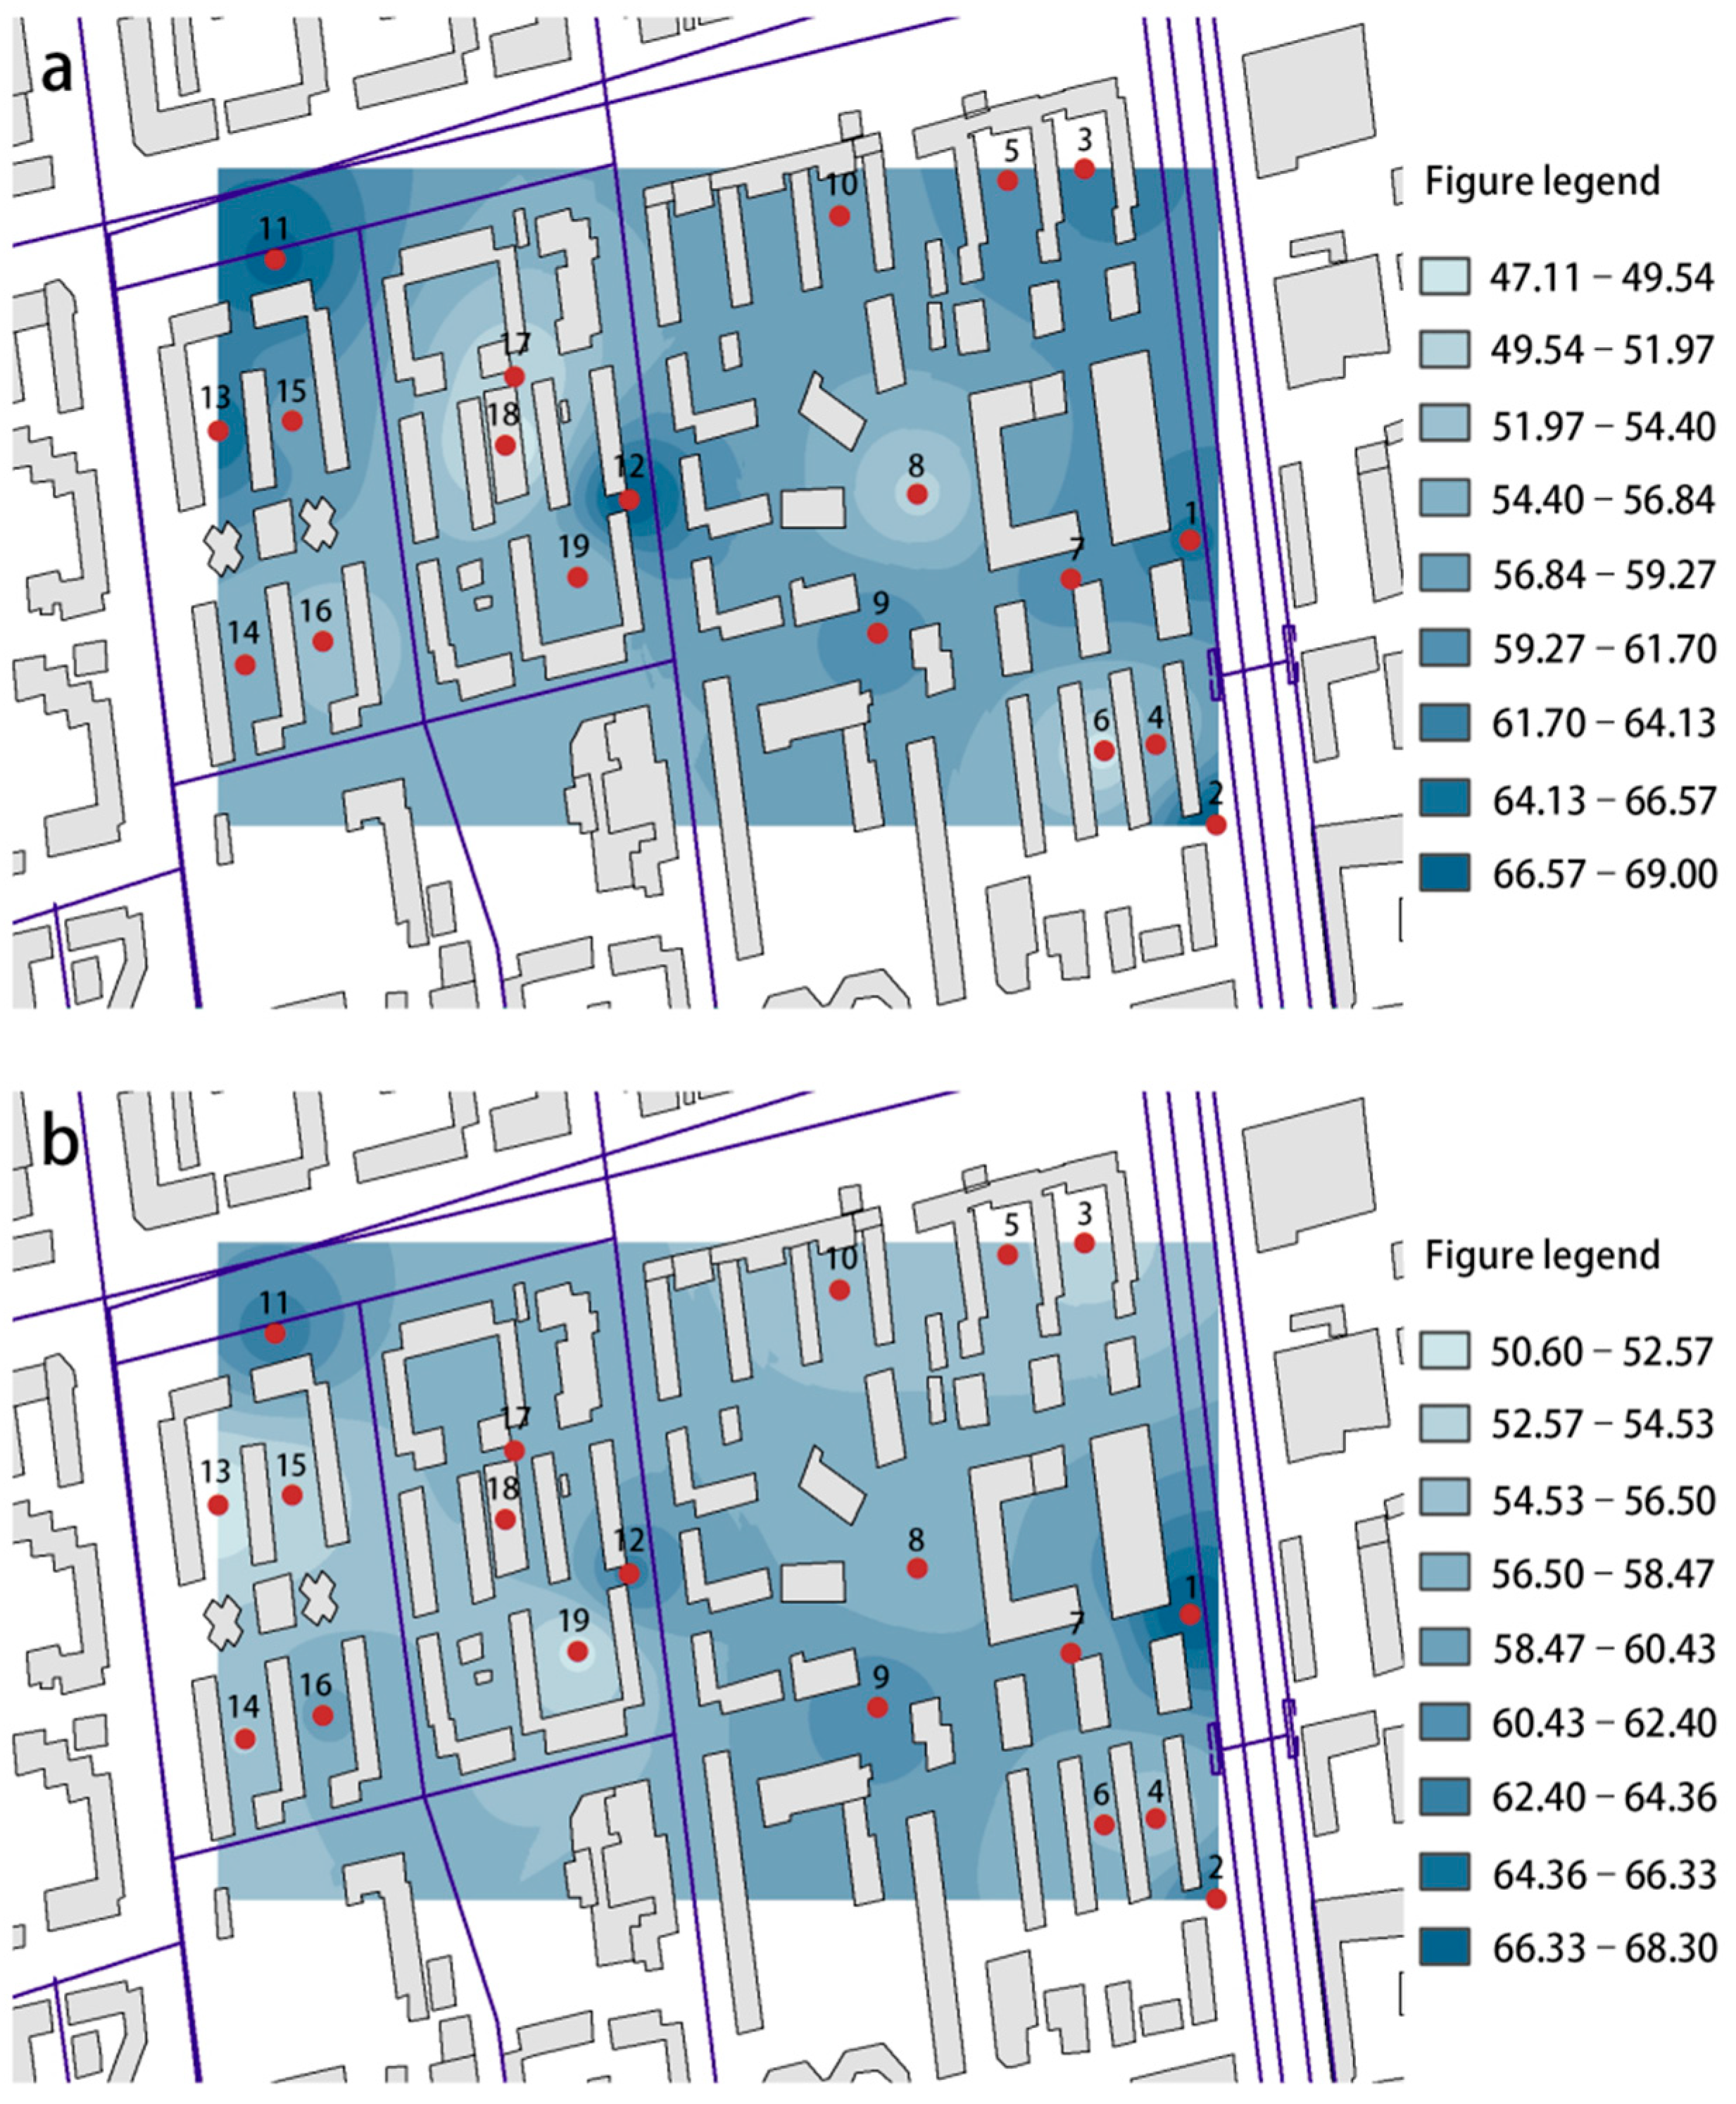
Figure 3 shows the SPL distribution of the study area. It can be seen from Figure 3 that the old multi-story residential area is seriously disturbed by noise far beyond China’s acoustic environmental quality standards (55 dB). Table 3 shows the maximum value of SPL during the different periods in the study area. As the table shows, during 8:00–10:00, the points along the street (P1, P2, P3, P4, P12, P13) appear to have a higher SPL, and the maximum interpolation reached 8.3 dB(A) among the points, which is similar during 19:00–21:00. This is because traffic noises dominate the acoustic environment during these periods. It is worth noting that the points on the square (P8, P9) appear to have a higher SPL during 19:00–21:00 because square dancing affects the acoustic environment during this time. The SPL distribution inside the community during 14:00–16:00 differs slightly, but the maximum interpolation reaches 24.1 dB(A) between the point inside the community and outside the road. The average SPL in Site A is lower than in Site B, concluding that the enclosed layout is superior to the determinant layout in noise reduction. It is worth noting that there are two 1-story illegal buildings around the measuring point 13–16. In the whole day SPL distribution, these buildings played a certain role in hindering the propagation of external traffic noise. The distribution of SPL values is 1.8 dB lower than that of the surrounding 8-story building area. Therefore, it can be seen that low-rise small buildings have a certain impact on the SPL distribution of the residential area.
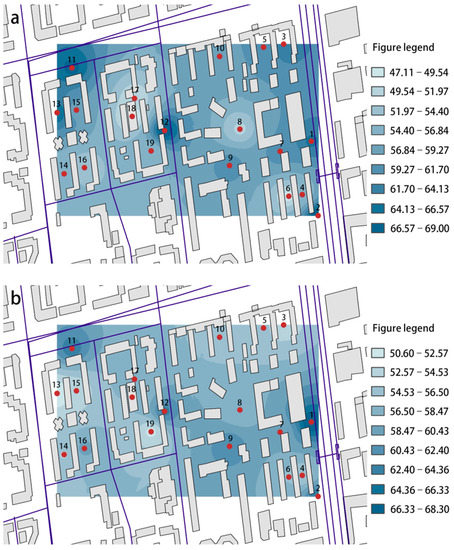
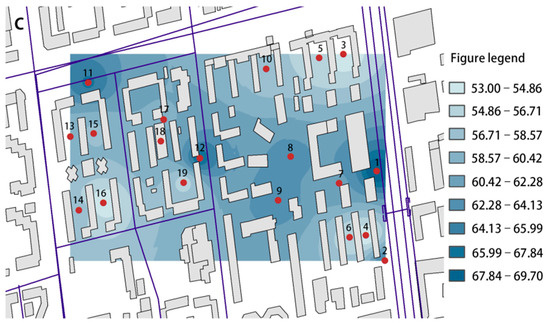
Figure 3.
The SPL distribution of the study area during different periods (Unit: dB(A)): (a) 8:00–10:00, (b) 14:00–16:00, and (c) 19:00–21:00.
Table 3.
The maximum value of SPL during the different periods in the study area (Unit: dB(A)).
3.2. Evaluation of the Sound Environment Based on the Sound Types and Sources
The proportion of women in the questionnaire was 58.1%. Residents aged 31–64 accounted for 52.9%, and those over 65 accounted for 11.0%. Those with at least a middle school education level accounted for 65.1% of the subjects, and uneducated people accounted for 4.1%. In terms of working conditions, the highest proportion of residents with other occupations was 48.8%, and the unemployed accounted for 12.3% of the subjects. In terms of income, people with an income of CNY 1500–3000 accounted for 43.6%, and those with an income greater than CNY 5000 accounted for 12.8%. The monthly income of residents in the sample community is relatively low.
Figure 4 shows the frequency distribution of community residents hearing different sound sources in different seasons. People are sensitive to the sounds of traffic, animals, and music. In addition, in evaluating the outdoor acoustic environment, the proportion of basically satisfied and very dissatisfied was 67.9% and 5.8%, respectively. Most of the subjects could adapt to the existing acoustic environment.
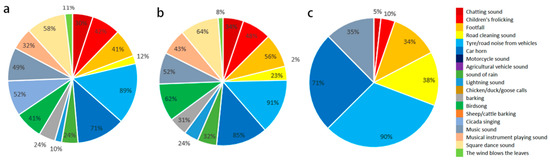
Figure 4.
Outdoor sound frequency diagram of an old residential area: (a) summer; (b) spring and autumn; (c) winter.
Table 4 shows the types of sound sources heard by the subjects in the questionnaire and the statistical analysis of their subjective evaluation. As the table shows, the most popular sounds were birdsongs (4.10) and the sound of rustling leaves (3.94), followed by musical instruments playing (3.58) and music (3.55), then the square dancing (3.23), indicating that residents preferred music and natural sounds. The most disliked sounds were factory machinery (1.61) and construction sounds (1.69), followed by the sound of a device running (1.82) and thunder (2.15), followed by tires/road traffic (2.05) and car horns (2.14). It is worth noting that the evaluation value of the sound of firecrackers is 2.81, but only 53% of the subjects like it because this sound only appears during the Spring Festival. Additionally, the evaluation value of the sound of children playing is 3.15, contrary to normal expectations. By analyzing the questionnaire, it is found that the residents with children gave a high evaluation, but most of the residents without children in the family cannot tolerate it. For the traffic noise inside the residential area, the subjects indicated that it was within the acceptable range. This was because the sound of internal driving vehicles was only an occasional sound source. At the same time, the internal roads in the old community were narrow, and the driving speed of vehicles was slow. The generated sound had no significant impact on the residents. However, the traffic noise of the external lane is unacceptable to the residents (which result is the same as that in previous studies), because there is a significant sound sequence phenomenon in the external lane; also, the vehicle speed is fast and the SPL is high, [30].
Table 4.
Evaluation of outdoor sound preferences.
3.3. Correlation between Acoustic Evaluation and Sound Sources
SPSS was used to process the questionnaire data. It was found that the age, educational background, occupation, and other social characteristics of interviewees had a particular impact on the evaluation of sound preference, which was similar to previous research results [31]. Figure 5 shows the correlation analysis results of subjects’ social characteristics, satisfaction with the acoustic environment, psychological state, and sound sources.
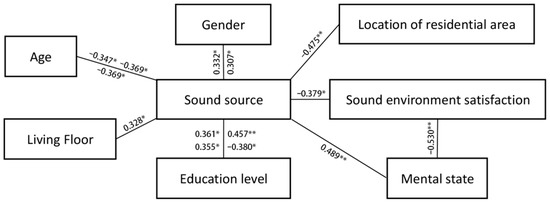
Figure 5.
The relationship between different variables and the comfort evaluation of the acoustic environment (** indicates that the two-tailed test is significant at the 0.01 level, and * indicates that it is significant at the 0.05 level).
Regarding individual characteristics, the correlation between gender and the sound of firecrackers and dogs barking was 0.307 * and 0.332 *, respectively (p < 0.05), where men prefer these two sounds over women. The correlation between age and the sounds of footsteps, rain, and dogs barking was −0.369 *, −0.347 *, and −0.369 *, respectively (p < 0.05), where these sounds were less likely to be enjoyed by older residents. The correlation between education level and the sound of chatting, rain, thunder, and cicadas was 0.475 ** (p < 0.01), 0.355 *, 0.361 *, −0.380 *, respectively (p < 0.05), signifying that with the improvement of education level, the residents’ tolerance to the sounds of voices chatting and thunder is higher. In comparison, the tolerance to the sound of cicadas is lower. The preference for the sound of rain is higher. The correlation between the residential floor and the sound of construction is 0.328 * (p < 0.05), and the correlation between the location of the residence and the sound of road cleaning is −0.475 ** (p < 0.01), signifying that the higher the residential floor is, the higher the degree of tolerance to the sound of construction. Furthermore, residents directly facing the street have a higher degree of tolerance to the sound of roads being cleaned.
In terms of acoustic environment satisfaction, the correlation between outdoor acoustic environment satisfaction and traffic sounds and residents’ psychological depression was −0.379 * (p < 0.05) and −0.530 **, respectively (p < 0.01). This shows that residents exposed to increased traffic noises or suffering from psychological depression have lower satisfaction with the outdoor acoustic environment. The correlation coefficient between residents’ psychological depression and music was 0.489 ** (p < 0.01), indicating that residents with high psychological depression liked music more.
3.4. Correlation Analysis between Sound Perception and Psychology
According to the questionnaire results, it is found that the sound of traffic has the most significant influence on residents, and residents generally like the sound of birds, nature sounds, and music. Therefore, the sound sources of the study are set as the sound of traffic, the sound of birds, the sound of wind blowing on leaves, and the sound of music. A white noise was established as the control group. Except for the music sound, other sound sources were extracted from the on-site recordings collected in the test area by a voice recorder (SONY PCM-M10) and calibrated according to ISO 1996-2:2017. To avoid the interference of different noises, the sound sources were collected at relatively quiet times throughout the day (Recording time: 8:00–10:00, 14:00–16:00, 19:00–21:00) [32,33]. The sampling audio format was set to WAV, dual-channel 16 Bit, and the sampling frequency was 44.1 kHz [34]. Adobe Design CS6 software (Adobe Co., New York, NY, USA) extracted 2-min snippets from the field recordings as the experimental sound source. Based on field measurement, the average SPL of the test site was 59 dB(A), so the A-weighted equivalent sound level was set to 60 dB(A).
Figure 6 shows the HR changes after hearing different types of sound stimulation. As the figure shows, the changes in HR after hearing birdsongs, rustling leaves, music sounds, and traffic sounds were 5.41%, 3.90%, 4.18%, and 2.18%, respectively. Compared with the control group, the increase in HR indicates increased sympathetic nerve activity, to some extent. The greater the increase in HR, the more the residents tended to be excited or happy. According to the HR changes for different types of sounds, birdsongs, rustling leaves, and music have positive effects. Here, birdsongs showed the strongest effect, whereas the sound of wind blowing on leaves had the weakest effect.
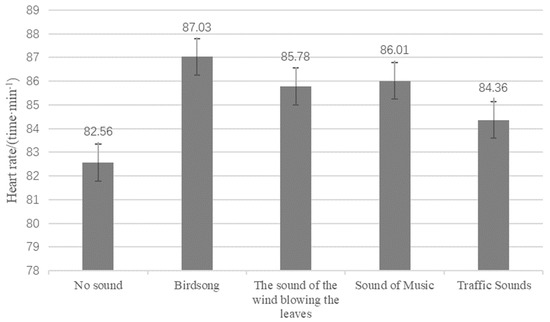
Figure 6.
Heart rate changes after different types of sound stimulation.
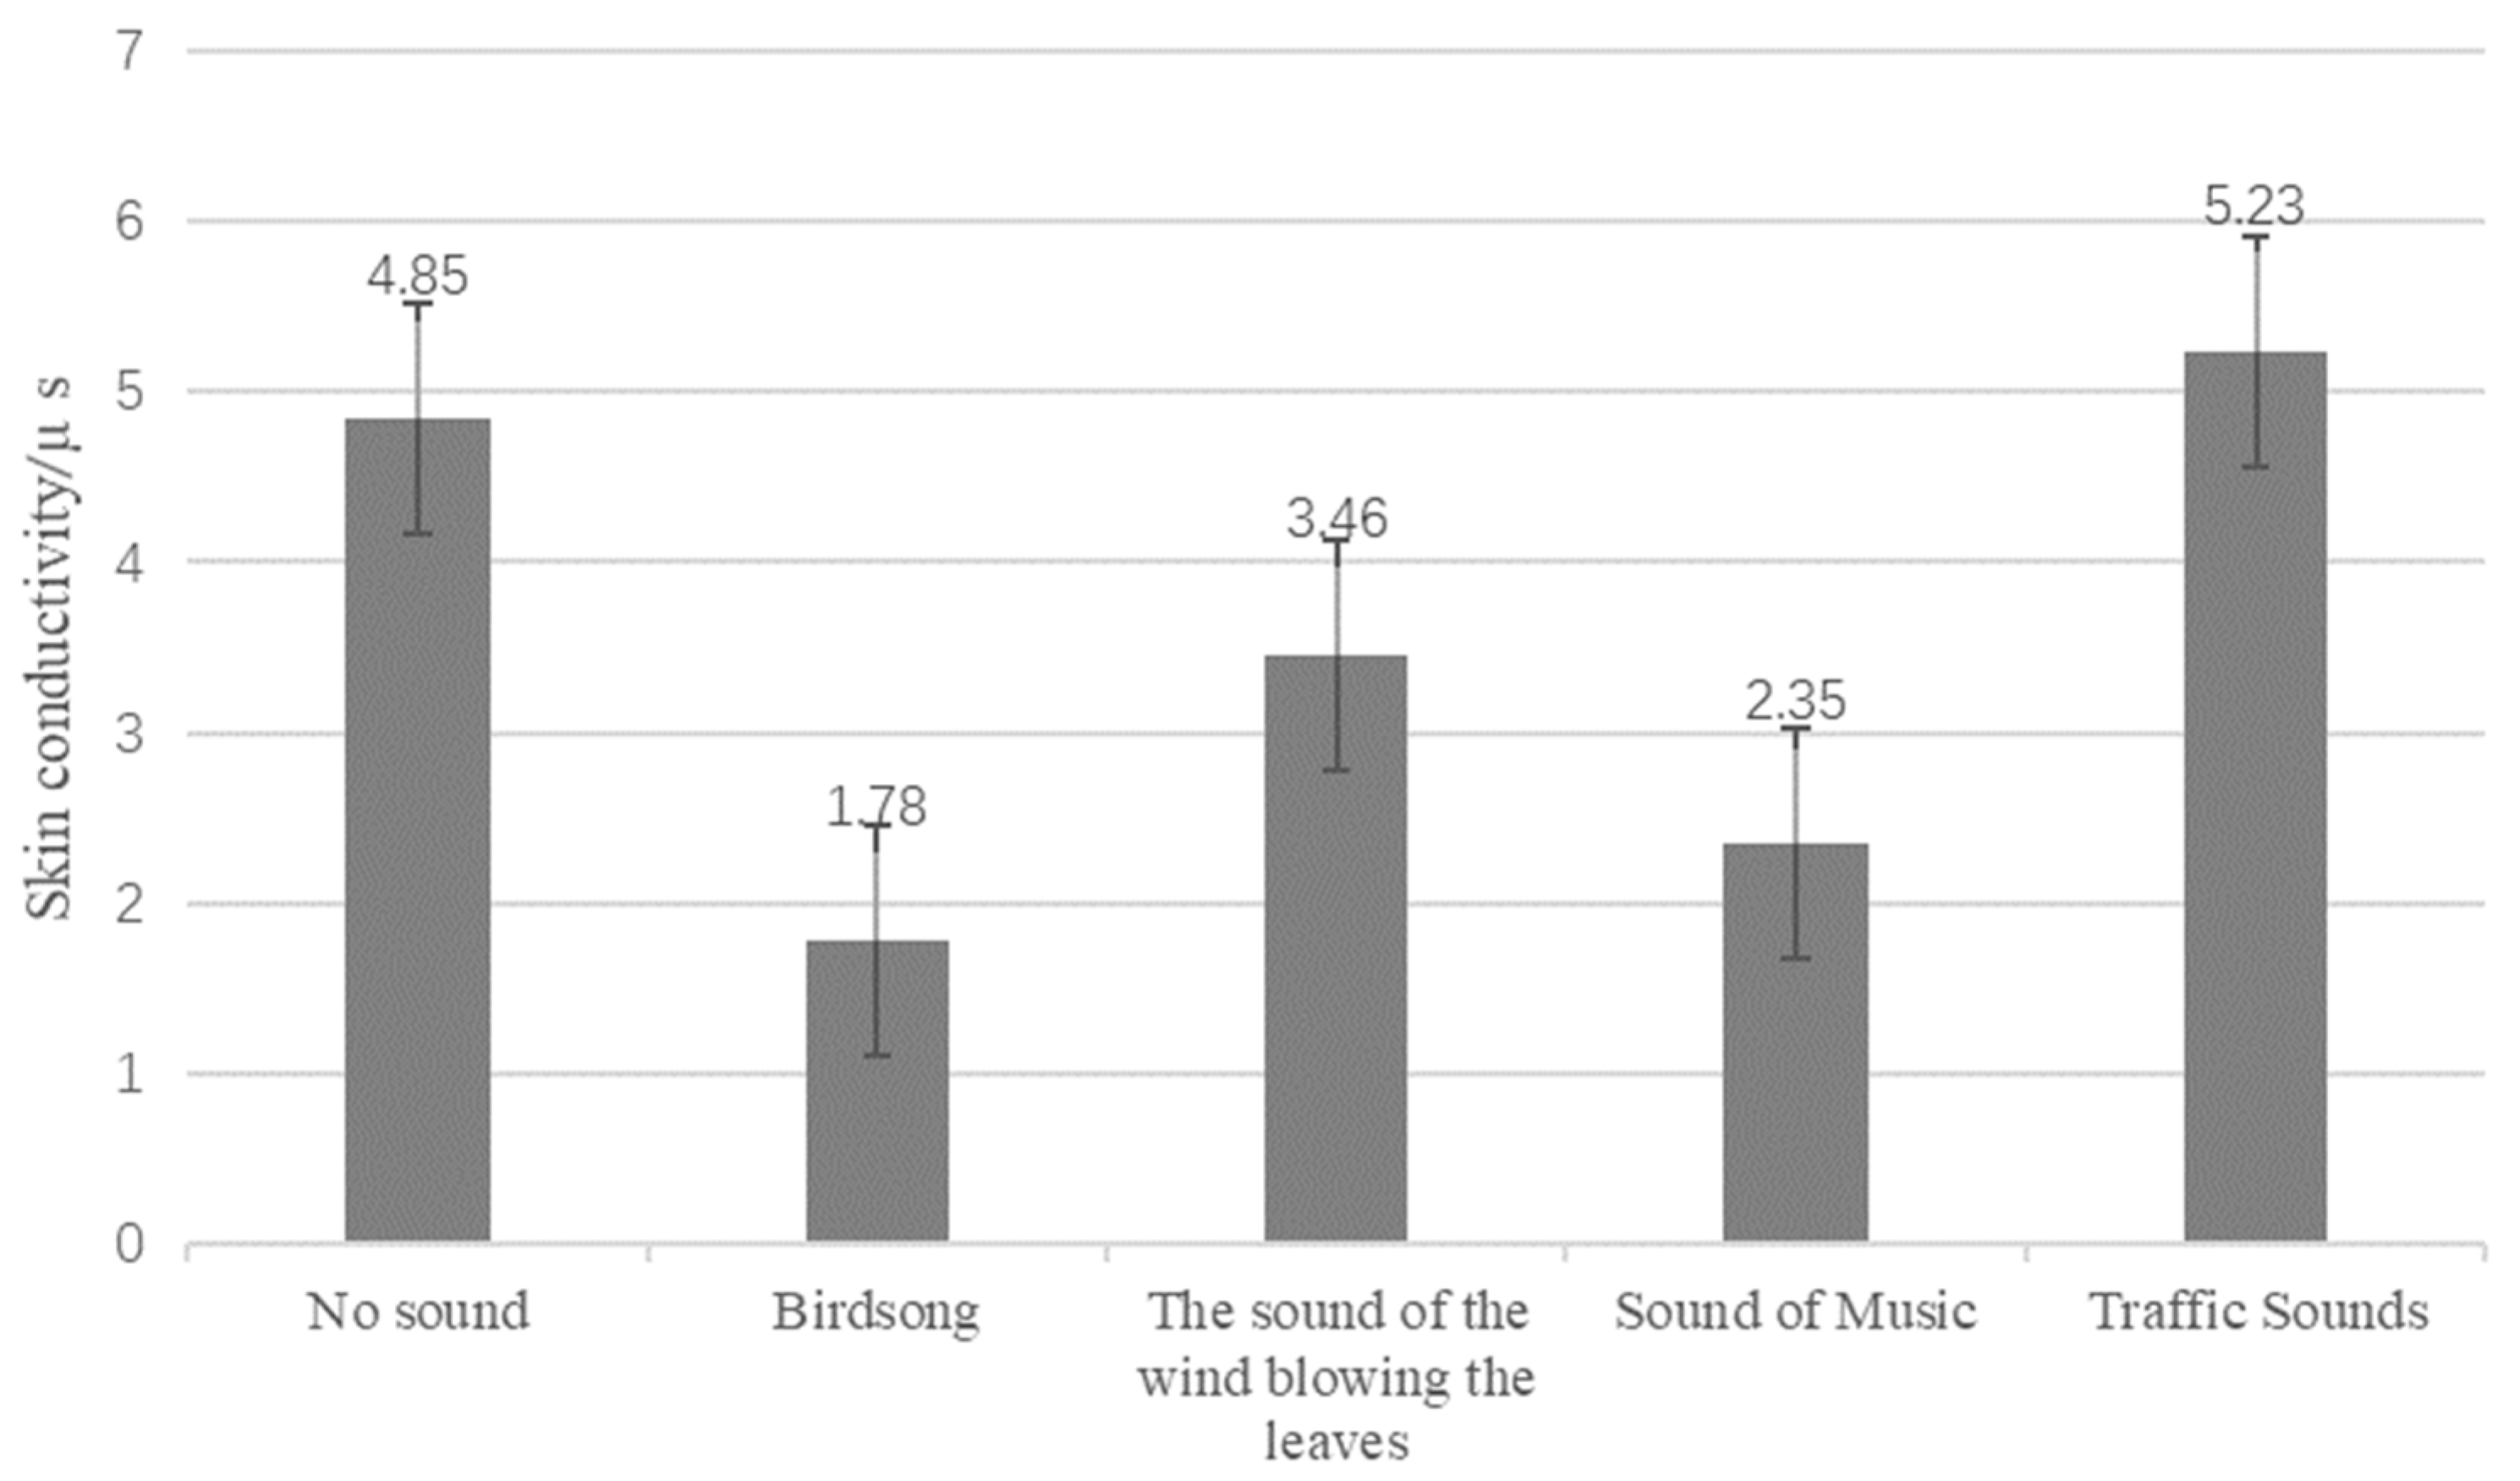
The statistical analysis of the changes in SCL for various sound types found that after listening to the control group and then listening to other sound sources, the SPL appeared to have a certain decreasing trend, except for traffic sounds. The SCL changes after hearing birdsongs, music sounds, rustling leaves, and traffic sounds are −63.30%, −51.55%, −28.66%, and 7.84%, respectively (Figure 7). It was found that birdsongs strongly influenced the human body’s mood of pleasure or relaxation, followed by music, and finally, by the sound of rustling leaves. The sound of traffic did not produce pleasure or relaxation.

Figure 7.
Changes in SCL after different types of sound stimulation.
Figure 8 shows the evaluation scores of pleasure and excitement changes under different sound source backgrounds. As Figure 8 shows, the evaluation of the pleasure and excitement degrees for traffic sounds is negative, indicating that people reject the urban noise environment. The remaining recordings were rated positively, suggesting that such sounds brought people a distinct sense of pleasure and excitement. There were differences in evaluating the degrees of pleasure and excitement among different sounds. The scores of the degrees of pleasure and excitement for birdsongs (1.64 and 1.52) and music (0.79 and 0.82) were higher. The scores for wind blowing on leaves were the lowest, which were 0.73 and 0.34, respectively, indicating that all three kinds of sound sources positively affected human psychology. The effects of birdsongs and music are more pronounced. As Table 5 shows, the results show that HR and SCL were correlated with pleasure and excitement at p < 0.01, indicating that physiological indexes could comprehensively reflect the psychological changes of the human body, to a certain extent. There was a significant positive correlation between HR and the degrees of pleasure and excitement, and a significant negative correlation between SCL and the degrees of excitement and pleasure. In summary, when the human body is in a state of pleasure and excitement, the HR will show an increasing trend, while the SCL will show a trend of decline.
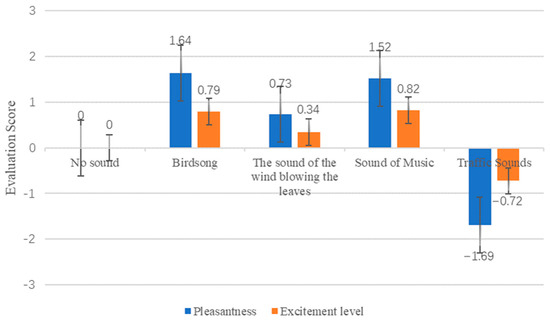
Figure 8.
Changes in pleasantness and excitement.
Table 5.
Correlation analysis of psychological and physiological index changes.
Table 6 shows the SD scores for different types of sounds. The table shows that the prominent evaluation item of the birdsong type is clear and lively, making people feel peaceful and happy. From the evaluation results, people’s evaluation of birdsongs is entirely positive, which is related to the special vocalization mode of birds, which meets people’s expectations of natural sounds. The evaluation item of the music sound type is clear and lively, attractive, and pleasant. People’s general feeling for music is that the sound environment is complex and smooth. This kind of psychological sense is related to the type of music, which can relieve people’s moods. The evaluation item of the sound type of rustling leaves is quiet and natural, which can provide a good sound environment and make people feel peaceful. According to the evaluation results, the three kinds of acoustic sources evaluated are all positive, providing a comfortable acoustic environment for residents.
Table 6.
SD scores for different types of sounds.
3.5. Influence of Sound Barrier on SPL Distribution in an Old Community
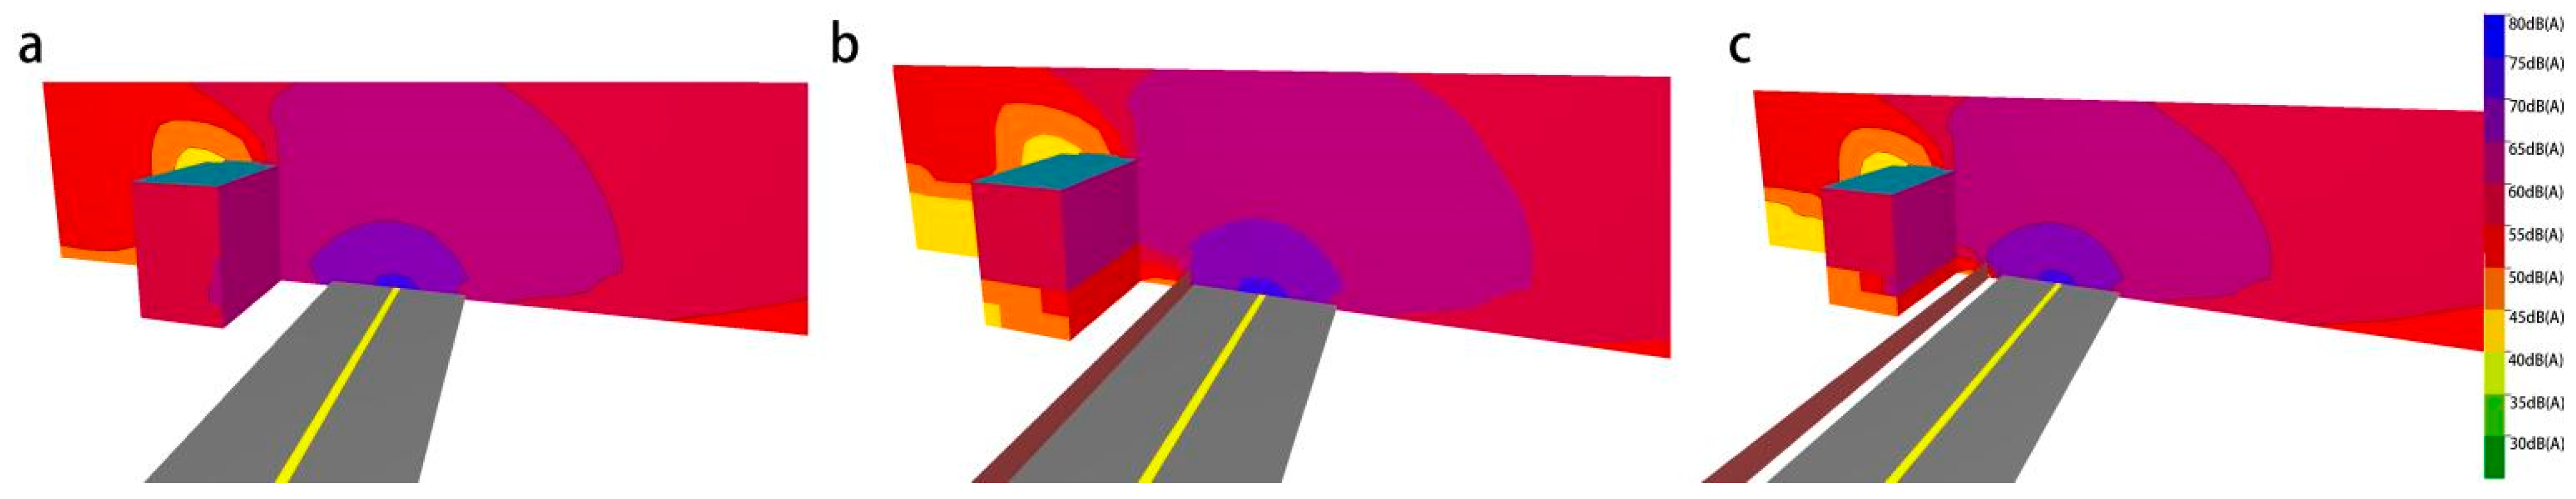
For vertical SPL distribution, Cadna/A simulation software (DataKustik Co., Gilching, German) was used to develop an optimization strategy. The simulation parameter was set according to ISO9613. The simplified model was set to a 6-floor building (length: 40 m, width: 12 m) that was 8 m from a four-lane road, characterized by a road width of 12 m. The traffic situation was set using real-life conditions (speed: 40 km/h, number of cars: 1665/h, number of trucks: 85/h). The noise barrier was 3 m high and the same length as the road. The simulation result is shown in Figure 9.
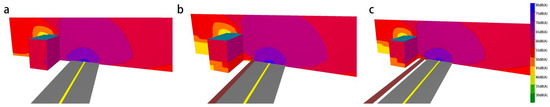
Figure 9.
Cross-section simulation of street-facing building noise: (a) without acoustic barrier; (b) with an acoustic barrier; (c) with an acoustic barrier at 2 m.
As can be seen from Figure 9, the sound barrier effect is evident on the first floor of the building, but the overall noise reduction effect decreases with the increase in the floor height. By comparing the addition of a sound barrier at the side of the road and the addition of a sound barrier at 2 m on the side of the road, it can be seen that the location of the sound barrier has no influence on the 1st floor, but has a great impact on the 2nd floor. The sound barrier is placed closer to the road for a better sound insulation effect, and its range of influence is expanded from 2 floors to 5 floors. From the perspective of sound insulation, it is more advantageous to place the sound insulation screen on the side of the road (Table 7).
Table 7.
Numerical change of SPL for each layer after adding an acoustic barrier (Unit: dB(A)).
As can be seen from Table 8, with the increase in road distance, the transverse comparison SPL of each floor gradually decreases. It is found that when the length increases from 8 m to 18 m, the SPL of the 1st floor decreases by 4 dB, and that of the top floor decreases by 2 dB. When the distance drops to 58 m, the SPL of the 1st floor decreases by 11 dB, and that of the top floor only reduces by 6 dB. It can be seen that the 1st floor is most sensitive to distance. When the distance is 8 m from the road, the SPL weakens with the increase in floor level, whereas the SPL is slightly weakened on the 5th floor. When it is 18 m from the road, the SPL decreases with the increase in the number of floors. When it is 28 m from the road, the SPL increases with the increase in the number of floors because the traffic noise influences the building distance to the road, and it is related to the length of the road. By comparing the difference in the total SPL of each setback distance, it is found that the road setback distances of 18 m and 28 m are the “overall optimal,” which are reduced by 13 dB(A) compared to the previous standard.
Table 8.
Changes of SPL in each layer of the sound barrier under different setback conditions (Unit: dB(A)).
As shown in Table 9, with the increase in the setback distance, the effect of the sound barrier also increases on the whole. However, from the perspective of the difference value, the impact of the sound barrier is 14 dB when the road distance is 8 m and 7 dB when the road distance is 18 m. Then, the effect weakens with the increase in distance and does not rebound until 48 m. Therefore, 8 m and 18 m are ideal distances for the sound barriers.
Table 9.
Numerical changes of SPL for each layer after adding sound barriers under different setback conditions (Unit: dB(A)).
4. Discussion
Based on the findings of the above study, the acoustic environment of old communities seriously affects the psychological health of residents. This paper obtains the subjects’ perceptions of the existing acoustic environment, and puts forward the corresponding improvement strategies based on these perceptions. However, this paper takes the old community as the carrier, which is different from other research carriers; due to the impact of the built-up environment, it can only regulate the background sound and noise. Through the construction of a sound barrier made of trees, the ecological environment can be improved, increasing the residents’ exposure to birdsong. Factors affecting sound comfort, such as firecrackers and children’s noises, can be improved through property management and control.
A large number of scholars have done relevant research on the impact of traffic noise on residential areas. However, this study found that traffic noise is not the most intolerable sound source for residents in old communities, and mechanical noise has a greater impact on residents’ satisfaction. At the same time, the influence of traffic sounds on heart rate is not significant, and the influence on skin conductivity is the most significant. In terms of acoustic environment satisfaction and acoustic preference, Kang J et al. [35] conducted similar research on high-rise residential areas in the same region. Through comparison, it is found that the maximum SPL difference in the old community (24.1 dB) is significantly higher than that in the high-rise residential area (21 dB). At the same time, the residents’ perception of some sound sources is different from that in the modern high-rise community. For example, the satisfaction value for traffic noise in the high-rise residential area (1.8) is lower than that in the old community (2.1), indicating that the residents in the old community have adapted to the impact of traffic noise, to a certain extent. As for the value of satisfaction regarding decoration noise, the residents in old communities report lower values (1.6) than those in high-rise modern residential areas (2.2). There are few decoration sound sources in old communities, so residents are more sensitive to such sound sources, while decoration behavior in modern residential areas is more common, and residents adapt to such sound sources to a certain extent. It can be seen from the above that physiological adaptability is an important factor in the study of acoustic environment. The overall satisfaction of residents in modern residential areas is higher than that in old communities. By evaluating the comparative study item by item, it is found that the visual factor of greening is also an important factor affecting sound perception.
5. Conclusions
In this study, it was found that the sound environment impacts the human body index and the psychological state. The physiological response of humans was strongly affected by the measurement time, soundscape type, and the relationship between the physiological signal and subjective restorative scale. The differences between the physiological indicators and the correlation between the physiological indicators and subjective evaluation factors were determined by performing variance and canonical correlation analyses. From the obtained results, the following conclusions can be drawn:
- (1)
- The internal noise distribution in the old community has obvious time distribution characteristics. During rush hour, the maximum SPL is 91.5 dB(A) every day, which is mainly affected by external traffic noise. The maximum SPL is 84.1 dB(A) throughout the remainder of the day, which is affected by the internal living noise. These values exceed the healthy SPL range of 45–55 dB.
- (2)
- Residents are sensitive to the sound of traffic, animals, and music and have an apparent preference for all kinds of sound sources in the area (nature sounds > animal sounds > man-made sounds > commercial sounds > traffic sounds). Gender, age, and education level are significant factors that produce a different sound source evaluation. Music can alleviate residents’ psychological depression, while traffic sounds and residents’ psychological state can affect the satisfaction evaluation of the sound environment.
- (3)
- There is a significant correlation between the physiological and psychological changes for the production of different sounds. Pleasant sounds increase a person’s HR and decrease SCL. Between hearing various sound sources and silence, the subjects’ HR increased 3.24 times per minute on average, and SCL decreased 1.65 times per minute, on average. When hearing birdsongs, the most apparent change was that HR increased 4.47 times per minute, while SCL decreased 3.07 times per minute. The SD evaluation showed that lively, pleasant, and attractive birdsongs and music produced the greatest HR and skin conductivity changes.
The sound environment of the old, multi-story residential area cannot meet the living needs of residents. The acoustic simulation analysis shows that the closer the sound barrier is to the road, the better the sound insulation effect. Sound insulation is best when the barrier is located between 8 m and 18 m from the road, but the noise reduction effect is not ideal when the barrier borders green belts. The sound environment can be improved with sound barrier design and by playing background music or simulated natural sounds.
Author Contributions
Conceptualization, P.C. and Z.X.; methodology, P.C. and Z.X.; software, T.L. and C.D.; validation, P.C., T.L. and C.D.; formal analysis, T.L.; investigation, T.L. and C.D.; resources, P.C.; data curation, T.L.; writing—original draft preparation, T.L.; writing—review and editing, P.C.; visualization, T.L.; supervision, Z.X.; project administration, P.C.; funding acquisition, P.C. and Z.X. All authors have read and agreed to the published version of the manuscript.
Funding
This work is supported by Fundamental Research Funds for the Central Universities (2572021BK02) and the Natural Science Foundation of Jiangsu Province (BK20211315).
Institutional Review Board Statement
Ethical review and approval was not required for this study on human participants in accordance with local legislation and institutional requirements.
Informed Consent Statement
The participants provided their written informed consent in order to participate in this study.
Data Availability Statement
The original contributions presented in the study are included in the article; further inquiries can be directed to the corresponding author/s.
Conflicts of Interest
The authors declare that they have no known competing financial interests or personal relationships that could have appeared to influence the work reported in this paper.
References
- Wang, Q.; Deng, Y.; Li, G.; Meng, C.; Xie, L.; Liu, M.; Zeng, L. The current situation and trends of healthy building development in China. Chin. Sci. Bull. 2020, 65, 246–255. [Google Scholar] [CrossRef] [Green Version]
- Daiber, A.; Kröller-Schön, S.; Frenis, K.; Oelze, M.; Kalinovic, S.; Vujacic-Mirski, K.; Kuntic, M.; Jimenez, M.T.B.; Helmstadter, J.; Steven, S.; et al. Environmental noise induces the release of stress hormones and inflammatory signaling molecules leading to oxidative stress and vascular dysfunction—Signatures of the internal exposome. Biofactors 2019, 45, 495–506. [Google Scholar] [CrossRef] [PubMed]
- Meecham, W.C.; Smith, H.G. Effects of jet aircraft noise on mental hospital admissions. Br. J. Audiol. 1977, 11, 81–85. [Google Scholar] [CrossRef] [PubMed]
- Jenkins, L.; Tarnopolsky, A.; Hand, D. Psychiatric admissions and aircraft noise from London Airport: Four-year, three-hospitals’ study. Psychol. Med. 1981, 11, 765–782. [Google Scholar] [CrossRef] [PubMed]
- Dorota, J.; Marie-Eve, H.; Poonum, W.; James, C.; Jos, V.; Jördis, W.; Elizabet, P. Development of the WHO environmental noise guidelines for the european region: An introduction. Int. J. Environ. Res. Public Health 2018, 15, 813. [Google Scholar]
- Bergomi, M.; Rovesti, S.; Vivoli, G. Biological response to noise and other physical stressors in places of entertainment. Public Health Rev. 1991, 19, 263–275. [Google Scholar]
- Kang, J.; Schulte-Fortkamp, B. Soundscape and the Built Environment; CRC Press: Boca Raton, FL, USA, 2016. [Google Scholar]
- ISO 12913-1; 2014 Acoustics Soundscape Part 1: Definition and Conceptual Framework. International Organization for Standardization: Geneva, Switzerland, 2014.
- Bradley, M.M.; Lang, P.J. Affective reactions to acoustic stimuli. Psychophysiology 2000, 37, 204–215. [Google Scholar] [CrossRef]
- Chuen, L.; Sears, D.; McAdams, S. Psychophysiological responses to auditory change. Psychophysiology 2016, 53, 891–904. [Google Scholar] [CrossRef] [Green Version]
- Blood, A.J.; Zatorre, R.J. Intensely pleasurable responses to music correlate with activity in brain regions implicated in reward and emotion. Proc. Natl. Acad. Sci. USA 2001, 98, 11818–11823. [Google Scholar] [CrossRef] [Green Version]
- Schmidt, L.A.; Trainor, L.J. Frontal brain electrical activity (EEG) distinguishes valence and intensity of musical emotions. Cogn. Emot. 2001, 15, 487–500. [Google Scholar] [CrossRef]
- Sammler, D.; Grigutsch, M.; Fritz, T.; Koelsch, S. Music and emotion: Electrophysiological correlates of the processing of pleasant and unpleasant music. Psychophysiology 2007, 44, 293–304. [Google Scholar] [CrossRef] [PubMed]
- Meng, Q.; An, Y.; Yang, D. Effects of acoustic environment on design work performance based on multitask visual cognitive performance in office space. Build. Environ. 2021, 205, 108296. [Google Scholar] [CrossRef]
- Kang, J.; Aletta, F.; Gjestland, T.T.; Gjestland, T.T.; Brown, L.A.; Botteldooren, D.; Schulte-Fortkamp, B.; Lercher, P.; van Kamp, I.; Genuit, K.; et al. Ten questions on the soundscapes of the built environment. Build. Environ. 2016, 108, 284–294. [Google Scholar] [CrossRef] [Green Version]
- Aletta, F.; Oberman, T.; Kang, J. Associations between positive health-related effects and soundscapes perceptual constructs: A systematic review. Int. J. Environ. Res. Public Health 2018, 15, 2392. [Google Scholar] [CrossRef] [PubMed] [Green Version]
- Gill, C.; Packer, J.; Ballantyne, R. Applying attention restoration theory to understand and address clergy’s need to restore cognitive capacity. J. Relig. Health 2018, 57, 1779–1792. [Google Scholar] [CrossRef]
- Krzywicka, P.; Byrka, K. Restorative qualities of and preference for natural and urban soundscapes. Front. Psychol. 2017, 8, 1705. [Google Scholar] [CrossRef] [Green Version]
- Zhang, Y.; Kang, J.; Kang, J. Effects of soundscape on the environmental restoration in urban natural environments. Noise Health 2017, 19, 65. [Google Scholar]
- Kaplan, S. A model of person-environment compatibility. Environ. Behav. 1983, 15, 311–332. [Google Scholar] [CrossRef]
- Hu, Z.; Lin, Y. Environmental Psychology, 3rd ed.; China Construction Industry Press: Beijing, China, 2012. [Google Scholar]
- Li, Y.; Cai, J.; Dong, Q.; Wu, L.; Chen, Q. Psychophysiological Responses of Young People to Soundscapes in Actual Rural and City Environments. J. Audio Eng. Soc. 2021, 68, 910–925. [Google Scholar] [CrossRef]
- Suko, Y.; Saito, K.; Takayama, N.; Sakuma, T.; Warisawa, S. Effect of faint road traffic noise mixed in birdsong on the perceived restorativeness and listeners’ physiological response: An exploratory study. Int. J. Environ. Res. Public Health 2019, 16, 4985. [Google Scholar] [CrossRef] [Green Version]
- Li, Z.; Ba, M.; Kang, J. Physiological indicators and subjective restorativeness with audio-visual interactions in urban soundscapes. Sustain. Cities Soc. 2021, 75, 103360. [Google Scholar] [CrossRef]
- Park, S.H.; Lee, P.J.; Jeong, J.H. Effects of noise sensitivity on psychophysiological responses to building noise. Build. Environ. 2018, 136, 302–311. [Google Scholar] [CrossRef]
- Trollé, A.; Marquis-Favre, C.; Klein, A. Short-term annoyance due to tramway noise: Determination of an acoustical indicator of annoyance via multilevel regression analysis. Acta Acust. United Acust. 2014, 100, 34–45. [Google Scholar] [CrossRef]
- Morrell, C.H.; Gordon-Salant, S.; Pearson, J.D.; Brant, L.J.; Fozard, J.L. Age-and gender-specific reference ranges for hearing level and longitudinal changes in hearing level. J. Acoust. Soc. Am. 1996, 100, 1949–1967. [Google Scholar] [CrossRef]
- Medvedev, O.; Shepherd, D.; Hautus, M.J. The restorative potential of soundscapes: A physiological investigation. Appl. Acoust. 2015, 96, 20–26. [Google Scholar] [CrossRef]
- Ishiyama, T.; Hashimoto, T. The impact of sound quality on annoyance caused by road traffic noise: An influence of frequency spectra on annoyance. JSAE Rev. 2000, 21, 225–230. [Google Scholar] [CrossRef]
- Chen, L.; Ying, Y.; Tang, Y.; Shi, Y. Analysis on Influence of Traffic Noise on Acoustic Environment of Residential Area. Guangdong Highw. Commun. 2019, 45, 189–192. [Google Scholar]
- Kang, J.; Zhang, M. Semantic differential analysis of the soundscape in urban open public spaces. Build. Environ. 2010, 45, 150–157. [Google Scholar] [CrossRef]
- Jo, H.; Jeon, J.Y. Perception of urban soundscape and landscape using different visual environment reproduction methods in virtual reality. Appl. Acoust. 2022, 186, 108498. [Google Scholar] [CrossRef]
- Leiper, A.; Davies, W.J.; Waddington, D.C. Using soundscape assessment tools to determine the impact of industrial noise in quiet areas. In Proceedings of the 13th ICBEN Congress on Noise as a Public Health Problem, ICBEN 2021, Stockholm, Sweden, 14–17 June 2021. [Google Scholar]
- Gao, Y.; Li, Y. Research on influence of residential area planning on acoustic environment of residential buildings. Build. Tech. Dev. 2014, 41, 56–59. [Google Scholar]
- Chen, Y.; Kang, J. Study on Soundscape Evaluation and Its Influencing Factors in High-rise Residential Areas. Build. Sci. 2020, 36, 152–157. [Google Scholar]


Publisher’s Note: MDPI stays neutral with regard to jurisdictional claims in published maps and institutional affiliations. |
© 2022 by the authors. Licensee MDPI, Basel, Switzerland. This article is an open access article distributed under the terms and conditions of the Creative Commons Attribution (CC BY) license (https://creativecommons.org/licenses/by/4.0/).