
Channeled PM10, PM2.5 and PM1 Emission Factors Associated with the Ceramic Process and Abatement Technologies

Abstract
:1. Introduction
- Diffuse emissions are those which pass to the atmosphere without being channeled. In the ceramic industry, they are mainly related to bulk material storage, handling, and transport. They can also occur in some operations such as milling, grinding, and trucking.
- Channeled emissions are those which pass to the atmosphere through a pipe. They can be divided into medium–high- and ambient-temperature emissions. The main measures proposed in the CER-BREF [9] to reduce this type of emissions are (1) primary measures: related to reducing the use of raw materials that could contain hazardous components; and (2) secondary measures: different abatement technologies are available as wet scrubber systems, Venturi type, fabric filters, and electrostatic precipitators.
2. Methodology
2.1. Physical Characterization of the PM Emitted
2.2. Chemical Characterization
2.3. Summary of Sampling Campaigns
3. Results
3.1. Physical Characterization of the PM Emissions
3.1.1. Determination of PSD and wx
3.1.2. Determination of EF
3.2. Chemical Composition of PM Emissions
4. Discussion
4.1. Physical Characterization of the Emitted PM
4.1.1. Determination of PSD and wx
4.1.2. Determination of EF
- In medium–high-temperature stages, concretely in the spray-drying and frits melting, the emission factors obtained differ by a factor of 10 in the case of frit melting and by a factor of 100 in the case of spray-drying, depending on the Best Available Technique (BAT) implemented. The lowest values correspond to the technological scenario corresponding to fabric filters.
- In those stages where the processed materials are similar, but the process temperature is significantly different, such as the milling and spray-drying stages, the average emission factors obtained were very similar when a fabric filter was used as an abatement technology (EFPM10: 2–3 mg/kg, EFPM2.5: 2 mg/kg, and EFPM1: 1 mg/kg).
- On the contrary, when the material processed is different and the process temperature is similar, such as the pressing and glazing stages, the emission factors obtained differ considerably (EFPM10: 8–48 mg/m2, EFPM2.5: 3–31 mg/m2, and EFPM1: 1–29 mg/m2).
4.2. Chemical Characterization of the PM Emissions
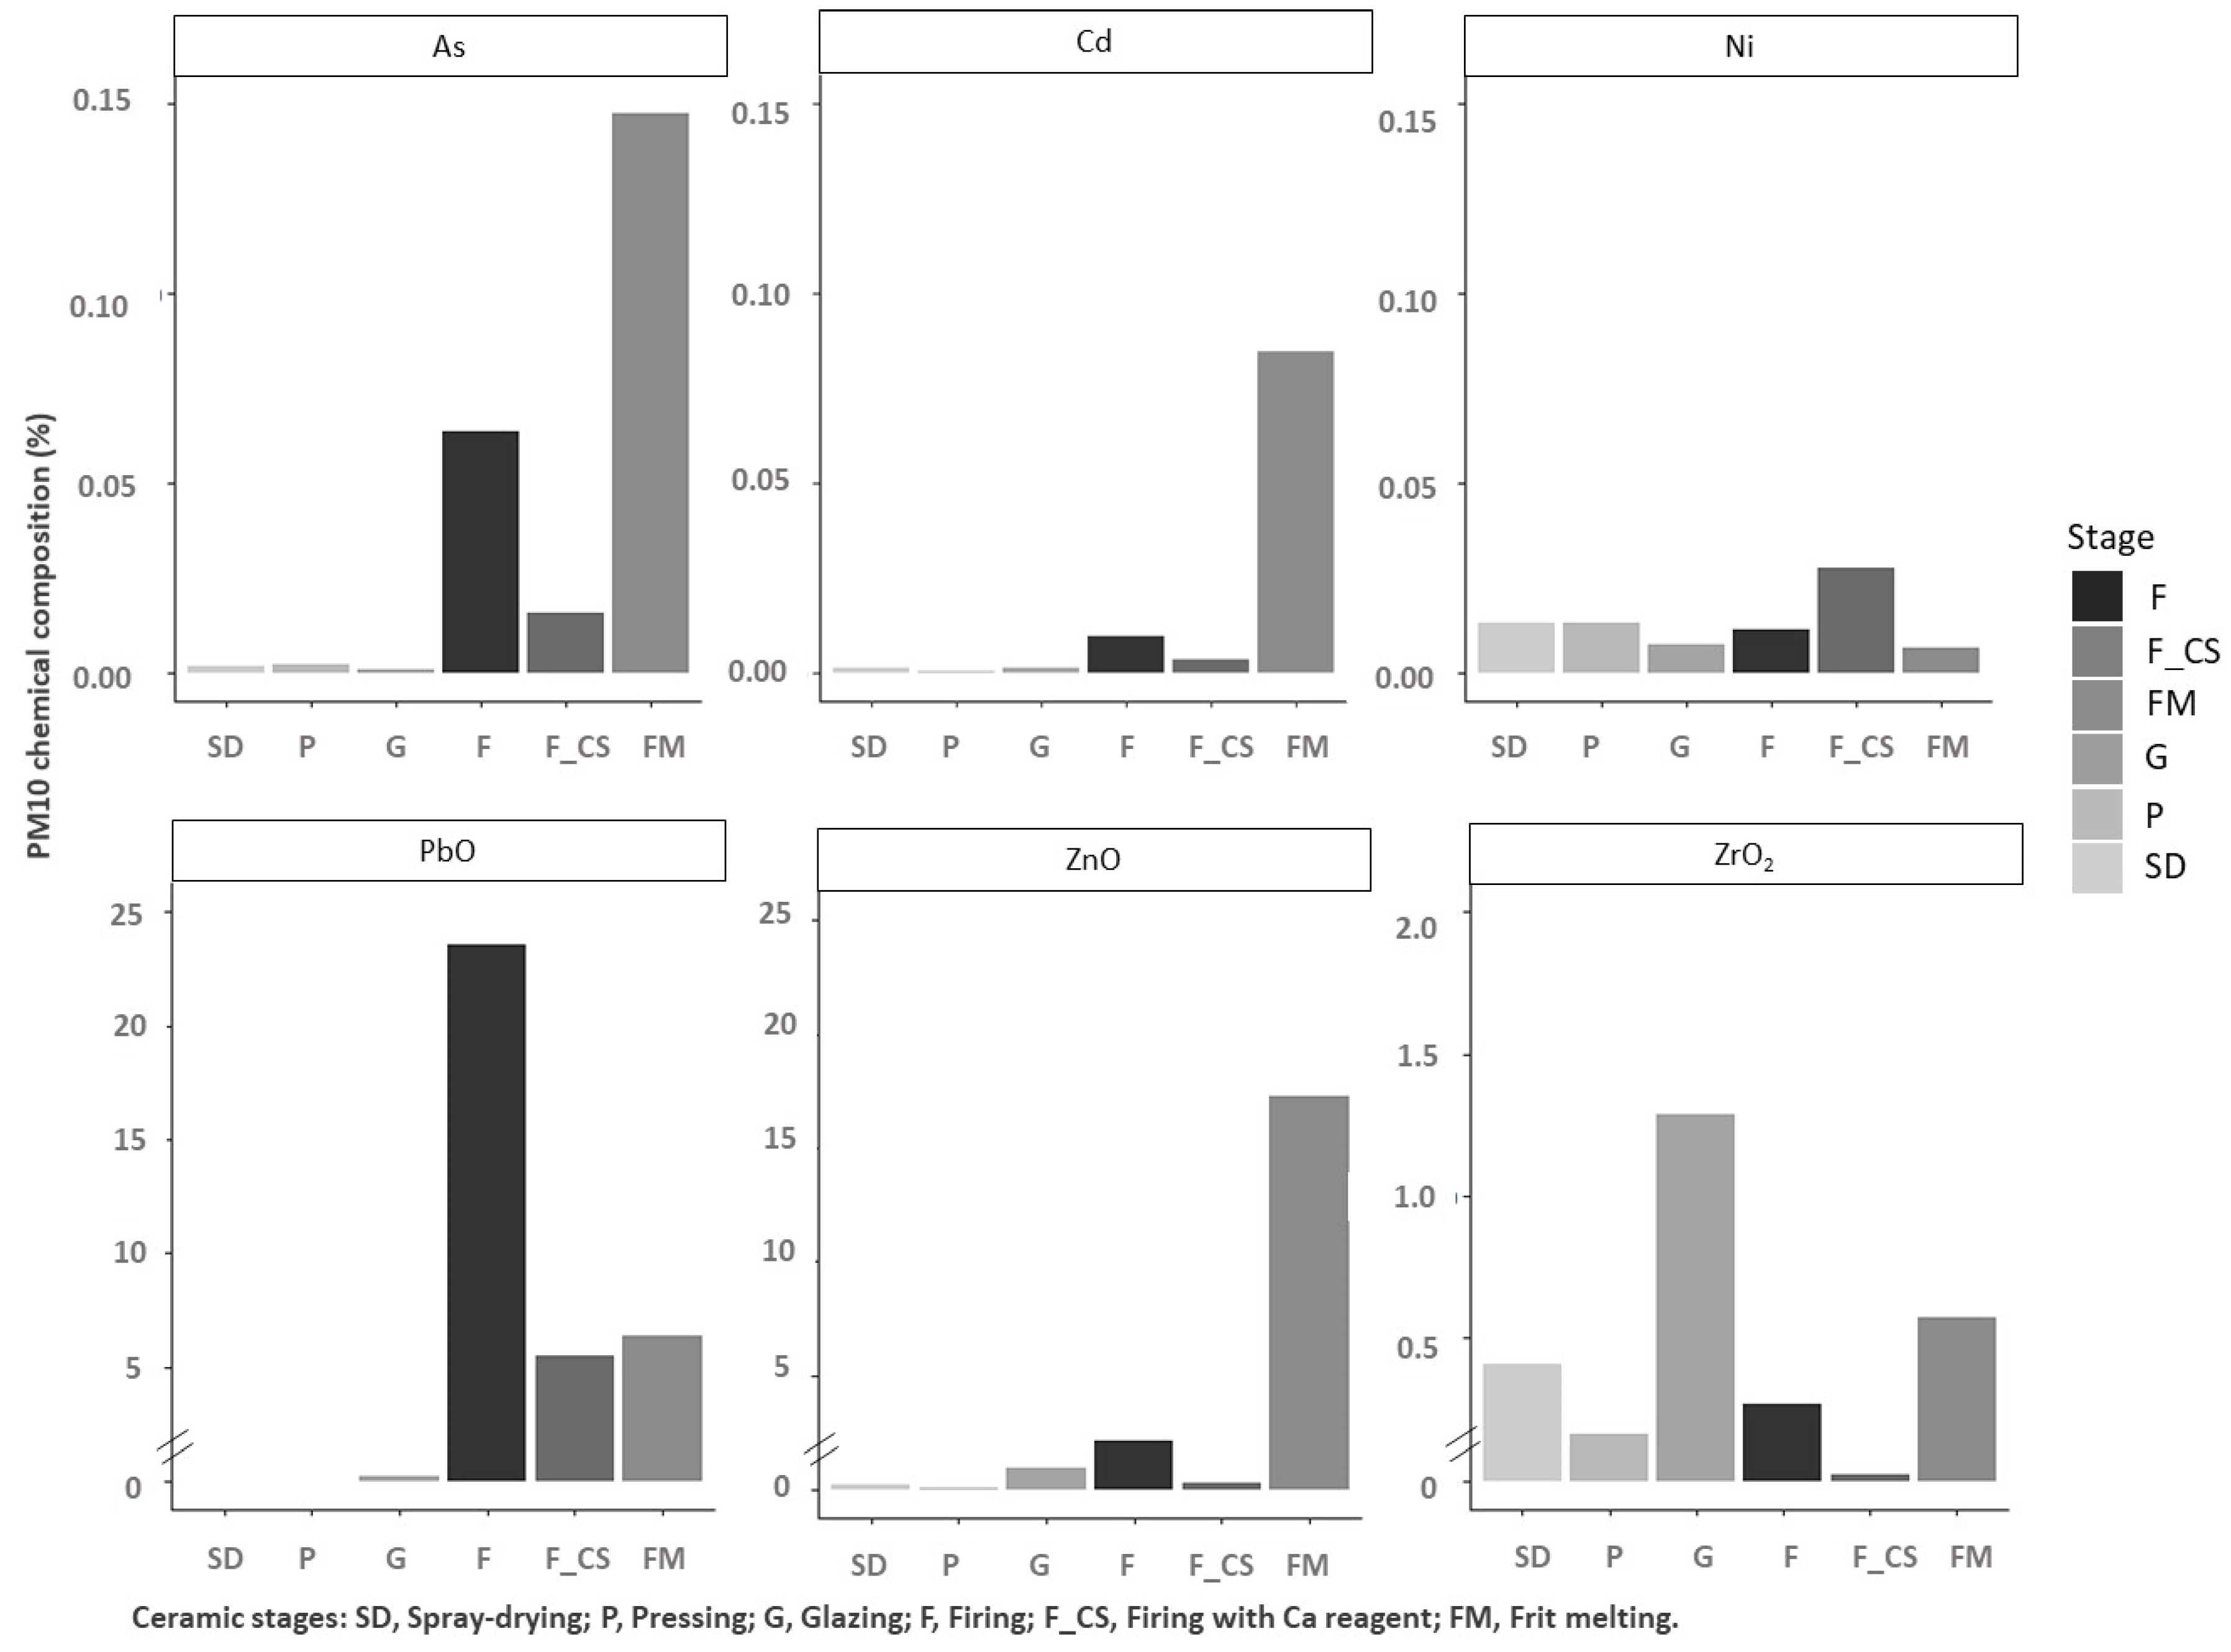
- In the spray-drying and pressing stages there was an important presence of ZrO2 and Ni, which can be attributed to the presence of these components in the raw materials and also in the ceramic sludges. It should be highlighted that the ceramic sludges, which are reused in the spray-drying stage, are generated during different cleaning operations (glaze preparation and glazing stage) and, therefore, they have a similar composition to the raw materials used in these last-mentioned processes.
- In the case of glazing, the concentration of ZrO2, which is mainly used to achieve opacity, is significant. Nevertheless, this composition can be very variable because it depends on the final aesthetic requirements of the ceramic tiles produced, and this compound is not present in all glaze compositions.
- Regarding the firing stage (emissions before the abatement system), the presence of PbO, As, and Zn compounds was associated with the raw materials used in body and glaze composition.
- Finally, in the case of the melting stage for frits manufacturing, the presence of Zn, PbO, Cd, and As compounds was linked to raw material compositions. Nevertheless, it should be highlighted that the use of cadmium and lead in the frits composition has been very limited in the last years, and, therefore, presumably the presence of these elements in the emissions should have been reduced in the same way.
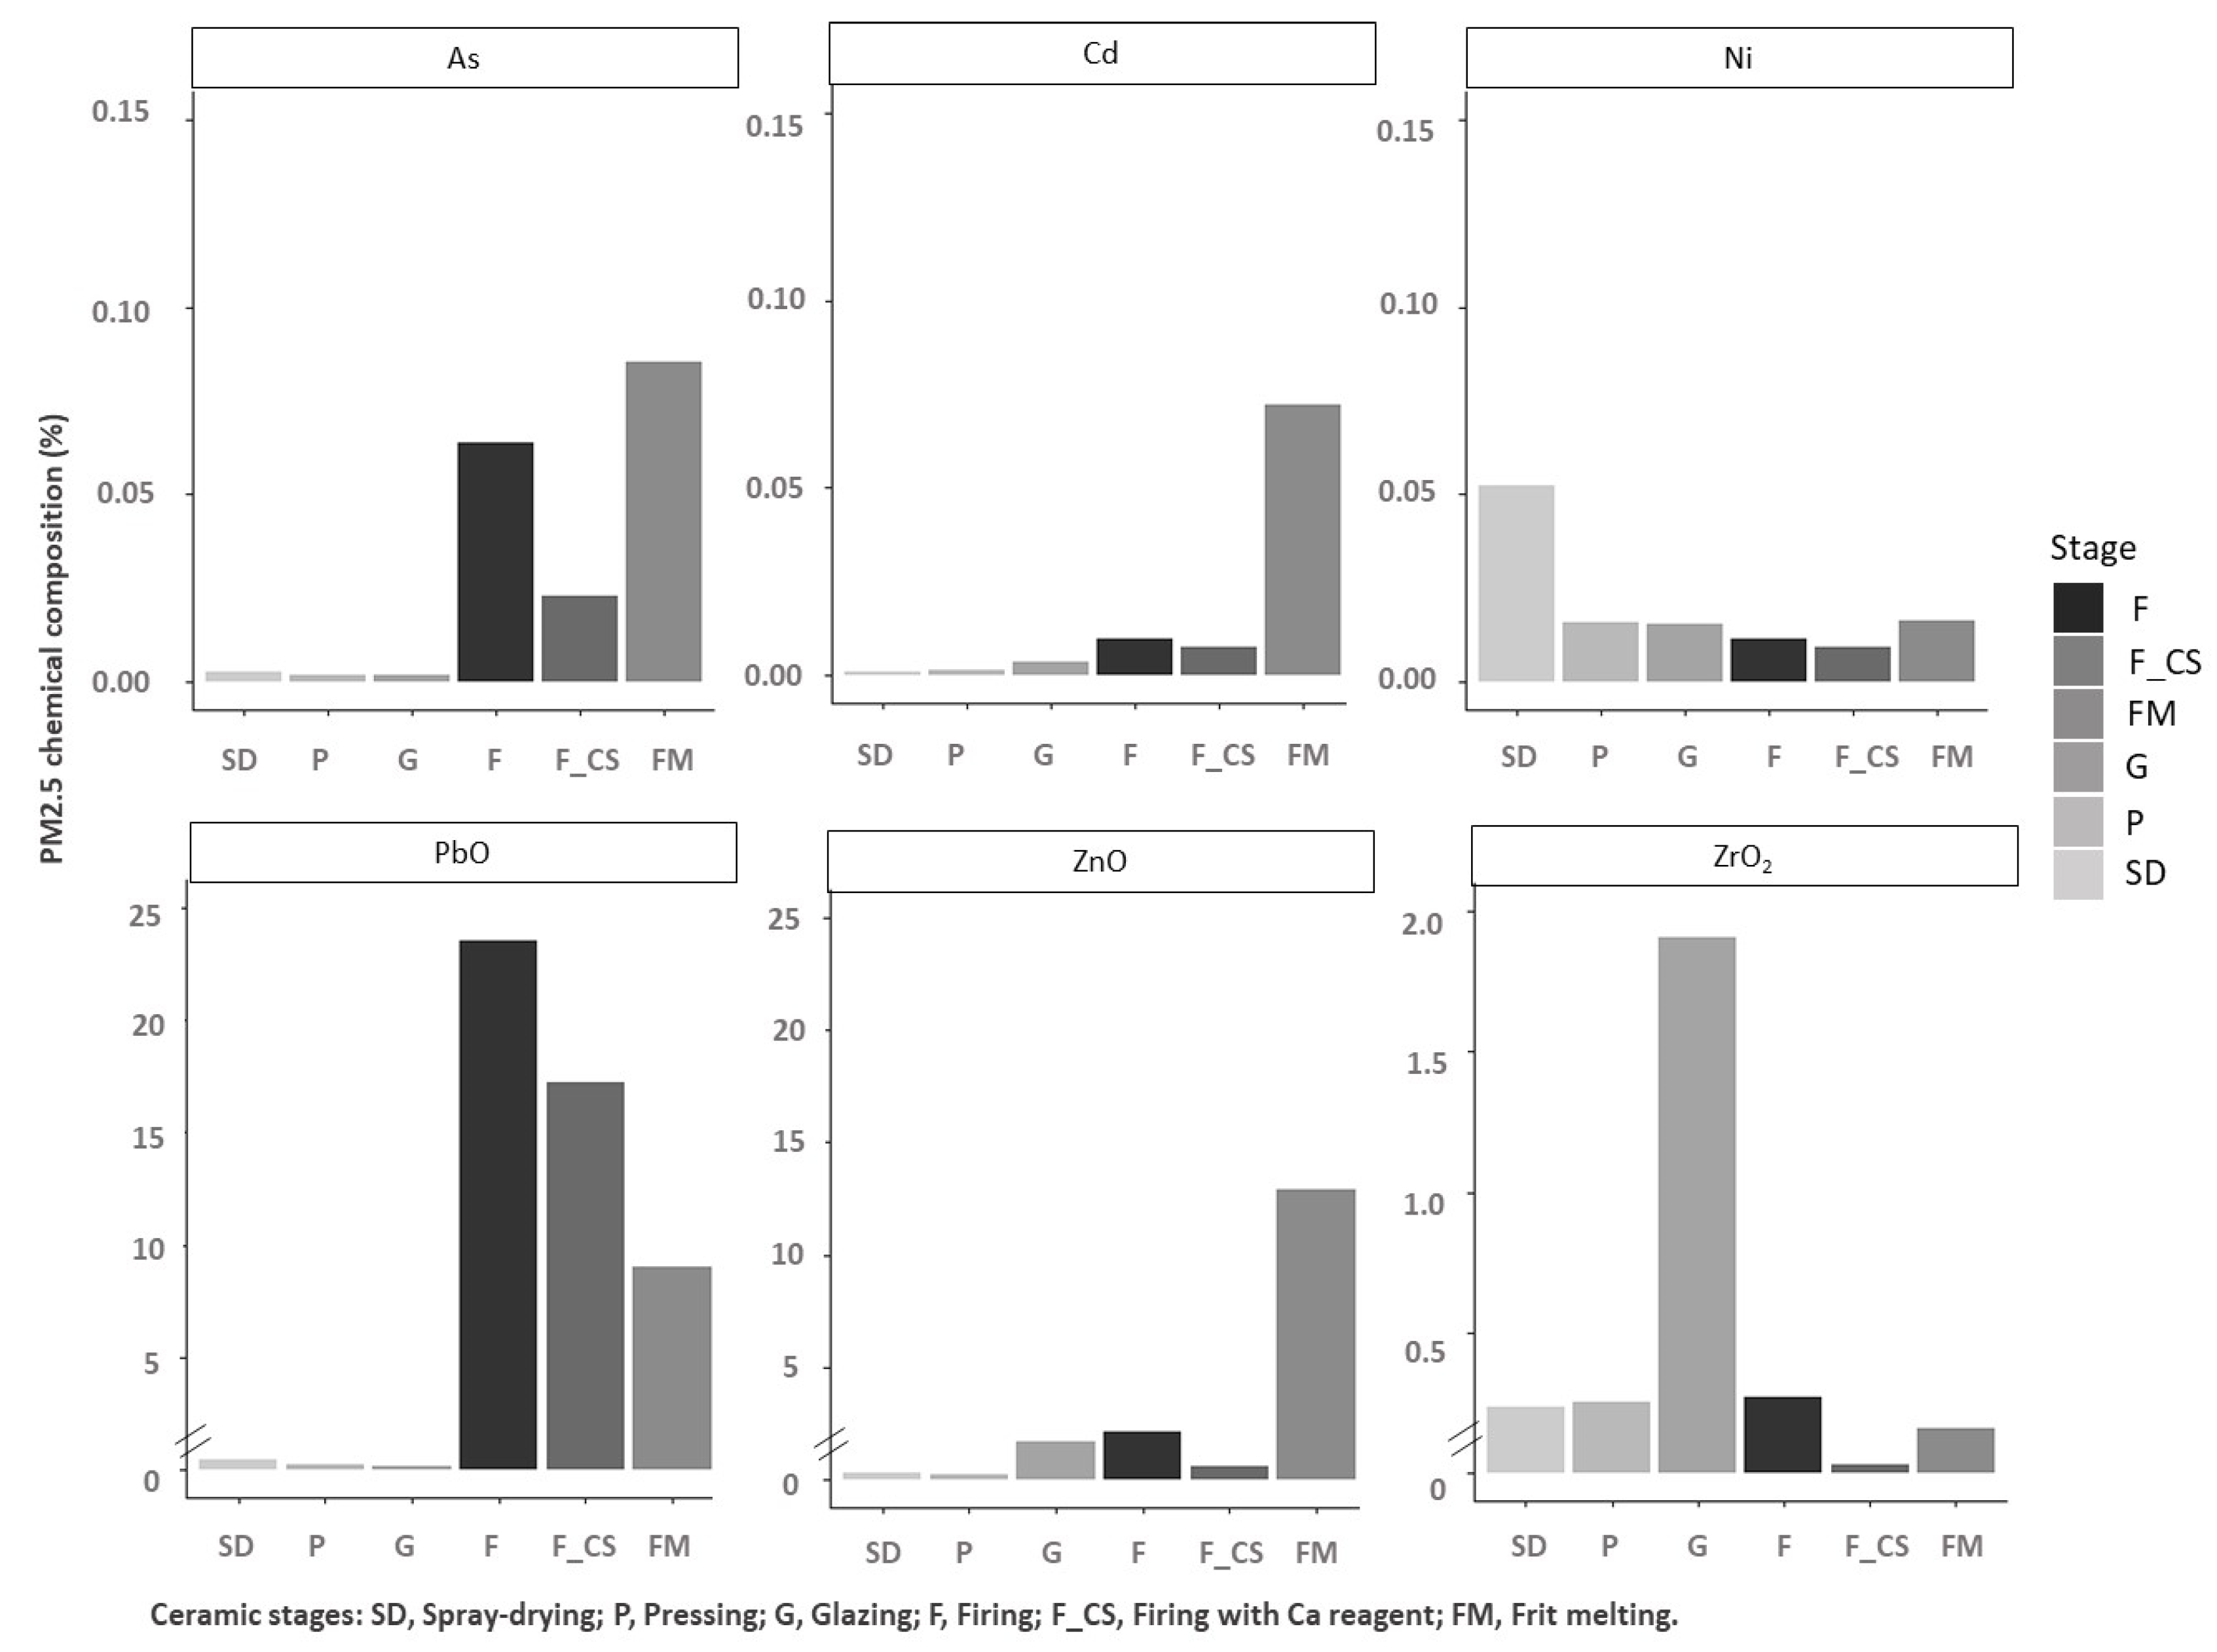
- For example, in the spray-drying stage, there is an enrichment in Ni in the PM2.5 fraction. The presence of this element is associated with the use of ceramic pigments whose granulometry is usually very fine.
- Regarding the emission mechanism, the fluxing nature of lead compounds means that this is present mostly by volatilization from the melt; hence, an enrichment of this component is observed in the finest fraction, specifically in the frit melting and firing stages after the cleaning system.
- In the melting stage of ceramic frits, both As, a trace element associated with the natural raw materials that introduce boron into the composition of ceramic frits, and ZrO2, a raw material for frits and atomized granules, are enriched in the PM10 fraction, probably because the emission mechanism in both cases is mechanical in nature.
5. Conclusions
5.1. Physical Characterization
5.1.1. Assessment of Methodology Used to Determine wx and PSD
- The cascade impactor is suitable for determining and studying both the PSD and the w10, w2.5, and w1 fractions. The use of the impactor is not recommended due to the uncertainty that may be associated with the filters weighted.
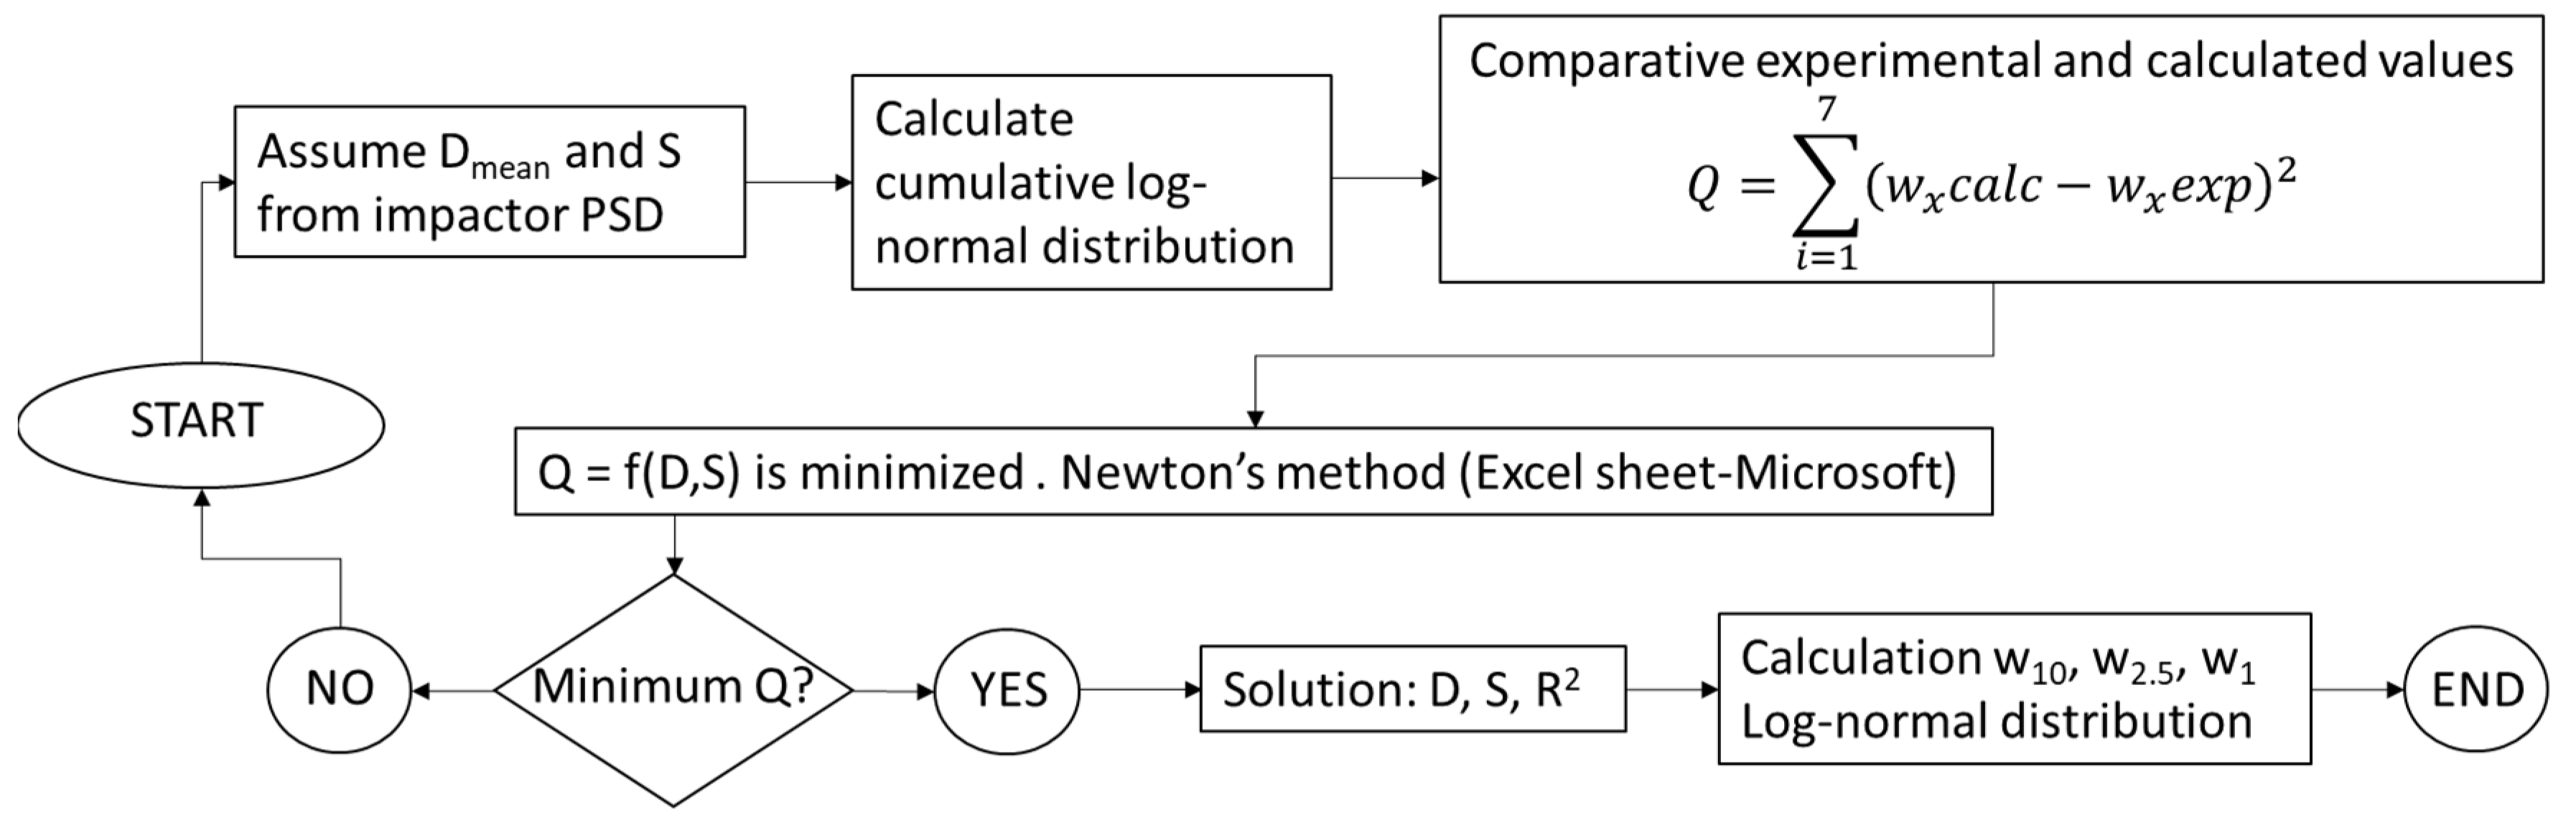
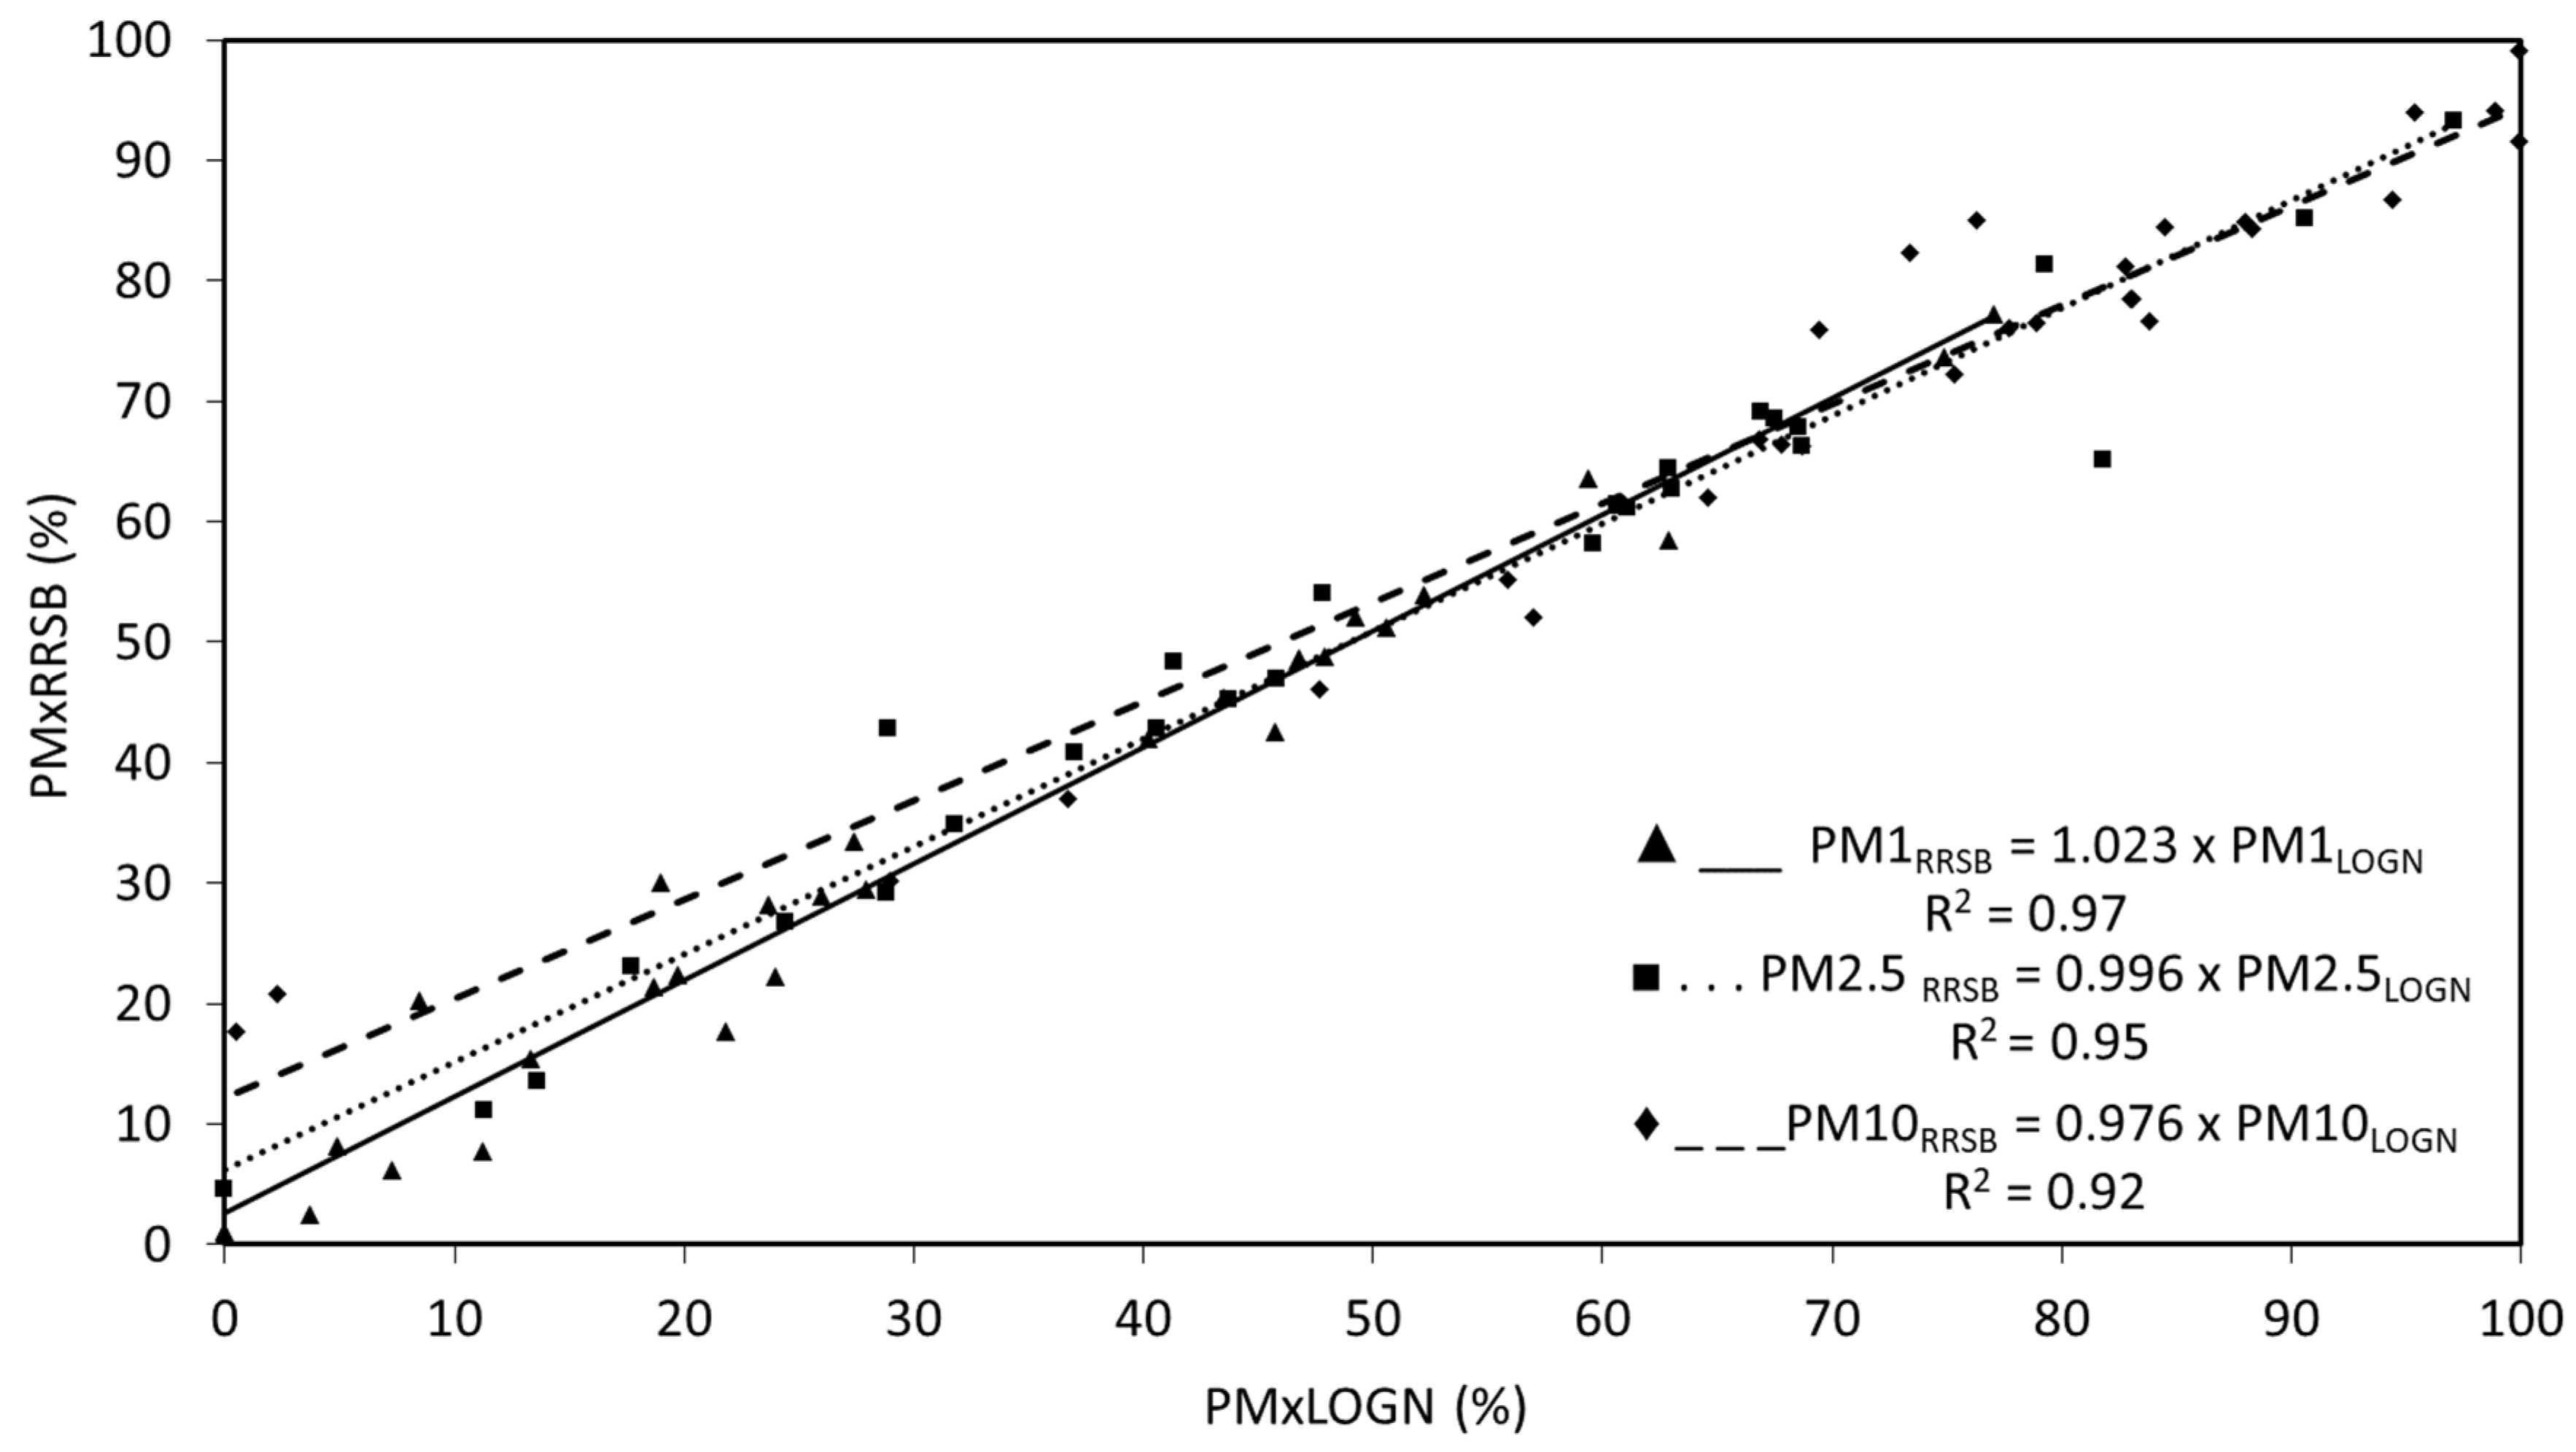
- The two mathematical processing methods of the PSD data (log-normal distribution and Rosin–Rammler–Sperling–Bennet) exhibit similar results for the determination of the w10, w2.5, and w1 fractions. The log-normal adjustments with R2 greater than 0.90 were obtained.
5.1.2. Determination of PSD and wx
- The PSDs obtained are relatively wide, due to the different mechanisms of origin of the particulate matter, mechanical, and/or volatilization–condensation.
- The average values obtained for w10 and w2.5 after fabric filters, operated at high performance, are in the range of 75–85% and 30–60%, respectively. In the case of the fine fractions, the wide range is due to the influence not only of the cleaning system but also of the nature of the processed material.
5.1.3. Determination of the EF
- The highest efficiency, for the ceramic stages studied, is reached when fabric filters are applied.
- In those cases where the materials processed are similar, such as the milling and spray-drying stages, the process temperature does not significantly affect the EFs obtained.
5.2. Chemical Characterization of the PM Emissions
- The use of the pilot-scale emission simulator made it possible to significantly reduce the sampling times and consequently to obtain a large amount of samples of the different granulometric fractions, which allowed a complete chemical characterization.
- The chemical analysis showed that ZrO2, ZnO, BaO, PbO, B2O3, Hf, Cr, Cu, Cd, and Sn were the main components in the emissions related to ambient-temperature processes (spray-drying, pressing, and glazing) while SiO2, Al2O3, CaO, MgO, Na2O, K2O, BaO, ZnO, PbO, S, Tl, As, Cr, Rb, Cs, Cu, and Sr were the main components of the medium–high-temperature processes emissions (firing and frits melting).
- The emission mechanism (mechanical and/or volatilization–condensation) and the particle size of the source material are the parameters that most influence the potential segregation of the components and elements evaluated (As, Cd, Ni, PbO, ZnO, and ZrO2) in the PM10 and PM2.5 fractions.
6. Future Research Lines
- To develop an emission simulator in order to modify the temperature of the stream and the introduction of gases, and thus study the effect of the temperature and the composition of the gas stream on the characteristics of the particulate matter.
- To use more complete particle size distribution determination systems, even complementing several systems simultaneously, which allow us to obtain information in a wider range of particle sizes. In this sense, it would be especially interesting to address the study of the submicron and ultrafine fractions in emissions from high-temperature processes, both in concentrations and their variation and possible correlation with emission mechanisms and scrubbing systems. These fractions are of increasing environmental interest, and therefore receive greater legislative attention due to their possible effects on health.
- It would be extremely interesting to initiate a line in collaboration with analytical chemists to clarify some aspects that could not be determined in this work, such as the detailed study of the behavior of some elements and their compounds, in particular of the most volatile elements, such as boron, lead, arsenic, thallium, etc., in processes and emissions at higher temperatures, in order to deepen the knowledge of the volatilization–condensation mechanisms and minimize possible emissions. To this end, it is necessary to develop methodologies that integrate equipment allowing for the characterization of very small samples.
- To carry out a specific study of high-temperature process steps in order to determine the influence of raw material composition, process variables, scrubbing systems, etc., on the characteristics of particulate matter emissions.
- To complement the results of this study with air quality studies in the area, for which it is necessary to determine the behavior of particulate matter and gases emitted by different sources in the atmospheric environment, studying the mechanisms of interaction between different primary and secondary pollutants.
Supplementary Materials
Author Contributions
Funding
Institutional Review Board Statement
Informed Consent Statement
Acknowledgments
Conflicts of Interest
References
- World Health Organization. WHO Global Air Quality Guidelines: Particulate Matter (PM2.5 and PM10), Ozone, Nitrogen Dioxide, Sulfur Dioxide and Carbon Monoxide; Licence: CC BY-NC-SA 3.0 IGO. 2021. Available online: https://apps.who.int/iris/handle/10665/345329 (accessed on 28 May 2020).
- EPA. Particle Pollution and Your Patients’ Health. 2021. Available online: https://www.epa.gov/pmcourse/particle-pollution-exposure (accessed on 4 July 2022).
- Dockery, D.W.; Pope, C.A.; Xu, X.; Spengler, J.D.; Ware, J.H.; Fay, M.E.; Ferris, B.G., Jr.; Speizer, F.E. An association between air pollution and mortality in six US cities. N. Engl. J. Med. 1993, 329, 1753–1759. [Google Scholar] [CrossRef] [Green Version]
- Abbey, D.E.; Nishino, N.; McDonnell, W.F.; Burchette, R.J.; Knutsen, S.F.; Lawrence Beeson, W.; Yang, J.X. Long-term inhalable particles and other air pollutants related to mortality in nonsmokers. Am. J. Respir. Crit. Care Med. 1999, 159, 373–382. [Google Scholar] [CrossRef] [PubMed] [Green Version]
- Hoek, G.; Brunekreef, B.; Goldbohm, S.; Fischer, P.; van den Brandt, P.A. Association between mortality and indicators of traffic-related air pollution in the Netherlands: A cohort study. Lancet 2002, 360, 1203–1209. [Google Scholar] [CrossRef] [Green Version]
- Pope, C.A., III; Burnett, R.T.; Thun, M.J.; Calle, E.E.; Krewski, D.; Ito, K.; Thurston, G.D. Lung cancer, cardiopulmonary mortality, and long-term exposure to fine particulate air pollution. JAMA 2002, 287, 1132–1141. [Google Scholar] [CrossRef] [PubMed] [Green Version]
- Karagulian, F.; Belis, C.A.; Dora, C.F.C.; Prüss-Ustün, A.M.; Bonjour, S.; Adair-Rohani, H.; Amann, M. Contributions to cities’ ambient particulate matter (PM): A systematic review of local source contributions at global level. Atmos. Environ. 2015, 120, 475–483. [Google Scholar] [CrossRef]
- Mallol, G.; Monfort, E.; Busani, G.; Lezaun, J. Depuración de los Gases de Combustión de la Industria Cerámica. Guía Técnica, 2nd ed.; AICE, Ed.; Instituto de Tecnología Cerámica: Castellón, Spain, 2001; ISBN 84-923176-5-5. [Google Scholar]
- Reference Document on Best Available Techniques in the Ceramic Manufacturing Industry. Available online: https://eippcb.jrc.ec.europa.eu/reference/BREF/cer_bref_0807.pdf (accessed on 28 May 2020).
- Reference Document on Best Available Techniques for the Ferrous Metals Processing Industry. Available online: https://eippcb.jrc.ec.europa.eu/sites/default/files/2019-11/FMP_D1_web.pdf (accessed on 28 May 2020).
- Reference Document on Best Available Techniques for Large Combustion Plants. Available online: https://eippcb.jrc.ec.europa.eu/sites/default/files/2019-11/JRC_107769_LCPBref_2017.pdf (accessed on 28 May 2020).
- Reference Document on Best Available Techniques for the Manufacture of Glass. Available online: https://eippcb.jrc.ec.europa.eu/sites/default/files/2019-11/GLS_Adopted_03_2012_0.pdf (accessed on 28 May 2020).
- Reference Document on Best Available Techniques for the Non-Ferrous Metals Industries. Available online: https://eippcb.jrc.ec.europa.eu/sites/default/files/2020-01/JRC107041_NFM_bref2017.pdf (accessed on 28 May 2020).
- Reference Document on Best Available Techniques for the Production of Cement, Lime and Magnesium Oxide. Available online: https://eippcb.jrc.ec.europa.eu/sites/default/files/2019-11/CLM_Published_def_0.pdf (accessed on 28 May 2020).
- Reference Document on Best Available Techniques for Waste Incineration. Available online: https://eippcb.jrc.ec.europa.eu/sites/default/files/2020-01/JRC118637_WI_Bref_2019_published_0.pdf (accessed on 28 May 2020).
- Reference Document on Best Available Techniques for the Production of Wood-based Panels. Available online: https://eippcb.jrc.ec.europa.eu/sites/default/files/2019-11/WBPbref2016_0.pdf (accessed on 28 May 2020).
- Best Available Techniques (BAT) Reference Document for Common Waste Gas Management and Treatment Systems in the Chemical Sector. Available online: https://eippcb.jrc.ec.europa.eu/sites/default/files/2022-03/WGC_Final_Draft_09Mar2022-B-W-Watermark.pdf (accessed on 7 April 2022).
- EPER (The European Pollutant Emission Register). Available online: http://www.prtr-es.es (accessed on 29 September 2021).
- Querol, X.; Alastuey, A.; Rodriguez, S.; Plana, F.; Mantilla, E.; Ruiz, C.R. Monitoring of PM10 and PM2. 5 around primary particulate anthropogenic emission sources. Atmos. Environ. 2001, 35, 845–858. [Google Scholar] [CrossRef]
- Querol, X. Bases Científico-Técnicas para un Plan Nacional de Mejora de la Calidad del Aire (No. 504 507); Editorial CSIC: Madrid, Spain, 2012. [Google Scholar]
- Vicente, A.B.; Sanfeliu, T.; Jordan, M.M. Assessment of PM10 pollution episodes in a ceramic cluster (NE Spain): Proposal of a new quality index for PM10, As, Cd, Ni and Pb. J. Environ. Manag. 2012, 108, 92–101. [Google Scholar] [CrossRef] [Green Version]
- Minguillón, M.C.; Monfort, E.; Escrig, A.; Celades, I.; Cuerra, L.; Busani, G.; Sterni, A.; Querol, X. Air quality comparison between two European ceramic tile clusters. Atmos. Environ. 2013, 74, 311–319. [Google Scholar] [CrossRef] [Green Version]
- Minguillón, M.C.; Monfort, E.; Querol, X.; Alastuey, A.; Celades, I.; Miró, J.V. Effect of ceramic industrial particulate emission control on key components of ambient PM10. J. Environ. Manag. 2009, 90, 2558–2567. [Google Scholar] [CrossRef]
- Querol, X.; Viana, M.; Alastuey, A.; Amato, F.; Moreno, T.; Castillo, S.; Pey, J.; de la Rosa, J.; Sánchez de la Campa, A.; Artíñano, B.; et al. Source origin of trace elements in PM from regional background, urban and industrial sites of Spain. Atmos. Environ. 2007, 41, 7219–7231. [Google Scholar] [CrossRef]
- EMEP/EEA Air Pollutant Emission Inventory Guidebook 2019; Technical Guidance to Prepare National Emission Inventories; EEA Report No 13/2019; EMEP/EEA: Copenhagen, Denmark, 2019.
- US EPA. Ceramic Products Manufacturing. 1995. Available online: https://www.epa.gov/air-emissions-factors-and-quantification/ap-42-compilation-air-emissions-factors#5thed (accessed on 29 September 2021).
- Particulate Emission Testing for Florida Tile Corporation, Lawrenceburg, Kentucky, 7–8 March 1989; Air Systems Testing, Inc.: Marietta, GA, USA, 1989.
- Particulate Emission Testing for Florida Tile Corporation, Lawrenceburg, Kentucky, 19 April 1989; Air Systems Testing, Inc.: Marietta, GA, USA, 1989.
- Metropolitan Ceramics, Canton, Ohio, Tunnel Kiln #3 Exhaust Stack, Particulate, SO2, NOx, Hydrofluoric Acid Emission Evaluation, Conducted—17–18 November 1993; Envisage Environmental Incorporated: Richfield, OH, USA, 1993.
- Metropolitan Ceramics, Inc., Canton, Ohio, TK1, TK2, TK3 Exhausts, Particulate, Sulfur Dioxides, & Fluorides Emission Evaluation, Conducted—30 March–14 April 1994; Metropolitan Ceramics, Inc.: Canton, OH, USA, 1994.
- Envisage Environmental Incorporated, Richfield, OH, May 9, 1994. 11Source Evaluation Results, U.S. Ceramic Tile Company, East Sparta, Ohio, 11 August 1993; Envisage Environmental Incorporated: Richfield, OH, USA, 1993.
- Particulate Emissions Test for American Olean Tile Company, Fayette, AL, Crushing and Screening Line #1, 15 October 1991; Pensacola POC, Inc.: Pensacola, FL, USA, 1991.
- Particulate Emissions Test for American Olean Tile Company, Fayette, AL, Crushing and Screening Line #2, 16 October 1991; Pensacola POC, Inc.: Pensacola, FL, USA, 1991.
- Exhaust Emission Sampling for Norton Company, Soddy-Daisy, TN, 19–20 April 1994; Armstrong Environmental, Inc.: Dallas, TX, USA, 1994.
- Particulate Emission Evaluation for Steward, Inc., Chattanooga, TN, 30 March 1993; FBT Engineering and Environmental Services: Chattanooga, TN, USA, 1993.
- Report to American Standard on Stack Particulate Samples Collected at Tiffin, OH (Test Date 18 August 1992); Affiliated Environmental Services, Inc.: Sandusky, OH, USA, 1992.
- Report to American Standard on Stack Particulate Samples Collected at Tiffin, OH (Test Date 19 August 1992); Affiliated Environmental Services, Inc.: Sandusky, OH, USA, 1992.
- Report to American Standard on Stack Particulate Samples Collected at Tiffin, OH (Test Date 8 February 1994); Affiliated Environmental Services, Inc.: Sandusky, OH, USA, 1994.
- Emission Test Report—Plant A, Roller Kiln, May 1994; Document No. 4602-01-02; Confidential Business Information Files; Contract No 68-D2-0159; Assignment No. 2-01; U.S. Environmental Protection Agency: Research Triangle Park, NC, USA, 1995.
- Emission Test Report (Excerpts)—Plant A, Roller Kiln, February 1992; Document No. 4602-01-02; Confidential Business Information Files; Contract No 68-D2-0159; Assignment No. 2-01; U.S. Environmental Protection Agency: Research Triangle Park, NC, USA, 1995.
- Emission Test Report—Plant A, Spray Dryer, October 1994; Document No. 4602-01-02; Confidential Business Information Files; Contract No 68-D2-0159; Assignment No. 2-01; U.S. Environmental Protection Agency: Research Triangle Park, NC, USA, 1995.
- Emission Test Report (Excerpts)—Plant A, Spray Dryer, April 1994; Document No. 4602-01-02; Confidential Business Information Files; Contract No 68-D2-0159; Assignment No. 2-01; U.S. Environmental Protection Agency: Research Triangle Park, NC, USA, 1995.
- Emission Test Report (Excerpts)—Plant A, Spray Dryer, January 1993; Document No. 4602-01-02; Confidential Business Information Files; Contract No 68-D2-0159; Assignment No. 2-01; U.S. Environmental Protection Agency: Research Triangle Park, NC, USA, 1995.
- Emission Test Report (Excerpts)—Plant A, Spray Dryer, February 1992; Document No. 4602-01-02; Confidential Business Information Files; Contract No 68-D2-0159; Assignment No. 2-01; U.S. Environmental Protection Agency: Research Triangle Park, NC, USA, 1995.
- Lead and Particulate Emissions Testing, Spray Booth 2A Stack; Stationary Source Sampling Report Reference No. 6445; Entropy Environmentalists, Inc.: Research Triangle Park, NC, USA, 1989.
- Palmonari, C.; Timellini, G. Pollutant emission factors for the ceramic floor and wall tile industry. J. Air Pollut. Control. Assoc. 1982, 32, 1095–1100. [Google Scholar] [CrossRef]
- Ehrlich, C.; Noll, G.; Kalkoff, W.-D.; Baumbach, G.; Dreiseidler, A. PM10, PM2. 5 and PM1. 0—Emissions from industrial plants—results from measurement programmes in Germany. Atmos. Environ. 2007, 41, 6236–6254. [Google Scholar] [CrossRef]
- Ehrlich, C.; Noll, G.; Wusterhausen, E.; Kalkoff, W.D.; Remus, R.; Lehmann, C. Respirable Crystalline Silica (RCS) emissions from industrial plants–Results from measurement programmes in Germany. Atmos. Environ. 2013, 68, 278–285. [Google Scholar] [CrossRef]
- Antonsson, E.; Cordes, J.; Stoffels, B.; Wildanger, D. The European Standard Reference Method systematically underestimates particulate matter in stack emissions. Atmos. Environ. 2021, 12, 100133. [Google Scholar] [CrossRef]
- Wada, M.; Tsukada, M.; Namiki, N.; Szymanski, W.W.; Noda, N.; Makino, H.; Kanaoka, C.; Kamiya, H. A two-stage virtual impactor for in-stack sampling of PM2. 5 and PM10 in flue gas of stationary sources. Aerosol. Air Qual. Res. 2016, 16, 36–45. [Google Scholar] [CrossRef] [Green Version]
- John, A.C.; Kuhlbusch, T.A.J.; Fissan, H.; Bröker, G.; Geueke, J. Development of a PM 10/PM 2.5 cascade impactor and in-stack measurements. Aerosol. Sci. Technol. 2003, 37, 694–702. [Google Scholar] [CrossRef]
- Sánchez de la Campa, A.M.; Moreno, T.; de la Rosa, J.; Alastuey, A.; Querol, X. Size distribution and chemical composition of metalliferous stack emissions in the San Roque petroleum refinery complex, southern Spain. J. Hazard. Mater. 2011, 190, 713–722. [Google Scholar] [CrossRef] [Green Version]
- González-Castanedo, Y.; Moreno, T.; Fernández-Camacho, R.; Sánchez de la Campa, A.M.; Alastuey, A.; Querol, X.; de la Rosa, J. Size distribution and chemical composition of particulate matter stack emissions in and around a copper smelter. Atmos. Environ. 2014, 98, 271–282. [Google Scholar] [CrossRef]
- Gupta, R.K.; Majumdar, D.; Trivedi, J.V.; Bhanarkar, A.D. Particulate matter and elemental emissions from a cement kiln. Fuel Processing Technol. 2012, 104, 343–351. [Google Scholar] [CrossRef]
- Akinshipe, O.; Kornelius, G. Quantification of atmospheric emissions and energy metrics from simulated clamp kiln technology in the clay brick industry. Environ. Pollut. 2018, 236, 580–590. [Google Scholar] [CrossRef] [Green Version]
- ASCER. Available online: https://www.ascer.es/sectorDatos.aspx?lang=es-ES (accessed on 29 September 2021).
- ANFFEC. Available online: https://www.anffecc.com/es/cifras-del-sector (accessed on 29 September 2021).
- Cerámica de Castellón, Zona; Plan de Mejora de la Calidad del Aire de la Zona ES 1003; Mihares-Penaygolosa (A. Costera) y Aglomeración ES 1015; Conselleria de Medi Ambient, Aigua, Urbanisme i Habitatge: Castelló, Spain, 2008.
- Monfort, E.; Sanfelix, V.; Minguillón, M.C.; Celades, I. Mitigation Strategies: Castellón, Spain; Future Science Ltd.: London, UK, 2013; pp. 150–160. [Google Scholar]
- ISO 9096:2003; Stationary Sources Emissions—Manual Determination of Mass Concetration of Particulatte Matter. International Organization for Standardization: Geneva, Switzerland, 2003.
- ISO 12141:2002; Stationary Source Emissions—Determination of Mass Concentration of Particulate Matter (Dust) at Low Concentrations—Manual Gravimetric Method. International Organization for Standardization: Geneva, Switzerland, 2002.
- Monfort, E.; Gazzula, M.F.; Celades, I.; Gómez, P. Critical factors in measuring solid particulate emissions in the ceramics industry. Ceram. Forum Int. Ber. DKG 2001, 78, E40–E44. [Google Scholar]
- Monfort, E.; Celades, I.; Mestre, S.; Sanz, V.; Querol, X. PMX data processing in ceramic tile manufacturing emissions. In Key Engineering Materials; Trans Tech Publications Ltd.: Bäch, Switzerland, 2004; Volume 264, pp. 2453–2456. [Google Scholar]
- Pilat, M.J. Operations Manual Pilat (University of Washington) Mark 3 and Mark 5 Source Test Cascade Impactor; University of Washington: Seattle, WA, USA, 1998. [Google Scholar]
- VDI 2066 Blatt 10:2004; Particulatte Matter Meassurement. Dust Meassurement in Flowing Gases. Measurement of PM10 and PM2.5 Emissions at Stationary Sources by Impaction Method. VDI/DIN-Kommission Reinhaltung der Luft (KRdL)—Normenausschuss: Düsseldorf, Germany, 2004.
- Batel, W. Schaubildliche Darstellung und Kennzeichnung von Korngrößenverteilungen. In Einführung in die Korngrößenmeßtechnik; Springer: Berlin/Heidelberg, Germany, 1964; pp. 4–27. ISBN 978-3-642-53251-1. [Google Scholar]
- EN ISO/IEC 17043:2010; Conformity Assessment—General Requirements for Proficiency Testing. European Standard: Pilsen, Czech Republic, 2010.
- EN 13284-1:2018; Stationary Source Emissions—Determination of Low Range Mass Concentration of Dust—Part 1: Manual Gravimetric Method. European Standard: Pilsen, Czech Republic, 2017.
- EN ISO 23210:2010; Stationary Source Emissions—Determination of PM10/PM2,5 Mass Concentration in Flue Gas—Measurement at Low Concentrations by Use of Impactors (ISO 23210:2009). ISO: Geneva, Switzerland, 2009.
- EPA Method 201; Emission Determination of PM10 Emissions. Exhaust Gas Recycle Procedure. U.S. Environmental Protection Agency: Washington, DC, USA, 2017.
- Querol, X.; Minguillón, M.C.; Alastuey, A.; Monfort, E.; Mantilla, E.; Sanz, M.J.; Sanz, F.; Roig, A.; Renau, A.; Felis, C.; et al. Impact of the implementation of PM abatement technology on the ambient air levels of metals in a highly industrialised area. Atmos. Environ. 2007, 41, 1026–1040. [Google Scholar] [CrossRef]
- IS K 0302; Measuring Method for Particle—Size Distribution of Dust in Flue Gas. Japanese Industrial Standards Committee: Tokyo, Japan, 1989.
- Hinds, W.C. Aerosol Technology: Properties, Behaviour, and Measurement of Airborne Particles, 2nd ed.; John Wiley & Sons: Hoboken, NJ, USA, 1999. [Google Scholar]
- Vincent, J.H. Aerosol Sampling: Science, Standards, Instrumentation and Applications; John Wiley & Sons: Hoboken, NJ, USA, 2007. [Google Scholar]


| Process | Stage | Emission | Flow | Type | Pollutant |
|---|---|---|---|---|---|
| Tiles | Storage and handling of raw materials | Variable | Continuous | Diffuse | PM |
| Milling (dry) | Variable | Continuous/Discontinuous | Ambient channeled | PM | |
| Milling (wet) | |||||
| Spray-dried | Constant | Continuous | 1 Hot channeled | PM and gases | |
| Pressing | Variable | Continuous | Ambient channeled | PM | |
| Dry | Constant | Continuous | 1 Hot channeled | PM and gases | |
| Glaze preparation | Variable | Discontinuous | Ambient channeled | PM | |
| Glazing | Variable | Continuous | Ambient channeled | PM | |
| Firing | Constant | Continuous | 1 Hot channeled | PM and gases | |
| Frits | Milling | Variable | Continuous/Discontinuous | Ambient channeled | PM |
| Frits melting | Constant | Continuous/Discontinuous | 1 Hot channeled | PM and gases |
| Industrial Process | Stage Process |
|---|---|
| Ceramic tile | Milling |
| Spray-drying | |
| Pressing | |
| Glaze preparation and glazing | |
| Drying | |
| Firing | |
| Ceramic frit | Frit melting |
| Physical Characterization | Chemical Characterization | |
|---|---|---|
| Scenario | Industrial | Pilot scale (PM emission generator) |
| Device | Cascade impactor | PM10/PM2.5 cyclone |
| Sampling campaigns | Number of samplings: 47 Sampling hours: 1150 | Number of samplings: 95 Sampling hours: 470 |
| Process Stage | Cleaning System | Number of Samplings (n) | Tgases (°C) | Average Values | |||
|---|---|---|---|---|---|---|---|
| CTI (mg/Nm3) | w10 (%) | w2.5 (%) | w1 (%) | ||||
| Milling | Fabric filter | 4 | 15–30 | <5 | 74.8 | 53.4 | 38.0 |
| Pressing | None | 1 | 15–30 | 109 ± 33 | 21.0 | 2.1 | 0.23 |
| Fabric filter | 1 | <5 | 75.3 | 28.9 | 5.3 | ||
| Glaze preparation and glazing | None | 2 | 18–40 | 132 ± 71 | 51.8 | 20.1 | 7.5 |
| Fabric filter | 3 | <5 | 74.5 | 41.7 | 22.9 | ||
| Process Stage | Cleaning System | Number of Samplings (n) | Tgases (°C) | Average Values | |||
|---|---|---|---|---|---|---|---|
| CTI (mg/Nm3) | w10 (%) | w2.5 (%) | w1 (%) | ||||
| Spray-drying | Cyclone | 1 | 75–120 | >1000 | 73.4 | 41.3 | 21.8 |
| Fabric filter | 2 | <5 | 75.4 | 50.0 | 33.2 | ||
| Cyclone + wet scrubber | 2 | 60–65 | 75 ± 34 | 97.7 | 80.6 | 39.2 | |
| Drying | None | 1 | 110–120 | <5 | 84.5 | 66.9 | 52.2 |
| Firing | None | 2 | 160–210 | 11 ± 5 | 99.4 | 93.9 | 75.9 |
| Fabric filter + reagent | 2 | 140–160 | <5 | 81.6 | 59.2 | 41.7 | |
| Frits melting | None | 3 | 110–260 | 415 ± 318 | 74.9 | 59.1 | 43.9 |
| Fabric filter | 1 | 110–210 | <5 | 83.1 | 61.1 | 43.5 | |
| Electrostatic precipitator | 1 | <5 | 88.0 | 67.5 | 49.2 | ||
| Process Stage | Cleaning System | 1 Q (Nm3/kg) | Units | Average Values | |||
|---|---|---|---|---|---|---|---|
| EFPM10 | EFPM2.5 | EFPM1 | |||||
| Samplings at ambient temperature sources (T < 40 °C) | Milling | Fabric filter | 4 | mg/kg | 2 | 2 | 1 |
| Pressing | None | 4 | mg/m2 | 1923 | 192 | 21 | |
| Fabric filter | 8 | 3 | 1 | ||||
| Glaze preparation and glazing | None | 4 | mg/m2 | 7183 | 2212 | 724 | |
| Fabric filter | 48 | 31 | 29 | ||||
| Process Stage | Cleaning System | 1 Q (Nm3/kg) | Units | Average Values | |||
|---|---|---|---|---|---|---|---|
| EFPM10 | EFPM2.5 | EFPM1 | |||||
| Samplings at medium–high-temperature ceramic sources | Spray-drying | None | 4 | mg/kg | 4147 | 2734 | 1137 |
| Fabric filter | 3 | 2 | 1 | ||||
| Wet scrubber | 297 | 244 | 99 | ||||
| Drying | None | 3 | mg/m2 | 155 | 123 | 96 | |
| Firing | None | 4 | mg/m2 | 901 | 857 | 690 | |
| Fabric filter + solid reagent | 11 | 8 | 5 | ||||
| Frit melting | None | 4.4 | mg/kg frit | 1376 | 1045 | 643 | |
| Fabric filter | 1 | 1 | 1 | ||||
| Electrostatic precipitator | 19 | 15 | 11 | ||||
| Process Stage | Major Elements | Trace Elements |
|---|---|---|
| Spray-drying Drying Pressing | ZrO2, ZnO, BaO, PbO | Hf, Cr |
| Glazing | B2O3, BaO, PbO, ZnO, ZrO2 | Cu, Cr, Cd, Sn, Hf |
| Firing | Na2O, K2O, ZnO, PbO | S, Tl, As, Cr, Rb, Cs, Cu |
| Frits melting | SiO2, Al2O3, CaO, MgO, K2O, Na2O, BaO, ZnO | S, Sr, Cs |
| Process Stage | Cleaning System | Granulometry |
|---|---|---|
| Spray-drying | Cyclone + wet scrubbing system | The increase of wx is due to the breakage of the agglomerates by wetting. |
| Firing | Fabric filter + solid reagent | The reduction of wx is a direct consequence of injecting solid reagent to remove gaseous pollutants. |
| Frit melting | Fabric filter | The increase of the wx emitted post-cleaning can be explained by the thermal origin (volatilization–condensation) of the particles when the temperature of the exhaust gases is reduced (<200 °C) before entering into the cleaning system. |
| Source | Industrial Process | Subsector, Basic Input Material, Fuel | Cleaning System | TSP (mg/Nm3) | Mean Values (%) | ||
|---|---|---|---|---|---|---|---|
| EFPM10 | EFPM2.5 | EFPM1 | |||||
| Findings of this research | Ceramic tile manufacturing | Ceramic tile manufacturing, milling, batch | Fabric filter | <5 | 74.8 | 53.4 | 38.8 |
| Previous studies [47] | Treatment natural stone, sand | Crusher plant, limestone, dolomite | Fabric filter | 1.2 | 69.2 | 14.2 | 5.0 |
| Findings of this research | Treatment natural stone, sand | Preparation of ceramic raw materials, loam, clay, porosity material | Fabric filter | 0.8 | 80.4 | 34.4 | 16.5 |
| Findings of this research | Ceramic tile manufacturing | Ceramic tile manufacturing, isostatic compression press, spray-dried powder | Fabric filter | <5 | 75.3 | 28.9 | 5.3 |
| Previous studies [47] | Manufacture of porcelain/press | Isostatic compression press, porcelain substance | Fabric filter | 0.1 | 94.9 | 57.4 | 38.3 |
| Findings of this research | Ceramic tile manufacturing | Ceramic tile manufacturing, firing, continuous, natural gas | None | 11 | 99.4 | 93.9 | 75.9 |
| Previous studies [47] | Tunnel oven ceramic industry | Oven without additive, loam, clay, gas | None | 5.3 | 93.9 | 85.0 | 79.7 |
| Oven with additive, loam, clay, gas, lime | None | 3.4 | 95.4 | 88.6 | 84.9 | ||
| Findings of this research | Glass industry | Ceramic frit manufacturing | Fabric filter | <5 | 83.1 | 61.1 | 43.5 |
| Ehrlich et al. 2007 [47] | Glass industry | Manufacture of goblets and beakers, bath, cullet, batch, natural gas | Fabric filter | 0.8 | 93.4 | 53.3 | 37.7 |
Publisher’s Note: MDPI stays neutral with regard to jurisdictional claims in published maps and institutional affiliations. |
© 2022 by the authors. Licensee MDPI, Basel, Switzerland. This article is an open access article distributed under the terms and conditions of the Creative Commons Attribution (CC BY) license (https://creativecommons.org/licenses/by/4.0/).
Share and Cite
Celades, I.; Sanfelix, V.; López-Lilao, A.; Gomar, S.; Escrig, A.; Monfort, E.; Querol, X. Channeled PM10, PM2.5 and PM1 Emission Factors Associated with the Ceramic Process and Abatement Technologies. Int. J. Environ. Res. Public Health 2022, 19, 9652. https://doi.org/10.3390/ijerph19159652
Celades I, Sanfelix V, López-Lilao A, Gomar S, Escrig A, Monfort E, Querol X. Channeled PM10, PM2.5 and PM1 Emission Factors Associated with the Ceramic Process and Abatement Technologies. International Journal of Environmental Research and Public Health. 2022; 19(15):9652. https://doi.org/10.3390/ijerph19159652
Chicago/Turabian StyleCelades, Irina, Vicenta Sanfelix, Ana López-Lilao, Salvador Gomar, Alberto Escrig, Eliseo Monfort, and Xavier Querol. 2022. "Channeled PM10, PM2.5 and PM1 Emission Factors Associated with the Ceramic Process and Abatement Technologies" International Journal of Environmental Research and Public Health 19, no. 15: 9652. https://doi.org/10.3390/ijerph19159652