Article

Removal of Ammonia Using Persulfate during the Nitrate Electro-Reduction Process

1
Beijing Key Laboratory for Source Control Technology of Water Pollution, College of Environmental Science and Engineering, Beijing Forestry University, Beijing 100083, China
2
Water Quality Testing Center, Beijing Drainage Water Environment Development Co., Ltd., Beijing 100022, China
*
Author to whom correspondence should be addressed.
Int. J. Environ. Res. Public Health 2022, 19(6), 3270; https://doi.org/10.3390/ijerph19063270
Submission received: 13 February 2022 / Revised: 8 March 2022 / Accepted: 8 March 2022 / Published: 10 March 2022

Abstract

:
NH4+ is often produced during the electro-reduction of NO3, which results in inadequate total nitrogen (TN) removal during advanced sewage treatment. In this study, the electro-reduction byproduct NH4+ was oxidized and removed using sulfate radical (SO4•−)-based advanced oxidation. Persulfate (PS) was activated by electrocatalysis, using Co/AC0.9-AB0.1 particle electrodes to produce SO4•−. Results showed that when the influent concentration of NO3-N was 20 mg/L, a PS dosage of 5.0 mM could completely oxidize NH4+ at 0.1 A (nondetectable in effluent) reducing the TN concentration from 9.22 to 0.55 mg/L. The presence of coexisting PO43−, CO32− and humic acid suppressed the oxidation and removal of NH4+. Electron spin resonance (ESR) spectra and quenching experiments revealed SO4•− as the dominant radical in the process of indirect NH4+ oxidation, while •OH radicals only had an assisting role, and the surface accumulated free radicals were responsible for the indirect oxidation of NH4+. Cyclic voltammetry (CV) curves indicated that NO3 was primarily reduced via atomic H*-mediated indirect reduction. Therefore, the activation of PS using Co/AC0.9-AB0.1 particle electrodes might be a promising alternative method for oxidizing byproduct NH4+ in the electro-reduction of NO3 and reduce TN concentration in advanced sewage treatment.

1. Introduction

The total nitrogen (TN) content of the effluent of most sewage treatment plants can reach as high as 10 mg/L, even after primary and secondary treatment [1]. In sewage wastewater, TN is mainly composed of NO3, with a small amount of NH3/NH4+ [2]. It has been well established that NO3 and NH4+ bear a negative impact on aquatic environments, such as eutrophication and the occurrence of algal blooms [3]. Therefore, advanced treatment methods are required to reduce the TN content of sewage.
Electrochemical reduction is a feasible option for the conversion of NO3 to N2, with the benefits of simple operational methods, low-environmental impact and economic efficiency [4]. The electro-reduction of NO3 occurs via a complex process involving multi-electron transfer between the different valence states of nitrogen and its reaction products, such as N2H4, NH3, NH2OH, N2, N2O, NO, NO2, and NO2 [5]. Direct reduction and indirect reduction pathways have both been shown to be involved in the electro-reduction of NO3 [6]. During the direct reduction process, NO3 is first adsorbed onto the electrode and then converted to NO3(ad). Electron transfer leads to the generation of NO32−(ad), NO2(ad) and other short-lived intermediates [7]. Subsequently, NO32−(ad) and NO2(ad) are converted (in a stepwise reduction process) to NO(ad), then finally to N2 and NH4+, sometimes via the intermediates N2O, NH2OH and N2H4 [5]. The indirect reduction process refers to atomic H*-mediated reactions, where cathode surface-adsorbed atomic H* is produced via the reduction of protons. The products formed during the indirect reduction process usually include NO2, NO, N2, and NH3/NH4+ [8]. Although NO2 exists as the product of the rate-limiting step in both direct and indirect reduction, it can be rapidly degraded and converted to N2 and NH4+ [9]. Therefore, the nitrogen substances present in solution after electro-reduction mainly consist of the NH3/NH4+ product and residual NO3. However, the production of NH4+ presents a problem as it is a very stable nitrogen intermediate, not only reducing the denitrification efficiency of the treatment system, but also posing a threat to the aquatic environment due to its hepatotoxicity and nephrotoxicity [10].
At present, the systems used for NO3 electro-reduction include traditional two-dimensional (2D) anode/cathode plate systems and the newly-developed three-dimensional (3D) particle electrode bed system [7]. In both systems, the electrode material significantly influences the efficiency of NO3 electro-reduction [11]. The electrode materials used in 2D systems usually include monometallic (Cu, Ni, Al, Pd, Pt, Pb, Ti, and Rh [12,13,14]) and bimetallic (Cu-Ni, Cu-Sn, Sn-Pd, Cu-Pd, and Cu-Zn [15,16,17,18]) catalytic electrodes. For 3D systems, the particle electrodes are composed of a carrier material loaded with a catalyst, such as Co3O4-TiO2/Ti, PdCu@OMC (OMC: ordered mesoporous carbon), Pd-Sn/AC, Cu/AC or Co/AC0.9-AB0.1 (AC: active carbon, AB: acetylene black) [9,19,20,21,22]. Compared to the 2D system, the addition of particle electrodes results in an increased specific surface area and availability of reactive sites, while also shortening the mass transfer distance, which enhances the removal efficiency and reaction rate [7,23]. However, accumulation of byproduct NH4+ also occurs in the 3D system [22]. In order to remove NH4+, chlorine active species are often applied, such as ClO, HClO•− and Cl2•−, which are generated via electrochemical reactions [24]. However, the removal efficiency highly depends on the concentration of Cl, with either excessive or insufficient dosages reducing the removal effect. Moreover, Cl easily combines with organic matter and generates chlorination byproducts, such as trihalomethanes, trichloromethane and haloacetic acids, which present a secondary threat to the health of aquatic ecosystems and human populations [25]. The role of hydroxyl radicals (•OH) in the oxidization of NH4+ has also been investigated [5]. However, the rate of reaction between •OH and ammonia is slow, reducing the overall removal efficiency [26].
Persulfate (PS) oxidation technology has recently attracted increasing attention [27]. Sulfate radicals (SO4•−) are generated from the activation of PS under the influence of UV radiation, increased temperatures, magnetic fields and electrical currents [28,29]. In comparison, SO4•− possesses a higher redox potential (2.5–3.1 V) than •OH (1.8–2.7 V), as well as a longer half-life (30–40 μs for SO4•− and 20 ns for •OH), wider pH range (2–8 for SO4•− and 2–4 for •OH) and a lower O−O bond breaking energy (140 kJ/mol for SO4•− and 213.3 kJ/mol for •OH) [27,30]. As an electrophilic species, SO4•− tends to react with alkoxy (-OR), amino (-NH2), and hydroxyl (-OH) groups [31]. SO4•−-based advance oxidation has been used previously in the field of landfill leachate treatment, to remove NH4+ and gaseous ammonia [32]. Therefore, in the present study, NH4+ removal was assessed using persulfate in a 3D PS-Co/AC0.9-AB0.1 system, with the aim of increasing TN removal. The effects of various operational parameters were assessed, allowing the nitrogen conversion pathway and the denitrification mechanism to be investigated. Furthermore, electrocatalytic denitrification was also carried out using Cl in a comparative system.

2. Materials and Methods

2.1. Experimental Setup

As shown in Figure 1, the mesh plates composed of Ti/RuO2 (12 × 2.5 cm2) and Ti (12 × 2.5 cm2) in rectangular cells were obtained from Hengli Ti Co., Ltd. (Beijing, China), for use as the anode and cathode, respectively. Then, 15 g of particle electrodes were packed between the two mesh plates (total L × W × H = 2.5 × 2.4 × 12 cm3). Simulated wastewater with PS dosing (namely K2S2O8) was continuously pumped into the reactor and treated without circulation.

2.2. Preparation of Particle Electrodes

The preparation of particle electrodes was performed according to a previously reported method [22]. Briefly, 90 g of powdered activated carbon (AC) and 10 g of powdered acetylene black (AB) were impregnated into 300 mL Co(NO3)2 (0.4 mol/L) and 100 mL distilled water, respectively. Then, AC and AB were separated by centrifugation and dried at 105 °C. The dried AC and AB samples were mixed thoroughly using polyvinyl alcohol as an adhesive at a mass ratio of 9:1, then molded into small cylindrical granules (~Φ × H = 4 mm × 5 mm) using a granulator. After drying at 105 °C for 24 h, the Co/AC0.9-AB0.1 particles were calcinated in a muffle furnace at 600 °C for 4 h under an N2 atmosphere.

2.3. Experimental Procedure

The simulated wastewater was prepared by dissolving KNO3 in distilled water (NO3-N = 20 mg/L), using 10.0 mM Na2SO4 as an electrolyte. After 120 min, adsorption reached saturation point and the electrical current was turned on. During the study of PS dosage, PS doses were applied from 1.5–5.0 mM. The treatments were carried out under successive currents of 0.1, 0.2, 0.3, and 0.4 A for 2 h/each current. Particle electrodes were replaced with new ones after each group treatment from 0.1–0.4 A. To investigate the effects of coexisting substances, the current was set at 0.3 A and the PS dosage remained constant at 5.0 mM. The concentrations of PO43−-P and CO32−-C ranged from 0.5–3.0 mg/L and 50.0–200.0 mg/L, respectively. The humic acid (HA) was used to simulate the dissolved organic matter. The concentration of HA was expressed by chemical oxygen demand, namely 50.0–120.0 mg COD/L (COD) in the experiments. Therefore, the concentration of HA was expressed by COD, respectively. Particle electrodes were replaced with new ones after treatment for each coexisting substance. The hydraulic retention time (HRT) remained constant at 60 min for all experiments. To assess the comparative effect of Cl, the dosage of Cl was varied from 1.5–5.0 mM, while all other conditions remained the same as described for PS experiments. Samples were collected from the outlet at 20 min intervals for the detection of NO3-N, NO2-N, NH4+-N, and S2O82−. The experiments under initial 20 mg/L NO3-N and without PS dosing were used as controls.

2.4. Identification of Reactive Species and Dominant Radicals

Free radicals were determined and recorded using an electron spin resonance (ESR) spectrometer (EMX Plus, Bruker, Karlsruhe, Germany). The parameter settings included a center field of 3513 G, seep width of 100 G, microwave power of 20 mW, and a scan time of 60 s [33]. The test samples were mixed with 50 mM 5,5-dimethyl-1-pyrrolidine N-oxide (DMPO, TCI Development, Tokyo, Japan). Quenching experiments were performed to identify the contribution of different radical species using simulated wastewater, composed of 5.0 mM PS in 6.0 mg/L NH4+-N in distilled water, using different molar ratios of [scavenger]/[PS] to screen free radicals and establish their contributions. Molar ratios of 1000:1 tert-butyl alcohol (TBA, ≥99%), 1000:1 and 2000:1 ethanol (EtOH, ≥99%) and 200:1 phenol (≥99%) were separately added to simulated sewage samples prior to treatment. Due to the potential interference caused by organic reagents, samples were filtered through a 0.22 μm membrane prior to NH4+ determination.

2.5. Analytical Methods

NO3 and NO2 were determined via ion chromatography (Dionex ICS-3000, Sunnyvale, CA, USA) using a Dionex IonPac AS11-HC analytical column (4 mm × 250 mm) and an AG11-HC guard column (4 mm × 40 mm). Elution was performed using 12.5 mM NaOH at a flow rate of 1.0 mL/min. NH4+ was analyzed using salicylic acid spectrophotometry (UV2600, Techocomp, Beijing, China) [34]. Total nitrogen (TN) was calculated as the sum of NO3-N, NO2-N and NH4+-N. The pH value was determined using a pH-meter (PB-10, BSISL, China). S2O82− was determined by UV spectrophotometry [35]. The activation efficiency of PS was calculated according to Equation (1), as follows:
PS   activation   efficiency     C 0   C t C 0   ×   100 %
where, C0 and Ct are the PS concentration of the influent and effluent, respectively.

2.6. Electrochemical Measurements

Cyclic voltammetry (CV) measurements were performed using an electrochemical workstation (CHI 660D, Shanghai CH Instruments, China), with Pt filament and Ag/AgCl electrodes employed as the counter and reference electrodes, respectively. A glassy carbon disk electrode (3.0 mm) was used as the working electrode. Approximately 20.0 μL of pre-dispersed catalyst ink was coated dropwise onto the polished glassy carbon electrode. CV tests were performed with a cycle ranging from −0.39 V to +1.61 V and a scan rate of 0.1 V/s for 10 segments. A solution containing 0.5 M Na2SO4 was used as the supporting electrolyte. All solutions were prepared using ultrapure water and purged with N2 gas for 20 min prior to measurements. The potentials were established in reference to a reversible hydrogen electrode (RHE).

2.7. Statistical Analysis

The one-way analysis of variance (ANOVA) was carried out using IBM SPSS v.20.0 (SPSS Inc., Chicago, IL, USA) software. Unless otherwise stated, results were considered to indicate significant differences if p < 0.05.

3. Results and Discussion

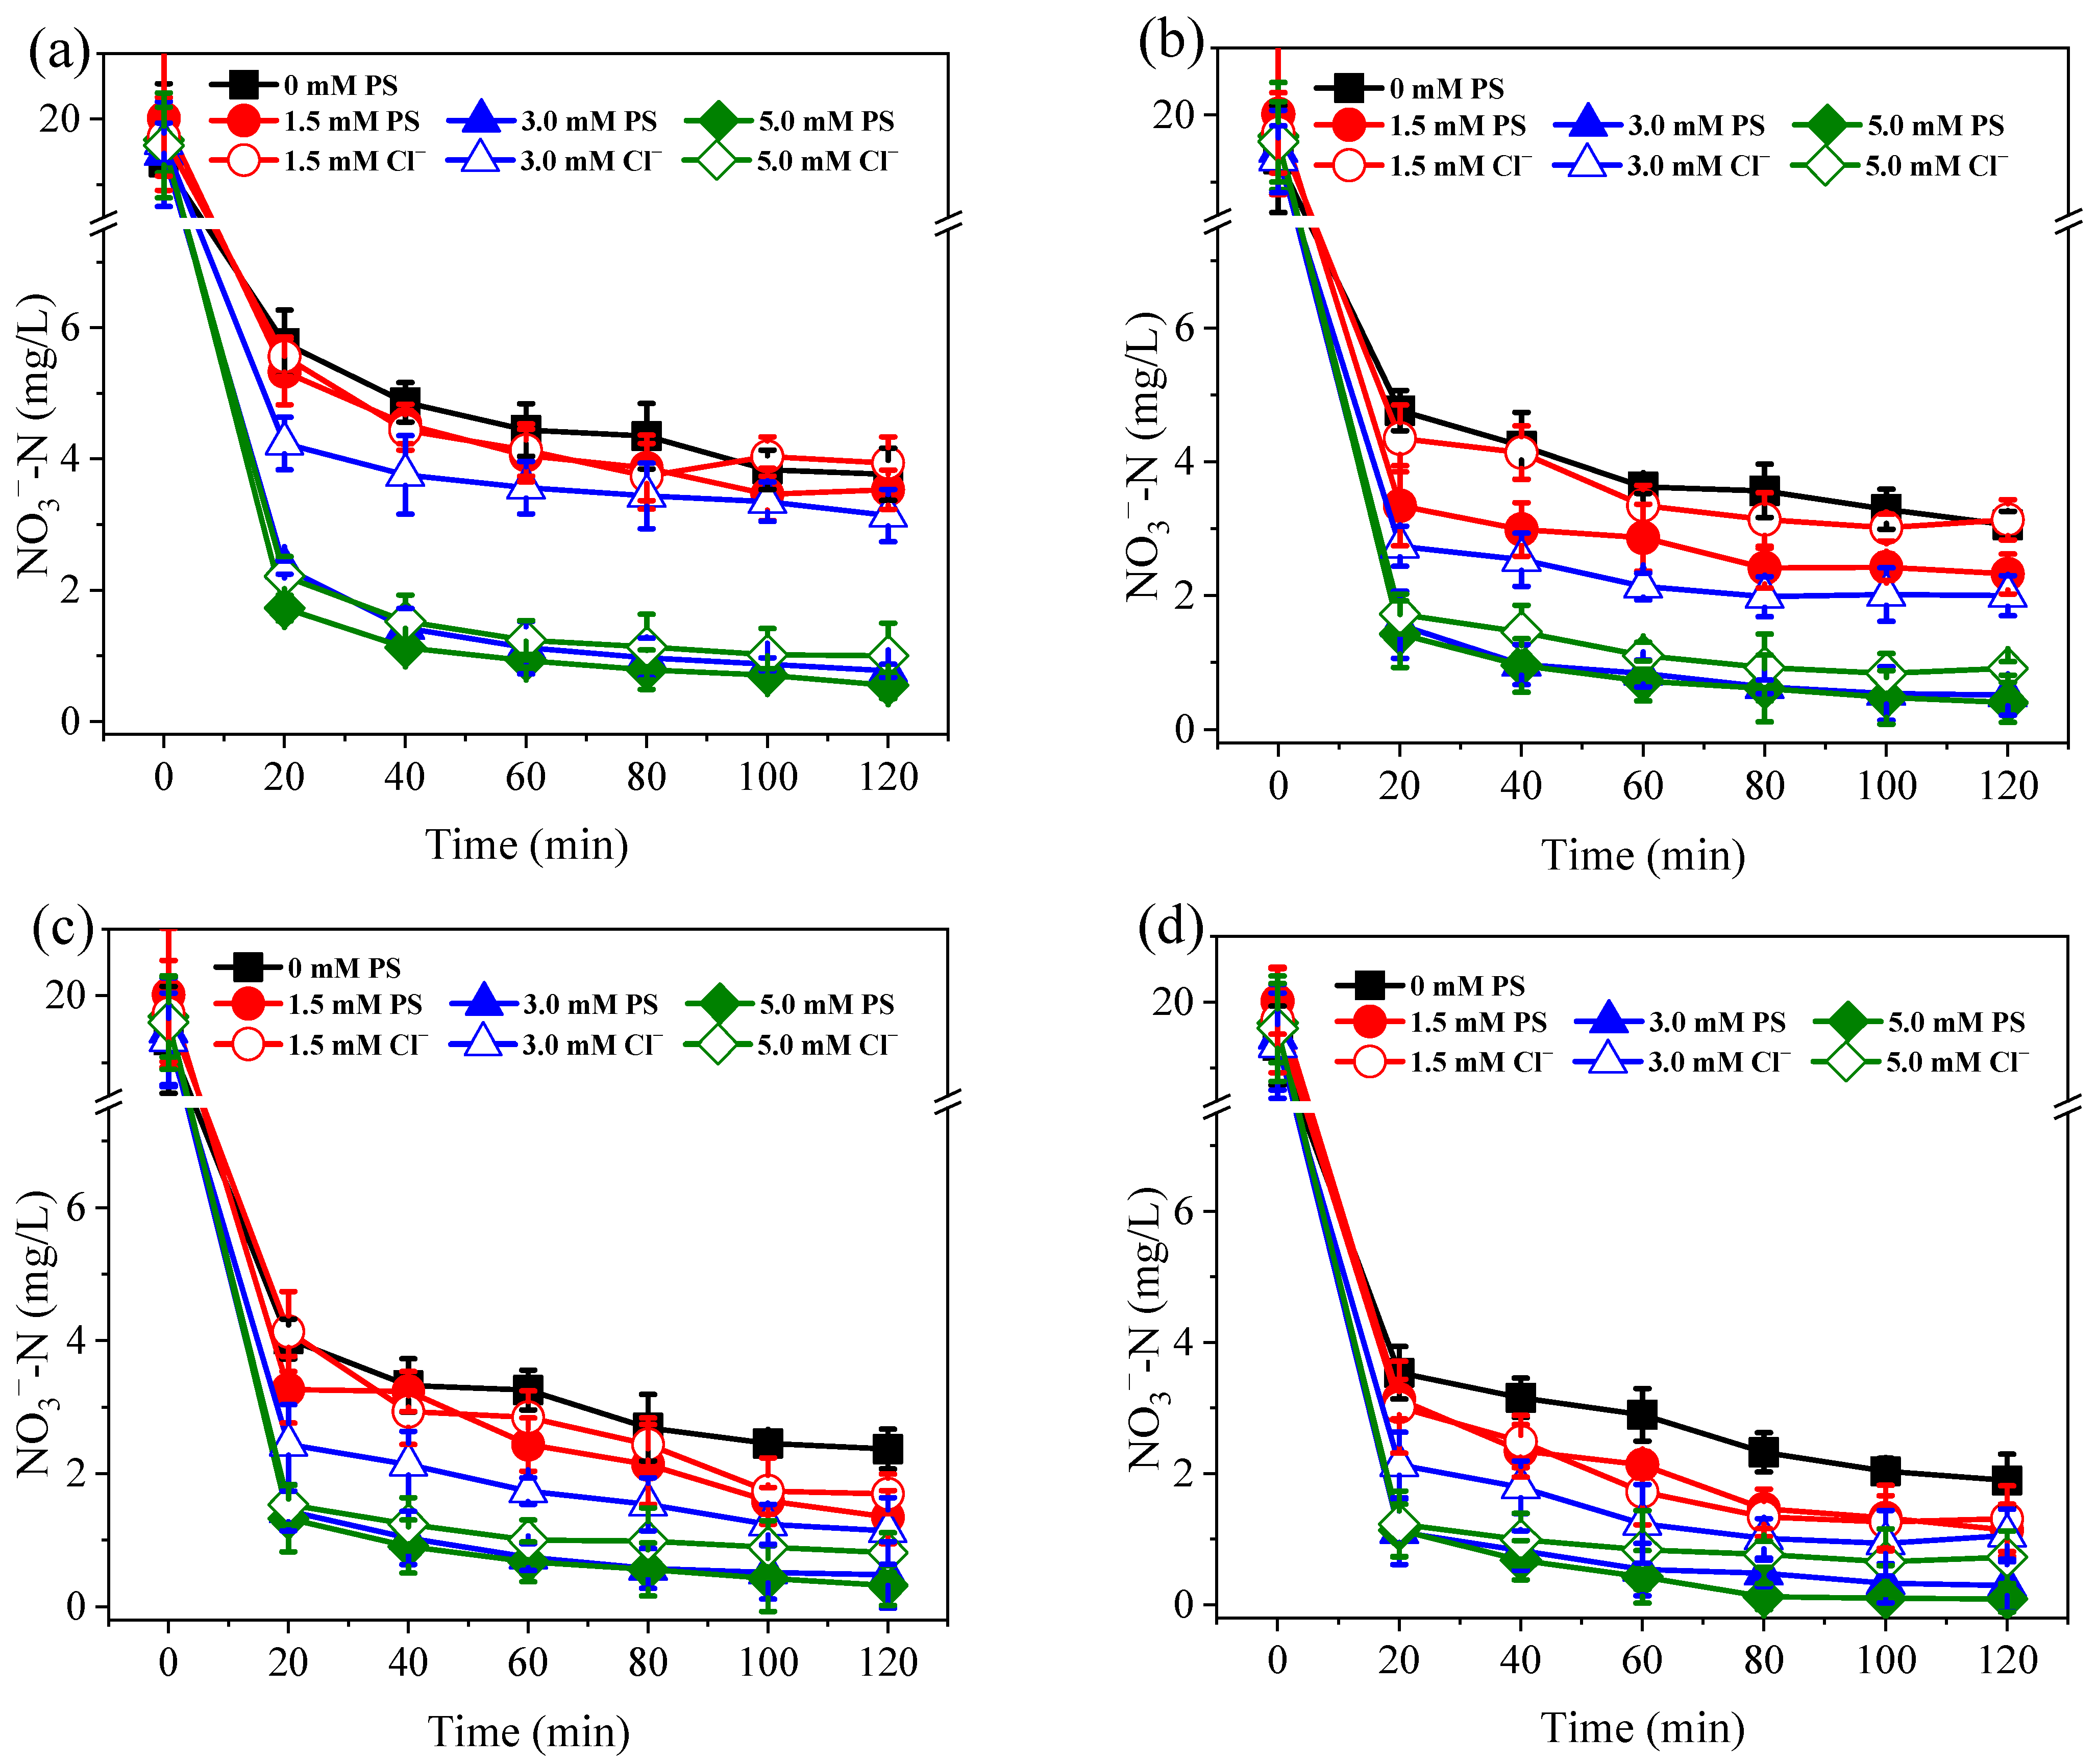
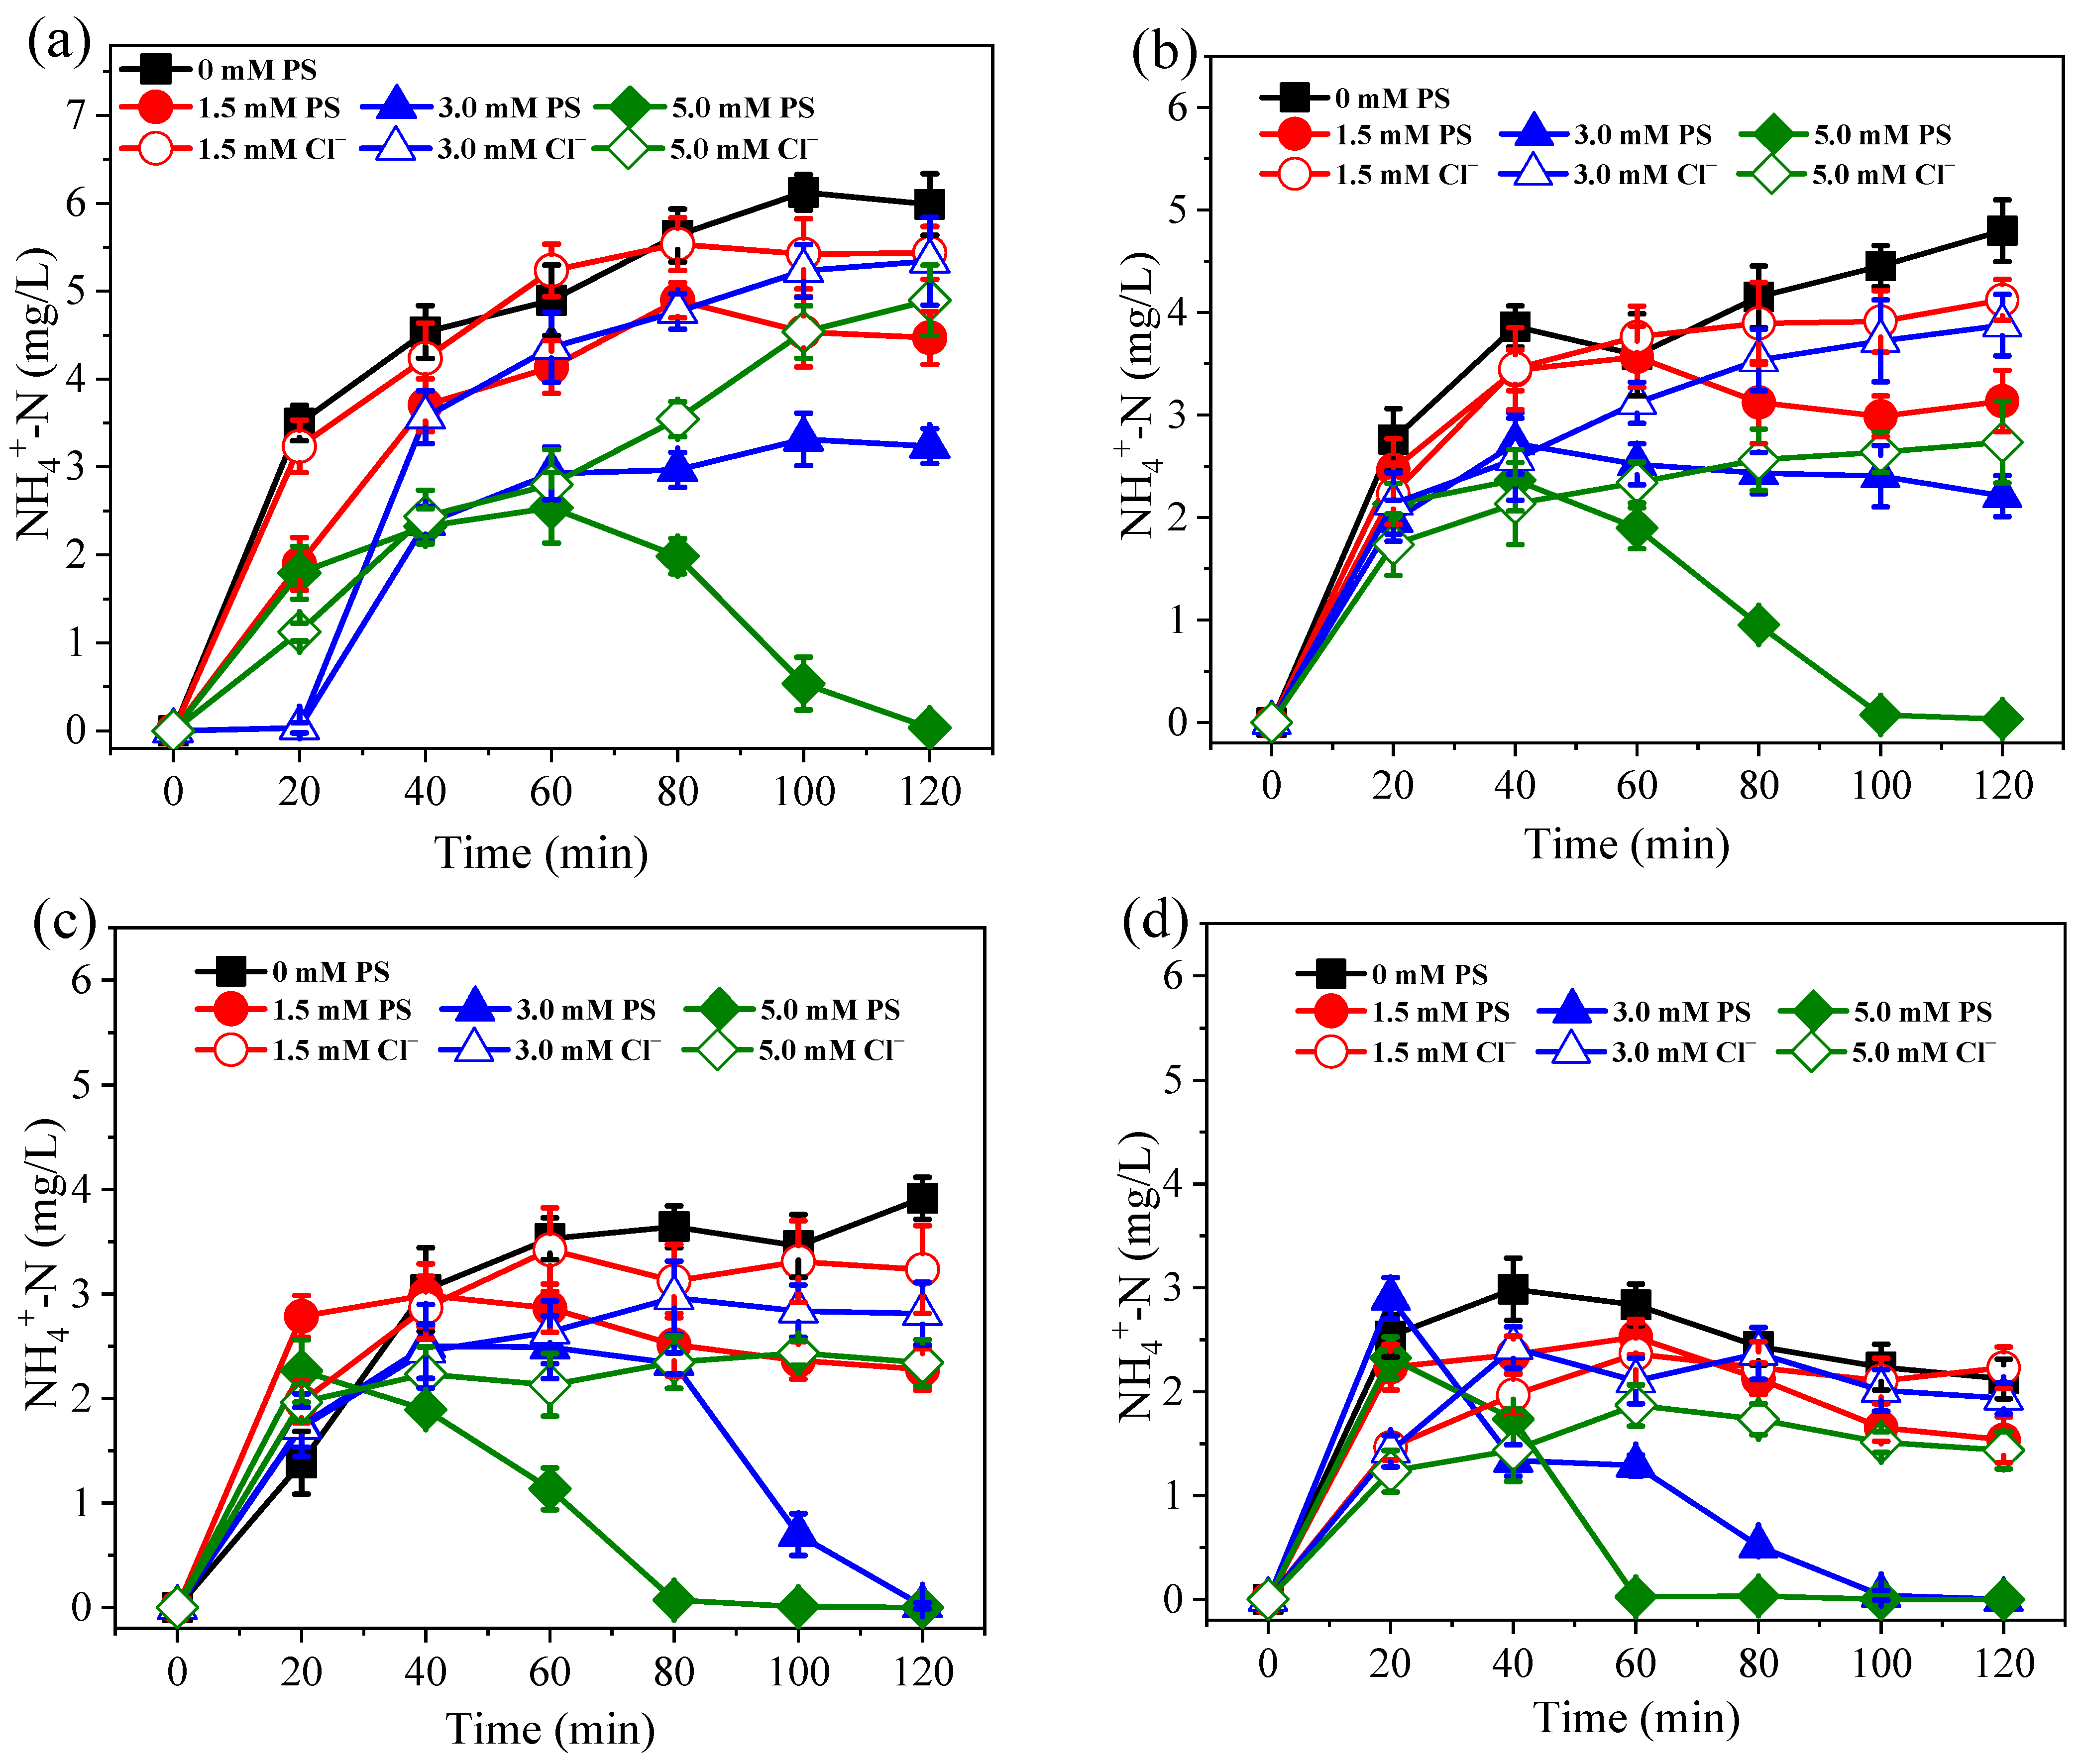
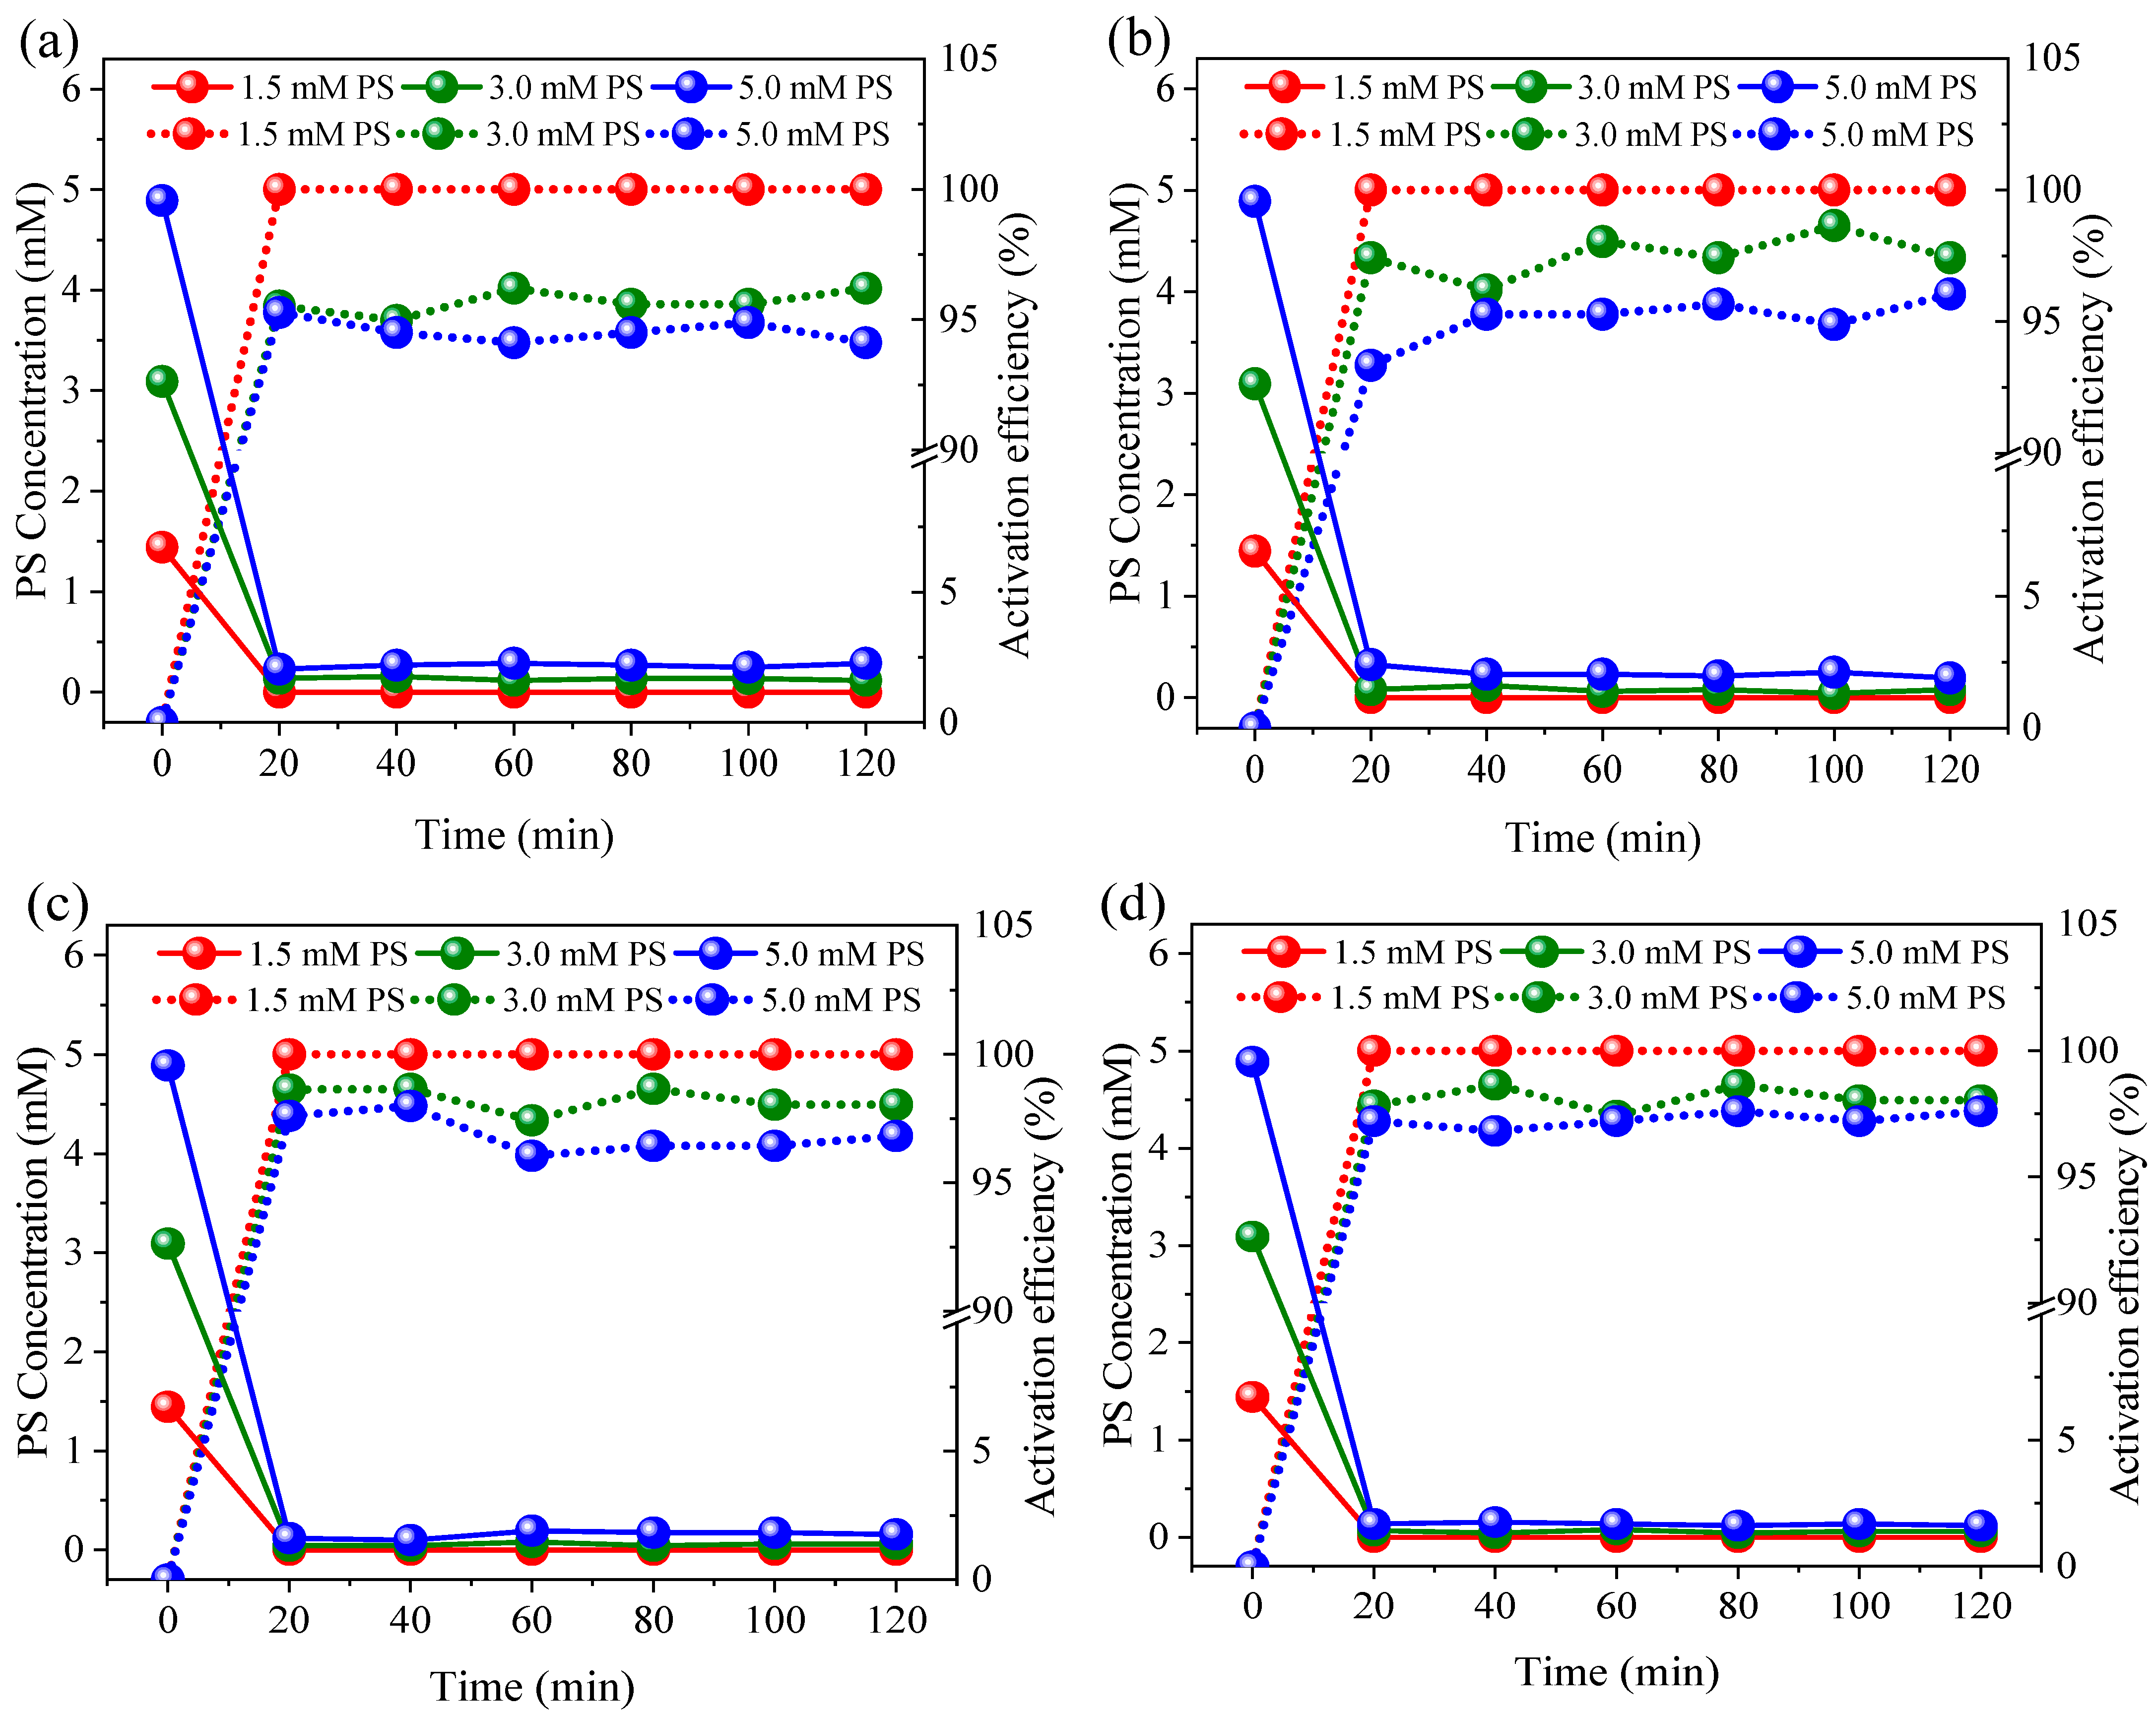
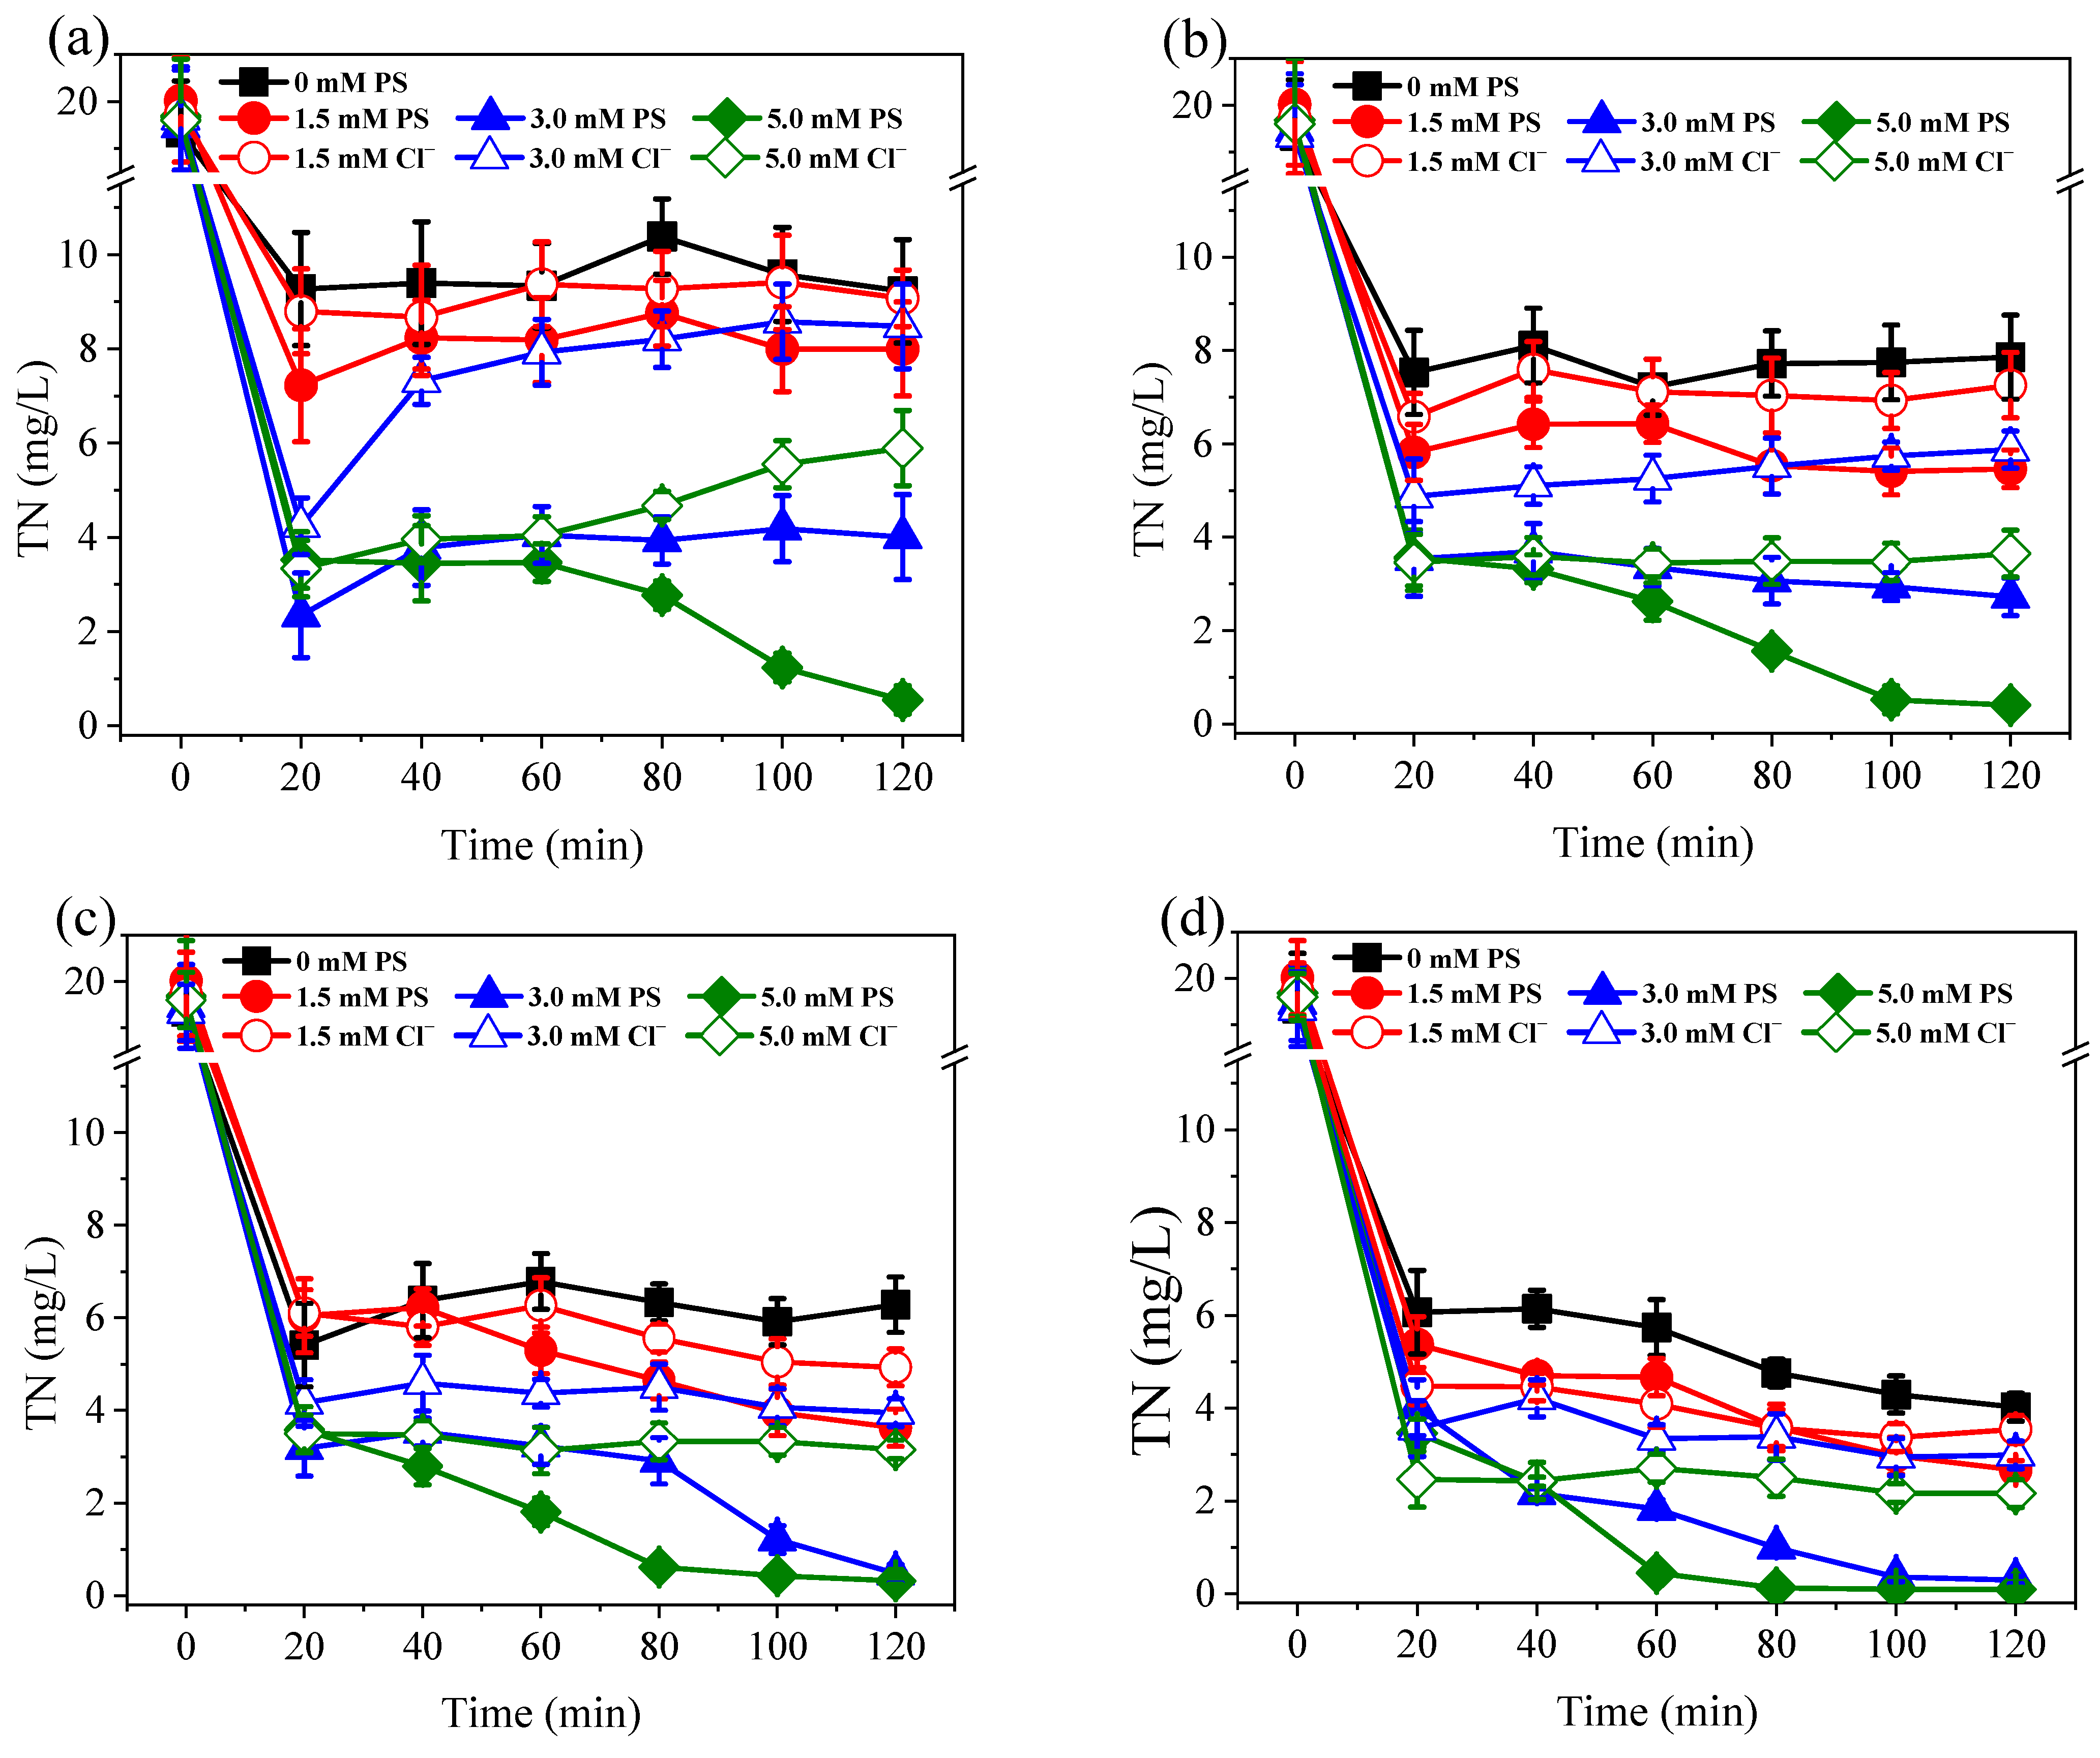
3.1. Nitrogen Conversion and Removal under Different PS Dosage and Current Conditions

As shown in Figure 2, the Co/AC0.9-AB0.1 particle electrodes exhibited excellent catalytic activity for the electro-reduction of NO3. For samples without PS dosing, the percentage of NO3 conversion reached 80.5–90.2%, with the percentage conversion increasing in accordance with the applied current. This phenomenon occurred due to Co on the surface of particle electrodes having a strong catalytic activity for the production of atomic H*, which was beneficial to the indirect reduction of NO3 [22]. Following the addition of PS at dosages of 1.5–5.0 mM, NO3 reduction was further increased by 9.4–16.7%. Although PS activation occurred at the cathodic side of the particle electrode [36], the PS activation process did not interfere with the reduction of NO3. PS is frequently used in advanced oxidation processes, but it can also facilitate the formation of Co-H* on electrode surfaces [36]. Therefore, PS promotes the atomic H*-mediated reduction of NO3. Compared with the control samples, the addition of 1.5 mM PS significantly enhanced the reduction of NO3 at 0.2–0.4 A (p < 0.05), although this effect was not observed at 0.1 A. When the PS dosage was increased further to 3.0 and 5.0 mM, the enhancement effect was significantly greater than that of 1.5 mM PS (p < 0.05). However, there were no significant differences found between 3.0 and 5.0 mM (p > 0.05), implying that increases in the dosage of PS beyond 3.0 mM, did not further improve NO3 reduction.
During the electro-reduction process at 0.1–0.4 A, approximately 10.2–28.2% of NO3 was converted into NH4+ without PS dosing (Figure 3). Therefore, when the influent NO3-N concentration was ~20.0 mg/L, 2.1–5.5 mg/L of NH4+-N was discharged into the effluent. It is known that NH4+-N concentrations over 2.0 mg/L can cause toxicity to aquatic life, such as fish [37]. However, compared with controls, the NH4+-N concentration was significantly reduced after PS dosing at all assessed currents (p < 0.05). Even low current conditions of 0.1 A, and the addition of 5.0 mM PS resulted in NH4+ being undetectable in the effluent. In contrast, when 5.0 mM of Cl was added to the system, the concentration of NH4+ in the effluent continually accumulated throughout the whole experimental process, reaching 4.7 mg/L. As can be seen from Figure 4, the PS activation efficiency reached >94.1% at 0.1 A, suggesting that PS can easily be activated by Co/AC0.9-AB0.1 particle electrodes. Due to the effective activation of PS, the oxidation of NH4+ was positively correlated with PS dosage, with higher PS dosages achieving a better NH4+ oxidation efficiency. Furthermore, increases in current could overcome the effects of low PS dosage, with a current of 0.3 A resulting in NH4+ being undetectable in the effluent at a PS dose of 3.0 mM. When 3.0 mM Cl was applied, the effluent still contained 2.8 mg/L NH4+-N. Although active chlorine species have the capacity to oxidize NH4+, they cannot oxidize and remove NH4+ as efficiently as PS at an equivalent dosage.
During the treatment processes, all samples dosed with PS achieved lower TN concentrations than the relevant controls (Figure 5). In order to investigate the NH4+ oxidation products, samples were prepared by dissolving (NH4)2SO4 (6.0 mg/L NH4+-N) into 10.0 mM Na2SO4, followed by treatment for 120 min at 0.3 A with the addition of 5.0 mM PS. Results showed that only 0.06 mg/L NO3-N was generated, while NO2-N was undetectable (Figure 6). These results suggest that the oxidation products of NH4+ mainly consisted of nitrogenous gases. The release of gaseous substances from aqueous solution resulted in a decrease in TN concentration. When a PS dosage of 5.0 mM was applied, a TN removal efficiency of >99% could be achieved, even at 0.1 and 0.2 A. In contrast, the maximum TN removal efficiency achieved with the addition of 5.0 mM Cl, was only 89% at 0.4 A. Therefore, due to the high removal effects achieved under low currents, the oxidation of NH4+ by PS not only improves the denitrification efficiency of the system, but also reduces the energy consumption requirements.

3.2. Effects of Coexisting Substances

Various coexisting anions and organic compounds are present in actual municipal sewage. Therefore, the effects of several commonly coexisting species, including PO43−, CO32− and HA, were investigated. As shown in Figure 7, Figure 8 and Figure 9, the coexistence of PO43−, CO32− and HA had a negative impact on the reduction of NO3, especially in terms of the oxidation of NH4+. PO43− and CO32− have been shown to adsorb the surface of electrodes, resulting in competition for active sites and interfering with the adsorption and conversion of NO3 [38,39]. HA is an amphoteric substance that can be directly or indirectly reduced on the surface of Co/AC0.9-AB0.1 particle electrodes, with both systems interfering with the reduction of NO3 [22]. During the oxidation of NH4+, HPO42− (hydrolyzed by PO43−) and CO32− often act as scavengers of the free radicals SO4•− and •OH, therefore reacting with SO4•− and •OH to yield weak oxidants, such as HPO4•− and CO3•− (Equations (2)–(5)) [39].
SO 4 + HPO 4 2     SO 4 2 + HPO 4
OH + HPO 4 2     HPO 4 + OH
SO 4 + CO 3 2     SO 4 2 + CO 3
OH + CO 3 2     OH + CO 3
Similarly, HA can also be oxidized by consuming SO4•− and •OH [36]. Therefore, the coexistence of these substances reduced the oxidation performance of the radical-based system. The oxidation of NH4+ was greatly affected and the efficiency of NO3 and NH4+ removal was reduced, negatively affecting TN removal. However, after actual sewage treatment, the TP content of the effluent typically ranges from 0.5–1.0 mg/L, while the concentration of HA, expressed as COD, is generally less than 50.0 mg/L [40] and therefore, the concentration of NH4+-N would be below 2.0 mg/L under this coexisting substance concentration, which would not adversely affect the water environment. Even if the concentration of CO32−-C reached 50.0 mg/L, a concentration of NH4+-N in the effluent would measure 2.8 mg/L, which would only have a slight influence on the water environment. However, the negative impact can be mitigated by increasing the PS concentration accordingly.

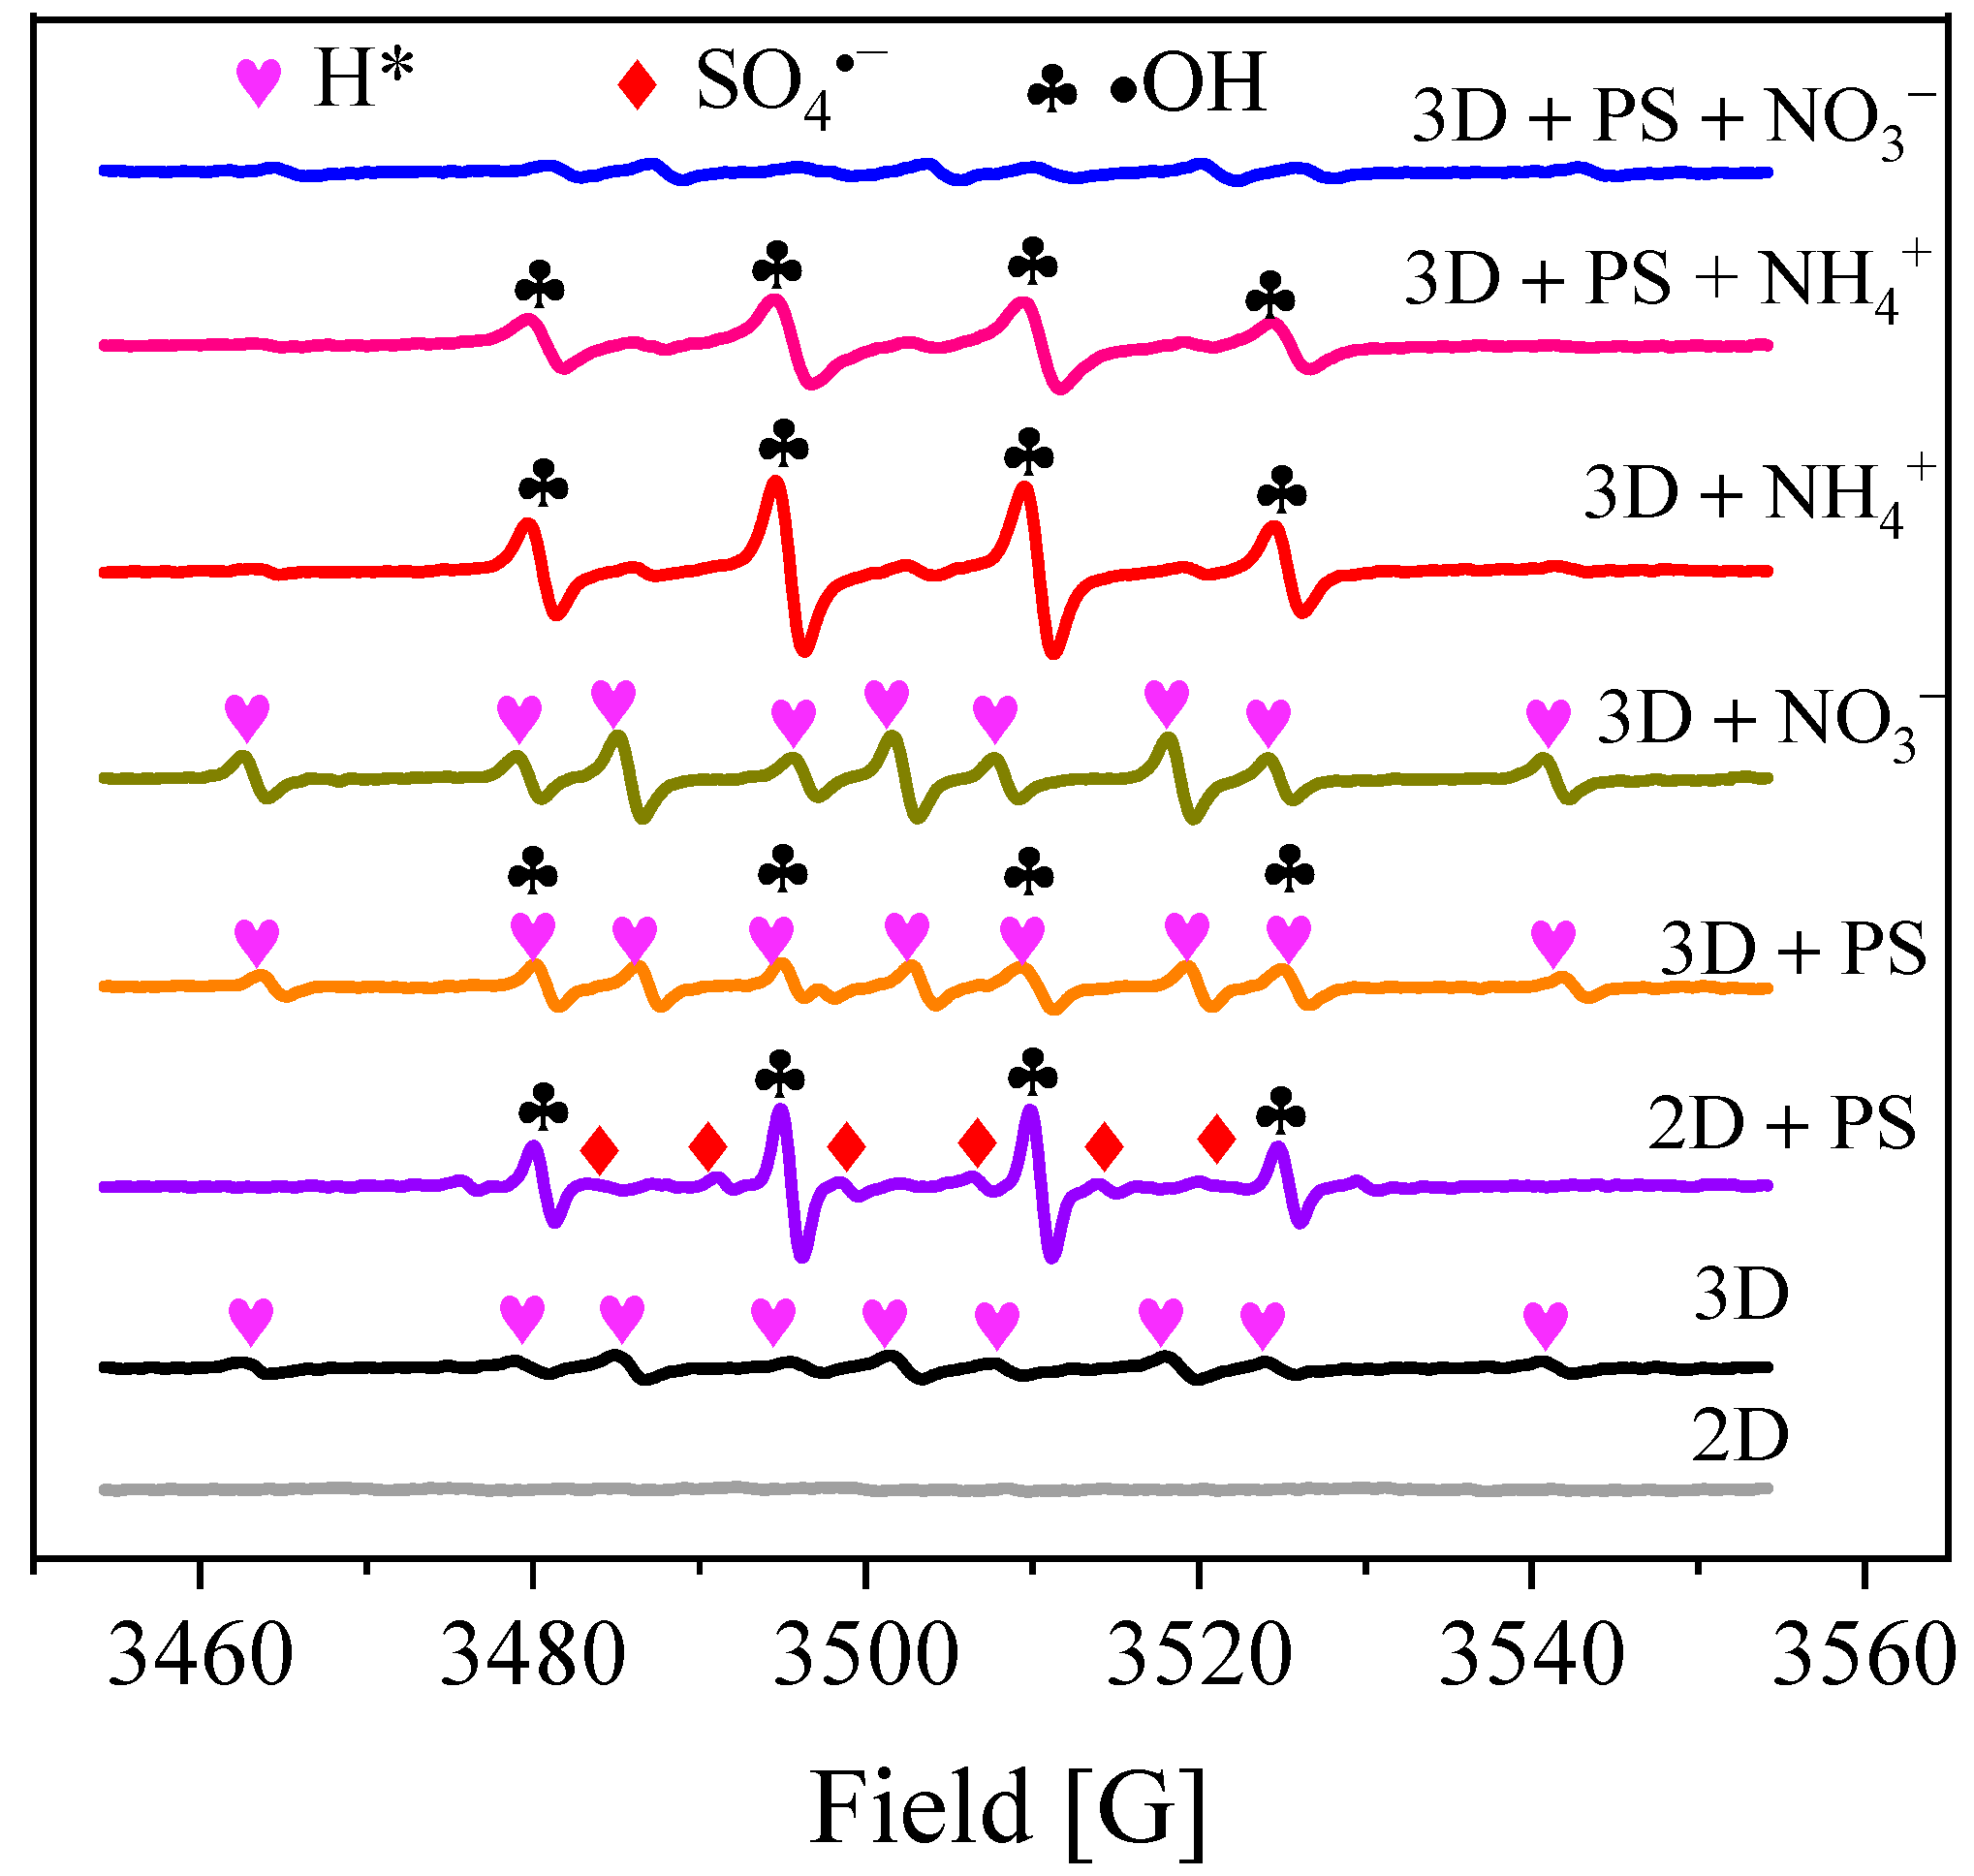
3.3. Reactive Species Identification

In order to confirm the active radical species in the PS-Co/AC0.9-AB0.1 system, ESR experiments were carried out under different conditions. As shown in Figure 10, there were no free radical signals detected in the 2D system. After the addition of PS (2D + PS), a weak signal was observed for the DMPO-SO4 adduct (1:1:1:1:1:1, aN = 13.2 G, aH = 9.5 G, aN = 1.4 G, aH = 0.8 G), whereas the DMPO-OH adduct signal (1:2:2:1, aN = aH = 14.9 G) was much stronger. This suggests that DMPO-SO4 and DMPO-OH were both generated from the activation of PS, while the •OH radical was yielded from SO4•− reacting with H2O/OH, as shown in Equations (6) and (7) [39]:
SO 4 + OH     OH + SO 4 2
For the 3D system, a weak signal was observed for the DMPO-H adduct (1:1:2:1:2:1:2:1:1), with hyperfine coupling constants of aN = 15.5 G and aH = 20.6 G. This indicated that Co/AC0.9-AB0.1 particle electrodes had performed hydro-reduction of NO3. Atomic H* was generated by the electrolysis of H2O with catalytically active Co on the particle electrode [22]. After the addition of PS (3D + PS), a new adduct signal (1:2:2:2:2:2:2:2:1) was observed, which was ascribed to the original signal of DMPO-H overlapped with that of DMPO-OH [36]. However, the signal for DMPO-OH was weaker than that of the 2D + PS system, which was due to neutralization of the generated H* and •OH. Moreover, the DMPO-SO4 signal was too weak to be detected in the 3D + PS system, which can be ascribed to the much higher reaction rate constant between •OH and DMPO compared to between SO4•− and DMPO [41].
As seen in Figure 10, after NO3 was added to the 3D system (3D + NO3), rather than disappearing, the DMPO-H signal was slightly strengthened. This implies that the generation rate and the amount of atomic H* in the 3D system was large enough to reduce NO3. When NH4+ was added to the 3D system (3D + NH4+), the DMPO-H signal disappeared and a signal for DMPO-OH emerged. As for the 3D + PS + NH4+ system, the DMPO-OH signal weakened slightly thereafter, although it remained consistently strong. Although DMPO-OH was generated in both 3D + NH4+ and 3D + PS + NH4+ systems, the NH4+ removal efficiencies of these two systems were apparently different. NH4+ could not be effectively oxidized and removed in the 3D system, while in the 3D + PS system NH4+ was completely oxidized and removed. Although the DMPO-SO4 signal was not observed in the 3D + PS system, SO4•− and •OH can interconvert, with •OH being transferred to SO4•− via the assistance of SO42− and HSO4 (Equations (8) and (9)) [31,42]. Furthermore, the slow reaction rate constant for •OH and NH3/NH4+ led to the low level of NH3/NH4+ oxidation by •OH [26,43]. Therefore, it can be inferred that the oxidation of NH4+ occurred mainly through its reaction with SO4•− in the 3D + PS system, resulting in the NH4+-N concentration measuring below the detection limit (0.04 mg/L).
OH + SO 4 2 -     SO 4 - + OH -
OH + HSO 4 -     SO 4 - + H 2 O
As shown in Figure 10, nearly no free radical signals could be detected in the 3D + PS + NO3 system. The disappearance of the DMPO-H signal indicated hydro-reduction of NO3, while disappearance of the signals for DMPO-OH and DMPO-SO4 occurred as a result of consumption of NH4+ produced from the electro-reduction of NO3. In addition, due to the reaction of SO4•− with NH4+, more •OH was converted into SO4•−, further weakening the DMPO-OH signal.

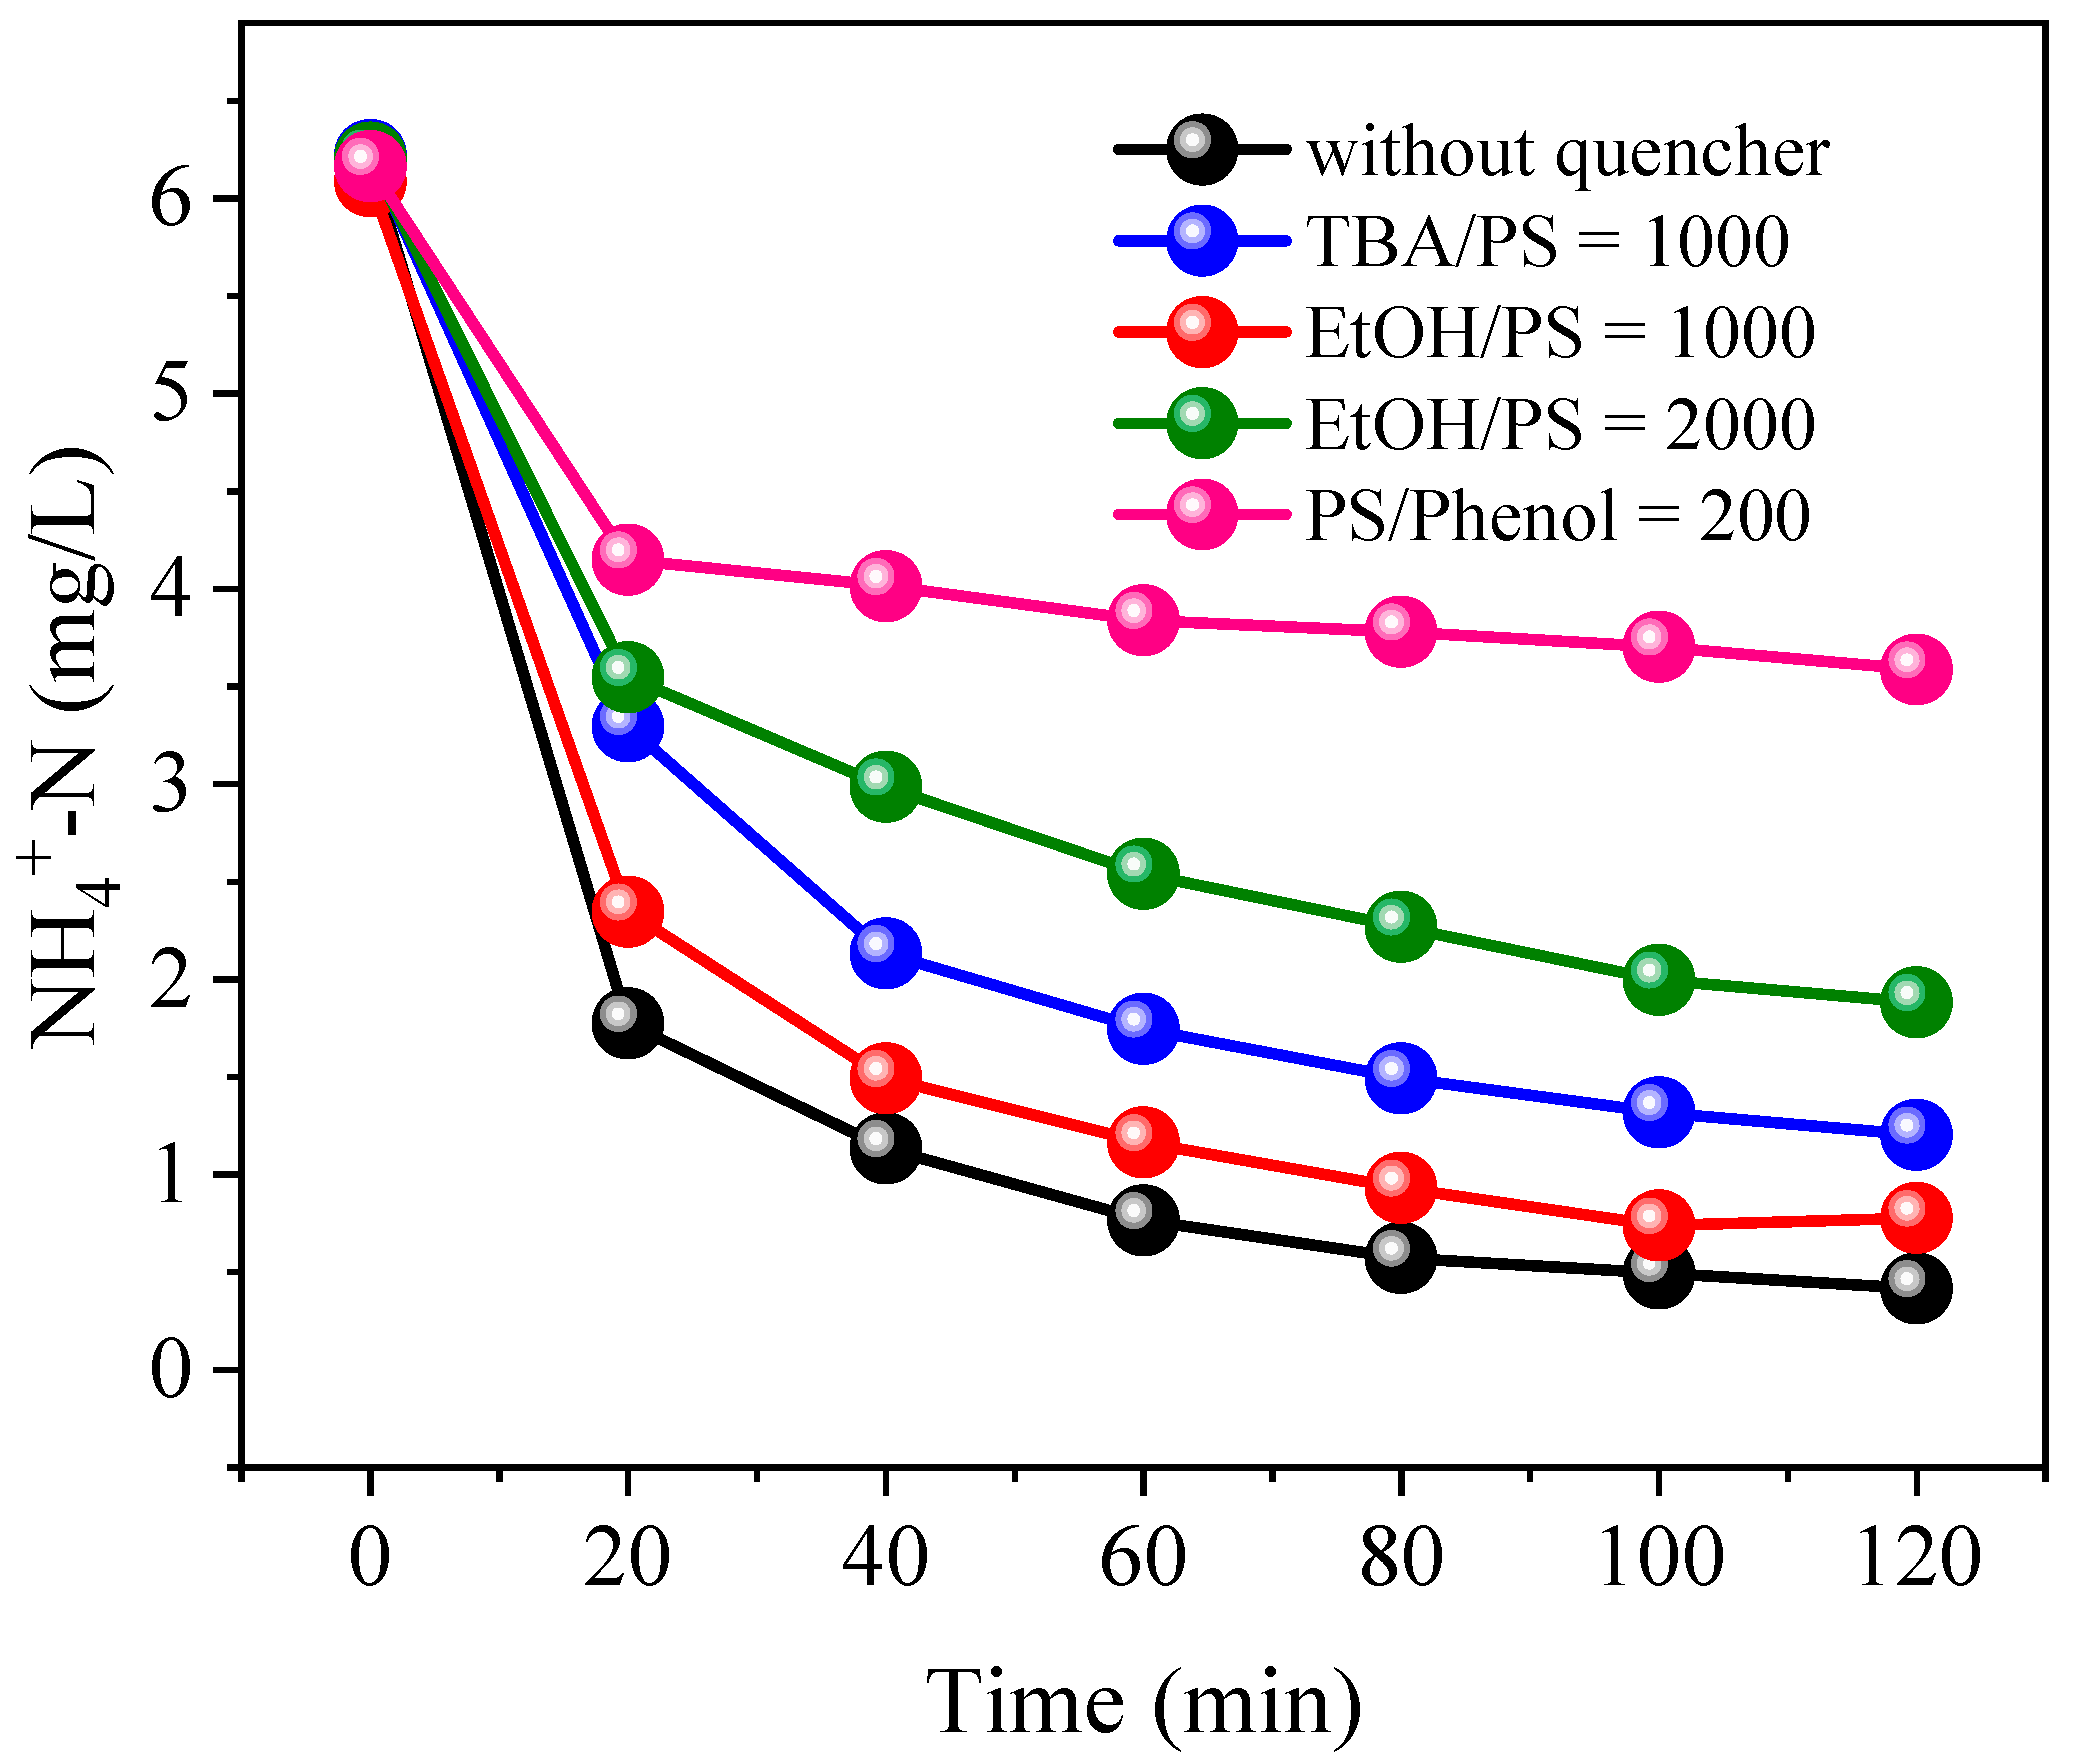
3.4. Identification of Dominant Radical

In order to establish the relative contributions from SO4•− and •OH in the oxidation of NH4+, free radical quenching experiments were conducted. TBA is typically used as a scavenger of •OH, as the second reaction rate (k) of k•OH ((3.8–7.6) × 108 M−1s−1) is about 1000-fold greater than that of k SO 4 - ((4.0–9.4) × 105 M−1s−1) [44]. EtOH and phenol can both effectively scavenge •OH and SO4•− with rate constants of k•OH/EtOH = (1.2–2.8) × 109 M−1s−1, k SO 4 - / EtOH = (1.6–7.7) × 107 M−1s−1, k•OH/phenol = 6.6 × 10⁹ M−1s−1 and k SO 4 - / phenol = 8.8 × 10⁹ M−1s−1 [42,45]. As shown in Figure 11, the NH4+ removal efficiency reached 93.3% without the addition of a quenching agent. When the molar ratio of TBA/PS was 1000:1, NH4+ removal was inhibited and reduced to 80.7%, indicating •OH had participated in the oxidation of NH4+. When the molar ratio of phenol to PS was 200:1, NH4+ removal decreased sharply to 45.3%. The number of radicals necessary for TBA to quench oxidation is approximately consistent with phenol [36]. However, the inhibition of NH4+ oxidation caused by the addition of a 200:1 molar ratio of phenol was greater than that of 1000:1 molar ratio of TBA, indicating that the contribution of SO4•− was much greater than that of •OH. Therefore, it can be concluded that SO4•− played a dominant role in the oxidation of NH4+, while the contribution from •OH was less.
Although EtOH can effectively scavenge both SO4•− and •OH, the addition of EtOH (molar ratio to PS of 1000:1) caused only a 6.0% reduction in NH4+ oxidation (Figure 11). Increasing the EtOH/PS molar ratio to 2000:1 increased the suppression of NH4+ oxidation to 23.6%. The varied inhibitory effect of the three quenching agents was related to their physicochemical properties and the formation sites of the free radicals [46]. Phenol, TBA and EtOH have varying dielectric constants of 9.78, 12.47 and 28.40, respectively [47]. Dielectric constants reflect the polarity of a substance. Since the polarity of a substance usually reflects its water solubility, the hydrophobic quality of the quenching agents can be ranked in the descending order of phenol > TBA > EtOH. Generally, hydrophobic quenching agents easily react with free radicals present on the surface of catalytic materials. Powder activated carbon has the property of highly selective adsorption of hydrophobic organic compounds [48]. Therefore, the hydrophobic phenol can more easily approach the particle electrode surface and react with surface-bound free radicals, while hydrophilic TBA and EtOH prefer to compete for •OH and SO4•− in the liquid phase [47,49]. The greater inhibitory effect of phenol compared to TBA and EtOH, indicates that a majority of •OH and SO4•− were accumulated on the surface of particle electrodes, with the free radical reaction with NH4+ mainly occurring in the boundary layer on the surface of Co/AB0.9-AC0.1.

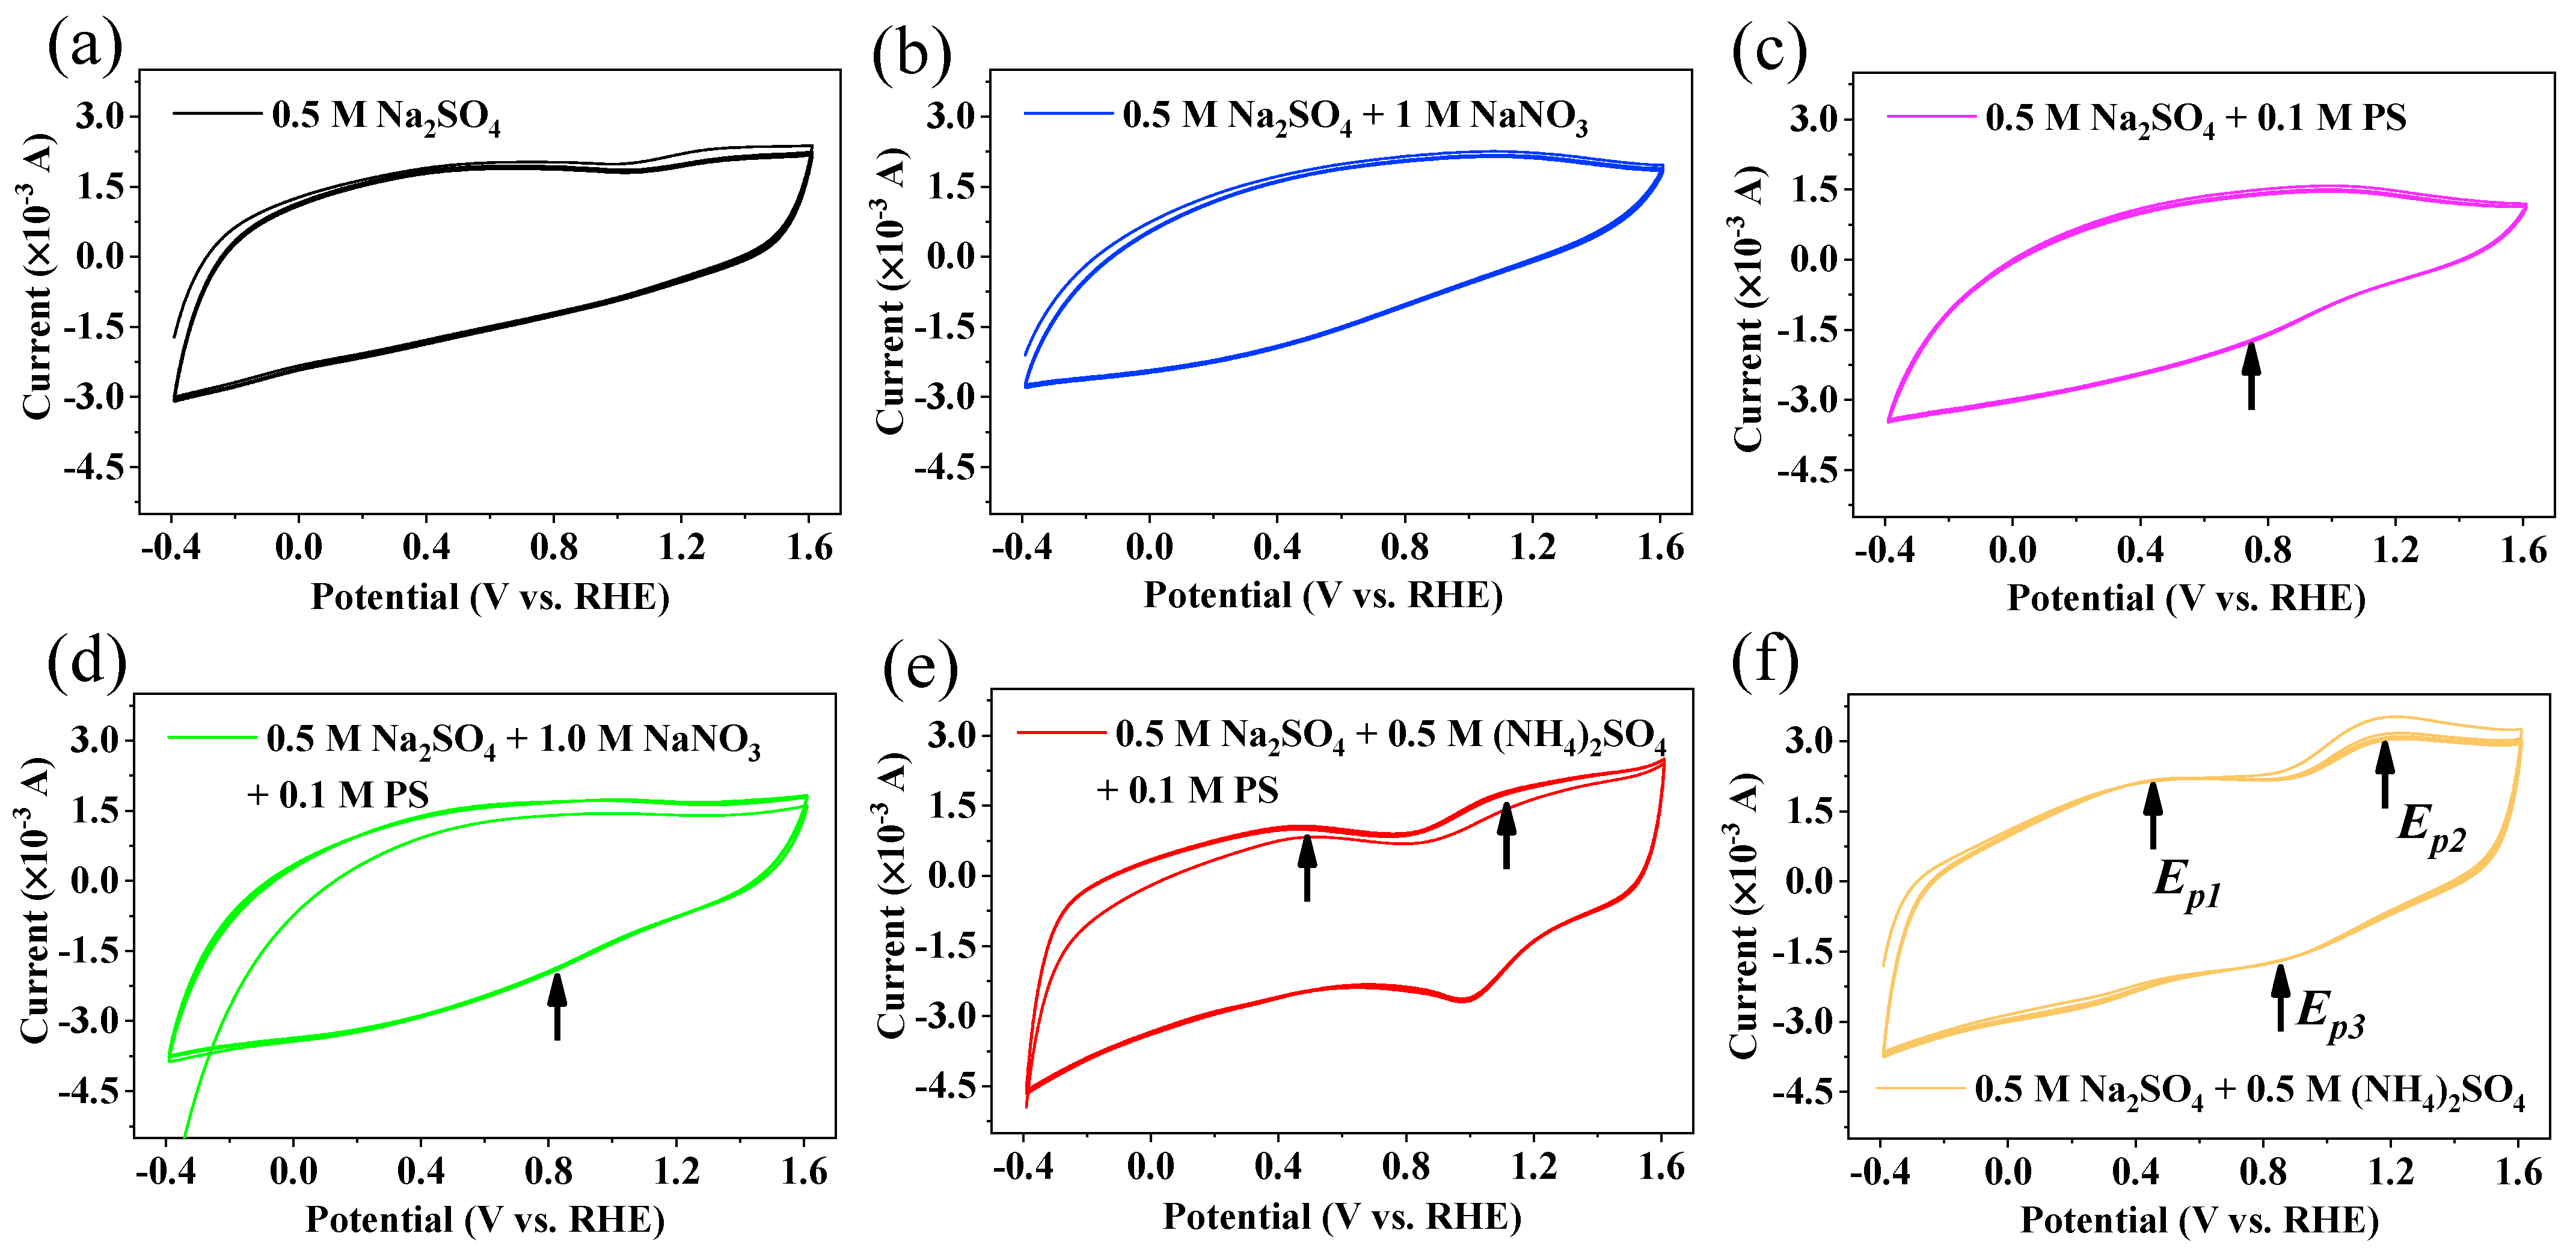
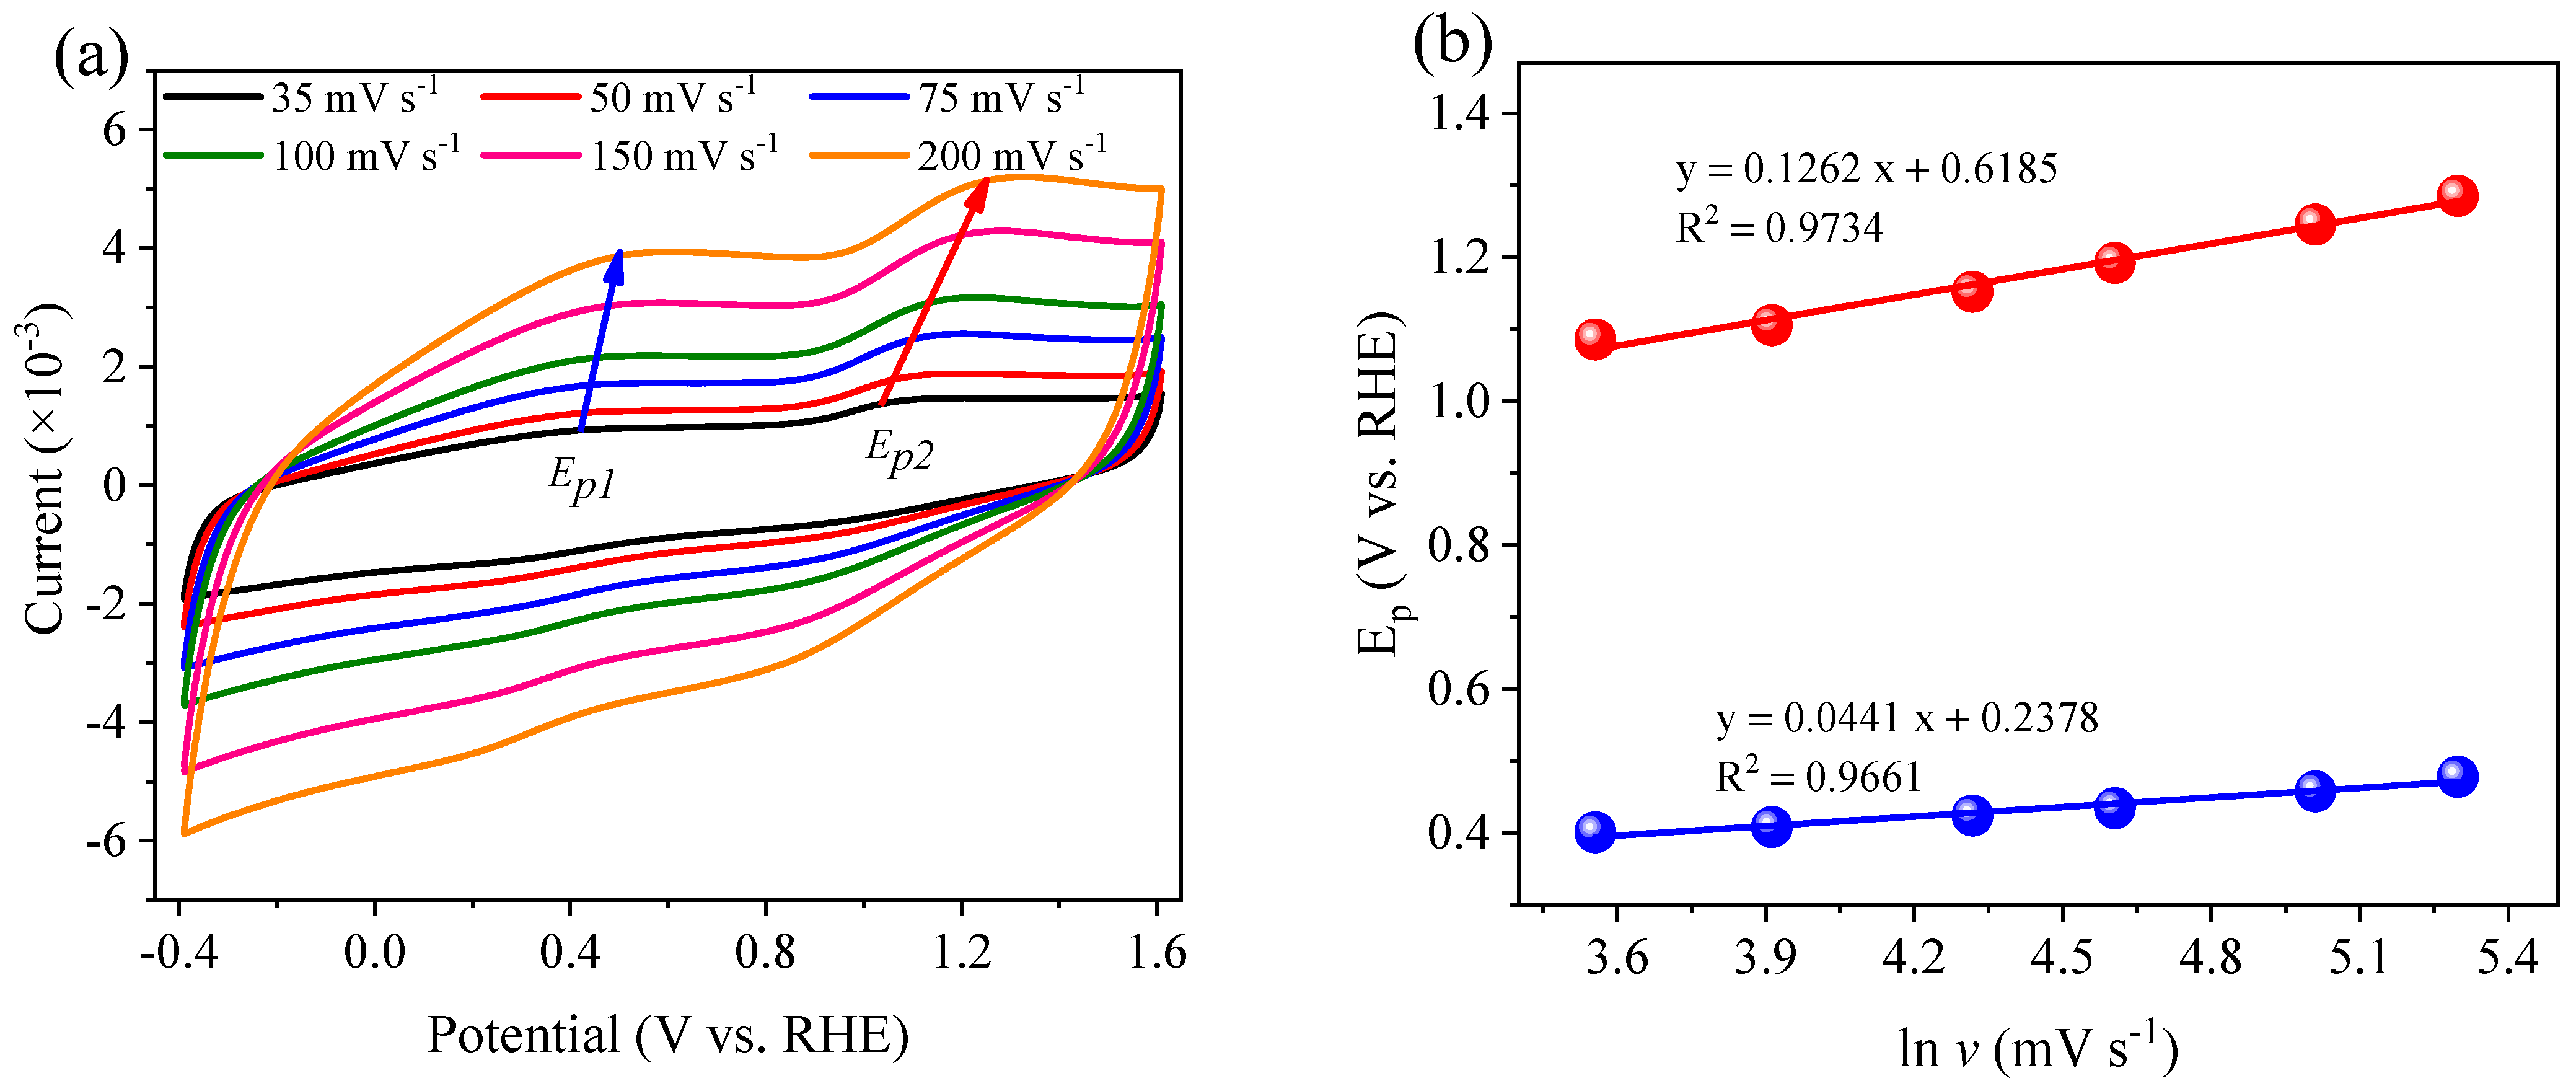
3.5. Electrocatalytic Performance of PS-Co/AC0.9-AB0.1

The PS-Co/AC0.9-AB0.1 redox process of electrocatalytic denitrification was investigated via CV analysis, with all tests based on the Na2SO4 electrolyte. As shown in Figure 12a, only one oxidation peak was observed in the Na2SO4 electrolyte at a potential (Ep) of 1.44 V, which was ascribed to the oxidation of Co0 to Co2+/Co3+ [50]. However, no peak was observed for the reduction of Co2+/Co3+ to Co0 during CV cycles, suggesting that Co2+/Co3+ might receive electrons transferred from the power source to the cathode surface through a circuit, resulting in conversion of the Co valence state [22,51]. CV curves are often used to reflect heterogeneous charge transfer from an electrode to an electroactive species, although it cannot determine charge transfer and valency changes inside the electrode [9,52]. Therefore, the conversion of Co2+/Co3+ to Co0 mainly serves as an electron shuttle. When NO3 was added to the electrolyte solution, no peak of NO3 direct reduction appeared (Figure 12b), indicating that the direct electro-reduction of NO3 was difficult, with most NO3 reduction occurring via a reaction with atomic H* adsorbed on the surface of the Co/AC0.9-AB0.1 electrode.
When PS was added to the electrolyte solution (Figure 12c), the current response decreased in anodic sweeps. In contrast, the current response increased in cathodic sweeps, indicating the occurrence of strong electron exchange at the electrode, with a weak reduction peak appearing at 0.76 V. Similarly, a reduction peak was observed at 0.83 V in the NaNO3 + PS system (Figure 12d), with the current also increasing in cathodic sweeps. These peaks were attributed to breakage of the O−O bond of PS [42,53]. The addition of PS promoted the production of atomic H* via the electrolysis of water at the cathode, resulting in an increase in electrode current. In order to establish the PS activation process, CV tests were conducted using different scan rates (v) (Figure 13). As demonstrated in Figure 13a,b, the reduction peak current gradually increased in accordance with the sweep rate, while Ep shifted negatively. Ep was found to be proportional to ln v (R2 = 0.991), indicating that PS activation was irreversible [54]. The electron transfer number (n) was calculated using the Laviron method (Equation (10)) [55,56]. Based on the CV test results (Figure 13), n value of 1.00 implies that PS activation occurred via a single electron transfer process.
E p = E o ( RT / α n F ) ln ( n F / RTk s )     ( RT / α n F ) ln v
where, α represents the electron transfer coefficient; n represents the electron transfer number; ks is the diffusion coefficient; R is the gas constant (8.315 J/(K∙mol); F is the Faraday constant (96,500 C/mol); T is the temperature; and v is the sweep rate.
As shown in Figure 12f, when (NH4)2SO4 was added to the electrolyte solution, two oxidation peaks were observed in the anodic sweeps at 0.42 V (Ep1) and 1.18 V (Ep2), with electron transfer numbers of 2.86 and 1.00, respectively (Figure 14). As shown in Equations (11)–(13), Ep1 was considered as the oxidation of NH3/NH4+ to N2, which involved a three-electron transfer reaction. When N2 was not rapidly separated from liquid, it was adsorbed by the electrode, causing a single-electron reduction reaction at 0.82 V (Ep3) in the cathodic sweep and generating NH2OH (NH3OH+) as an intermediate (Equation (14)) [7]. NH2OH can also be oxidized into N2 via single-electron transfer (Equation (15)), resulting in the Ep2 oxidation peak. When PS was added to the (NH4)2SO4 solution (Figure 12e), the peak currents ip1 and ip2 decreased from 2.18 and 3.09 mA to 1.03 and 1.74 mA, respectively. This occurred due to the generation of SO4•− and •OH accelerating the NH4+ oxidation rate near the electrode surface, resulting in a decrease of NH4+-N absorbed on the electrode surface. However, the NH4+ in solution could not diffuse to the electrode surface fast enough, weakening the direct oxidation of NH4+ and NH2OH on the electrode and therefore, reducing the current response.
NH 3 + H + NH 4 +
NH 3 + 3 OH   3 e     1 / 2 N 2 + 3 H 2 O
NH 4 +   3 e     1 / 2 N 2 + 4 H +
1 / 2 N 2 + H 2 O + 2 H + + e     NH 3 OH +
NH 2 OH + OH   e     1 / 2 N 2 + 2 H 2 O

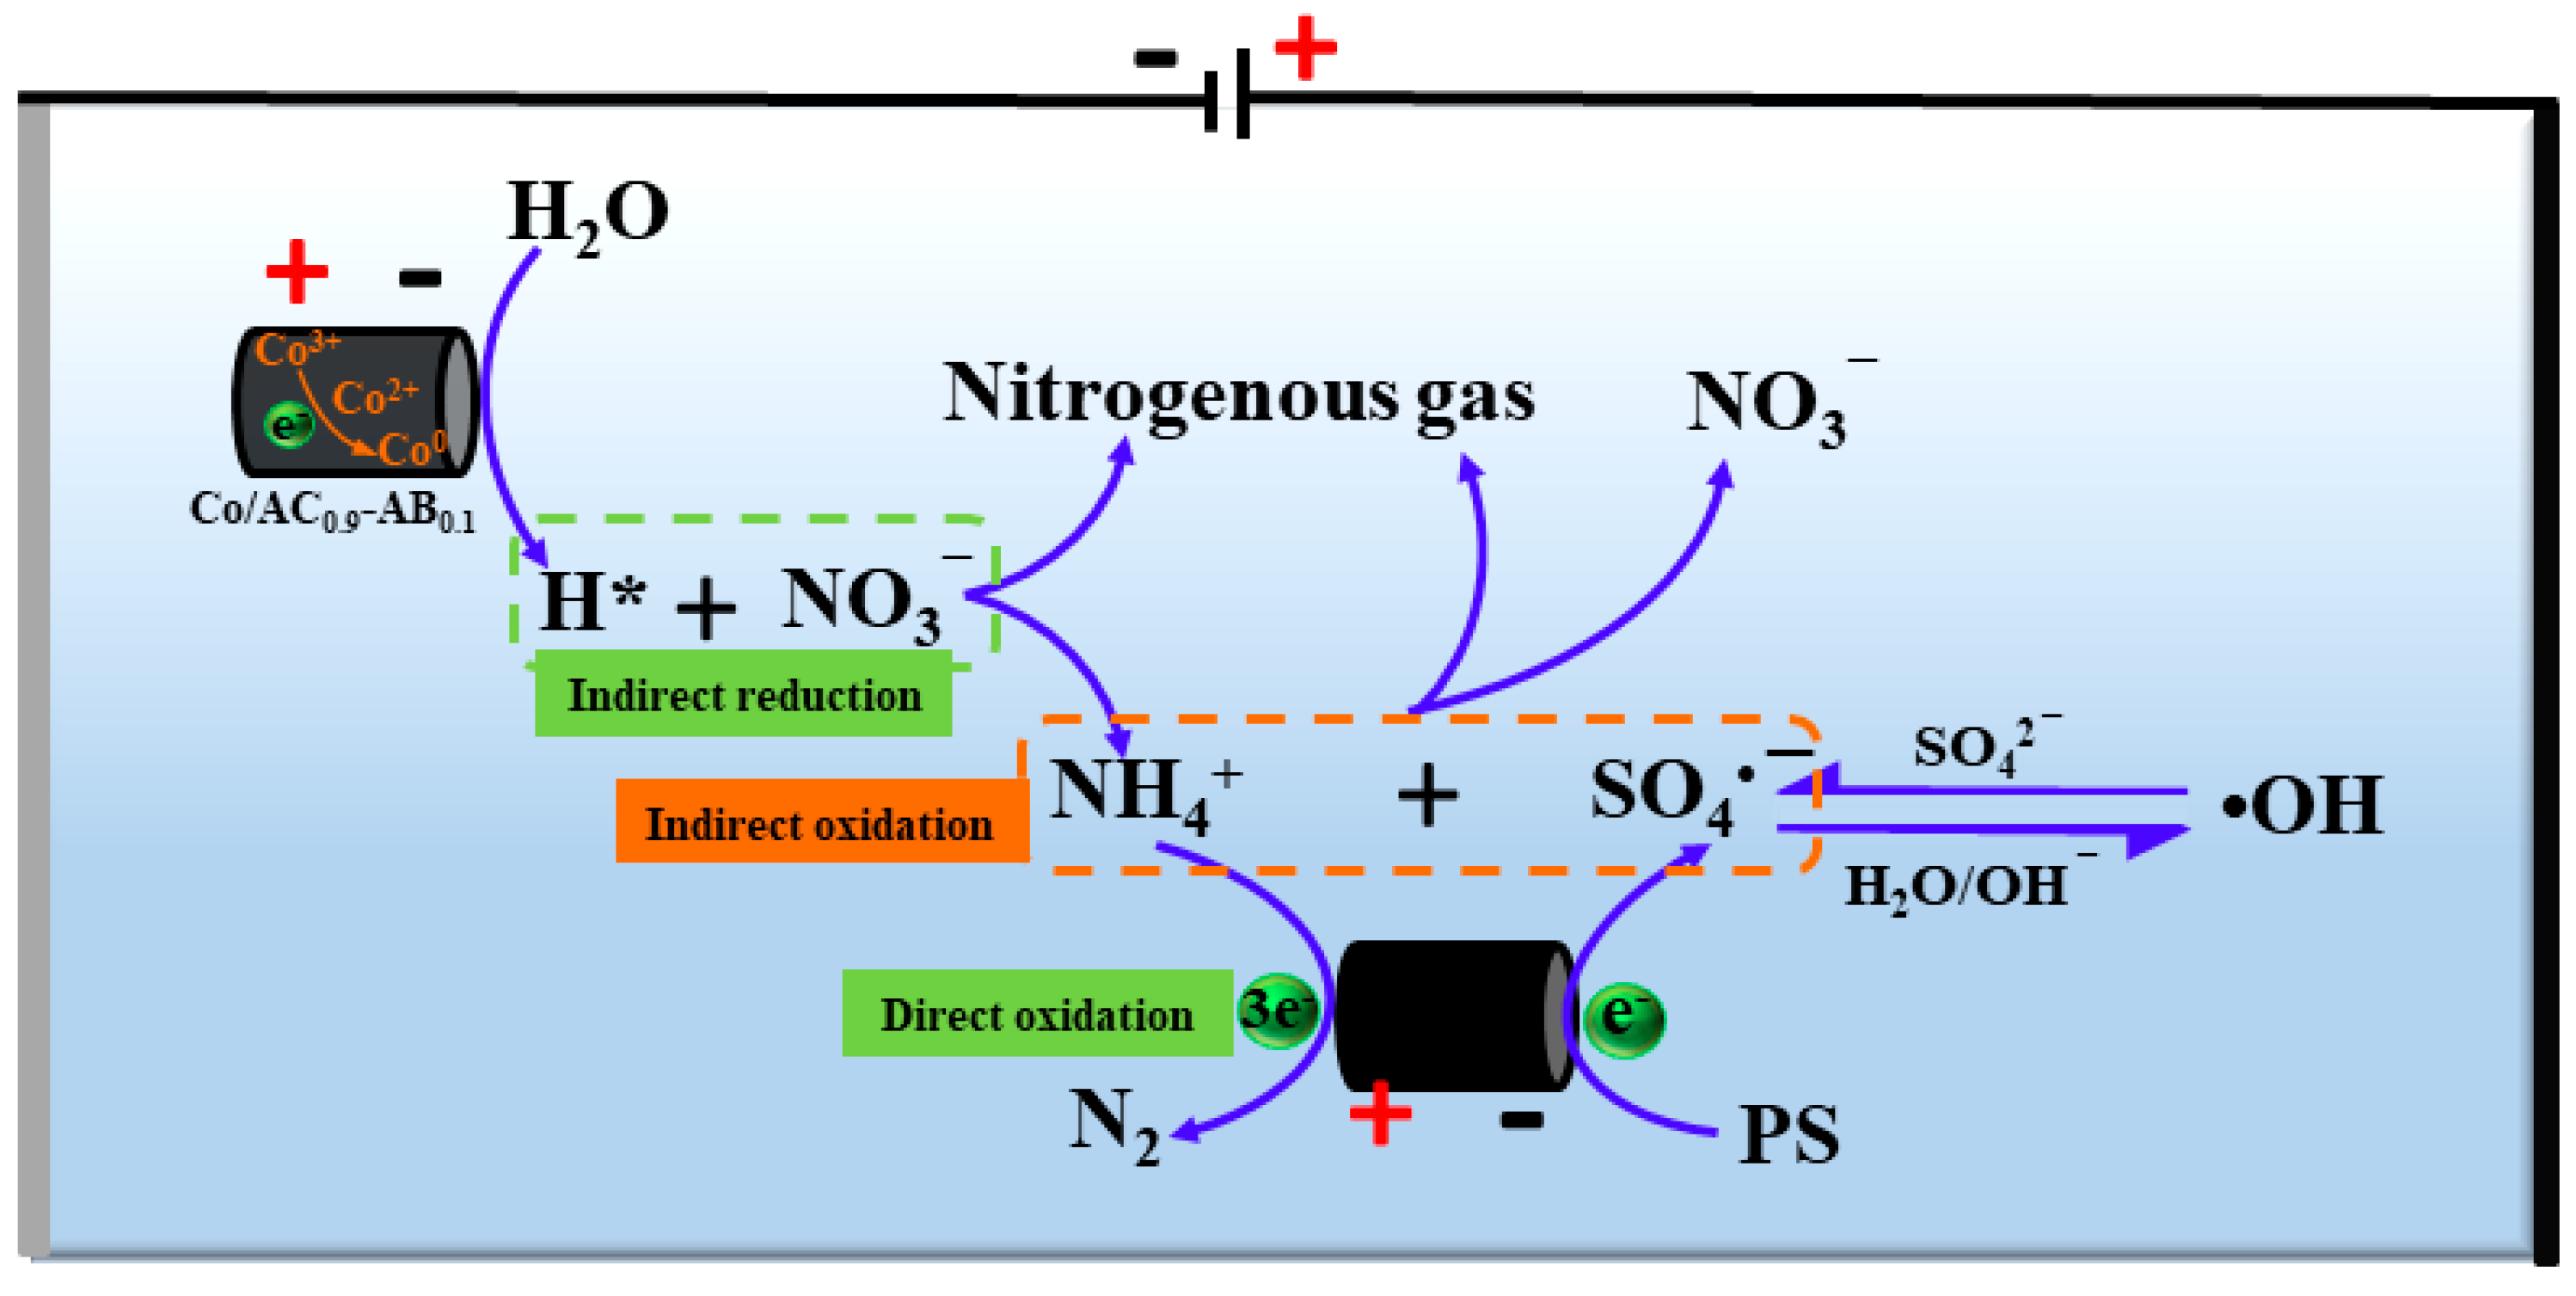
3.6. The Mechanism of N Transformation

On the basis of these results, a possible mechanism was proposed for NO3 reduction and NH4+ oxidation in the PS-Co/AC0.9-AB0.1 electrocatalytic system (Figure 15). The results of CV test showed that PS activation occurred at the cathode of particle electrodes, generating SO4•− and subsequently causing •OH to be produced from SO4•−. The process of PS activation occurred via a single electron transfer process, with an activation efficiency of >94.1%. During the electro-reduction process, in our previous study [22], we discovered that when the current was not applied, the nitrate concentration of the effluent was almost unchanged after 60 min of treatment. This implied that the adsorption did not play the main role in the removal of nitrate ions. When the current was applied, NO3 was mainly reduced by atomic H*-mediated indirect reduction, with atomic H* produced by electrolysis of H2O/H+ via Co catalysis at the particle electrodes. The addition of PS did not interfere with the reduction of NO3, instead promoting the generation of atomic H*, which further promoted the indirect reduction of NO3. The NO3 reduction products consisted of nitrogenous gas, NH4+ and residual NO3. During the process of electro-oxidation, NH3/NH4+ was directly oxidized via a three-electron reaction at the electrode, generating N2 as a product. A portion of N2 was reduced to NH2OH, which continued to undergo single-electron oxidation. The indirect oxidation of NH4+ occurred mainly via SO4•−, while •OH functioned only in assistance. Although the DMPO-OH signal was stronger than that of DMPO-SO4, the slow reaction rate constant between •OH and NH4+ resulted in a poor NH4+ removal efficiency. The consumption of SO4•− could be compensated for by the interconversion between SO4•− and •OH. The oxidation of NH4+ occurred mainly due to radicals accumulated on the surface of particle electrodes, with the products mainly consisting of nitrogenous gas and a small amount of NO3.

4. Conclusions

Oxidation of the byproduct NH4+-N can be achieved using SO4•−-based advanced oxidation under low current conditions, resulting in NH4+ being undetectable in the effluent, while also greatly reducing the TN concentration. Compared with active chlorine species, the oxidation of NH4+ via SO4•− species can improve the denitrification efficiency and reduce energy consumption of the treatment system. SO4•− can be efficiently and easily produced via the single-electron transfer process of PS on the cathodic side of Co/AC0.9-AB0.1. The PS activation process was found to promote the reduction of NO3, rather than interfere with it. The direct reduction of NO3 on the surface of Co/AC0.9-AB0.1 did not occur easily, with atomic H*-mediated indirect reduction representing the primary pathway of NO3 reduction. However, the direct oxidation of NH4+ on the Co/AC0.9-AB0.1 surface can be achieved via a three-electron transfer process, generating N2 as a product. During the indirect oxidation of NH4+, SO4•− played the dominant role while •OH acted only in assistance. Furthermore, the indirect oxidation of NH4+ was primarily accomplished by radicals that had accumulated on the surface of particle electrodes. The NH4+ oxidation products mainly consisted of nitrogenous gases, with very small amounts of NO3-N and undetectable levels of NO2-N present in the effluent. Therefore, the activation of PS using Co/AC0.9-AB0.1 particle electrodes might be a promising alternative method for oxidizing the byproduct NH4+ in the electro-reduction of NO3 and reduce TN concentration in advanced sewage treatment.

Author Contributions

Conceptualization, S.Y.; methodology, S.Y. and X.H.; formal analysis, S.Y. and X.H.; investigation, S.Y., W.Z. and Y.L.; resources: S.Y.; data curation, S.Y. and Y.L.; writing—original draft preparation, S.Y.; writing—review and editing, S.Y. and W.L.; visualization, S.Y. and X.Y.; supervision, W.L.; project administration, W.Z. and W.L.; funding acquisition, W.L. All authors have read and agreed to the published version of the manuscript.

Funding

This work was supported by the National Natural Science Foundation of China (Grant No: 51672028), National Water Pollution Control and Management Technology Major Projects of China (Grant No: 2013ZX07209001-003).

Institutional Review Board Statement

Not applicable.

Informed Consent Statement

Not applicable.

Data Availability Statement

Data generated in this study are available upon request.

Acknowledgments

The authors would like to thank the anonymous reviewers and editors for their help in the improvement of this paper.

Conflicts of Interest

The authors declare no conflict of interest.

References

  1. Ma, B.; Xu, X.; Ge, S.; Li, B.; Wei, Y.; Zhu, H.; Nan, X.; Peng, Y. Reducing carbon source consumption through a novel denitratation/anammox biofilter to remove nitrate from synthetic secondary effluent. Bioresour. Technol. 2020, 309, 123377. [Google Scholar] [CrossRef] [PubMed]
  2. Cao, S.; Du, R.; Peng, Y.; Li, B.; Wang, S. Novel two stage partial denitrification (PD)-Anammox process for tertiary nitrogen removal from low carbon/nitrogen (C/N) municipal sewage. Chem. Eng. J. 2019, 362, 107–115. [Google Scholar] [CrossRef]
  3. Mohajeri, P.; Smith, C.M.S.; Chau, H.W.; Lehto, N. ALLODUST augmented activated sludge single batch anaerobic reactor (AS-SBAnR) for high concentration nitrate removal from agricultural wastewater. Sci. Total Environ. 2021, 752, 141905. [Google Scholar] [CrossRef] [PubMed]
  4. Su, J.; Kuan, W.-F.; Liu, H.; Huang, C.P. Mode of electrochemical deposition on the structure and morphology of bimetallic electrodes and its effect on nitrate reduction toward nitrogen selectivity. Appl. Catal. B Environ. 2019, 257, 117909. [Google Scholar] [CrossRef]
  5. Chauhan, R.; Srivastava, V.C. Electrochemical denitrification of highly contaminated actual nitrate wastewater by Ti/RuO2 anode and iron cathode. Chem. Eng. J. 2020, 386, 122065. [Google Scholar] [CrossRef]
  6. Liu, Y.; Wang, J. Reduction of nitrate by zero valent iron (ZVI)-based materials: A review. Sci. Total Environ. 2019, 671, 388–403. [Google Scholar] [CrossRef]
  7. Garcia-Segura, S.; Lanzarini-Lopes, M.; Hristovski, K.; Westerhoff, P. Electrocatalytic reduction of nitrate: Fundamentals to full-scale water treatment applications. Appl. Catal. B Environ. 2018, 236, 546–568. [Google Scholar] [CrossRef]
  8. Gao, J.; Jiang, B.; Ni, C.; Qi, Y.; Bi, X. Enhanced reduction of nitrate by noble metal-free electrocatalysis on P doped three-dimensional Co3O4 cathode: Mechanism exploration from both experimental and DFT studies. Chem. Eng. J. 2020, 382, 123034. [Google Scholar] [CrossRef]
  9. Gao, J.; Jiang, B.; Ni, C.; Yuanfeng, Q.; Zhang, Y.; Oturan, N.; Oturan, M. Non-precious Co3O4-TiO2/Ti cathode based electrocatalytic nitrate reduction: Preparation, performance and mechanism. Appl. Catal. B Environ. 2019, 254, 391–402. [Google Scholar] [CrossRef]
  10. Jin, J.; Wang, Y.; Wu, Z.; Hergazy, A.; Lan, J.; Zhao, L.; Liu, X.; Chen, N.; Lin, L. Transcriptomic analysis of liver from grass carp (Ctenopharyngodon idellus) exposed to high environmental ammonia reveals the activation of antioxidant and apoptosis pathways. Fish Shellfish Immunol. 2017, 63, 444–451. [Google Scholar] [CrossRef]
  11. Martínez, J.; Ortiz, A.; Ortiz, I. State-of-the-art and perspectives of the catalytic and electrocatalytic reduction of aqueous nitrates. Appl. Catal. B Environ. 2017, 207. [Google Scholar] [CrossRef] [Green Version]
  12. Dima, G.E.; de Vooys, A.C.A.; Koper, M.T.M. Electrocatalytic reduction of nitrate at low concentration on coinage and transition-metal electrodes in acid solutions. J. Electroanal. Chem. 2003, 554–555, 15–23. [Google Scholar] [CrossRef]
  13. Dash, B.P.; Chaudhari, S. Electrochemical denitrificaton of simulated ground water. Water Res. 2005, 39, 4065–4072. [Google Scholar] [CrossRef]
  14. Reyter, D.; Belanger, D.; Roue, L. Nitrate removal by a paired electrolysis on copper and Ti/IrO2 coupled electrodes—Influence of the anode/cathode surface area ratio. Water Res. 2010, 44, 1918–1926. [Google Scholar] [CrossRef]
  15. Mácová, Z.; Bouzek, K.; Šerák, J. Electrocatalytic activity of copper alloys for NO3 reduction in a weakly alkaline solution. J. Appl. Electrochem. 2007, 37, 557–566. [Google Scholar] [CrossRef]
  16. Reyter, D.; Bélanger, D.; Roué, L. Elaboration of Cu–Pd Films by Coelectrodeposition: Application to Nitrate Electroreduction. J. Phys. Chem. C 2008, 113, 290–297. [Google Scholar] [CrossRef]
  17. Birdja, Y.Y.; Yang, J.; Koper, M.T.M. Electrocatalytic Reduction of Nitrate on Tin-modified Palladium Electrodes. Electrochim. Acta 2014, 140, 518–524. [Google Scholar] [CrossRef]
  18. Comisso, N.; Cattarin, S.; Guerriero, P.; Mattarozzi, L.; Musiani, M.; Vázquez-Gómez, L.; Verlato, E. Study of Cu, Cu-Ni and Rh-modified Cu porous layers as electrode materials for the electroanalysis of nitrate and nitrite ions. J. Solid State Electrochem. 2015, 20, 1139–1148. [Google Scholar] [CrossRef]
  19. Lan, H.; Liu, X.; Liu, H.; Liu, R.; Hu, C.; Qu, J. Efficient Nitrate Reduction in a Fluidized Electrochemical Reactor Promoted by Pd–Sn/AC Particles. Catal. Lett. 2015, 146, 91–99. [Google Scholar] [CrossRef] [Green Version]
  20. Fan, J.; Xu, H.; Lv, M.; Wang, J.; Teng, W.; Ran, X.; Gou, X.; Wang, X.; Sun, Y.; Yang, J. Mesoporous carbon confined palladium–copper alloy composites for high performance nitrogen selective nitrate reduction electrocatalysis. New J. Chem. 2017, 41, 2349–2357. [Google Scholar] [CrossRef]
  21. Wang, Q.; Huang, H.; Wang, L.; Chen, Y. Electrochemical removal of nitrate by Cu/Ti electrode coupled with copper-modified activated carbon particles at a low current density. Environ. Sci. Pollut. Res. Int. 2019, 26, 17567–17576. [Google Scholar] [CrossRef]
  22. Ye, W.; Zhang, W.; Hu, X.; Yang, S.; Liang, W. Efficient electrochemical-catalytic reduction of nitrate using Co/AC0.9-AB0.1 particle electrode. Sci. Total Environ. 2020, 732, 139245. [Google Scholar] [CrossRef]
  23. Sun, W.; Sun, Y.; Shah, K.J.; Chiang, P.C.; Zheng, H. Electrocatalytic oxidation of tetracycline by Bi-Sn-Sbγ-Al2O3 three-dimensional particle electrode. J. Hazard. Mater. 2019, 370, 24–32. [Google Scholar] [CrossRef]
  24. Mandal, P.; Yadav, M.K.; Gupta, A.K.; Dubey, B.K. Chlorine mediated indirect electro-oxidation of ammonia using non-active PbO2 anode: Influencing parameters and mechanism identification. Sep. Purif. Technol. 2020, 247, 116910. [Google Scholar] [CrossRef]
  25. Devi, P.; Dalai, A.K. Implications of breakpoint chlorination on chloramines decay and disinfection by-products formation in brine solution. Desalination 2021, 504, 114961. [Google Scholar] [CrossRef]
  26. Huang, L.; Li, L.; Dong, W.; Liu, Y.; Hou, H. Removal of Ammonia by OH Radical in Aqueous Phase. Environ. Sci.Technol. 2008, 42, 8070–8075. [Google Scholar] [CrossRef]
  27. Wacławek, S.; Lutze, H.V.; Grübel, K.; Padil, V.V.T.; Černík, M.; Dionysiou, D.D. Chemistry of persulfates in water and wastewater treatment: A review. Chem. Eng. J. 2017, 330, 44–62. [Google Scholar] [CrossRef]
  28. Van Berkel, K.Y.; Russell, G.T.; Gilbert, R.G. The dissociation rate coefficient of persulfate in emulsion polymerization systems. Polymer 2006, 47, 4667–4675. [Google Scholar] [CrossRef]
  29. Du, X.; Zhou, M. Strategies to enhance catalytic performance of metal-organic frameworks in sulfate radical-based advanced oxidation processes for organic pollutants removal. Chem. Eng. J. 2021, 403, 126346. [Google Scholar] [CrossRef]
  30. Huang, J.; Zhang, H. Mn-based catalysts for sulfate radical-based advanced oxidation processes: A review. Environ. Int. 2019, 133, 105141. [Google Scholar] [CrossRef]
  31. Giannakis, S.; Lin, K.-Y.A.; Ghanbari, F. A review of the recent advances on the treatment of industrial wastewaters by Sulfate Radical-based Advanced Oxidation Processes (SR-AOPs). Chem. Eng. J. 2021, 406, 127083. [Google Scholar] [CrossRef]
  32. Chen, C.; Feng, H.; Deng, Y. Re-evaluation of sulfate radical based-advanced oxidation processes (SR-AOPs) for treatment of raw municipal landfill leachate. Water Res. 2019, 153, 100–107. [Google Scholar] [CrossRef] [PubMed]
  33. Zhang, F.; Sun, Z.; Cui, J. Research on the mechanism and reaction conditions of electrochemical preparation of persulfate in a split-cell reactor using BDD anode. RSC Adv. 2020, 10, 33928–33936. [Google Scholar] [CrossRef]
  34. Qing, G.; Ghazfar, R.; Jackowski, S.T.; Habibzadeh, F.; Ashtiani, M.M.; Chen, C.P.; Smith, M.R., 3rd; Hamann, T.W. Recent Advances and Challenges of Electrocatalytic N2 Reduction to Ammonia. Chem. Rev. 2020, 120, 5437–5516. [Google Scholar] [CrossRef]
  35. Liang, C.; Huang, C.-F.; Mohanty, N.; Kurakalva, R.M. A rapid spectrophotometric determination of persulfate anion in ISCO. Chemosphere 2008, 73, 1540–1543. [Google Scholar] [CrossRef]
  36. Zhang, W.; He, Y.; Li, C.; Hu, X.; Yang, S.; You, X.; Liang, W. Persulfate activation using Co/AC particle electrodes and synergistic effects on humic acid degradation. Appl. Catal. B Environ. 2021, 285, 119848. [Google Scholar] [CrossRef]
  37. Yan, Z.; Zheng, X.; Fan, J.; Zhang, Y.; Wang, S.; Zhang, T.; Sun, Q.; Huang, Y. China national water quality criteria for the protection of freshwater life: Ammonia. Chemosphere 2020, 251, 126379. [Google Scholar] [CrossRef]
  38. Liu, J.; Jiang, S.; Chen, D.; Dai, G.; Wei, D.; Shu, Y. Activation of persulfate with biochar for degradation of bisphenol A in soil. Chem. Eng. J. 2020, 381, 122637. [Google Scholar] [CrossRef]
  39. Huang, W.; Xiao, S.; Zhong, H.; Yan, M.; Yang, X. Activation of persulfates by carbonaceous materials: A review. Chem. Eng. J. 2021, 418, 129297. [Google Scholar] [CrossRef]
  40. Wang, X.-H.; Wang, X.; Huppes, G.; Heijungs, R.; Ren, N.-Q. Environmental implications of increasingly stringent sewage discharge standards in municipal wastewater treatment plants: Case study of a cool area of China. J. Clean. Prod. 2015, 94, 278–283. [Google Scholar] [CrossRef]
  41. Chen, L.; Hu, X.; Cai, T.; Yang, Y.; Zhao, R.; Liu, C.; Li, A.; Jiang, C. Degradation of Triclosan in soils by thermally activated persulfate under conditions representative of in situ chemical oxidation (ISCO). Chem. Eng. J. 2019, 369, 344–352. [Google Scholar] [CrossRef]
  42. Qi, F.; Zeng, Z.; Wen, Q.; Huang, Z. Enhanced organics degradation by three-dimensional (3D) electrochemical activation of persulfate using sulfur-doped carbon particle electrode: The role of thiophene sulfur functional group and specific capacitance. J. Hazard. Mater. 2021, 416, 125810. [Google Scholar] [CrossRef]
  43. Zhu, X.; Nanny, M.; Butler, E. Effects of pH and Catalyst Concentration on Photocatalytic Oxidation of Aqueous Ammonia and Nitrite in Titanium Dioxide Suspensions. Environ.Sci.Technol. 2005, 39, 3784–3791. [Google Scholar] [CrossRef]
  44. Gong, C.; Chen, F.; Yang, Q.; Luo, K.; Yao, F.; Wang, S.; Wang, X.; Wu, J.; Li, X.; Wang, D.; et al. Heterogeneous activation of peroxymonosulfate by Fe-Co layered doubled hydroxide for efficient catalytic degradation of Rhoadmine B. Chem. Eng. J. 2017, 321, 222–232. [Google Scholar] [CrossRef]
  45. Yang, S.; Yang, X.; Shao, X.; Niu, R.; Wang, L. Activated carbon catalyzed persulfate oxidation of Azo dye acid orange 7 at ambient temperature. J. Hazard. Mater. 2011, 186, 659–666. [Google Scholar] [CrossRef]
  46. Xu, Y.; Lin, H.; Li, Y.; Zhang, H. The mechanism and efficiency of MnO2 activated persulfate process coupled with electrolysis. Sci. Total Environ. 2017, 609, 644–654. [Google Scholar] [CrossRef]
  47. Yan, S.; Xiong, W.; Xing, S.; Shao, Y.; Guo, R.; Zhang, H. Oxidation of organic contaminant in a self-driven electro/natural maghemite/peroxydisulfate system: Efficiency and mechanism. Sci. Total Environ. 2017, 599–600, 1181–1190. [Google Scholar] [CrossRef]
  48. Oh, H.K.; Takizawa, S.; Ohgaki, S.; Katayama, H.; Oguma, K.; Yu, M.J. Removal of organics and viruses using hybrid ceramic MF system without draining PAC. Desalination 2007, 202, 191–198. [Google Scholar] [CrossRef]
  49. Liu, Y.; Chen, X.; Yang, Y.; Feng, Y.; Wu, D.; Mao, S. Activation of persulfate with metal–organic framework-derived nitrogen-doped porous Co@C nanoboxes for highly efficient p-Chloroaniline removal. Chem. Eng. J. 2019, 358, 408–418. [Google Scholar] [CrossRef]
  50. Qian, L.; Gu, L.; Yuan, H.; Xiao, D. Direct growth of NiCo2O4 nanostructures on conductive substrates with enhanced electrocatalytic activity and stability for methanol oxidation. Nanoscale 2013, 5, 7388–7396. [Google Scholar] [CrossRef]
  51. Wang, H.; Qing, C.; Guo, J.; Aref, A.A.; Sun, D.; Wang, B.; Tang, Y. Highly conductive carbon–CoO hybrid nanostructure arrays with enhanced electrochemical performance for asymmetric supercapacitors. J. Mater. Chem. A 2014, 2, 11776–11783. [Google Scholar] [CrossRef]
  52. Li, A.; Zhao, X.; Hou, Y.; Liu, H.; Wu, L.; Qu, J. The electrocatalytic dechlorination of chloroacetic acids at electrodeposited Pd/Fe-modified carbon paper electrode. Appl. Catal. B Environ. 2012, 111–112, 628–635. [Google Scholar] [CrossRef]
  53. Duan, X.; Su, C.; Zhou, L.; Sun, H.; Suvorova, A.; Odedairo, T.; Zhu, Z.; Shao, Z.; Wang, S. Surface controlled generation of reactive radicals from persulfate by carbocatalysis on nanodiamonds. Appl. Catal. B Environ. 2016, 194, 7–15. [Google Scholar] [CrossRef]
  54. Hu, X.; Yang, S.; You, X.; Zhang, W.; Liu, Y.; Liang, W. Electrocatalytic Decomplexation of Cu-EDTA and Simultaneous Recovery of Cu with Ni/GO-PAC Particle Electrode. Chem. Eng. J. 2021, 428, 131468. [Google Scholar] [CrossRef]
  55. Laviron, E. General expression of the linear potential sweep voltammogram in the case of diffusionless electrochemical systems. J. Electroanal. Chem. 1979, 101, 19–28. [Google Scholar] [CrossRef]
  56. Luong, J.H.T.; Glennon, J.D.; Gedanken, A.; Vashist, S.K. Achievement and assessment of direct electron transfer of glucose oxidase in electrochemical biosensing using carbon nanotubes, graphene, and their nanocomposites. Microchim. Acta 2016, 184, 369–388. [Google Scholar] [CrossRef]
Figure 1. The schematic diagram for ammonia removal using electric activation of persulfate during the nitrate electro-reduction process. Co/AC0.9-AB0.1 particle electrodes are packed between a pair of anode and cathode mesh plates.
Ijerph 19 03270 g001
Figure 2. Variation of NO3-N concentration under currents of 0.1 A (a), 0.2 A (b), 0.3 A (c), and 0.4 A (d). The dosage of PS and Cl were all set at 1.5–5.0 mM. Initial NO3-N was 20 mg/L. The 10.0 mM Na2SO4 was used as electrolyte.
Ijerph 19 03270 g002
Figure 3. Variation of NH4+-N concentration under currents of 0.1 A (a), 0.2 A (b), 0.3 A (c), and 0.4 A (d). The dosage of PS and Cl were all set at 1.5–5.0 mM. Initial NO3-N was 20.0 mg/L. The 10.0 mM Na2SO4 was used as electrolyte.
Ijerph 19 03270 g003
Figure 4. Activation efficiency of PS under currents of 0.1 A (a), 0.2 A (b), 0.3 A (c), and 0.4 A (d). Initial PS was 1.5, 3.0 and 5.0 mM. The 10.0 mM Na2SO4 was used as electrolyte.
Ijerph 19 03270 g004
Figure 5. Variation of TN concentration under currents of 0.1 A (a), 0.2 A (b), 0.3 A (c), and 0.4 A (d). The dosage of PS and Cl were all set at 1.5–5.0 mM. Initial NO3-N was 20 mg/L. The 10.0 mM Na2SO4 was used as electrolyte.
Ijerph 19 03270 g005
Figure 6. Variation of NO3-N, NO2-N and NH4+-N concentration under 0.3 A with 5.0 mM PS. Initial NH4+-N was 6.0 mg/L. The 10.0 mM Na2SO4 was used as electrolyte.
Ijerph 19 03270 g006
Figure 7. Effects of PO43− on the removal of NO3-N, NH4+-N and TN. Initial NO3-N was 20.0 mg/L. Current = 0.3 A. PS = 5.0 mM. The 10.0 mM Na2SO4 was used as electrolyte.
Ijerph 19 03270 g007
Figure 8. Effects of CO32− on the removal of NO3-N, NH4+-N and TN. Initial NO3-N was 20.0 mg/L, current = 0.3 A, PS = 5.0 mM. The 10.0 mM Na2SO4 was used as electrolyte.
Ijerph 19 03270 g008
Figure 9. Effects of humic acid on the removal of NO3-N, NH4+-N and TN. Initial NO3-N was 20.0 mg/L, current = 0.3 A, PS = 5.0 mM. The 10.0 mM Na2SO4 was used as electrolyte.
Ijerph 19 03270 g009aIjerph 19 03270 g009b
Figure 10. ESR spectra of electrolysis using DMPO spin-trapping under different systems. Current = 0.3 A, PS = 5.0 mM, DMPO = 50.0 mM.
Ijerph 19 03270 g010
Figure 11. Variation of NH4+-N concentrations under PS-Co/AC0.9-AB0.1 system with different molar ratios of TBA/PS, EtOH/PS and phenol/PS. Current = 0.3 A. PS = 5.0 mM. HRT = 60 min. Initial NH4+-N = 6.0 mg/L. The 10.0 mM Na2SO4 was used as electrolyte.
Ijerph 19 03270 g011
Figure 12. Cyclic voltammetry curves of Co/AC0.9−AB0.1 particle electrodes under different electrolyte. 0.5 M Na2SO4 (a), 0.5M Na2SO4 + 1 M NaNO3 (b), 0.5 M Na2SO4 + 0.1 M PS (c), 0.5 M Na2SO4 + 1.0 M NaNO3 + 0.1 M PS (d), 0.5 MNa2SO4 + 0.5 M (NH4)2SO4 + 0.1 M PS (e) and 0.5 M Na2SO4 + 0.5 (NH4)2SO4 (f). Scan rate = 100 mV/s. Scan for 5 cycles until stable.
Ijerph 19 03270 g012
Figure 13. Cyclic voltammetry curves of Co/AC0.9−AB0.1 in the 0.1 M Na2SO4 + 0.1 M PS at a different scan rate (a), and corresponding plot of peak potentials versus the natural logarithm of scan rate in range 10–100 mV s−1 (b).
Ijerph 19 03270 g013
Figure 14. Cyclic voltammetry curves of Co/AC0.9-AB0.1 in the 0.1 M Na2SO4 + 0.5 M (NH4)2SO4 at a different scan rate (a), and corresponding plot of peak potentials versus the natural logarithm of scan rates in range 35–200 mV s−1 (b).
Ijerph 19 03270 g014
Figure 15. Proposed mechanism of N transformation in PS-Co/AC0.9-AB0.1 system.
Ijerph 19 03270 g015
Publisher’s Note: MDPI stays neutral with regard to jurisdictional claims in published maps and institutional affiliations.

