
Comorbidity Prevalence in Prediabetes and Type 2 Diabetes: A Cross-Sectional Study in a Predominantly Hispanic U.S.–Mexico Border Population

 ,
,  ,
,
Abstract
:1. Introduction
2. Materials and Methods
3. Results
4. Discussion
5. Conclusions
Author Contributions
Funding
Institutional Review Board Statement
Informed Consent Statement
Data Availability Statement
Conflicts of Interest
References
- Parker, E.D.; Lin, J.; Mahoney, T.; Ume, N.; Yang, G.; Gabbay, R.A.; ElSayed, N.A.; Bannuru, R.R. Economic Costs of Diabetes in the U.S. in 2022. Diabetes Care 2024, 47, 26–43. [Google Scholar] [CrossRef] [PubMed]
- CDC. National Diabetes Statistics Report. 15 May 2024. Available online: https://www.cdc.gov/diabetes/php/data-research/index.html (accessed on 3 April 2025).
- CDC. The Surprising Truth About Prediabetes. Centers for Disease Control and Prevention. 15 May 2024. Available online: https://www.cdc.gov/diabetes/prevention-type-2/truth-about-prediabetes.html (accessed on 3 April 2025).
- Cai, X.; Zhang, Y.; Li, M.; Wu, J.H.; Mai, L.; Li, J.; Yang, Y.; Hu, Y.; Huang, Y. Association between prediabetes and risk of all cause mortality and cardiovascular disease: Updated meta-analysis. BMJ 2020, 370, m2297. [Google Scholar] [CrossRef]
- Mutie, P.M.; Pomares-Millan, H.; Atabaki-Pasdar, N.; Jordan, N.; Adams, R.; Daly, N.L.; Tajes, J.F.; Giordano, G.N.; Franks, P.W. An investigation of causal relationships between prediabetes and vascular complications. Nat. Commun. 2020, 11, 4592. [Google Scholar] [CrossRef]
- Rooney, M.R.; Rawlings, A.M.; Pankow, J.S.; Tcheugui, J.B.E.; Coresh, J.; Sharrett, A.R.; Selvin, E. Risk of Progression to Diabetes Among Older Adults With Prediabetes. JAMA Intern. Med. 2021, 181, 511–519. [Google Scholar] [CrossRef] [PubMed]
- Schlesinger, S.; Neuenschwander, M.; Barbaresko, J.; Lang, A.; Maalmi, H.; Rathmann, W.; Roden, M.; Herder, C. Prediabetes and risk of mortality, diabetes-related complications and comorbidities: Umbrella review of meta-analyses of prospective studies. Diabetologia 2022, 65, 275–285. [Google Scholar] [CrossRef]
- Schneider, A.L.; Kalyani, R.R.; Golden, S.; Stearns, S.C.; Wruck, L.; Yeh, H.C.; Coresh, J.; Selvin, E. Diabetes and Prediabetes and Risk of Hospitalization: The Atherosclerosis Risk in Communities (ARIC) Study. Diabetes Care 2016, 39, 772–779. [Google Scholar] [CrossRef]
- Wen, C.P.; Cheng, T.Y.D.; Tsai, S.P.; Hsu, H.L.; Wang, S.L. Increased Mortality Risks of Pre-Diabetes (Impaired Fasting Glucose) in Taiwan. Diabetes Care 2005, 28, 2756–2761. [Google Scholar] [CrossRef]
- Nowakowska, M.; Zghebi, S.S.; Ashcroft, D.M.; Buchan, I.; Chew-Graham, C.; Holt, T.; Mallen, C.; Van Marwijk, H.; Peek, N.; Perera-Salazar, R.; et al. The comorbidity burden of type 2 diabetes mellitus: Patterns, clusters and predictions from a large English primary care cohort. BMC Med. 2019, 17, 145. [Google Scholar] [CrossRef] [PubMed]
- Ali, M.K.; Bullard, K.M.; Saydah, S.; Imperatore, G.; Gregg, E.W. Cardiovascular and renal burdens of prediabetes in the USA: Analysis of data from serial cross-sectional surveys, 1988–2014. Lancet Diabetes Endocrinol. 2018, 6, 392–403. [Google Scholar] [CrossRef]
- Eilat-Tsanani, S.; Margalit, A.; Golan, L.N. Occurrence of comorbidities in newly diagnosed type 2 diabetes patients and their impact after 11 years’ follow-up. Sci. Rep. 2021, 11, 11071. [Google Scholar] [CrossRef]
- Iglay, K.; Hannachi, H.; Howie, P.J.; Xu, J.; Li, X.; Engel, S.S.; Moore, L.M.; Rajpathak, S. Prevalence and co-prevalence of comorbidities among patients with type 2 diabetes mellitus. Curr. Med. Res. Opin. 2016, 32, 1243–1252. [Google Scholar] [CrossRef] [PubMed]
- Safieddine, B.; Sperlich, S.; Epping, J.; Lange, K.; Geyer, S. Development of comorbidities in type 2 diabetes between 2005 and 2017 using German claims data. Sci. Rep. 2021, 11, 11149. [Google Scholar] [CrossRef] [PubMed]
- Nakagami, T.; the DECODA Study Group. Hyperglycaemia and mortality from all causes and from cardiovascular disease in five populations of Asian origin. Diabetologia 2004, 47, 385–394. [Google Scholar] [CrossRef] [PubMed]
- Saydah, S.H.; Loria, C.M.; Eberhardt, M.S.; Brancati, F.L. Subclinical States of Glucose Intolerance and Risk of Death in the U.S. Diabetes Care 2001, 24, 447–453. [Google Scholar] [CrossRef]
- Veugen, M.G.J.; Onete, V.G.; Henry, R.M.A.; Rocca, H.-P.B.-L.; Koster, A.; Dagnelie, P.C.; Schaper, N.C.; Sep, S.J.S.; van der Kallen, C.J.H.; van Boxtel, M.P.J.; et al. Health burden in type 2 diabetes and prediabetes in The Maastricht Study. Sci. Rep. 2022, 12, 7337. [Google Scholar] [CrossRef]
- Iranfar, N.; Smith, T.C. When Should “Pre” Carry as Much Weight in the Diabetes Comorbidity Debate? Insights from a Population-Based Survey. Prev. Chronic Dis. 2018, 15, E36. [Google Scholar] [CrossRef]
- CDC. ICD-10-CM. 7 June 2024. Available online: https://www.cdc.gov/nchs/icd/icd-10-cm/index.html (accessed on 3 April 2025).
- Diabetes, Now What? Available online: https://pdnhf.org/health-articles/diabetes-now-what (accessed on 3 April 2025).
- Hackl, C.M.; Lee, W.C.; Sallam, H.S.; Jneid, H.; Campbell, K.M.; Serag, H. Racial Disparities in Selected Complications and Comorbidities among People with Type 2 Diabetes. Healthcare 2024, 12, 846. [Google Scholar] [CrossRef]
- Spanakis, E.K.; Golden, S.H. Race/Ethnic Difference in Diabetes and Diabetic Complications. Curr. Diabetes Rep. 2013, 13, 814–823. [Google Scholar] [CrossRef]
- Zhu, Y.; Sidell, M.A.; Arterburn, D.; Daley, M.F.; Desai, J.; Fitzpatrick, S.L.; Horberg, M.A.; Koebnick, C.; McCormick, E.; Oshiro, C.; et al. Racial/Ethnic Disparities in the Prevalence of Diabetes and Prediabetes by BMI: Patient Outcomes Research To Advance Learning (PORTAL) Multisite Cohort of Adults in the U.S. Diabetes Care 2019, 42, 2211–2219. [Google Scholar] [CrossRef]
- Akaike, H. Akaike, H. A New Look at the Statistical Model Identification. In Selected Papers of Hirotugu Akaike; Parzen, E., Tanabe, K., Kitagawa, G., Eds.; Springer: Berlin/Heidelberg, Germany, 1998; pp. 215–222. [Google Scholar] [CrossRef]
- Galaviz, K.I.; Weber, M.B.; Suvada, K.; Gujral, U.P.; Wei, J.; Merchant, R.; Dharanendra, S.; Haw, J.S.; Narayan, K.V.; Ali, M.K. Interventions for Reversing Prediabetes: A Systematic Review and Meta-Analysis. Am. J. Prev. Med. 2022, 62, 614–625. [Google Scholar] [CrossRef]
- Golden, S.H.; Maruthur, N.; Mathioudakis, N.; Spanakis, E.; Rubin, D.; Zilbermint, M.; Hill-Briggs, F. The Case for Diabetes Population Health Improvement: Evidence-Based Programming for Population Outcomes in Diabetes. Curr. Diabetes Rep. 2017, 17, 51. [Google Scholar] [CrossRef] [PubMed]
- Malin, S.K.; Gerber, R.; Chipkin, S.R.; Braun, B. Independent and combined effects of exercise training and metformin on insulin sensitivity in individuals with prediabetes. Diabetes Care 2012, 35, 131–136. [Google Scholar] [CrossRef] [PubMed]
- Pan, X.-R.; Li, G.-W.; Hu, Y.-H.; Yang, W.-Y.; An, Z.-X.; Hu, Z.-X.; Lin, J.; Xiao, J.-Z.; Cao, H.-B.; Liu, P.-A.; et al. Effects of diet and exercise in preventing NIDDM in people with impaired glucose tolerance. The Da Qing IGT and Diabetes Study. Diabetes Care 1997, 20, 537–544. [Google Scholar] [CrossRef]
- Ramachandran, A.; Snehalatha, C.; Mary, S.; Mukesh, B.; Bhaskar, A.D.; Vijay, V.; Indian Diabetes Prevention Programme (IDPP). The Indian Diabetes Prevention Programme shows that lifestyle modification and metformin prevent type 2 diabetes in Asian Indian subjects with impaired glucose tolerance (IDPP-1). Diabetologia 2006, 49, 289–297. [Google Scholar] [CrossRef] [PubMed]
- Gruss, S.M.; Nhim, K.; Gregg, E.; Bell, M.; Luman, E.; Albright, A. Public Health Approaches to Type 2 Diabetes Prevention: The US National Diabetes Prevention Program and Beyond. Curr. Diabetes Rep. 2019, 19, 78. [Google Scholar] [CrossRef]
- Hamman, R.F.; Wing, R.R.; Edelstein, S.L.; Lachin, J.M.; Bray, G.A.; Delahanty, L.; Hoskin, M.; Kriska, A.M.; Mayer-Davis, E.J.; Pi-Sunyer, X.; et al. Effect of weight loss with lifestyle intervention on risk of diabetes. Diabetes Care 2006, 29, 2102–2107. [Google Scholar] [CrossRef]
- Khademi, A.; Shi, L.; Nasrollahzadeh, A.A.; Narayanan, H.; Chen, L. Comparing the Lifestyle Interventions for Prediabetes: An Integrated Microsimulation and Population Simulation Model. Sci. Rep. 2019, 9, 11927. [Google Scholar] [CrossRef]
- Khan, R.M.M.; Chua, Z.J.Y.; Tan, J.C.; Yang, Y.; Liao, Z.; Zhao, Y. From Pre-Diabetes to Diabetes: Diagnosis, Treatments and Translational Research. Medicina 2019, 55, 546. [Google Scholar] [CrossRef]

| Characteristics | No. (Column %) | |
|---|---|---|
| Diagnosis of Prediabetes (n = 12,071) | Diagnosis of Type 2 Diabetes (n = 88,724) | |
| Gender | ||
| Male | 4415 (36.6) | 40,176 (45.3) |
| Female | 7618 (63.1) | 48,196 (54.3) |
| Unknown | 38 (0.3) | 352 (0.4) |
| Age decade | ||
| <29 | 652 (5.4) | 1986 (2.2) |
| 30–39 | 1031 (8.5) | 4442 (5.0) |
| 40–49 | 2036 (16.9) | 9727 (11.0) |
| 40–59 | 3145 (26.1) | 17,468 (19.7) |
| 60–69 | 3066 (24.4) | 24,510 (27.6) |
| 70–79 | 1446 (12.0) | 18,961 (21.4) |
| 80–89 | 576 (4.8) | 9472 (10.7) |
| >90 | 119 (1.0) | 2158 (2.4) |
| Race | ||
| African American or Black | 16 (0.1) | 199 (0.2) |
| Asian | 15 (01) | 89 (0.1) |
| American Indian/Alaska Native | 3 (0.02) | 58 (0.1) |
| Pacific Islander | 40 (0.3) | 276 (0.3) |
| White | 7705 (63.8) | 57,240 (64.5) |
| Other | 3213 (26.6) | 11,005 (12.4) |
| Unknown | 1079 (8.9) | 19,857 (22.4) |
| Ethnicity | ||
| Hispanic | 8482 (70.3) | 61,498 (69.3) |
| Non-Hispanic | 3589 (29.7) | 27,226 (30.7) |
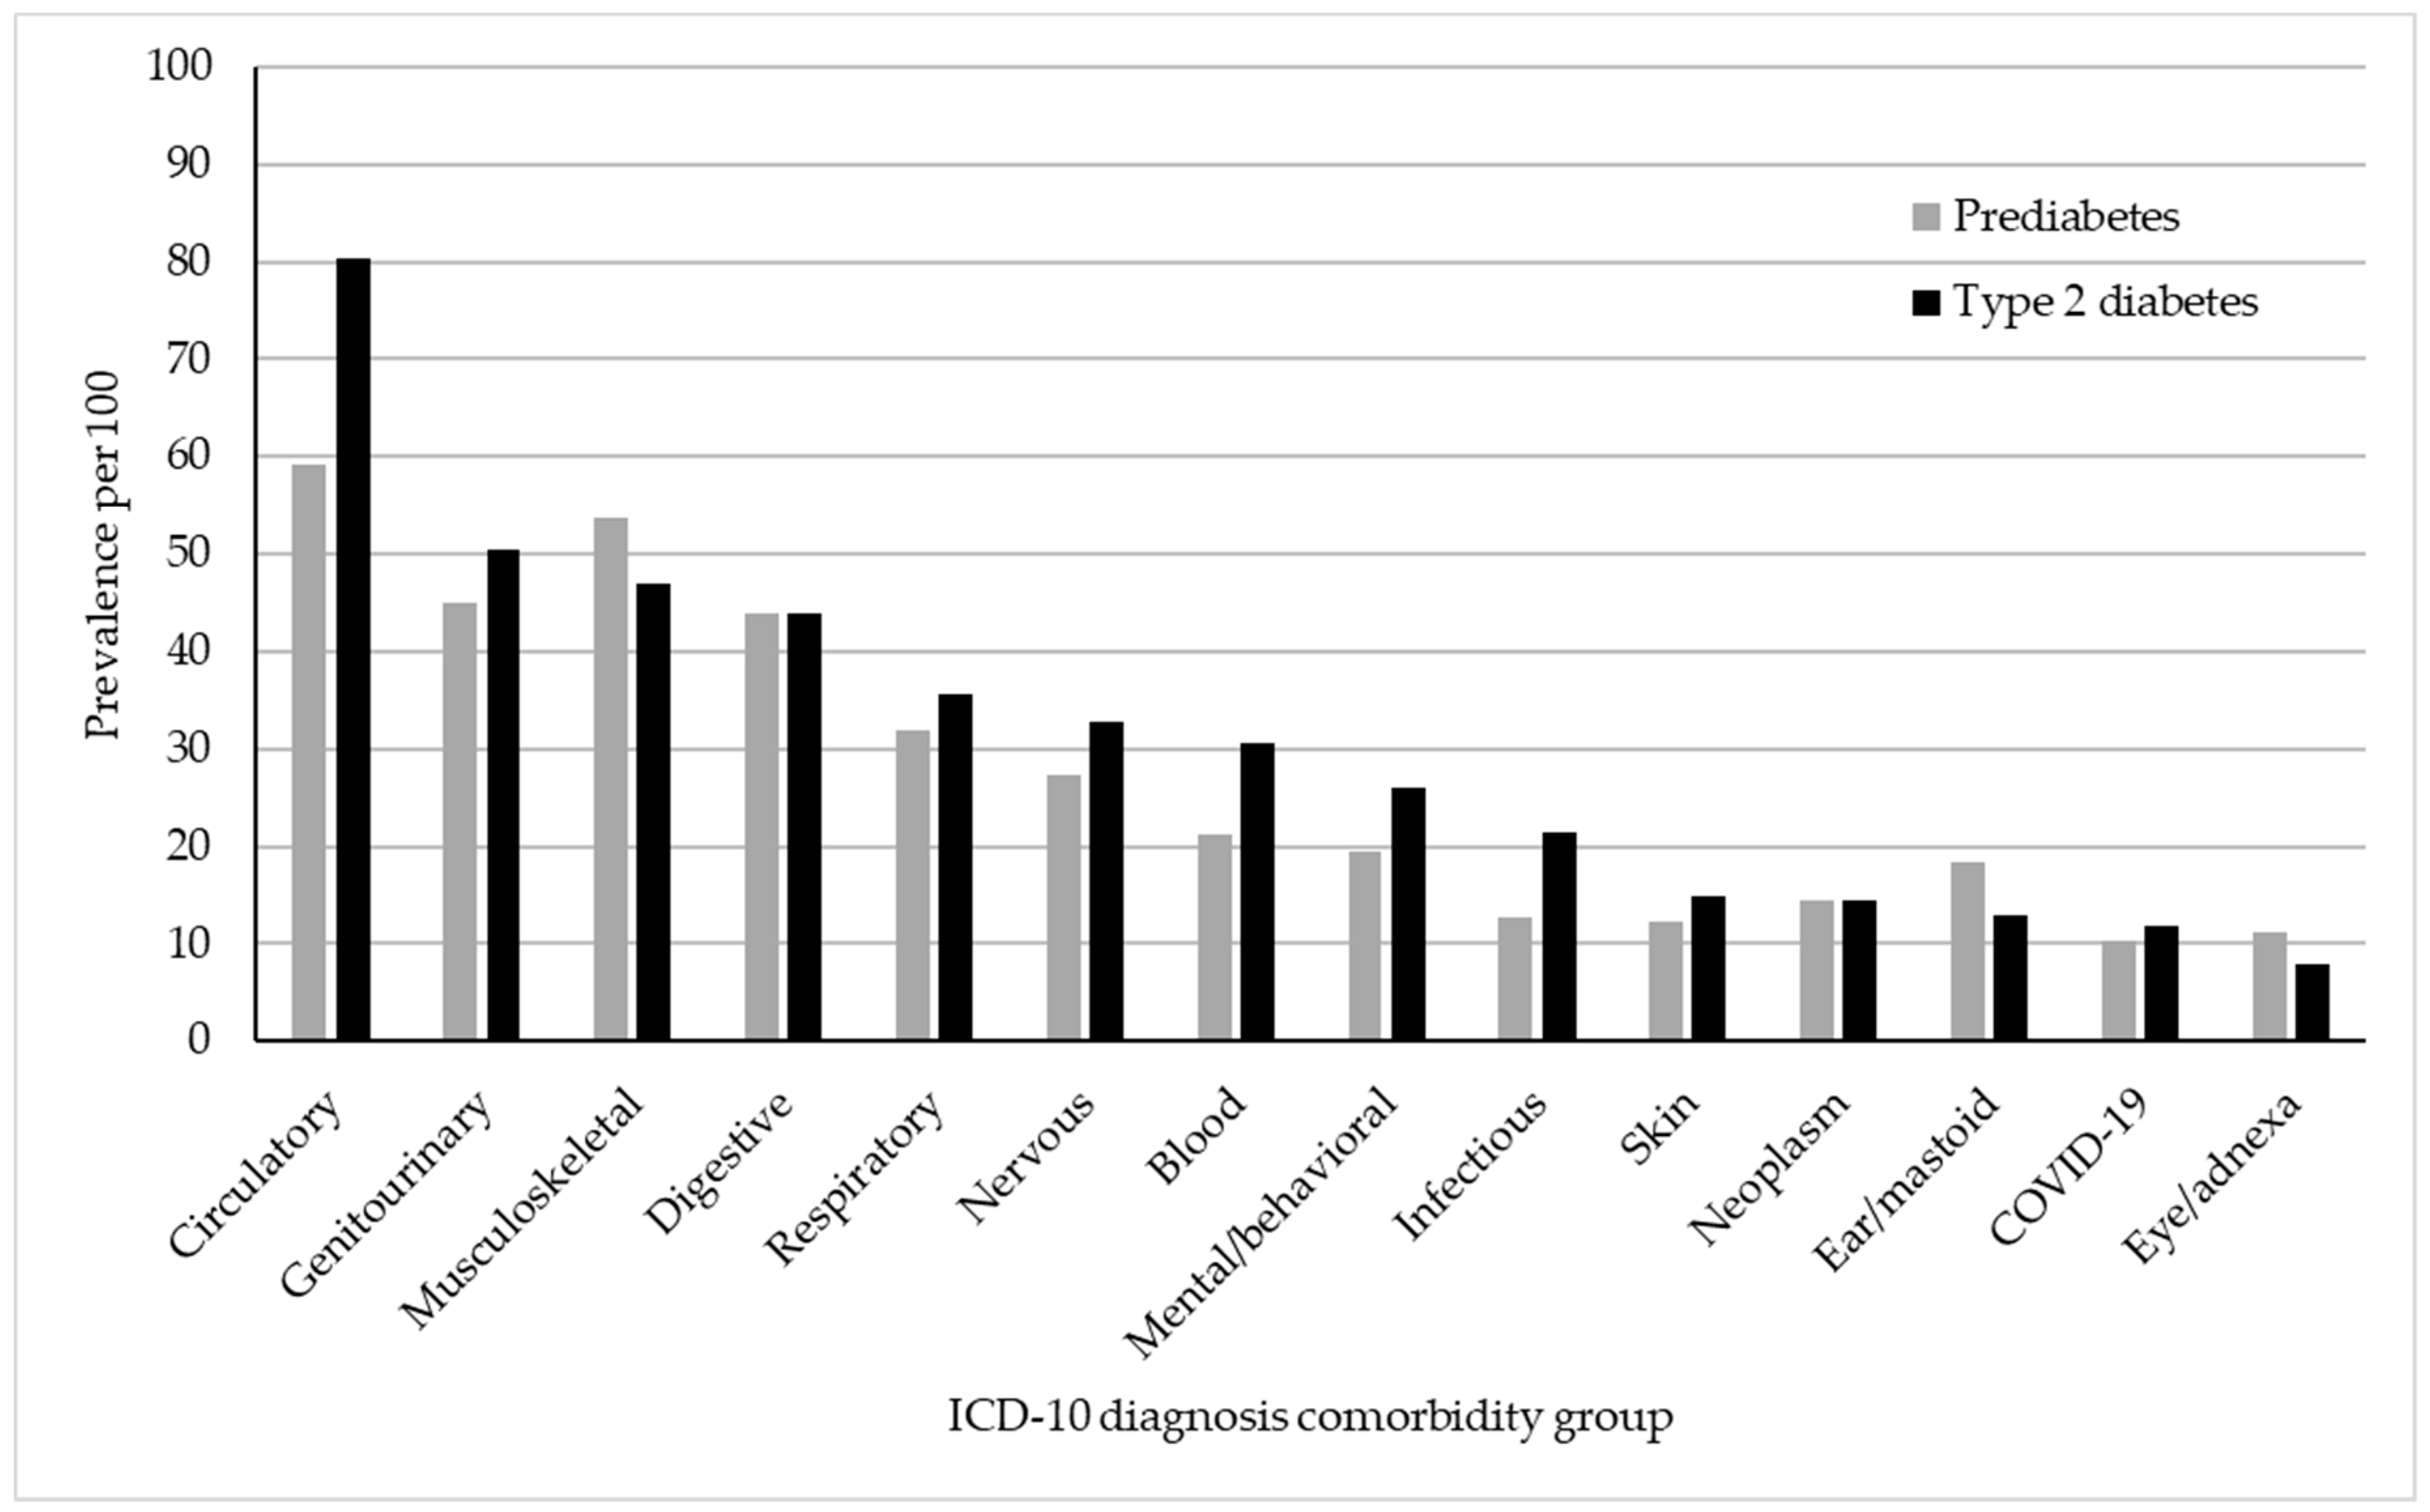
| Prevalence per 100 | Prevalence Difference per 100 (95% CI) | Prevalence Ratio (95% CI) | ||||
|---|---|---|---|---|---|---|
| Prediabetes | Type 2 Diabetes | Unadjusted Model | Adjusted Model (Age, Gender, and Ethnicity) | Unadjusted Model | Adjusted Model (Age, Gender, and Ethnicity) | |
| Diseases of the circulatory system | 59.1 | 80.4 | −21.3 *** (−22.3, −20.4) | −14.6 *** (−15.7, −13.7) | 0.73 *** (0.72, 0.75) | 0.82 *** (0.81, 0.84) |
| Diseases of the genitourinary system | 44.9 | 50.5 | −5.6 *** (−6.6, −4.7) | −1.3 ** (−2.3, −0.4) | 0.89 *** (0.87, 0.91) | 0.97 * (0.96, 0.99) |
| Diseases of the musculoskeletal and connective tissue | 53.8 | 47.0 | 6.8 *** (5.8, 7.7) | 8.5 *** (7.5, 9.4) | 1.14 *** (1.12, 1.16) | 1.19 *** (1.17, 1.21) |
| Diseases of the digestive system | 44.0 | 44.0 | −0.01 (−1.0, −0.9) | 1.1 * (0.1, 2.0) | 1.00 (0.99, 1.02) | 1.02 * (1.00, 1.05) |
| Diseases of the respiratory system | 32.0 | 35.7 | −3.7 *** (−4.6, −2.8) | −2.1 *** (−3.0, −1.2) | 0.90 *** (0.87, 0.92) | 0.94 *** (0.92, 0.97) |
| Diseases of the nervous system | 27.4 | 32.8 | −5.4 *** (−6.3, −4.6) | −3.2 *** (−4.1, −2.4) | 0.83 *** (0.81, 0.86) | 0.91 *** (0.88, 0.94) |
| Diseases of the blood | 21.2 | 30.5 | −9.28 *** (−10.1, −8.5) | −6.7 *** (−7.4, −5.9) | 0.70 *** (0.67, 0.72) | 0.77 *** (0.75, 0.80) |
| Mental and behavioral illnesses | 19.5 | 26.1 | −6.6 *** (−7.4, −5.9) | −7.2 *** (−8.0, −6.5) | 0.75 *** (0.72, 0.78) | 0.72 *** (0.69, 0.75) |
| Infectious and parasitic diseases | 12.8 | 21.5 | −8.6 *** (−9.3, −8.0) | −7.5 *** (−8.2, −6.9) | 0.60 *** (0.57, 0.63) | 0.63 *** (0.60, 0.66) |
| Diseases of the skin and subcutaneous tissue | 12.2 | 14.8 | −2.6 *** (−3.2, −2.0) | −2.5 *** (−3.1, −1.8) | 0.82 *** (0.78, 0.87) | 0.82 *** (0.78, 0.86) |
| Neoplasms | 14.4 | 14.5 | −0.1 (−0.8, 0.6) | 1.7 (1.0, 2.3) | 0.99 (0.95, 1.04) | 1.12 *** (1.06, 1.17) |
| Diseases of the ear and mastoid process | 18.4 | 12.9 | 5.4 *** (4.7, 6.2) | 6.1 *** (5.3, 6.8) | 1.42 *** (1.36, 1.48) | 1.54 *** (1.47, 1.60) |
| COVID-19 and post-COVID-19 | 10.2 | 11.9 | −1.7 *** (−2.3, 1.1) | −1.6 ** (−2.2, −1.0) | 0.86 *** (0.81, 91) | 0.86 *** (0.81, 0.91) |
| Diseases of the eye and adnexa | 11.1 | 7.8 | 3.3 *** (2.7, 3.9) | 3.5 *** (2.9, 4.1) | 1.42 *** (1.34, 1.50) | 1.52 *** (1.43, 1.61) |
Disclaimer/Publisher’s Note: The statements, opinions and data contained in all publications are solely those of the individual author(s) and contributor(s) and not of MDPI and/or the editor(s). MDPI and/or the editor(s) disclaim responsibility for any injury to people or property resulting from any ideas, methods, instructions or products referred to in the content. |
© 2025 by the authors. Licensee MDPI, Basel, Switzerland. This article is an open access article distributed under the terms and conditions of the Creative Commons Attribution (CC BY) license (https://creativecommons.org/licenses/by/4.0/).
Share and Cite
Noriega, R.X.; Nañez, J.J.; Hartmann, E.F.; Beard, J.D.; Sloan-Aagard, C.D.; Thacker, E.L. Comorbidity Prevalence in Prediabetes and Type 2 Diabetes: A Cross-Sectional Study in a Predominantly Hispanic U.S.–Mexico Border Population. Int. J. Environ. Res. Public Health 2025, 22, 673. https://doi.org/10.3390/ijerph22050673
Noriega RX, Nañez JJ, Hartmann EF, Beard JD, Sloan-Aagard CD, Thacker EL. Comorbidity Prevalence in Prediabetes and Type 2 Diabetes: A Cross-Sectional Study in a Predominantly Hispanic U.S.–Mexico Border Population. International Journal of Environmental Research and Public Health. 2025; 22(5):673. https://doi.org/10.3390/ijerph22050673
Chicago/Turabian StyleNoriega, Ricardo X., Juan J. Nañez, Emily F. Hartmann, John D. Beard, Chantel D. Sloan-Aagard, and Evan L. Thacker. 2025. "Comorbidity Prevalence in Prediabetes and Type 2 Diabetes: A Cross-Sectional Study in a Predominantly Hispanic U.S.–Mexico Border Population" International Journal of Environmental Research and Public Health 22, no. 5: 673. https://doi.org/10.3390/ijerph22050673
APA StyleNoriega, R. X., Nañez, J. J., Hartmann, E. F., Beard, J. D., Sloan-Aagard, C. D., & Thacker, E. L. (2025). Comorbidity Prevalence in Prediabetes and Type 2 Diabetes: A Cross-Sectional Study in a Predominantly Hispanic U.S.–Mexico Border Population. International Journal of Environmental Research and Public Health, 22(5), 673. https://doi.org/10.3390/ijerph22050673