Abstract
Mercury is widely distributed in the biosphere, and its toxic effects have been associated with human death and several ailments that include cardiovascular diseases, anemia, kidney and liver damage, developmental abnormalities, neurobehavioral disorders, autoimmune diseases, and cancers in experimental animals. At the cellular level, mercury has been shown to interact with sulphydryl groups of proteins and enzymes, to damage DNA, and to modulate cell cycle progression and/or apoptosis. However, the underlying molecular mechanisms of mercury toxicity remain to be elucidated. Our laboratory has demonstrated that mercury exposure induces cytotoxicity and apoptosis, modulates cell cycle, and transcriptionally activates specific stress genes in human liver carcinoma cells. The liver is one of the few organs capable of regeneration from injury. Dormant genes in the liver are therefore capable of reactivation. In this research, we hypothesize that mercury-induced hepatotoxicity is associated with the modulation of specific gene expressions in liver cells that can lead to several disease states involving immune system dysfunctions. In testing this hypothesis, we used an Affymetrix oligonucleotide microarray with probe sets complementary to more than 20,000 genes to determine whether patterns of gene expressions differ between controls and mercury (1–3μg/mL) treated cells. There was a clear separation in gene expression profiles between controls and mercury-treated cells. Hierarchical cluster analysis identified 2,211 target genes that were affected. One hundred and thirty-eight of these genes were up-regulated, among which forty three were significantly over-expressed (p = 0.001) with greater than a two-fold change, and ninety five genes were moderately over-expressed with an increase of more than one fold (p = 0.004). Two thousand and twenty-three genes were down-regulated with only forty five of them reaching a statistically significant decline at p = 0.05 according to the Welch’s ANOVA/Welch’s t-test. Further analyses of affected genes identified genes located on all human chromosomes except chromosome 22 with higher than normal effects on genes found on chromosomes 1–14, 17–20 (sex-determining region Y)-box18SRY, 21 (splicing factor, arginine/serine-rich 15 and ATP-binding), and X (including BCL6-co-repressor). These genes are categorized as control and regulatory genes for metabolic pathways involving the cell cycle (cyclin-dependent kinases), apoptosis, cytokine expression, Na+/K+ ATPase, stress responses, G-protein signal transduction, transcription factors, DNA repair as well as metal-regulatory transcription factor 1, MTF1 HGNC, chondroitin sulfate proteoglycan 5 (neuroglycan C), ATP-binding cassette, sub-family G (WHITE), cytochrome b-561 family protein, CDC-like kinase 1 (CLK1 HGNC) (protein tyrosine kinase STY), Na+/H+ exchanger regulatory factor (NHERF HGNC), potassium voltage-gated channel subfamily H member 2 (KCNH2), putative MAPK activating protein (PM20, PM21), ras homolog gene family, polymerase (DNA directed), δ regulatory subunit (50kDa), leptin receptor involved in hematopoietin/interferon-class (D200-domain) cytokine receptor activity and thymidine kinase 2, mitochondrial TK2 HGNC and related genes. Significant alterations in these specific genes provide new directions for deeper mechanistic investigations that would lead to a better understanding of the molecular basis of mercury-induced toxicity and human diseases that may result from disturbances in the immune system.
Introduction
Mercury is a biohazardous metal found naturally in the environment in different chemical species. Sample analysis shows that an average 70 kg man has mercury deposit of about 13 mg in the skin, nails, hair, and kidneys [1]. In growing children mercury tends to have a pronounced neurotoxic effect in the central (cns) and peripheral (pns) nervous systems. To some groups of genetically prone individuals exposure to the metal leads to the development of immune-dysfunctions. In such people mercury is a potent dose-dependent immuno-stimulant that initiates a number of immuno-pathologic diseases with raised lymphocyte proliferation, increased blood immunoglobulin levels and absolute systemic hyper-reactivities. Toxicity associated with mercury arises through avid bonding with sulfhydryl (-SH) and to a lesser degree hydroxyl, carboxyl, and phosphoryl groups. These linkages modify signal transduction events in the body [2]. Mercury in particular binds to functional cysteine-rich sequences in the extracellular domains of both CD95 and the tumor necrosis factor receptor [TNF-R] through trimer formation. The CD95/TNF ligands are a family of proteins that belong to a homotrimeric group of molecules individually capable of binding to three other CD95/TNF receptors respectively to form clusters of the receptors’ death domains. Trimerization is a step necessary for the correct delivery of death signals in the course of apoptosis or programmed cell death (PCD) [3–5]. Receptor trimerization induced by bivalent inorganic mercury Hg2+ for instance results in nonspecific, dysregulated signal transduction and disorders of cellular functions. Cellular dysfunctions may involve inactivation of enzymes, changes in protein conformations, inhibition of several transport processes that may disrupt permeability properties of cell membranes, the generation of free radicals and peroxides due to decline in activities of superoxide dismutase (SOD) and catalase to the involvement of glutathione peroxidase.
CD95/CD95L ligand apoptotic interactions can result in three physiological pathways that may be associated with: 1) regulation of T cells activities by their deletion at termination of an immune response, 2) destruction of targets such as virus-invaded cells or cancer cells by cytotoxic T cells and by natural killer cells, and 3) elimination of inflammatory cells at ‘immune-privileged’ sites, areas protected from injury through immune responses. Mutations occurring in the CD95 and/or CD95L culminate in the accumulation of peripheral lymphoid cells that leads to the induction of fatal autoimmune condition characterized by lymph nodes enlargement. CD95 (also called Fas or Apo1) and TNFR1 (or p55 or CD120a) are the familiar death receptors (DRs) that utilize activation induced cell deaths (AICD) in metabolic pathways. Other known death receptors are DR3 (Apo3), WSL-1, TRAMP, or LARD; DR4 and DR5, (also called Apo2), TRAIL-R2, TRICK 2, or KILLER [3]. Some tumors are known to express CD95L that interact with receptor to induce pathological state whereby suppression of immune surveillance by tumor-reactive immune cells occurs [5, 6]. The death effector domain is among a very widely distributed homophilic interaction of caspase recruitment domain (CARD) found in many caspases with large prodomains including caspases-2, -8, -9 and –10 [6–8].
The interaction of an adapter protein, Fas-associated death domain (FADD) to caspase-8 gives rise to oligomers that self cleave caspase-8 for activation. Caspase-8 is linked to the activation of downstream caspases such as caspase-9, the mammalian functional homolog of CED-3 that commits the cell to apoptosis. In some cell types TNF also induces apoptosis via TNFR1 [9, 10]. Trimerization occurring between TNF and its ligand, TNFR1 is known to stimulate production of NF-κB and AP-1 transcription factors that lead to the induction of proinflammatory and immunomodulatory genes [7, 64]. Activated macrophages and T cells are the predominant cells that produce TNF during infections. These multi-pathways utilized by the Fas/TNF family signals are prime candidates for immunopathogenesis that give rise to the various life-threatening effects in several cell types [9–15]. For instance the triggering of Fas may induce PCD in activated T cells, but is costimulatory in resting T cells [13]. Molecules participating in Fas-signaling are also involved in signaling via other surface receptors. Sphingomyelinase is also known to be involved in signaling via several cytokine receptors [10–14]. Initiator caspases are the first to be activated and include caspase-2, 8, 9 and 10. These proteins cleave and activate the effector caspases (3, 6, 7), which cleave, degrade or activate other cellular proteins. Some caspases (1, 4, 5, 11, 12, 13, and 14) have a specialized role in inflammation and their activation leads to the processing of pro-inflammatory cytokines. Such array of possible pathways resulting from reactions of this family of proteins including CD95 and/or its ligand may explain why toxicity from mercury exposure is linked with several adverse health effects involving many body systems and invariably involves failure or enhanced activities of immune responses in man. For example mercury has been associated with cardiomyopathies and arrhythmias, other neurological problems such as tremors, insomnia, polyneuropathy, paresthesias, emotional lability, irritability, personality changes, headaches, weakness, blurred vision, dysarthria or speech impairment, slowed mental response, and unsteady gait [15–17]. The effects of mercury on human systems are numerous. A maculopapular rash, swollen nodes and painful extremities, peripheral neuropathy, hypertension, and renal tubular dysfunction develop in affected children [18]. However individual susceptibility to mercury is poorly understood.
Several proteins in the body including the caspases (cysteine proteases) carry -SH groups; -SH groups are components of several structural parts of cells, of enzymes and in most biochemical pathways, -SH groups participate in various metabolic paths occurring in the cell environ. In this respect importance is placed on chemokines and receptors now known to play important roles in inflammatory and immunologically mediated diseases. These cytokine peptides of 8–12 kDa bind to heparin and attract leucocyte subsets to specific sites in the course of the immune response. More than fifty of these chemokines have so far been isolated and classified into four groups CXC, CC, C, and CX3C according to the arrangement of conserved cysteine residues. On interacting with their receptors they stimulate a large family of seven transmembrane spanning G proteins. These G protein-coupled receptors are differentially distributed among various cell types and send signals downstream in the membrane in a given cell. It is of note that genes encoding inflammatory chemokines are typically located on two major clusters on human chromosomes 4 (CXC) and 17 (CC), whereas genes for homeostatic chemokines are found in small clusters on chromosomes 1, 2, 5, 7, 9, 10, and 16. Homeostatic receptors include CXCR4, CXCR5, CCR4, CCR7 and CCR9. Inflammatory receptors include CXCR1, CXCR2, CXCR3, CCR1, CCR2, CCR3, CCR5 and CCR6. In most circumstances G protein activation end in cytoskeletal reorganization leading to alterations in motility as a result of phospholipase C and rho stimulation [10–14,19–21]. Under certain circumstances, however activation of protein tyrosine kinases results in cell activation and proliferation. Inducible and constitutive chemokines arising from inflammatory processes and components of bone marrow, thymus and secondary lymphoid organs respectively recruit leucocytes, dendritic cells and activated T cells and are involved in regulating physiological leucocyte trafficking, an important component of immune surveillance.
Chemokines are involved in several biochemical as well as immunological regulating activities including leucocyte circulation or its localization, retention, and positioning in tissues. Regulation of leucocyte recruitment is complex. Functionally they secrete and present chemokines in the target tissues as well as regulating the expression of chemokine receptors on leucocytes during differentiation and activation. They are also important component of polarized type 1 and type 2 T cell responses. Chemokines participate in several points in the course of T cell differentiation, directly affecting T cell activation as well as causing changes in potential migration of T cell by giving directions as to migration and which cell it interacts with. Chemokines affect the type and number of dendritic cells (DC) attracted to the site of inflammation and also influences how the DCs respond to T cell activation, processes leading to the selection of subtypes of these cells in the course of immune responses. For instance signals delivered to DCs via CCR5 can drive IL-12 secretion whereas signals from CCR2 inhibit IL12 and these cytokines will define the subsequent T cell differentiation. Inappropriate activation of these signaling proteins causes a cell to proliferate excessively [20–24]. In the end chemokine receptors expressed by effector T cells determine where they migrate and cause the final pathology. For instance increased interferon alpha (IFN-α) and IFN-ω are among the initial cytokines abnormally expressed in SLE patients [23–31].
In patients with spontaneously induced SLE high levels of IFN-α-inducible proteins (eg OAS1, OAS2, and OASL) and other proteins have been measured [25–38, 68]. IFN-α is associated with several immunomodulatory functions including its known antiviral action: it can stimulate immunoglobulin (Ig) synthesis in peripheral blood mononuclear cells (PBMC) in vitro [39], maintains T cells alive [40], inhibits B cell receptor-mediated apoptosis [30], and is able to induce dendritic cell differentiation in SLE patients [37, 38]. IFN-α can also induce formation of anti-nuclear antibodies against native DNA that specify the SLE disease [39]. These conditions are found also in HgCl2-treated rats [39–48]. For these reasons IFN-α has been observed to play a very significant role in the initial immunopathogenesis in SLE groups [26–38]. Similar multichannel pathways are also emerging from animal studies and patients suffering from diabetes and rheumatoid arthritis (RA) [49–57]. Confirmation from animal models of inflammatory arthritis and data from patients with rheumatoid arthritis reveal that several cytokines are produced in the course of the disease. Cytokines are considered to be factors that mediate communications between cells, and are involved in attracting inflammatory and immune cells into the joints where these cells emit products that are damaging to the tissues. Cytokines interact specifically with receptors on cell surfaces; stimulate pathways of signal transduction leading to high or low transcription. Two-signal transduction pathways that may be considered important in the rheumatoid synovium are the AP-1 and the NF-κB pathways [11, 51]. NF-κB seems to be particularly important in chronic inflammatory diseases, both in mediating IL-1 and TNFα production as well as in mediating their effects on target cells after binding to cell surface receptors. Stimulation of AP-1s and the NF-κB signal transduction pathways lead to the release of collagenases and other enzymes, pro-inflammatory molecules, and more cytokines.
Further complications arise from the fact that several genes that encode for proteins in the intracellular signaling cascades that are activated by receptor tyrosines were initially isolated as oncogenes in cancer cells or tumor viruses [21, 25, 58, 59]. This finding implies that the origins of most diseases are linked via exposures to chemical and other environmental xenobiotics including mercury. Degree of toxicity depends on mercury species, dosage, individuality and the type of MHC association [10, 43–48]. Therefore genetic analyses and classification of mercury-susceptible MHC haplotypes may be an appropriate indicator of severity index to MeIA diseases; an index which can be expanded to show how these genes react to exposures to different types and levels of environmentally available xenobiotics in general. The immunological processes involved in immune enhancement and/or immune suppression are still not clearly defined. Till now genetic susceptibility to autoimmunity implicate high prevalence in individuals with the following combinations of genes in MHC-haplotype linkages: Fasl (CD95/L), Sap (serum amyloid P-component), Fcγr2b (FcγRIIB), Cr2 (CD21/CD35) and Ptprc (CD45), whereas deficiency of Fcer1g (FcRγ-chain) results in resistance to autoimmunity. These genes are not by any means exhaustive [59]. Severity of autoimmune diseases seems to rely on the number as well as the type of linked MHC class genes on a chromosome. This is an indication that susceptibility and/or initiation factors operate via multiple pathways subjected to regulatory or checkpoints that finally give rise to the pathological state as exemplified by SLE, IDDM and RA patients. In genetically predisposed patients the synthesis of autoantibodies and/or the generation of cellular attack of self antigens may follow different pathways. Such mechanisms are known to be influenced by genetic factors and contributions from ethnic and environmental backgrounds. The liver is the only organ that has the capacity to regenerate on demand by the body; thus dormant genes can be re-activated or induced by environmental factors. In this research the basic underlying hypothesis is that mercury-induced hepatotoxicity and related morbidities linked with immune problems is associated with modulation of specific gene expressions in liver cells. To test this hypothesis, Affymetrix Oligonucleotide microarray with probe sets complementary to more than 20,000 genes were used to determine differences, if any between patterns of gene expressions in controls and mercury (1–3μg/mL)-treated cells.
Materials and Methods
Chemical Reagents and Growth medium
Mercury: Stock solution 104 μg/mL preserved in 10% HNO3 CAS No. 7439-97-6 was purchased from EM Science (Gibbstown, New Jersey). Penicillin-Streptomycin, Lot No. 1085899, fetal bovine serum (FBS), and phosphate buffered saline (PBS) were purchased from Gibco-BRL Life Technologies (Grand Island, New York). Complete growth medium, DMEM, Trypsin EDTA and penicillin-streptomycin were purchased from American Type Culture Collection (ATCC), Manassas, VA. RNEasy, RNAlater and RNAlater RNA stabilization kits for RNA extraction were purchased from Qiagen, Inc. Streptavidin phycoerythrin (SAPE) protocol fluorescent labeling and hybridization control kit (containing 20 times reagent kit pre-mixed hybridization control transcripts for bioB, bioC, and bioD) with genes of the biotin synthesis pathway from the bacteria E. coli, and cre, (the recombinase gene from PI bacteriophage) were supplied by Affymetrix, Inc. (San Jose, California).
Cell Culture and Harvesting
Human transformed hepatoma, HepG2 cell line, stored frozen under liquid nitrogen was thawed by gentle agitation of vials for 2 minutes in water bath at 37°C. The content of each vial was transferred to Petri dish and diluted with DMEM media supplemented with 10% FBS and 1% penicillin-streptomycin. Cells were incubated for a total of 48 hours at 37°C in a 5% CO2-humidified environment. After the first 24 hours cells were washed in DMEM and further incubated for 24 hours to achieve approximately 95% confluence. This procedure was carried out for both control and test samples as outlined.
Mercury Exposure
To prepare cells for chemical exposure, a mercury stock solution of 104 μg/mL (in 10% HNO3) was used to prepare standard solutions of 10, 20 and 30 μg/mL concentrations in PBS. From these standard solutions equivalent volumes of 1, 2, and 3 mL were added to 19, 18, and 17 mL solutions of complete DMEM growth medium supplemented with 10% FBS and 1% penicillin-streptomycin to achieve final concentrations of 1, 2 and 3 μg/mL of mercury respectively. For the control samples similar dilutions of 1, 2, or 3 mL of PBS in 19, 18, and 17 mL of complete DMEM media were prepared. Cells were grown in petri dishes, washed with PBS, trypsinized with 10 mL (0.25%) (w/v) containing 0.03% EDTA (w/v) and harvested to 1 × 10⁷ for total RNA extraction. Representative 1, 2, and 3 μg/mL mercury concentrations of HepG2-treated and control cells were stabilized in 5 to 10 volumes of RNAlater RNA stabilization reagent for storage or for immediate RNA extraction as needed. RNAlater RNA stabilization kit (Qiagen Inc.) was recommended for RNA purification procedures to circumvent electrophoretic runs for monitoring extracted RNA purity.
Total RNA Extraction, Stabilization and Quantitation
Cells stored in RNAlater RNA stabilization reagent were thawed at 37°C in water bath with agitation and centrifuged at 300g for 5 min into pellet; the supernatant was discarded. All centrifugations were performed at 20–25°C in a standard micro centrifuge ensuring that the temperature did not cool below 20°C.
RNEasy kits (Qiagen) were used to isolate and purify RNA from the mercury treated and untreated HepG2 cells. Samples were initially lysed and homogenized in the presence of a highly denaturing guanidine isothiocyanate (GITC)-containing buffer. This process immediately inactivates RNases to ensure isolation of intact RNA. Addition of equal volumes of ethanol provides appropriate binding conditions, the sample was then applied to an RNeasy mini column where the total RNA binds to the membrane and contaminations are efficiently washed away. High quality RNA was then eluted in 30 μl, or more, of RNAse free deionized water. In such procedures all RNA molecules longer than 200 nucleotides are isolated providing an enriched RNA. The size distribution of purified RNA is comparable to that obtained by centrifugation through CsCl cushion, where small RNAs do not sediment efficiently. RNAlater RNA stabilization kit (Qiagen) was then added for RNA purification procedures that were monitored with the A260/A280 ratio. Concentration of extracted RNA was computed based on equivalency of 40 μg/mL of RNA per mL in RNAse free deionized water taking into account the amount of RNAse free deionized water used for the final elution (between 30–50 μl) dependent on amount of extract. Optical readings at A260 and A280 nm Absorbance (A) of RNA extracts were carried out using UV/VIS/NIR spectrophotometer Lambda 20 (Perkin Elmer). Purity of RNA was analyzed utilizing the RNAlater stabilization technique. Amounts of RNA extracted were calculated and accepted or disregarded for further RNA extraction dependent on sample A260/A280 absorbance ratio meeting the set criteria limits of 1.8 to 2.1 in the RNAlater stabilization procedure. RNA extractions were done for each concentration of mercury-treated and control cells prepared at concurrent times.
Hybridization of Biotin-labeled cRNA to Oligonucleotide Microarrays and Staining Procedures
Procedures for probe hybridization as laid out in the Affymetrix Technical Gene Chip manual, version 5.0 were followed. Hybridization control kit containing 20 times reagent kit with pre-mixed hybridization control transcripts bioB, bioC, and bioD was utilized as directed. For each target the scaling up volume of Midi array buffer mixtures for hybridization (final volume 200 μL) were prepared as outlined and arrays were normalized to room temperature, hybridization cocktail heated to 99°C for 5 minutes and spun in microcentrifuge for another 5 minutes. Supernatant cocktail was used to fill the probe arrays as recommended by Affymetrix, Inc.
Probe arrays were placed in the rotisserie motor kept at 45°C and rotated at 60 rpm for 16 hours using the Affymetrix GeneChip Hybridization Oven 640 for processing. Samples were removed from the probe arrays and freshly filled with micro filtered stringent buffer. Hybridization was continued in Affymetrix GeneChip Fluidics station followed by probe staining procedures using stringent and non-stringent wash buffer in Affymetrix Standard Format (Euk-WS2) [60]. Probe arrays were processed using three-stain streptavidin phycoerythrin (SAPE) protocol. Triplicate RNA extracts from each of the three concentrations 1, 2, and 3μg/mL were used for hybridization procedures.
Microarray Image and Probe Array Scanning
Streptavidin-stained genes hybridized to u133 Affymetrix chips series were scanned for interrogation using Affymetrix Microarray Suite scanner engaging argon-ion laser equipped with a safety interlock system. Scanner was set at 2 X image scan, 3 μm pixel values, at wavelength 570 nm for 50 μm probe arrays with probe cells 24 μm or less. For each gene, the relative expression in the exposed as compared to the control or baseline was determined for each cDNA. Internal controls employed during hybridization were kindly supplied by Affymetrix Inc. to normalize for differences in mRNA quality and efficiency of probe labeling. This procedure improves data quality used for downstream analysis.
Statistical Analysis
Fluorescence signals emitted by the probes were converted to signal log ratios (SLR) correlating with measure of the abundance of a transcript. Analyses were performed using Affymetrix expression Batch Query employing the Wilcoxon’s Signed Rank (WSR) test for comparisons of test mercury-treated (1–3μg/mL concentrations) and control HepG2 cells. Stat common pairs, the intersection of the probe pairs from the baseline and experiment that are used by the expression algorithm to make the change call were generated as signal log ratio (SLR) reflecting the change in the expression level of a transcript between a baseline noise (control) versus an experimental array. This change is put out as the log2 ratio. A log2 signal ratio of 1 is equal to a fold change of 2. SLR, the quantitative change in transcript abundance estimates the magnitude and direction of change of a transcript of two arrays. From WSR test, a total of three, one-sided p-value was chosen to determine the change call between baseline and test sample. A combination of three of these values gives a final p-value provided in the data analysis output (.chp file). A range of p-values from 0.0 to 1.0 provides a measure of the likelihood of change and direction. The value closest to 0.5 signifies that no change is detected. Values close to 0.0 indicate likelihood for an increase in transcript expression level in the experiment array compared to the baseline, whereas values close to 1.0 indicate likelihood for a decrease in transcript expression level. p-value scales are used to generate discreet change calls using thresholds. The final change p-value is grouped by cutoff values referred to as gamma 1 (γ1) and gamma 2 (γ2) that provide boundaries for the change calls: I for increase; MI for marginal increase; D for decrease; MD for marginal decrease; NC for no change. Table 1 is a list of expression levels of genes located on human chromosomes as compared to the control sample when exposed to mercury at the concentrations indicated. Positive SLR indicates up-regulation; negative SLR indicates downregulation of the expressed genes. For detail mathematical computations of the Affymetrix Microarray suite refer to the User’s Guide version 5.0 [60]. Corresponding probe pairs were compared between test and control sample utilizing the Welch’s ANOVA/Welch’s t-test. This procedure eliminates differences inherent in each probe binding coefficients and is, therefore more accurate than a single array analysis.

Table 1.
Sample genes affected by mercury
Results
Findings from this study indicate that mercury exposure has a significant effect on several genes expressed on most human chromosomes. There was a clear separation in gene expression profiles between controls and mercury-treated cells. Hierarchical cluster analysis identified 2,211 target genes that were affected. One hundred and thirty-eight of these genes were up-regulated, among which forty three were significantly over-expressed (p = 0.001) with greater than a two-fold change, and ninety-five genes were moderately over-expressed with an increase of more than one fold (p = 0.004) (Table 1). Two thousand and twenty-three genes were down-regulated with only forty five of them reaching a statistically significant decline at p = 0.05 according to the Welch’s ANOVA/Welch’s t-test (Table 1).
Affected genes were localized on all human chromosomes except chromosome 22; with higher activities on genes associated with chromosomes 1–10, 12, 14–18, 20 (sex-determining region Y), 21 (splicing factor and ATP-binding), X (including BCL-co-repressor). These genes include potassium voltage-gated channel– subfamily H member 2 (KCNH2), stress responses, G-protein signal transduction, putative MAPK activating protein (PM20, PM21), ras homolog gene family, cytokine receptor activity and polymerase (DNA directed), regulatory subunit (50kDa), leptin receptor involved in hematopoietin/interferon-class (D200-domain), and thymidine kinase 2, mitochondrial TK2 (HGNC) and related genes. It appears that the impact of mercury was concentration-dependent. Closely associated genes on a chromosome tend to be affected together (Table 1).
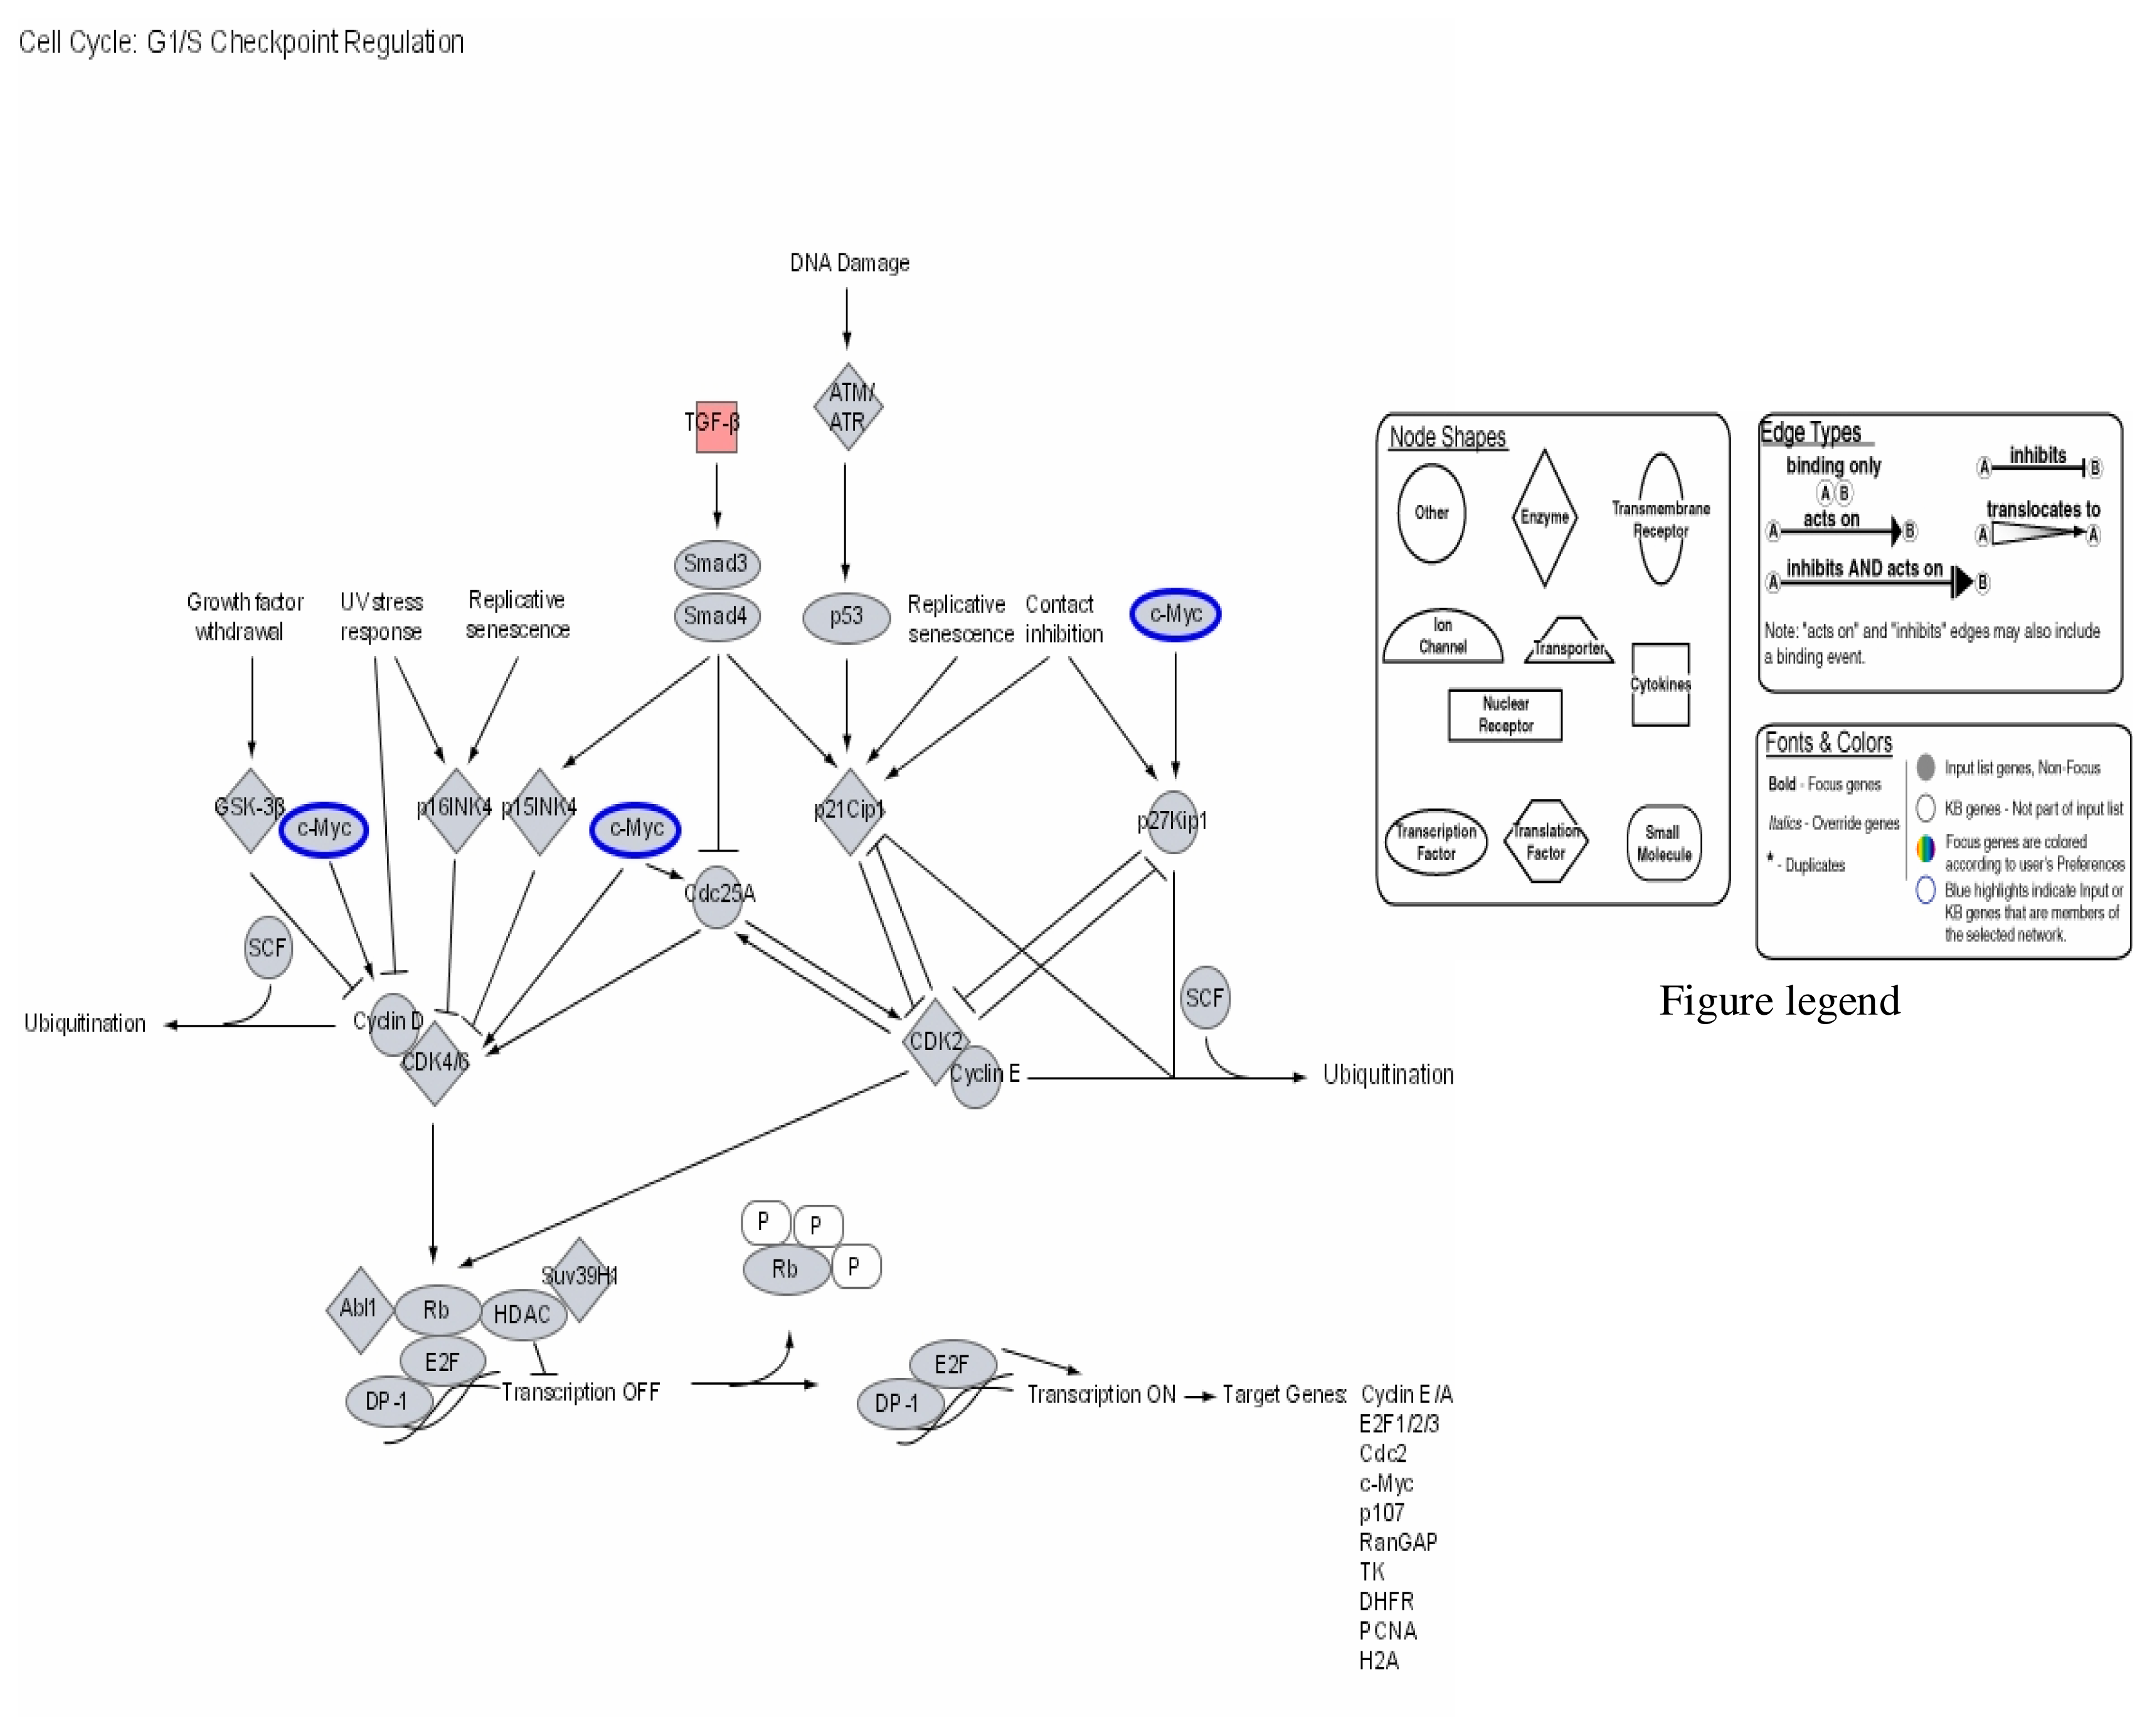
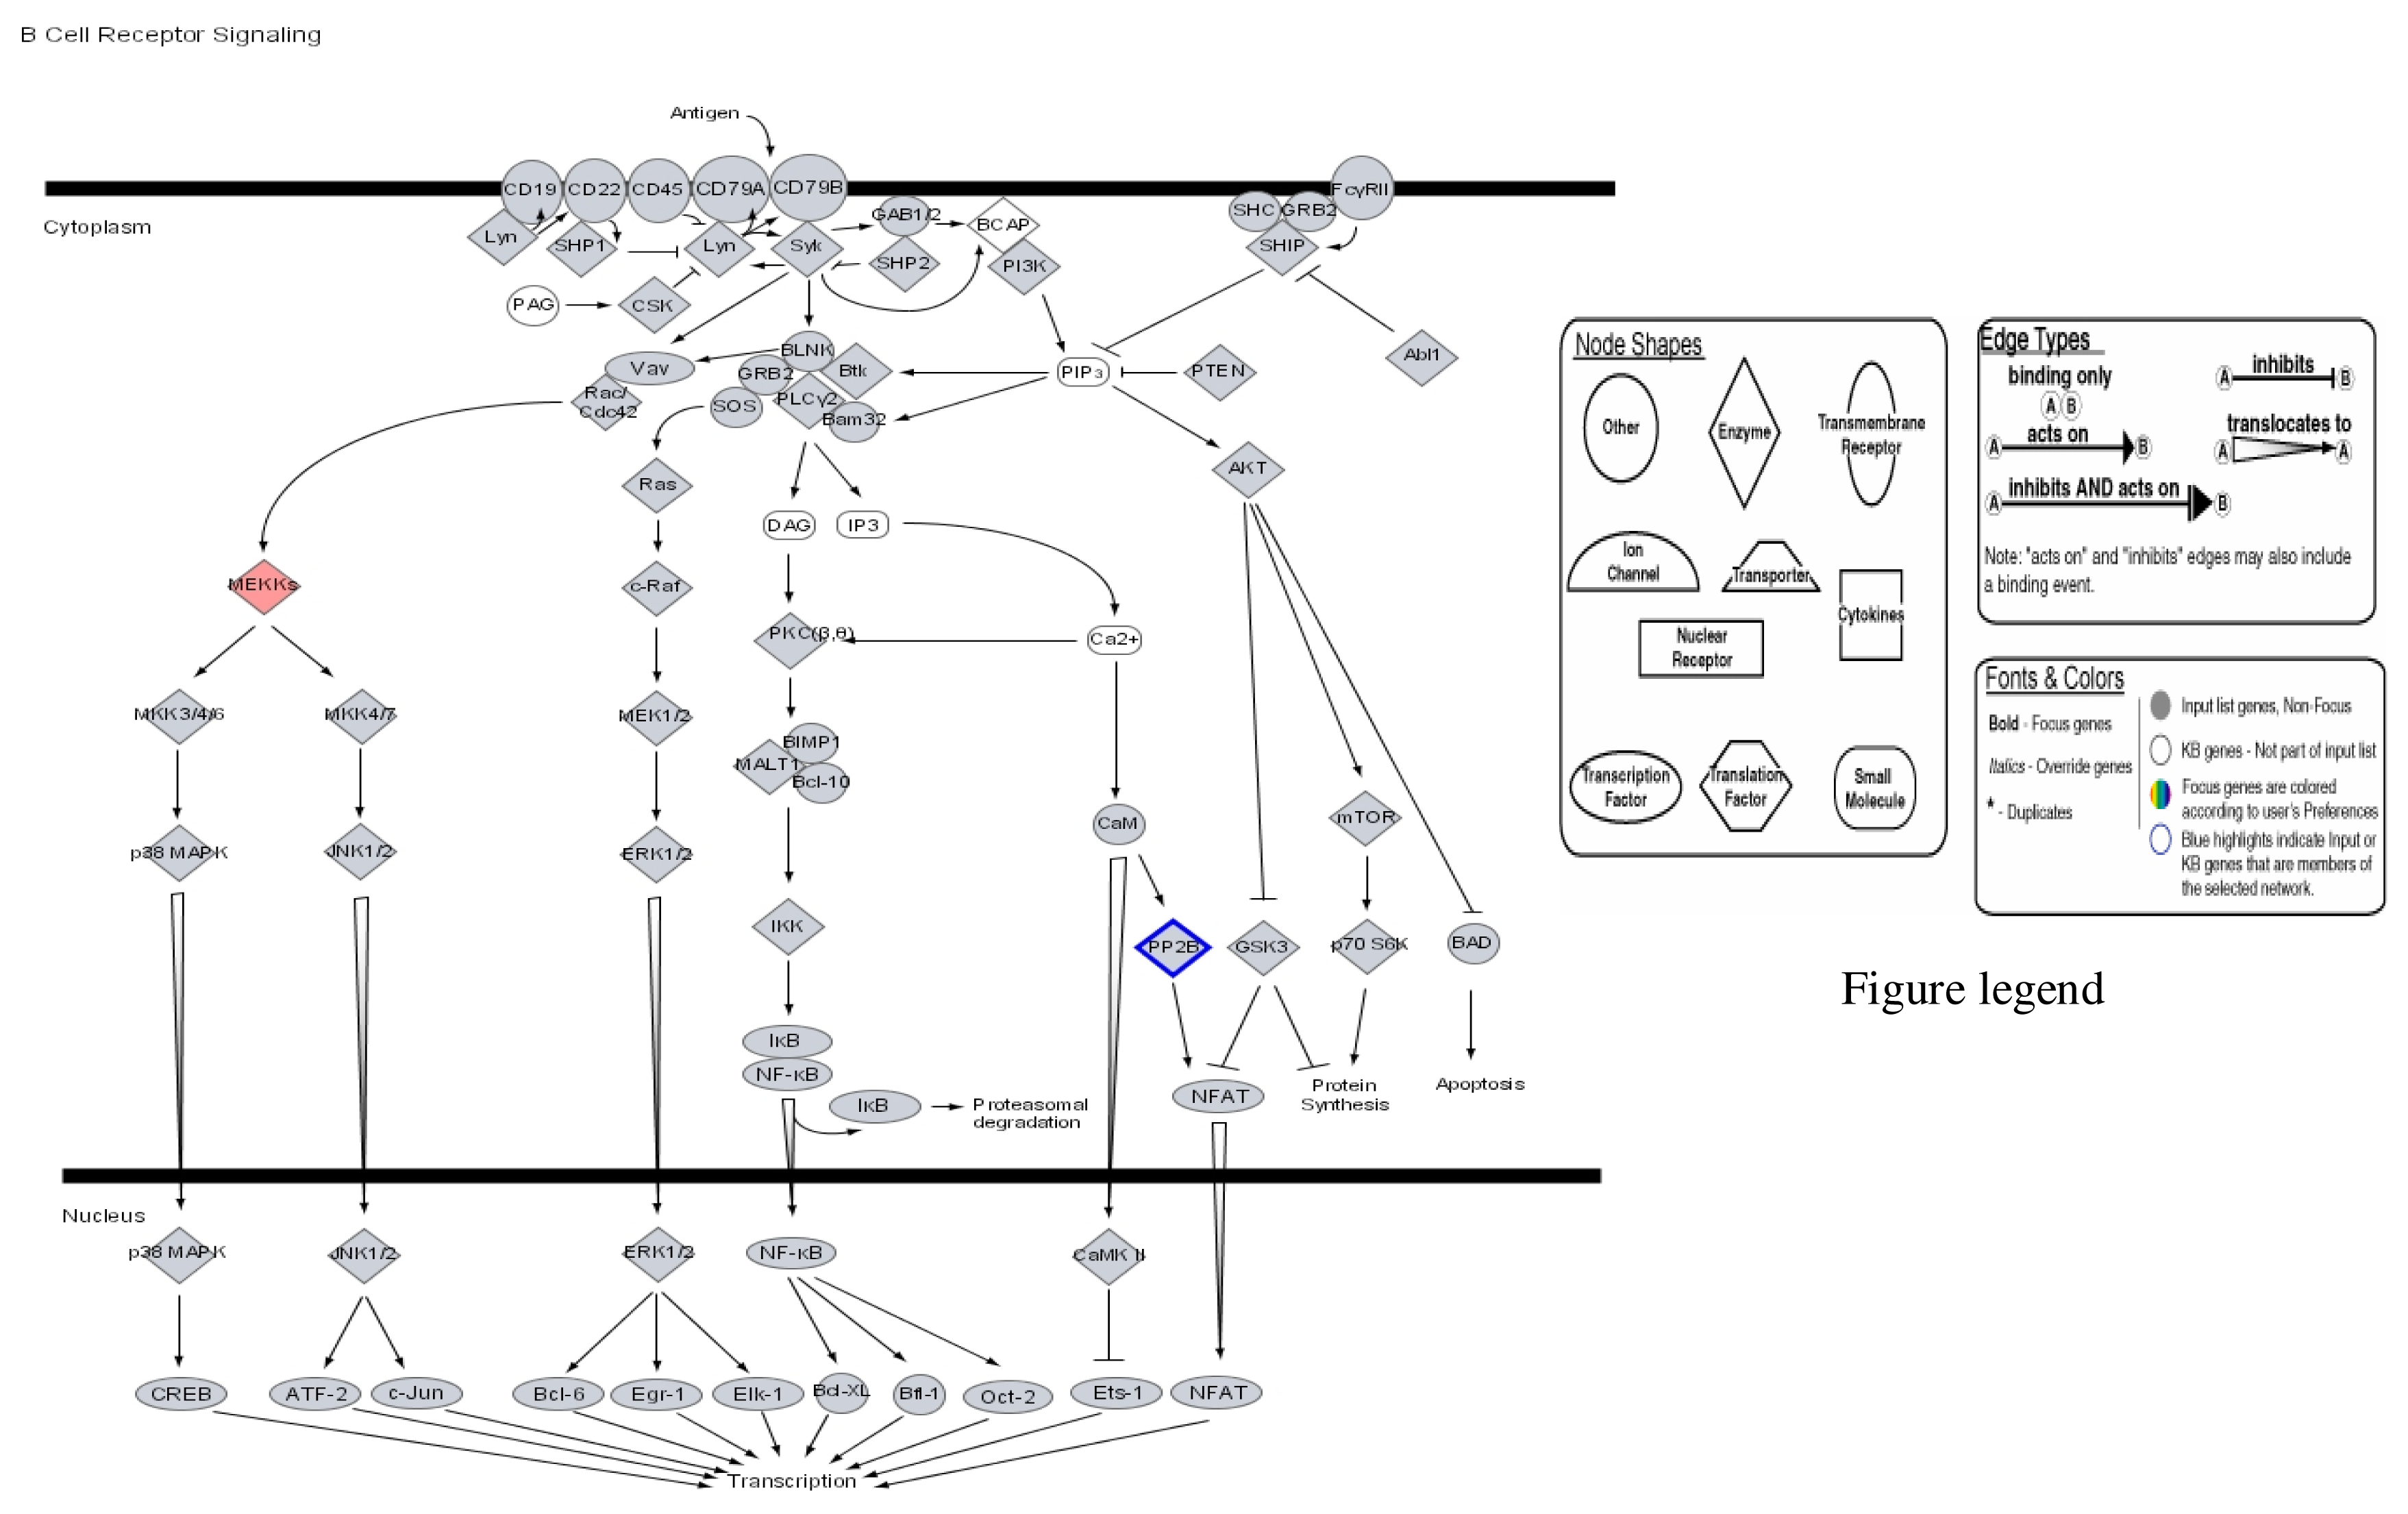
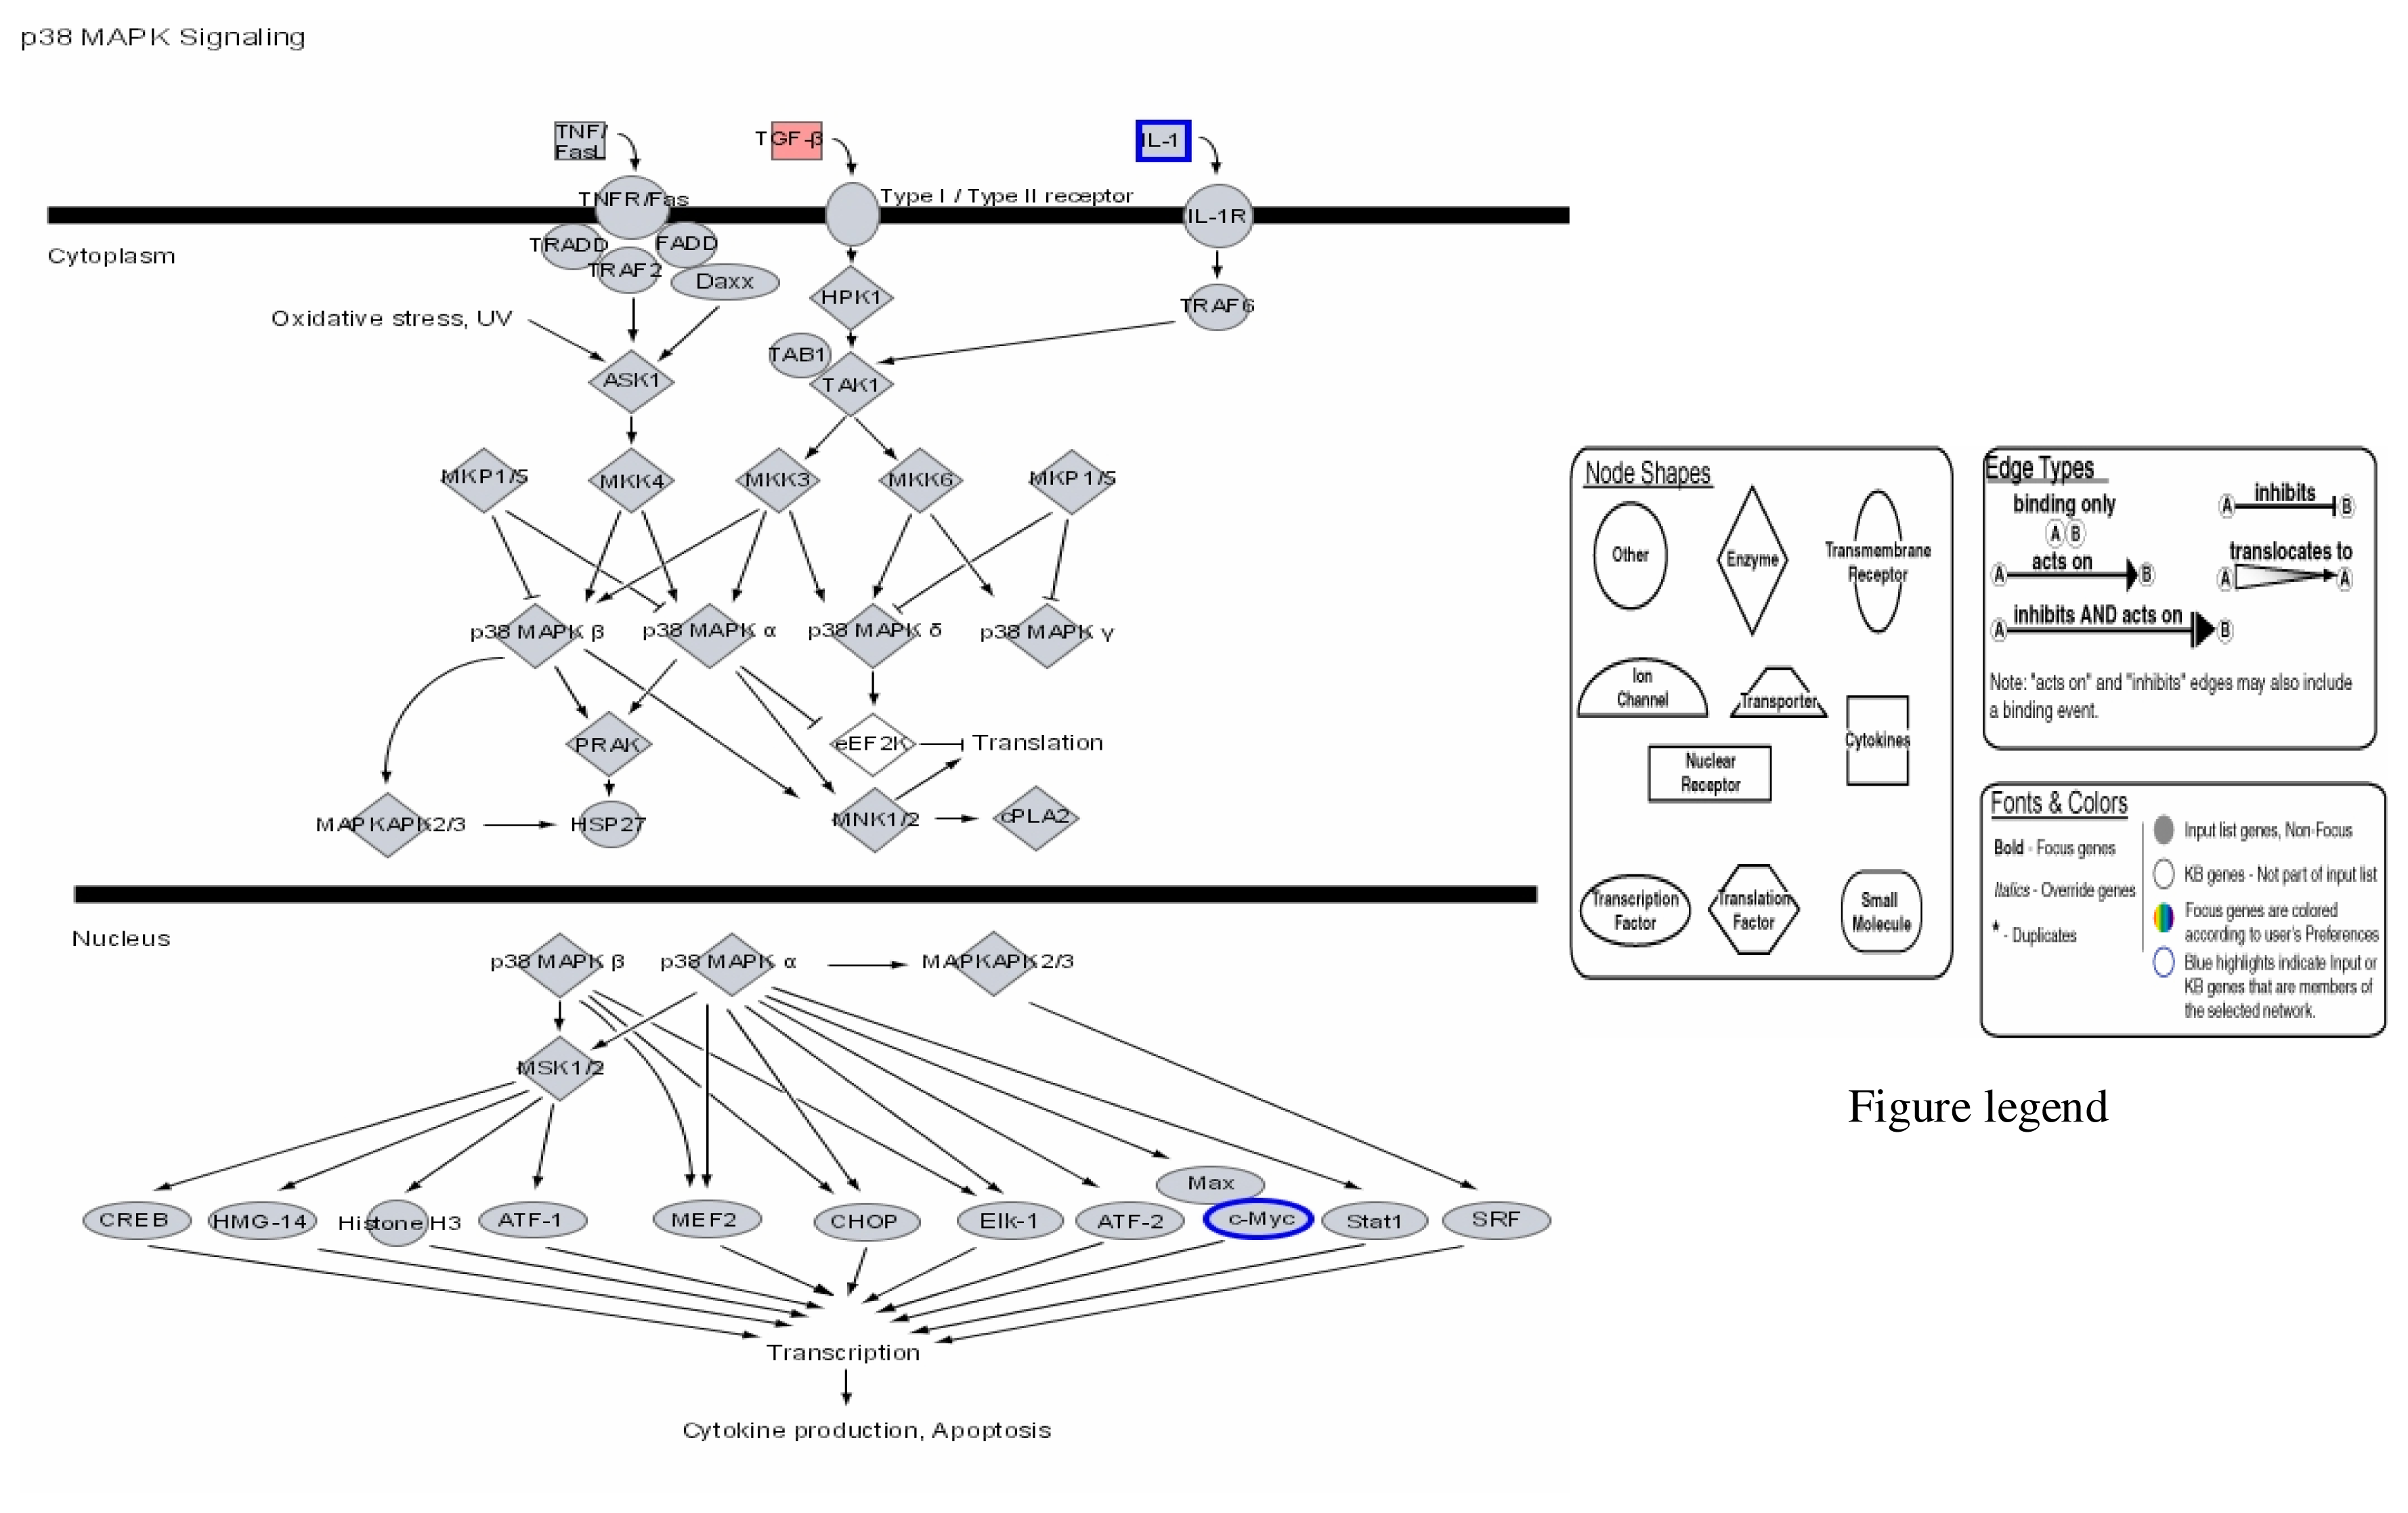
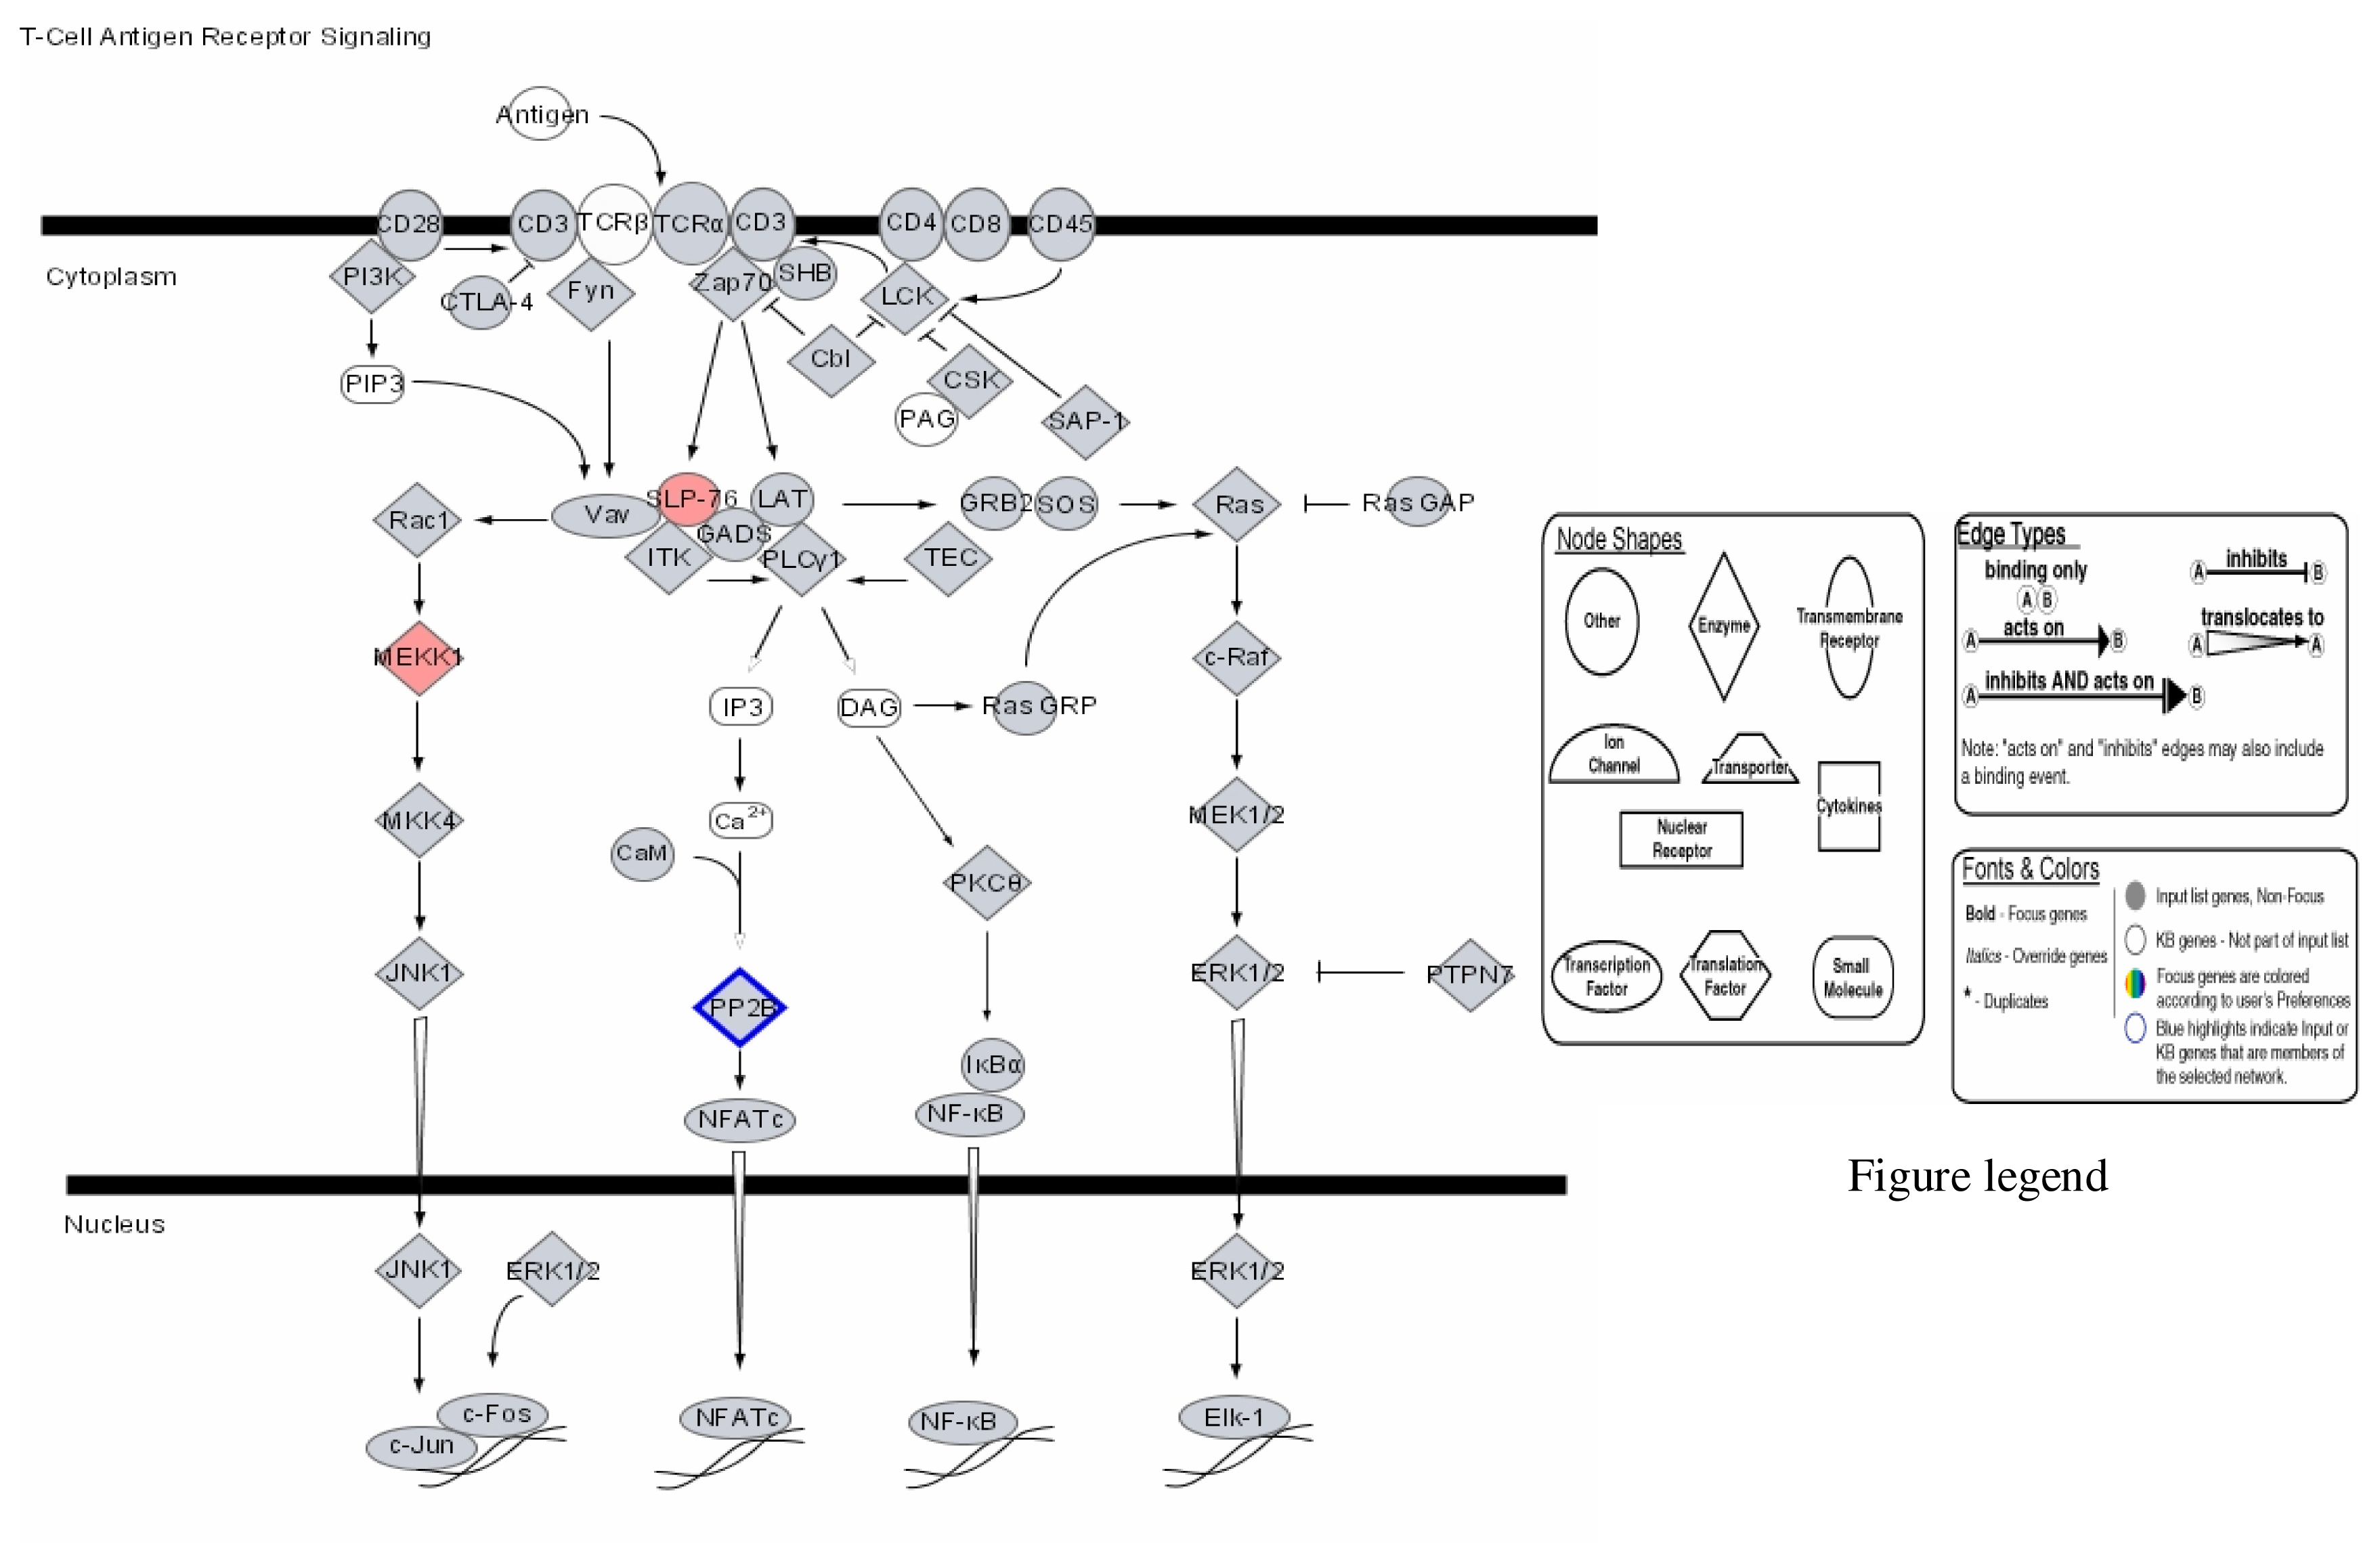
Our results therefore show that mercury dose-dependently stimulates or down regulates most genes located on all human chromosomes including genes involved in apoptosis and metabolic regulations with significant effects on genes involved in the immune system pathways. Some of the leading genes affected by mercury exposure are highlighted in red/blue in the Ingenuity systems analysis (IPA) pathways kindly provided by IPA Inc (Figures 1–4). The IPA network programs identify genes affected by mercury exposure and reveal their possible role and relationship to other genes operating in common pathways. These procedures can identify possible pathologies resulting from metabolic dysfunctions and disease development.

Figure 1.
Modulation of cell cycle GI/S checkpoint regulation by mercury: Activation of TGF-β and repression of C-Myc.
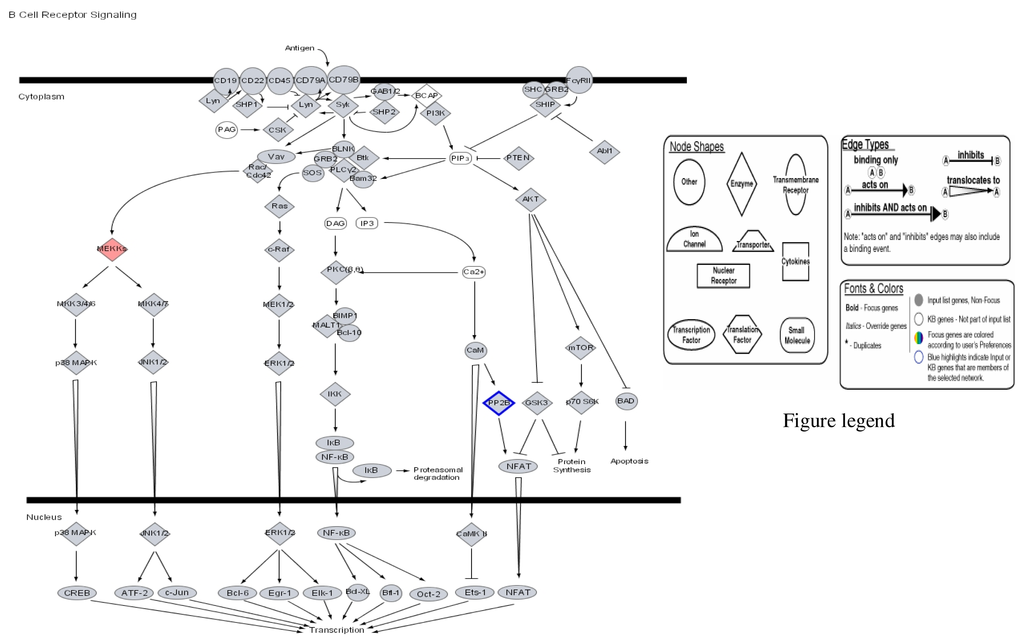
Figure 2.
Modulation of B cell cycle receptor signalling by mercury: Activation of MEKK and repression of PF 2B.
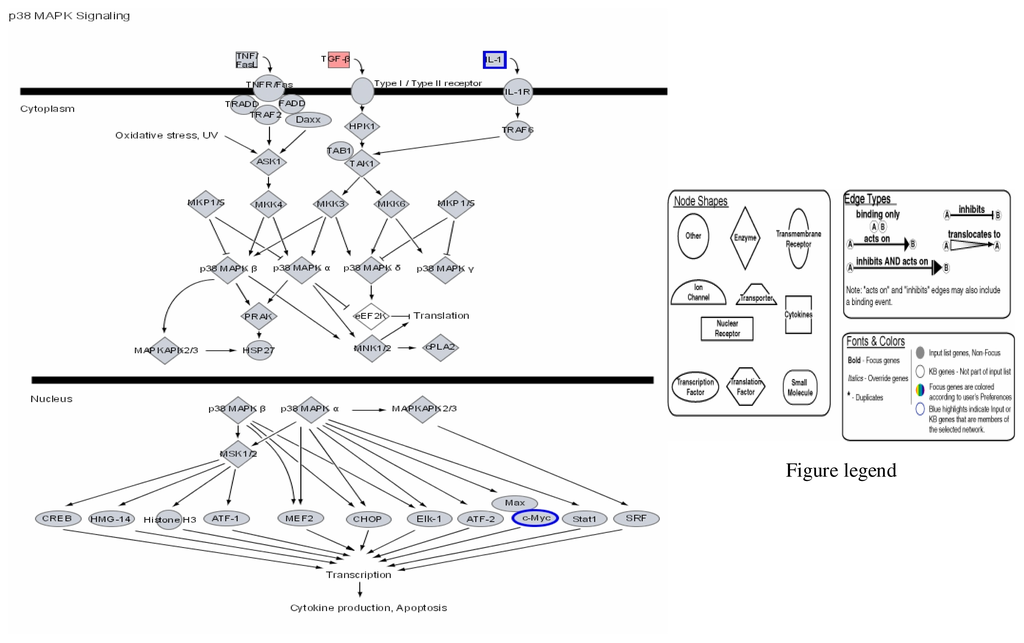
Figure 3.
Modulation of P38 MAPK signalling by mercury: Activation of TGF-β and repression of IL-1 and c-Myc.
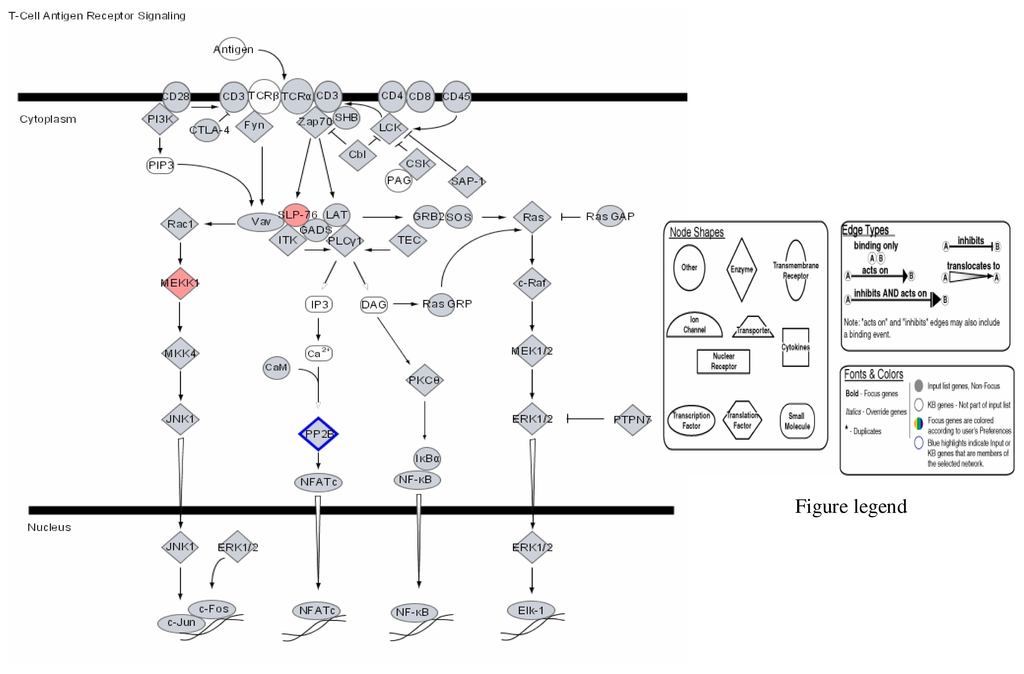
Figure 4.
Modulation of T-Cell antigen receptor signalling by mercury: Activation of SLP-76 and MEKK, and repression of PP-2E.
Figures 1–3 are computer generated IPA genetic pathways showing the cell cycle, B cell receptor and p38 MAPK signaling routes that are influenced by genes that are affected by mercury exposure. These diagrams demonstrate mercury’s possible influence on several metabolic pathways. Red coloration indicates gene upregulation while blue coloration indicates inhibition of gene expression on exposure to mercury. Mercury exposure leads to effects on several of biochemical pathways involving products of genes in cell cycle signaling: G2/M checkpoint regulation, TGF-β, IGF-1, insulin receptor activity, chemokine, Wint/ β-catenin, integrin, PPAR, SAPK/JNK, JAK/Stat, B and T cell receptor, G-protein-coupled receptor, IL-2, ERK/MAPK, death receptor signaling such as apoptosis, NF-κB, cell cycle and above all immune responses regulated by most of these genes. Gene influences on each other as revealed by Ingenuity Pathway Analysis (IPA) demonstrate that mercury is likely to exert a high effect on transcription factors. Further analyses of these genetic pathways and the implications of the immune system regulation will be addressed in subsequent communication. IPA diagrams also point to the role of several genes linked to associated metabolic networks that are subject to mercury toxicity (Figure 5). This exemplifies the potential for mercury to affect susceptible individuals with the right MHC haplotype combinations and who are prone to develop autoimmune and/or other diseases commonly linked with mercury exposure from the environment.
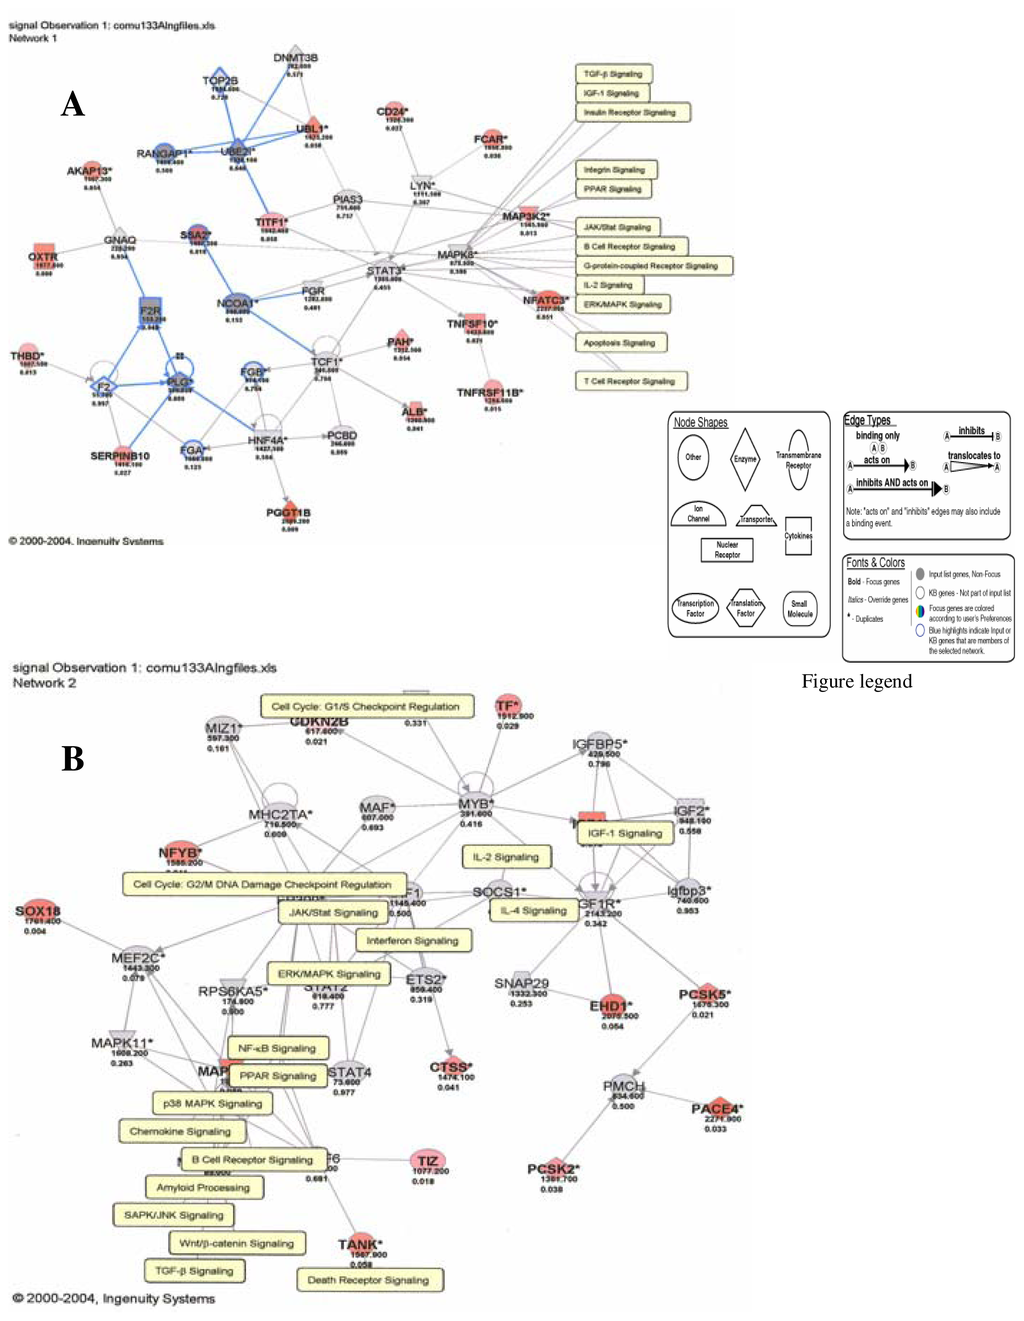
Figure 5.
Genes and molecular pathways affected by mercury in HepG2 cells (A: Network 1; B: Network 2)
Discussion
This study shows that several genes in haplotype combinations are subjected to pronounced changes on exposure to environmental mercury. Among these genes are transforming growth factor beta (TGF-β) superfamily of cytokines (Figure 1). This group of family genes is associated with regulating the cell cycle essentially for maintenance of normal immunological homeostasis and lymphocyte proliferation. Proteins synthesized from these genes play important roles in regulating essential cellular functions such as differentiation and apoptosis. Our findings indicate that transforming factor beta (TGF-β) superfamily of cytokines is over expressed on mercury exposure. Some cells, lymphocytes among them are known to respond to TGF-β by undergoing apoptosis. Apoptosis may lead up to accumulation of self antigens within a localized part of the body and break the body’s immunological tolerance giving rise to autoimmune induction. The mechanisms regulating this process are yet to be clarified. The multifunctional effects of TGF-β superfamily of cytokines involve oligomeric complex formation of type I and type II serine/threonine kinase receptors. TGF-β binding to primarily the type II (TβRII) stabilizes the heteromeric complex with the type I receptor (TβRI) that results in transphosphorylation and activation of TβRI by the TβRII. Activated TβRI transmits the signal through transient interaction with and phosphorylation of receptor-restricted Smads. Smad2 and Smad3 mediate TGF-β and activin signals, while Smad1, Smad5, and Smad8 act downstream of bone morphogenetic proteins [65–67]. Receptor-mediated phosphorylation takes place in two serine residues in a SSXS motif in the C-terminal domain of receptor-restricted Smads. On phosphorylation, receptor-restricted Smads dimerize with Smad4 and translocate to the nucleus where it modulates transcription of TGF-β target genes. TGF-β is known to be a potent inducer of apoptosis in B-lymphocytes and is essential for immune regulation and maintenance of self-tolerance. Induction of Smad3 and/or Smad4 transcription factors by the interaction of TGF-β and receptors also leads to release of tissue factors (TFs) involved in the transcription of Cdc25A cyclin proteins as well as p15INK4 that in turn transcribe CDK4 and CDK6 cyclins responsible for the stimulation of Rb and E2F transcription factors. Combination of E2F TF DP-1 after release of phosphorylated Rb turns on TFs that have a wide array of effects on target genes in the cell cycle. Included in this target genes are cyclin E/A, E2F1/2/3, Cdc2, c-myc, p107, RanCAP, TK, DHFR, PCNA and H2A products (Figure 5). Transcription factor products of Smad3 and Smad4 that stimulate Cdc25A leads to synthesis of CDK2 enzymes coupled to cyclin E groups in the pathway of p53 and c-myc necessary for DNA repair processes through ubiquitination [65].
The growth inhibitory and apoptotic effects of TGF-β and anti –IgM have been found to both block cells in late G1 with decline in the level of c-myc, and both modulate the activity of Rb, p53, p21Waf1/Cip1, p27, cyclin A, caspase protease family members, and NFκB and thereby induce cells to growth arrest and apoptosis [60, 61]. Over expression of TGF-β cytokines induced by mercury may lead to transcription of Smad6 and Smad7; these molecules act as inhibitors of TGF-β family signaling. Smad7 interacts through binding with TβRI to block the phosphorylation and activation of receptor-restricted Smads that stops further signal propagation [60, 61]. Above all Smad7 expression has been shown to be induced by other factors such as interferon-γ, and TNF-α, epidermal growth factor, phorbol ester, and shear stress, indicating that transcription of Smad7 can serve as regulatory means of integrating and modulating the physiological response of different signaling pathways [62–64]. During developmental period the clonal deletion of self-reactive B cells mediated through apoptosis is necessary for maintenance of tolerance. Failure to eliminate immature B cells has the consequence of autoimmune diseases and cancer development [65]. Several aberrant functions associated with many pathways involving the cell cycle and the immune responses are therefore possible through intoxication with mercury.
Haplotype structure is often a better predictor of phenotypic consequences than are individual polymorphisms [56] and help relate genetic background to disease progress, diagnosis and/or treatment. A haplotype is made up of a group of nearby alleles that are inherited together. Because of their close proximity these genes tend to be better associated with patterns of diseases and by inference responses to drugs as well. To use haplotype as diagnostic and/or disease management tool it would be desirable to develop simple but vigorous molecular methods to determine the haplotype structure of patients [66]. Several evidences give support to complex makeup of genetics of autoimmune diseases such as lupus; haplotype links may be ideal diagnostic tool for disease managements.
Systemic lupus erythematosus (SLE) is an example of chronic autoimmune disease with female predominance (>90%), particularly in the child-bearing years. African-Americans are three times affected than European-Americans. Clinical features of SLE show extreme heterogeneity, varying in pathogenicity from mild forms of the disease to an advanced relentlessly progressive end organ damage. Epidemiological findings point to strong genetic component for susceptibility to SLE [64, 65] and multiple genes including those affecting immune complex deposition and the MHC [70, 71]. Many whole-genome linkage studies so far suggest about 20 SLE susceptibility loci [65, 67] indicating that SLE is polygenic with contributions from multiple genes, each one of which has a degree of effect. Genetic makeup seems to differ among racial groups. Out of the 20 potential SLE loci identified only three are thought to be of combined pedigrees rather than European-American or African-American pedigrees separately. Genome scan of 94 extended multiplex pedigrees by the use of model-based linkage analysis identified potential SLE loci at chromosomes 1q41, 1q23, and 11q14-23 in African-Americans; 14q11, 4p15, 11q25, 2q32, 6q26-27, 12p12-11 and 19q13 in European-Americans; and 1q23, 1q31, 13q32, and 20q13 in all pedigrees combined [69].
There was strong evidence that linkage in the African-American pedigrees was located in chromosomes 1, 3, and 11. An effect for the FcγRIIA candidate polymorphism at 1q23 in African-Americans is syntenic with linkage in a murine model of lupus. Sib pair and multipoint nonparametric analyses also support linkage (p < 0.05) at nine loci detected by two-point lod score analysis (lod >2.0). These results confirm the complexity associated with genetic susceptibility to SLE and point to the racial origin of the specific influence of these genetic effects. Our findings reinforce these data. Mercury seems to influence specific regulation of most of these genes aforementioned. For Afro-American group several of the genes influenced by mercury exposure involve genes expressed on chromosome 1 (1p13.1, 1p21, 1p21.3, 1p31, 1p32-31, 1p33, 1p34.2, 1p34.3, 1p34, 1p36.22, 1p36.33, 1p36.33-p36.12, 1q12-q21, 1q21, 1q21.2-q21.3, 1q21-q23, 1q23, 1q23.1, 1q23.3, 1q24.2, 1q24, and 1q25.1-q31.1), chromosome 3 (3p21.3, 3p21.2-p21.1, 3p21.31, 3p21-p12, 3p21, 3q13.31, 3q23 and 3q27.3), and chromosome 11 (11p15.1-p14, 11p15.4, 11q22 and 11q23.3). For European-Americans our result show that the following genes may be prominent in mercury toxicity: chromosome 2 (2p11, 2p11.2, 2p21, 2p22.1, 2p24.2, 2p25, 2q33, 2q34, 2q33-q35, 2q36-q37,2q37.3), chromosome 4 (4p12, 4p16, 4p16.1, 4q24, 4q33-q34, 4q34.1), chromosome 6 (6p21.3,6p22.1, 6p24.3, and 6q16), chromosome 11 (11p15.1-p14, 11p15.1, 11p15.4, and 11q23.3), chromosome 12 (12p11.23, 12q15-q21, 12q21.1, 12q21.2, 12q22, and 12q24.2), chromosome 14 (14q, 14q23.3, and 14q32.33), and chromosome 19 (19p13.2, 19q13.2, 19p13.3, 19q13.2-q13.3 19q13.3 and 19q13.4).
Such wide effects of mercury translate to risk associations when disease susceptibility is considered. This means that it is only at the right genetic combinations and the appropriate line-up of associated genes that disease susceptibility ensues. That goes to argue for severity of disease as well. Mercury-exposed individuals carrying the appropriate allelic-combinations located on specific haplotypes are prone to develop autoimmune diseases. Our findings give room to emphasize that high SLE prevalence in Blacks as compared to Caucasians, may be explained on haplotype basis. This is because quantitatively exons of chromosomes 1 and 3, known to be highly involved in immune response regulations and highly found among blacks may be highly affected by mercury. Hence the use of microarray techniques combined with MHC haplotype analysis can help to elucidate pathways of autoimmune disease pathogenesis and risk assessment, as well as to identify targets for drug therapy.

Acknowledgements
This work was financially supported by NIH Grant No. 5P20RR16470-02/USM-GR00978-04 (Biomedical Research Infrastructure Network), NIH Grant No. 1912RR13459 (RCMI-Center for Environmental Health), and U.S. DoA Grant No. DACA-42-02-C-0057 (MACERAC Program).
References
- Pier, S. M. The role of heavy metals in human health. Texas Rep Biol Med 1975, 33(1), 85–106. [Google Scholar]
- Whitekus, M. J.; Santini, R. P.; Rosenspire, A. J.; McCabe, M. J., Jr. Protection Against CD95-Mediated Apoptosis by Inorganic Mercury in Jurkat T Cells. The J. Immunol 1999, 162, 7162–7170. [Google Scholar]
- Ashkenazi, A.; Dixit, V. M. Death receptors: signaling and modulation. Science 1998, 281, 1305–1317. [Google Scholar]
- Ashkenazi, A.; Dixit, V. M. Death Receptors: Signaling and Modulation. Science 2002, 281(5381), 1305–1326. [Google Scholar]
- Tartaglia, L. A.; Ayres, T. M.; Wong, G. H. W.; Goeddel, D. V. A novel domain within the 55 kD TNF receptor signals cell death. Cell 1993, 74, 45–53. [Google Scholar]
- Nagata, S.; Goldstein, P. The Fas death factor. Science 1995, 276, 1449–56. [Google Scholar]
- Chinnaiyan, A. M.; O’Rourke, K.; Lane, B. R.; Dixit, V. M. Interaction of CED-4 with CED-3 and CED-9, a molecular framework for cell death. Science 1997, 275, 1122–6. [Google Scholar]
- Akbar, A. N.; Salmon, M.; Savill, J.; Janossy, G. A possible role for bcl-2 in regulating T cell memory- a ‘balancing act’ between cell death and survival. Immunol Today 1993, 14, 526–31. [Google Scholar]
- Dianzani, U.; Bragardo, M.; DiFranco, D.; Alliaudi, C.; Scagni, P.; Buonfiglio, D.; Redoglia, V.; Bonissoni, S.; Correra, A.; Dianzani, I.; Ramenghi, U. Deficiency of the Fas Apoptosis Pathway Without Fas Gene Mutations in Pediatric Patients With Autoimmunity/Lymphoproliferation. Blood 1997, 89(8), 2871–2879. [Google Scholar]
- Maloy, K. J.; Powrie, F. Regulatory T cells in the control of immune pathology. Nat Immunol 2001, 2, 16–22. [Google Scholar]
- Ansari, M. J. I.; Salama, A. D.; Chitnis, T.; Smith, R. N.; Yagita, H.; Akiba, H.; Yamazaki, T.; Azuma, M.; Iwai, H.; Khoury, S. J.; Auchincloss, H., Jr.; Sayegh, M H. The programmed Death-1 (PD-1) Pathway Regulates Autoimmune Diabetes in Nonobese Diabetic (NOD) Mice. J. Exp Med 2003, 198(1), 63–69. [Google Scholar]
- Nishimura, H.; Okazaki, T.; Tanaka, Y.; Nakatani, K.; Hara, M.; Matsumori, A.; Sasayama, S.; Mizoguchi, A.; Hiai, H.; Minato, N.; Honjo, T. Autoimmune dilated cardiomyopathy in PD-1 receptor-deficient mice. Science 2001, 291, 319–322. [Google Scholar]Mustelin, T.; Burn, P. Regulation of src family tyrosine kinases in lymphocytes. Trends in Biochemical Sciences 1993, 18, 215–220. [Google Scholar]
- Mustelin, T.; Burn, P. Regulation of src family tyrosine kinases in lymphocytes. Trends in Biochemical Sciences 1993, 18, 215–220. [Google Scholar]
- Cifone, M. G.; De Maria, R.; Roncaioli, P.; Rippo, M. R.; Azuma, M.; Lanier, L. L.; Santoni, A.; Testi, R. Apoptotic signaling through CD95 (Fas/APO-1) activates an acidic sphingomyelinase. J Exp Med 1993, 177, 1547–53. [Google Scholar]
- Chan, H. M. Metal accumulation and detoxification in humans. In Metal Metabolism in Aquatic Environments; Langston, W. J., Bebianno, M. J., Eds.; London; Chapman and Hall, 1998; pp. 415–438. [Google Scholar]
- Marsh, D. O.; Clarkson, T. W.; Myers, G. J.; Davidson, P. W.; Cox, C.; Cermichiari, E.; Tanner, M. A.; Lednar, W.; Shamlaye, C.; Choisy, O. The Seychelles study of fetal methylmercury exposure and child development: Introduction. Neurotoxicol 1995, 16, 583–596. [Google Scholar]
- Myers, G. J.; Davidson, P. W.; Cox, A.; Shamlaye, C. F.; Tanner, M. A.; Choisy, O.; Sloane-Reeves, J.; Marsh, D.; Cernichiari, E.; Choi, A. Neurodevelopmental outcomes of Seychellois children sixty-six months after in utero exposure to Methylmercury from a maternal fish diet: pilot study. Neurotoxicol 1995, 16(4), 639–652. [Google Scholar]
- Tchounwou, P. B.; Ayensu, W. K.; Ninashvili, N.; Sutton, D. Environmental Exposure to Mercury and its Toxico-Pathologic Implications to Public Health. Int. J. Environ. Res. Public Health 2004, 1, 39–73. [Google Scholar]
- ATSDR, Toxicological Profile for Mercury: TP-93/10. In Agency for Toxic Substances and Disease Registry; Centers for Disease Control: Atlanta, Georgia, 1999.
- Murphy, P. M.; Baggiolini, M.; Charo, I. F.; Hébert, C. A.; Horuk, R.; Matsushima, K.; Miller, L. H.; Oppenheim, J. J.; Power, C. A. International Union of Pharmacology. XXII. Nomenclature for Chemokine Receptors. Pharmacological Rev 2000, 52(1), 145–176. [Google Scholar]
- Gupta, S. K.; Gallego, C.; Johnson, G. L. Mitogenic pathways regulated by G proteins oncogenes. Molecular Biology and Cell 1992, 3, 123–128. [Google Scholar]
- Weiss, A.; Schlessinger, J. Switching signals on or off by receptor dimerization. Cell 1998, 94, 277–280. [Google Scholar]
- Steinberg, A. D.; Raveché, E. S.; Laskin, C. A.; Smith, H. R.; Santoro, T.; Miller, M. L.; Plotz, P. H. NIH conference. Systemic lupus erythematosus: insights from animal models. Ann Intern Med 1984, 100, 714–727. [Google Scholar]
- Drappa, J.; Kamen, L. A.; Chan, E.; Georgiev, M.; Ashany, D.; Marti, F.; King, P. D. Impaired T cell death and lupus-like autoimmunity in T cell-specific adapter protein-deficient mice. J. Exp Med 2003, 198(5), 809–821. [Google Scholar]
- Bishop, J. M. Molecular themes in oncogenes. Cell 1991, 64, 235–248. [Google Scholar]
- Hauptmann, R.; Swetly, P. A novel class of human type 1 interferons. Nuclei Acids Res 1985, 13, 4739–4749. [Google Scholar]
- Preble, O. T.; Rothko, K.; Klippel, J. H.; Friedman, R. M.; Johnston, M. I. Interferon-induced 2′–5′ adenylate synthetase in vitro by lymphocytes from systemic lupus erythematosus patients with and without circulating interferon. J. Exp. Med 1983, 157, 2140–2146. [Google Scholar]
- Adolf, G. R. Monoclonal antibodies and enzyme immunoassays specific for human interferon IFNω1: evidence that IFN-ω is a component of human leukocyte IFN. Virology 1990, 175, 410–417. [Google Scholar]
- Cederblad, B.; Blomberg, S.; Vallin, H.; et al. Patients with systemic lupus erythematosus have reduced numbers for circulating natural interferon-alpha-producing cells. J. Autoimmunol 1998, 11, 465–470. [Google Scholar]
- Blomberg, S.; Eloranta, M. L.; Cederblad, B.; et al. Presence of cutaneous interferon-α producing cells in patients with systemic lupus erythematosus. Lupus 2001, 10484–490. [Google Scholar]
- Hylton, W.; Cayley, J.; Dore, C.; Denman, A. M. 2′ 5′Oligoadenylate synthetase induction in lymphocytes of patients with connective tissue diseases. Ann. Rheum. Dis 1986, 45, 220–224. [Google Scholar]
- Ronnblom, L. E.; Alm, G. V.; Oberg, K. E. Autoimmunity after alpha-interferon therapy for malignant carcinoid tumor. Ann. Intern. Med 1991, 115, 178–183. [Google Scholar]
- Ytterberg, S. R.; Schnitzer, T. J. Serum interferon levels in patients with systemic lupus erythematosus. Arthritis Rheum 1982, 25, 401–406. [Google Scholar]
- Ronnblom, L. E.; Alm, G. V.; Oberg, K. E. Possible induction of systemic lupus erythematosus by interferon-α treatment in-patient with a malignant carcinoid tumor. J. Intern. Med 1990, 227, 207–210. [Google Scholar]
- Marrack, P.; Kappler, J.; Mitchell, T. Type I interferon keep activated T cells alive. J. Exp. Med 1999, 189, 521–529. [Google Scholar]
- Su, L.; David, M. Inhibition of B cell receptor-mediated apoptosis by IFN. J. Immunol 1999, 162, 6317–6321. [Google Scholar]
- Blanco, P.; Palucka, A. K.; Gill, M.; Pascual, V.; Banchereau, J. Induction of dendritic cell differentiation by IFN-α in systemic lupus erythymatosus. Science 2001, 294, 1540–1543. [Google Scholar]
- Ronnblom, L.; Alm, G. V. An etiopathogenic role for the type I IFN system in SLE. Trends Immunol 2001, 22, 427–431. [Google Scholar]
- Neubauer, R. H.; Goldstein, L.; Rabin, H.; Stebbing, N. Stimulation of in vitro immunoglobulin production by interferon-α. J. Immunol 1985, 134, 299–303. [Google Scholar]
- Moore, P. A.; Belvedere, O.; Orr, A.; Bly, S. member of the tumor necrosis factor family and B lymphocyte stimulator. Science 1999, 285, 260–263. [Google Scholar]
- Hultman, P.; Lindh, U.; Horsted-Bindsev, P. Activation of the immune system and systemic immune-complex deposits in Brown Norway rats with dental amalgam restorations. J. Dent. Res 1998, 77, 1415–1425. [Google Scholar]
- Hultman, P.; Bell, L. J.; Enestrom, S.; Pollard, K. M. Murine susceptibility to mercury. I. Autoantibody profiles and systemic immune deposits in inbred, congenic and intra-H-2 recombinant strains. Clin. Immunol. Immuno-Pathol 1992, 65, 98–108. [Google Scholar]
- Hultman, P.; Bell, L. J.; Eneström, S.; Pollard, K. M. Murine susceptibility to mercury. II. Autoantibody profiles and renal immune deposits in hybrid, backcross, and H-2d congenic mice. Clin. Immunol. Immuno. Pathol 1993, 68, 9–17. [Google Scholar]
- Kono, D. H.; Balomenos, D.; Pearson, D. L.; Park, M. S.; Gildebrandt, B.; Hultman, P.; Pollard, K. M. The prototypic Th2 autoimmunity induced by mercury is dependent on IFN- γ and not TH1/TH2 imbalance. J. Immunol 1998, 161, 234–240. [Google Scholar]
- Hanley, G. A.; Schiffenbauer, J.; Sobel, E. S. Class II haplotype differentially regulates immune response in HgCl2-treated mice. Clin Immunol Immunopathol 1997, 84, 328–333. [Google Scholar]
- Hanley, G. A.; Schiffenbauer, J.; Sobel, E. S. Resistance to HgCl2-induced autoimmunity in haplotype-heterozygous mice is an intrinsic property of B cells. J. Immunol 2002, 161(4), 1778–1789. [Google Scholar]
- Hirsch, F.; Kuhn, J.; Ventura, M.; Vial, M-C.; Fournie, G.; Druet, P. Autoimmunity induced by HgCl2 in Brown-Norway rats I. Production of monoclonal antibodies. J. Immunol 1986, 36, 3272–3276. [Google Scholar]
- Van der Pouw Kraan, T. C. T. M.; Van Gaalen, F. A.; Huizinga, T. W.; Pieterman, E.; Breedveld, F. C.; Verweij, C. L. Discovery of distinctive gene expression profiles in rheumatoid synovium using cDNA microarray technology: evidence for the existence of multiple pathways of tissue destruction and repair. Genes and Immunity 2003, 4, 187–196. [Google Scholar]
- Fukui, Y.; Hashimoto, O.; Sanui, T.; Oono, T.; Koga, H.; Abe, M.; Inayoshi, A.; Noda, M.; Oike, M.; Shirai, T.; Sasazuki, T. Haematopoietic cell specific CDM family protein DOCK2 is essential for lymphocyte migration. Nature 2001, 412, 826–831. [Google Scholar]
- Firestein, G. S.; Manning, A. M. Signal transduction and transcription factors in rheumatic disease. Arthritis Rheum 1999, 42, 609–21. [Google Scholar]
- Shi, X.; Xie, C.; Kreska, D.; Richardson, J. A.; Mohan, C. Genetic Dissection of SLE. SLE1 and FAS Impact Alternate Pathways Leading to Lymphoproliferative Autoimmunity. J. Exp. Med 2002, 196, 281–292. [Google Scholar]
- Manoury-Schwartz, B.; Chiocchia, G.; Bessis, N.; Abehsira-Amar, O.; Batteux, F.; Muller, S.; Huang, S.; Boissier, M. C.; Fournier, C. High susceptibility to collagen-induced arthritis in mice lacking IFN- γ receptors. J. Immunol 1997, 158, 5501–5506. [Google Scholar]
- Vermeire, K.; Heremans, H.; Vandeputte, M.; Huang, S.; Billiau, A.; Matthys, P. Accelerated collagen-induced arthritis in IFN-γ receptor-deficient mice. J. Immunol 1997, 158, 5507–5513. [Google Scholar]
- Shan, X. C.; Bourdeau, A.; Rhoton, A. Characterization and mapping to human chromosome 8q24.3 of Ly-6-related gene 9804 encoding an apparent homologue of mouse TSA-1. J. Immunol 1998, 160, 197–208. [Google Scholar]
- Andre, I.; Gonzalez, A.; Wang, B.; Katz, J.; Benoist, C.; Mathis, D. Checkpoints in the progression of autoimmune disease: lessons from diabetes models. Proc Natl Acad Sci USA 1996, 93, 2260–2274. [Google Scholar]
- Hultgren, B.; Huang, X.; Dybdal, N.; Stewart, T. A. Genetic absence of gamma-interferon delays but does not prevent diabetes in NOD mice. Diabetes 1996, 45, 812–819. [Google Scholar]
- Hall, A. Ras-related proteins. Current Opinion in Cellular Biology 1993, 5, 265–268. [Google Scholar]
- Lowy, D. R.; Williamson, B. M. Function and regulation of Ras. Annual Review of Biochemistry 1993, 62, 851–891. [Google Scholar]
- Ayensu, W. K.; Tchounwou, P. B.; McMurray, R. W. Molecular and Cellular Mechanisms Associated with Autoimmune Diseases. Int. J. Environ. Res. Public Health 2004, 1, 39–74. [Google Scholar]
- Affymetrix manual: Affymetrix Technical Gene Chip manual version 5.0 2002.
- Tsao, B. P.; Cantor, R. M.; Kalunian, K. C.; et al. Evidence for linkage of a candidate chromosome 1 region to human systemic lupus erythematosus. J. Clin Invest 1997, 99, 725–731. [Google Scholar]
- Drysdale, C. M.; McGraw, D. W.; Stack, C. B.; et al. Complex promoter and coding region beta 2-adrenergic receptor haplotypes alter receptor expression and predict in vivo responsiveness. Proc Natl Acad Sci USA 2000, 97, 10483–8. [Google Scholar]
- Ruiz-Vera, A.; Gonzα1lez De Buitrago, G.; Martinez-A, C. Implication of calpain in caspase activation during B cell clonal deletion. EMBO J 1999, 18, 4988–4998. [Google Scholar]
- Wu, M.; Arsula, M.; Bellas, R. E.; FitzGerald, M. J.; Lee, H.; Schauer, S. L.; Sherr, D. H.; Sonensheink, G. E. Inhibition of NF-κB/Rel induces apoptosis of murine B cells. Mol. Cell Biol 1996, 16, 5015–5025. [Google Scholar]
- Massagué, J.; Wotton, D. Transcriptional control by the TGF-β/Smad signaling system. EMBO J 2000, 19, 1745–1754. [Google Scholar]
- ten Dijke, P.; Miyazono, K.; Heldin, C-H. Signalling input converge on nuclear effectors in TGF-β signaling. Trends Biochem. Sci 2000, 25, 64–70. [Google Scholar]
- Zhang, Y.; Derynck, R. Regulation of Smad signalling by protein associations and signalling crosstalk. Trends Cell Biol 1999, 9, 274–279. [Google Scholar]
- Wakeland, E. K.; Liu, K.; Graham, R. R.; Behrens, T. W. Delineating the genetic basis of systemic lupus erythematosus. Immunity 2001, 15, 397–408. [Google Scholar]
- Moser, L. M.; Neas, B. R.; Salmon, J. E.; Yu, H.; Gray-McGuire, C.; Asundi, N.; Fox, J.; Kelly, J.; Henshall, S.; Bacino, D.; Dietz, M.; Hogue, R.; Koelsch, G.; Nightingale, L.; Shaver, T.; Abdou, N. I.; Albert, D. A.; Carson, C.; Petr, M.; Treadwell, E. L.; James, J. A.; Harley, J. B. Genome scan of human systemic lupus erythematosus: Evidence for linkage on chromosome 1q in African-American pedigrees. Proc. Nat. Acad. Sci. USA 1998, 95, 14869–74. [Google Scholar]
- Deapen, D. M.; Escalante, A.; Weinrib, L.; Horwitz, D. A.; Mack, M. A revised estimate of twin concordance in systemic lupus erythematosus. Arthritis Rheum 1992, 35, 311–318. [Google Scholar]
- Gaffney, P. M.; Ortmann, W. A.; Selby, S. A.; et al. Genome screening in human systemic lupus erythematosus: results from a second Minnesota cohort and combined analyses of sib-pair families. Am J Human Genet 2000, 66, 547–556. [Google Scholar]
© 2006 MDPI. All rights reserved.