Disparities in Outcomes following Resection of Locally Advanced Rectal Cancer

 , ,
, , 
Abstract
1. Introduction
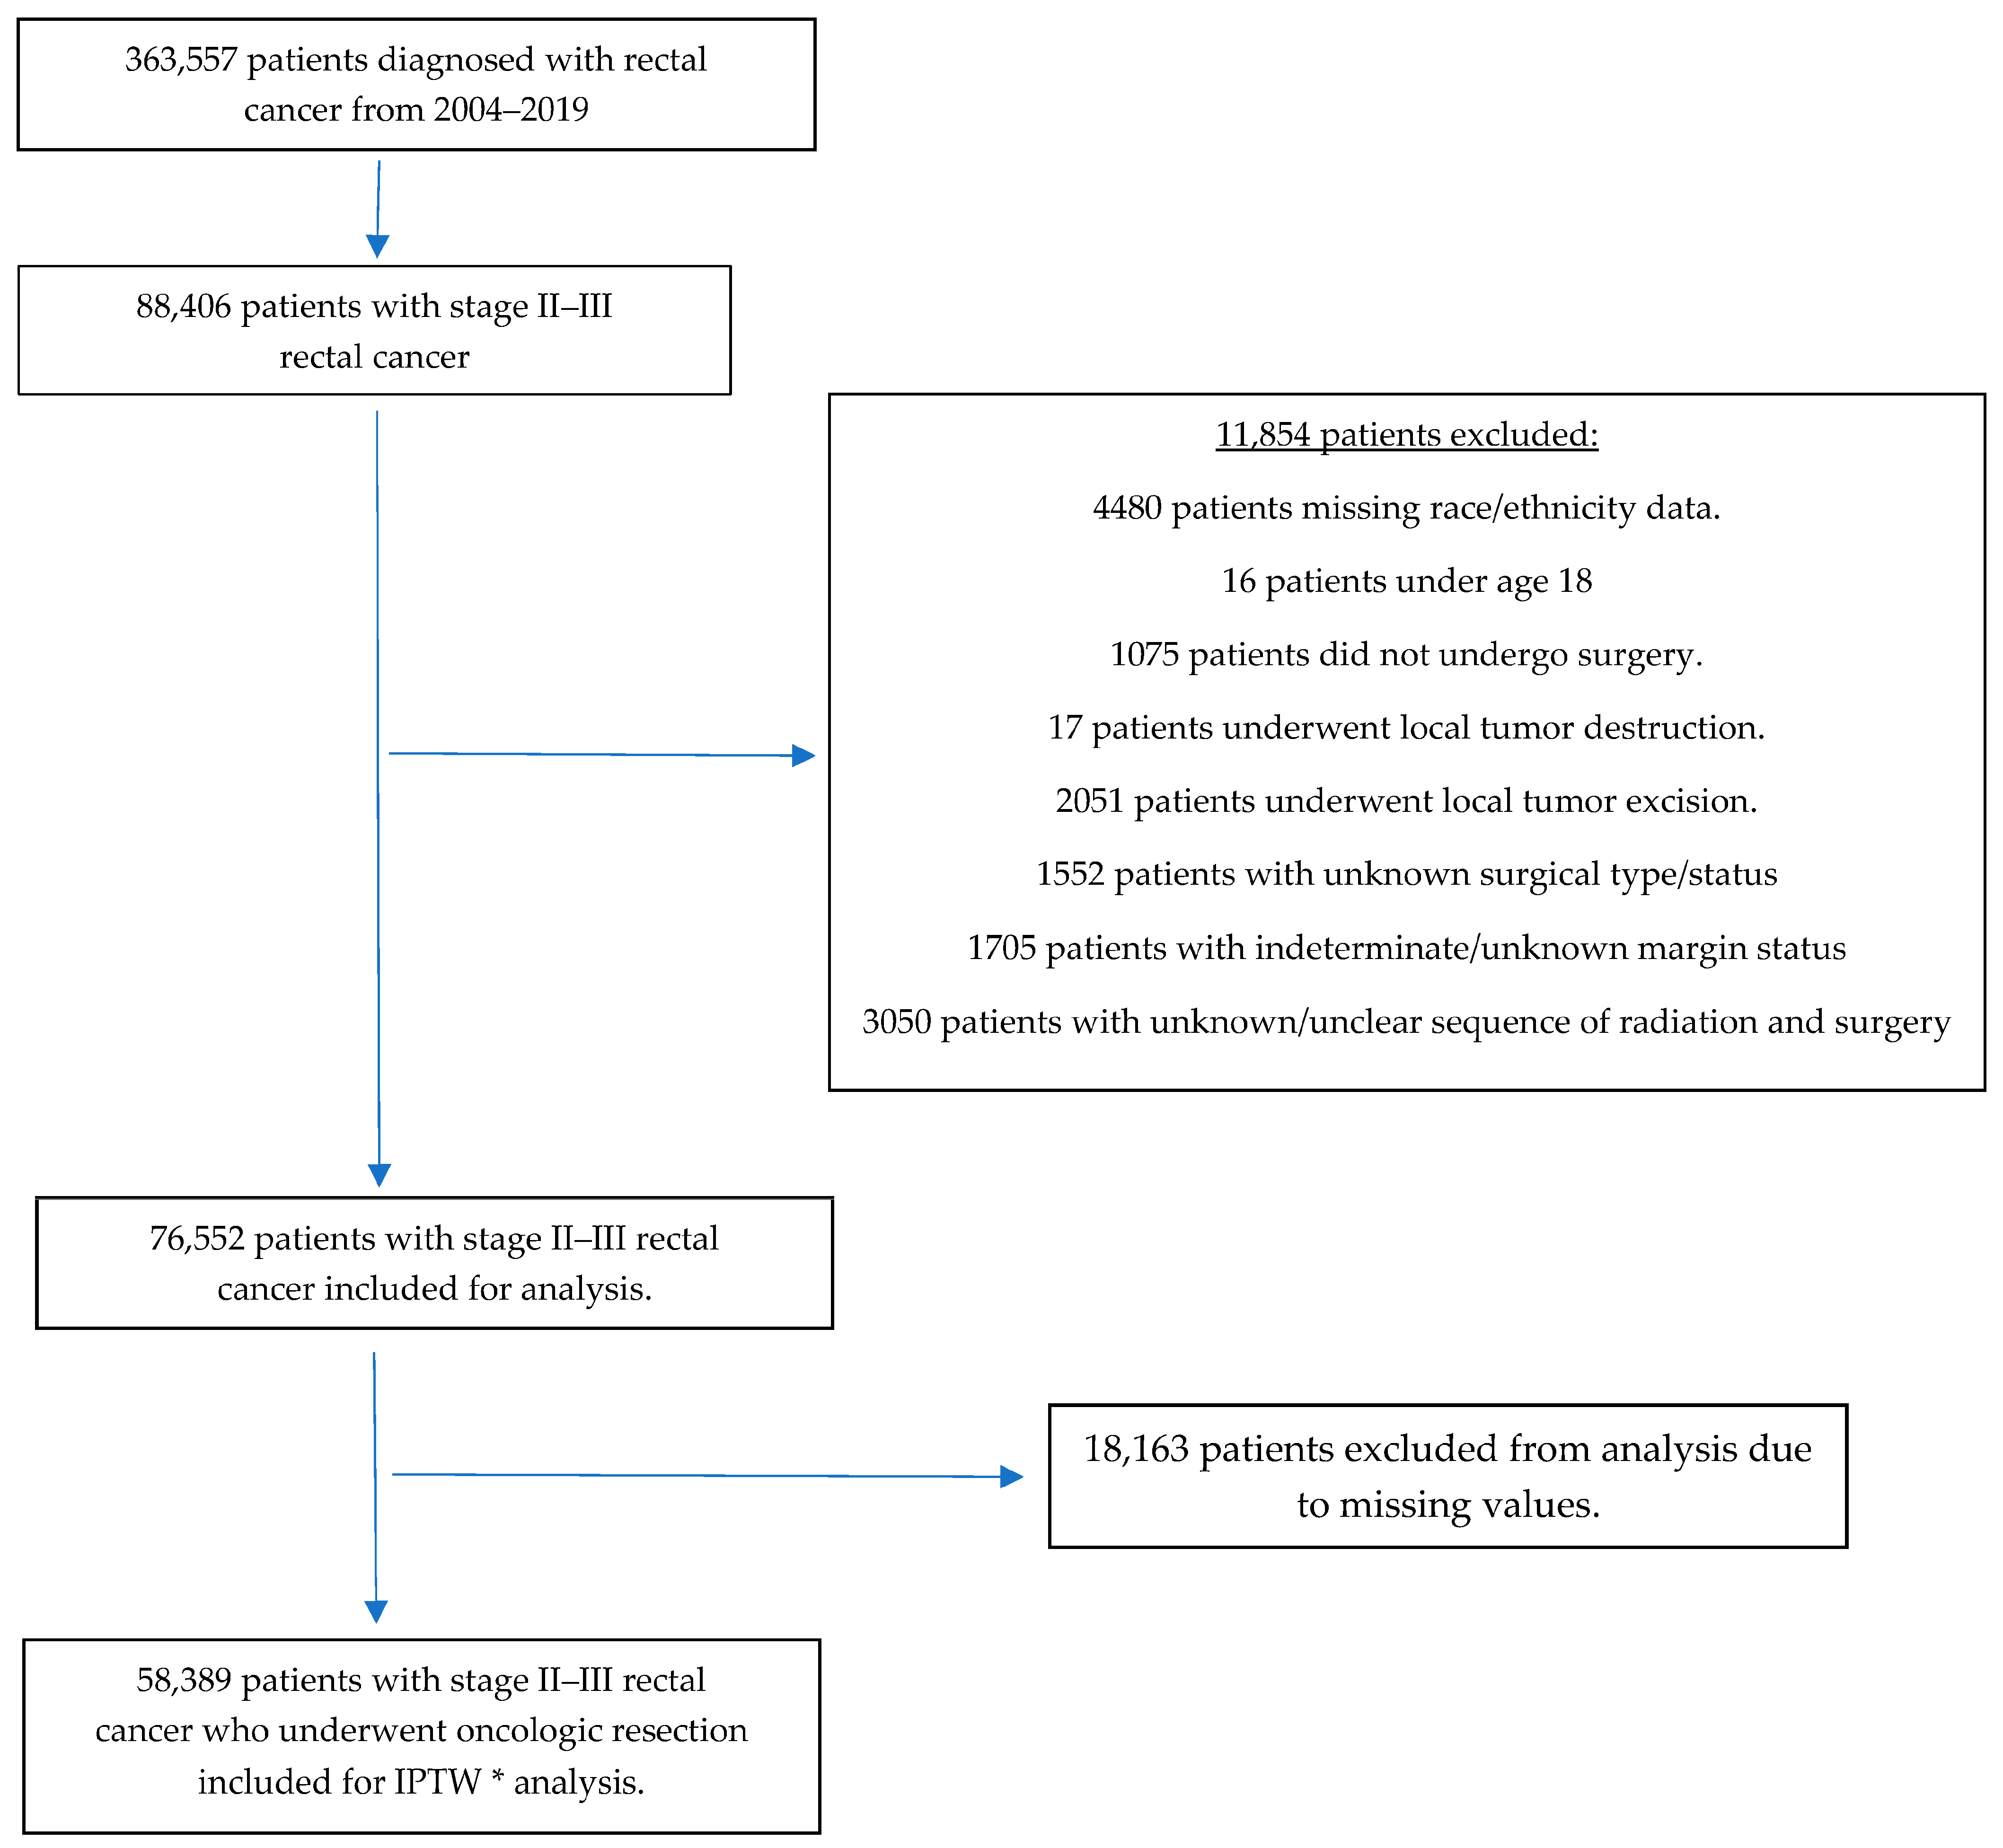
2. Methods
3. Results
3.1. Baseline Demographics
3.2. Multivariable ITPW Analysis
3.3. Regional Variations in Positive Margins
3.4. Variations in Positive Margins by Type of Facility
4. Discussion
Supplementary Materials
Author Contributions
Funding
Institutional Review Board Statement
Informed Consent Statement
Data Availability Statement
Acknowledgments
Conflicts of Interest
References
- Siegel, R.L.; Miller, K.D.; Fuchs, H.E.; Jemal, A. Cancer statistics, 2022. CA Cancer J. Clin. 2022, 72, 7–33. [Google Scholar] [CrossRef]
- Sharma, I.; Kim, S.; Sridhar, S.; Basha, R. Colorectal Cancer: An Emphasis on Factors Influencing Racial/Ethnic Disparities. Crit. Rev. Oncog. 2020, 25, 151–160. [Google Scholar] [CrossRef]
- Howard, R.; Hendren, S.; Patel, M.; Gunaseelan, V.M.; Wixson, M.; Waljee, J.; Englesbe, M.; Bicket, M.C. Racial and Ethnic Differences in Elective Versus Emergency Surgery for Colorectal Cancer. Ann. Surg. 2023, 278, e51–e57. [Google Scholar] [CrossRef] [PubMed]
- May, F.P.; Almario, C.V.; Ponce, N.; Spiegel, B.M.R. Racial Minorities Are More Likely Than Whites to Report Lack of Provider Recommendation for Colon Cancer Screening. Am. J. Gastroenterol. 2015, 110, 1388–1394. [Google Scholar] [CrossRef]
- Snyder, R.A.; Hu, C.Y.; Zafar, S.N.; Francescatti, A.; Chang, G.J. Racial Disparities in Recurrence and Overall Survival in Patients with Locoregional Colorectal Cancer. J. Natl. Cancer Inst. 2021, 113, 770–777. [Google Scholar] [CrossRef] [PubMed]
- American Cancer Society. Cancer Facts & Figures 2023; American Cancer Society: Atlanta, GA, USA, 2023. [Google Scholar]
- Quirke, P.; Dixon, M.F.; Durdey, P.; Williams, N.S. Local recurrence of rectal adenocarcinoma due to inadequate surgical resection. Histopathological study of lateral tumour spread and surgical excision. Lancet 1986, 2, 996–999. [Google Scholar] [CrossRef]
- Mukkai Krishnamurty, D.; Wise, P.E. Importance of surgical margins in rectal cancer. J. Surg. Oncol. 2016, 113, 323–332. [Google Scholar] [CrossRef] [PubMed]
- MERCURY Study Group. Diagnostic accuracy of preoperative magnetic resonance imaging in predicting curative resection of rectal cancer: Prospective observational study. BMJ 2006, 333, 779. [Google Scholar] [CrossRef] [PubMed]
- Rickles, A.S.; Dietz, D.W.; Chang, G.J.; Wexner, S.D.; Berho, M.E.; Remzi, F.H.; Greene, F.L.; Fleshman, J.W.; Abbas, M.A.; Peters, W.; et al. High Rate of Positive Circumferential Resection Margins Following Rectal Cancer Surgery: A Call to Action. Ann. Surg. 2015, 262, 891–898. [Google Scholar] [CrossRef]
- Nagtegaal, I.D.; Quirke, P. What Is the Role for the Circumferential Margin in the Modern Treatment of Rectal Cancer? J. Clin. Oncol. 2008, 26, 303–312. [Google Scholar] [CrossRef]
- Trakarnsanga, A.; Gonen, M.; Shia, J.; Goodman, K.A.; Nash, G.M.; Temple, L.K.; Guillem, J.G.; Paty, P.B.; Garcia-Aguilar, J.; Weiser, M.R. What is the Significance of the Circumferential Margin in Locally Advanced Rectal Cancer After Neoadjuvant Chemoradiotherapy? Ann. Surg. Oncol. 2013, 20, 1179–1184. [Google Scholar] [CrossRef] [PubMed]
- Detering, R.; Rutgers, M.L.W.; Bemelman, W.A.; Hompes, R.; Tanis, P.J. Prognostic importance of circumferential resection margin in the era of evolving surgical and multidisciplinary treatment of rectal cancer: A systematic review and meta-analysis. Surgery 2021, 170, 412–431. [Google Scholar] [CrossRef] [PubMed]
- Lee, D.Y.; Teng, A.; Pedersen, R.C.; Tavangari, F.R.; Attaluri, V.; McLemore, E.C.; Stern, S.L.; Bilchik, A.J.; Goldfarb, M.R. Racial and Socioeconomic Treatment Disparities in Adolescents and Young Adults with Stage II–III Rectal Cancer. Ann. Surg. Oncol. 2017, 24, 311–318. [Google Scholar] [CrossRef] [PubMed]
- Bocca, G.; Mastoridis, S.; Yeung, T.; James, D.R.C.; Cunningham, C. Visceral-to-subcutaneous fat ratio exhibits strongest association with early post-operative outcomes in patients undergoing surgery for advanced rectal cancer. Int. J. Color. Dis. 2022, 37, 1893–1900. [Google Scholar] [CrossRef] [PubMed]
- Russell, M.C.; You, Y.N.; Hu, C.-Y.; Cormier, J.N.; Feig, B.W.; Skibber, J.M.; Rodriguez-Bigas, M.A.; Nelson, H.; Chang, G.J. A Novel Risk-Adjusted Nomogram for Rectal Cancer Surgery Outcomes. JAMA Surg. 2013, 148, 769. [Google Scholar] [CrossRef] [PubMed]
- Bakkila, B.F.; Kerekes, D.; Nunez-Smith, M.; Billingsley, K.G.; Ahuja, N.; Wang, K.; Oladele, C.; Johnson, C.H.; Khan, S.A. Evaluation of Racial Disparities in Quality of Care for Patients with Gastrointestinal Tract Cancer Treated with Surgery. JAMA Netw. Open 2022, 5, e225664. [Google Scholar] [CrossRef] [PubMed]
- Chesnaye, N.C.; Stel, V.S.; Tripepi, G.; Dekker, F.W.; Fu, E.L.; Zoccali, C.; Jager, K.J. An introduction to inverse probability of treatment weighting in observational research. Clin. Kidney J. 2022, 15, 14–20. [Google Scholar] [CrossRef]
- Deyo, R.; Cherkin, D.C.; Ciol, M.A. Adapting a clinical comorbidity index for use with ICD-9-CM administrative databases. J. Clin. Epidemiol. 1992, 45, 613–619. [Google Scholar] [CrossRef]
- Naffouje, S.A.; Ali, M.A.; Kamarajah, S.K.; White, B.; Salti, G.I.; Dahdaleh, F. Assessment of Textbook Oncologic Outcomes Following Proctectomy for Rectal Cancer. J. Gastrointest. Surg. 2022, 26, 1286–1297. [Google Scholar] [CrossRef]
- Simon, H.L.; De Paula, T.R.; Profeta Da Luz, M.M.; Kiran, R.P.; Keller, D.S. Predictors of Positive Circumferential Resection Margin in Rectal Cancer: A Current Audit of the National Cancer Database. Dis. Colon Rectum. 2021, 64, 1096–1105. [Google Scholar] [CrossRef]
- Alimena, S.; Davis, M.; Pelletier, A.; Terry, K.; King, M.; Feldman, S. Regional Variation in Access to Oncologic Care and Racial Disparities Among Cervical Cancer Patients. Am. J. Clin. Oncol. 2022, 45, 415–421. [Google Scholar] [CrossRef]
- Brady, J.T.; Xu, Z.; Scarberry, K.B.; Saad, A.; Fleming, F.J.; Remzi, F.H.; Wexner, S.D.; Winchester, D.P.; Monson, J.R.; Lee, L.; et al. Evaluating the Current Status of Rectal Cancer Care in the US: Where We Stand at the Start of the Commission on Cancer’s National Accreditation Program for Rectal Cancer. J. Am. Coll. Surg. 2018, 226, 881–890. [Google Scholar] [CrossRef] [PubMed]
- Shannon, A.B.; Straker, R.J.; Keele, L.; Kelz, R.R.; Fraker, D.L.; Roses, R.E.; Miura, J.T.; Karakousis, G.C. The impact of hospital volume on racial disparities in resected rectal cancer. J. Surg. Oncol. 2022, 125, 465–474. [Google Scholar] [CrossRef]
- Justiniano, C.F.; Aquina, C.T.; Fleming, F.J.; Xu, Z.; Boscoe, F.P.; Schymura, M.J.; Temple, L.K.; Becerra, A.Z. Hospital and surgeon variation in positive circumferential resection margin among rectal cancer patients. Am. J. Surg. 2019, 218, 881–886. [Google Scholar] [CrossRef]
- Chern, H.; Chou, J.; Donkor, C.; Shia, J.; Guillem, J.G.; Nash, G.M.; Paty, P.B.; Temple, L.K.; Wong, D.W.; Weiser, M.R. Effects of Obesity in Rectal Cancer Surgery. J. Am. Coll. Surg. 2010, 211, 55–60. [Google Scholar] [CrossRef] [PubMed]
- Yuval, J.B.; Patil, S.; Gangai, N.; Omer, D.M.; Akselrod, D.G.; Fung, A.; Harmath, C.B.; Kampalath, R.; Krehbiel, K.; Lee, S.; et al. MRI assessment of rectal cancer response to neoadjuvant therapy: A multireader study. Eur. Radiol. 2023, 33, 5761–5768. [Google Scholar] [CrossRef] [PubMed]
- Centers for Disease Control and Prevention. 2022. Available online: https://www.cdc.gov/obesity/php/data-research/adult-obesity-facts.html (accessed on 12 April 2024).
- Handa, V.L.; Lockhart, M.E.; Fielding, J.R.; Bradley, C.S.M.; Brubaker, L.; Cundiff, G.W.; Ye, W.; Richter, H.E. Racial Differences in Pelvic Anatomy by Magnetic Resonance Imaging. Obstet. Gynecol. 2008, 111, 914–920. [Google Scholar] [CrossRef]
- Chau, J.; Solomon, J.; Liberman, A.S.; Charlebois, P.; Stein, B.; Lee, L. Pelvic dimensions on preoperative imaging can identify poor-quality resections after laparoscopic low anterior resection for mid- and low rectal cancer. Surg. Endosc. 2020, 34, 4609–4615. [Google Scholar] [CrossRef] [PubMed]
- Baik, S.H.; Kim, N.K.; Lee, K.Y.; Sohn, S.K.; Cho, C.H.; Kim, M.J.; Kim, H.; Shinn, R.K. Factors Influencing Pathologic Results after Total Mesorectal Excision for Rectal Cancer: Analysis of Consecutive 100 Cases. Ann. Surg. Oncol. 2008, 15, 721–728. [Google Scholar] [CrossRef]
- Boyle, K.M.; Petty, D.; Chalmers, A.G.; Quirke, P.; Cairns, A.; Finan, P.J.; Sagar, P.M.; Burke, D. MRI assessment of the bony pelvis may help predict resectability of rectal cancer. Colorectal Dis. 2005, 7, 232–240. [Google Scholar] [CrossRef]
- Greenwald, A.G.; Banaji, M.R. Implicit social cognition: Attitudes, self-esteem, and stereotypes. Psychol. Rev. 1995, 102, 4–27. [Google Scholar] [CrossRef] [PubMed]
- Zebib, L.; Strong, B.; Moore, G.; Ruiz, G.; Rattan, R.; Zakrison, T.L. Association of Racial and Socioeconomic Diversity With Implicit Bias in Acute Care Surgery. JAMA Surg. 2019, 154, 459. [Google Scholar] [CrossRef] [PubMed]
- Haider, A.H.; Schneider, E.B.; Sriram, N.; Dossick, D.S.; Scott, V.K.; Swoboda, S.M.; Losonczy, L.; Haut, E.R.; Efron, D.T.; Pronovost, P.J.; et al. Unconscious race and class bias: Its association with decision making by trauma and acute care surgeons. J. Trauma Acute Care Surg. 2014, 77, 409–416. [Google Scholar] [CrossRef] [PubMed]

| Characteristic | All (N = 58,389) | Non-Hispanic White (N = 47,130) | Non-Hispanic Black (N = 4902) | Hispanic (N = 3652) | Non-Hispanic Other (N = 2705) | p-Value | |||||
|---|---|---|---|---|---|---|---|---|---|---|---|
| Median | IQR | Median | IQR | Median | IQR | Median | IQR | Median | IQR | ||
| Age (years) * | 62 | 19 | 63 | 19 | 60 | 18 | 59 | 19 | 60 | 18 | <0.0001 |
| Time between diagnosis and definitive surgery (days) * | 102 | 111 | 100 | 109 | 111 | 116 | 113 | 118.5 | 110 | 114 | <0.0001 |
| a Distance between patient’s address and facility (miles) * | 10.9 | 22 | 12 | 24.1 | 7.4 | 13.7 | 7.8 | 11.7 | 7.7 | 11.6 | <0.0001 |
| Sex * | N | % | N | % | N | % | N | % | N | % | <0.0001 |
| Male | 33,713 | 60.26 | 27,439 | 60.49 | 2634 | 56.69 | 2154 | 63.45 | 1486 | 58.34 | |
| Female | 22,236 | 39.74 | 17,922 | 39.51 | 2012 | 43.31 | 1241 | 36.55 | 1061 | 41.66 | |
| Charlson–Deyo comorbidity score * | <0.0001 | ||||||||||
| 0 | 42,022 | 75.11 | 34,031 | 75.02 | 3390 | 72.97 | 2604 | 76.7 | 1997 | 78.41 | |
| 1 | 10,385 | 18.56 | 8375 | 18.46 | 944 | 20.32 | 619 | 18.23 | 447 | 17.55 | |
| 2 | 2435 | 4.35 | 2053 | 4.53 | 206 | 4.43 | 113 | 3.33 | 63 | 2.47 | |
| 3 or more | 1107 | 1.98 | 902 | 1.99 | 106 | 2.28 | 59 | 1.74 | 40 | 1.57 | |
| Pathologic Stage | 0.074 | ||||||||||
| 2 | 24,465 | 43.73 | 19,904 | 43.88 | 2037 | 43.84 | 1446 | 42.59 | 1078 | 42.32 | |
| 3 | 31,484 | 56.27 | 25,457 | 56.12 | 2609 | 56.16 | 1949 | 57.41 | 1469 | 57.68 | |
| Pathologic Grade | 0.51 | ||||||||||
| Moderately Differentiated | 41,880 | 74.85 | 33,984 | 74.92 | 3472 | 74.73 | 2519 | 74.2 | 1905 | 74.79 | |
| Poorly Differentiated | 8531 | 15.25 | 6890 | 15.19 | 733 | 15.78 | 523 | 15.41 | 385 | 15.12 | |
| Undifferentiated | 982 | 1.76 | 813 | 1.79 | 72 | 1.55 | 57 | 1.68 | 40 | 1.57 | |
| Well Differentiated | 4556 | 8.14 | 3674 | 8.1 | 369 | 7.94 | 296 | 8.72 | 217 | 8.52 | |
| Surgery type * | <0.0001 | ||||||||||
| Proctectomy or Proctocolectomy in continuity with other organs, i.e., pelvic exenteration | 1845 | 3.30 | 1447 | 3.19 | 199 | 4.28 | 118 | 3.48 | 81 | 3.18 | |
| Proctectomy, b NOS | 434 | 0.78 | 362 | 0.80 | 31 | 0.67 | 27 | 0.8 | 14 | 0.55 | |
| Proctocolectomy, b NOS | 1465 | 2.62 | 1203 | 2.65 | 130 | 2.8 | 81 | 2.39 | 51 | 2.00 | |
| Pull thru w/sphincter preservation, i.e., coloanal anastomosis | 3839 | 6.86 | 3129 | 6.9 | 318 | 6.84 | 230 | 6.77 | 162 | 6.36 | |
| c Total proctectomy | 12,296 | 21.98 | 10,149 | 22.37 | 1051 | 22.62 | 638 | 18.79 | 458 | 17.98 | |
| d Wedge or segmental resection; partial proctectomy, b NOS | 36,070 | 64.47 | 29,071 | 64.09 | 2917 | 62.79 | 2301 | 67.78 | 1781 | 69.93 | |
| Sequence of radiation treatment relative to surgery, if performed * | 0.033 | ||||||||||
| Intraoperative Radiation | 23 | 0.04 | 21 | 0.05 | . | . | . | . | . | . | |
| Intraoperative Radiation + other radiation therapy administered before or after surgery | 50 | 0.09 | 41 | 0.09 | . | . | . | . | . | . | |
| No radiation treatments given | 16,062 | 28.71 | 13,104 | 28.89 | 1317 | 28.35 | 943 | 27.78 | 698 | 27.4 | |
| Surgery followed by radiation treatment | 11,530 | 20.61 | 9460 | 20.85 | 925 | 19.91 | 655 | 19.29 | 490 | 19.24 | |
| Radiation therapy both before and after surgery | 240 | 0.43 | 197 | 0.43 | 21 | 0.45 | 12 | 0.35 | 10 | 0.39 | |
| Radiation therapy prior to surgery only | 28,044 | 50.12 | 22538 | 49.69 | 2378 | 51.18 | 1781 | 52.46 | 1347 | 52.89 | |
| Facility type * | <0.0001 | ||||||||||
| Academic/Research | 17,623 | 31.5 | 13,450 | 29.65 | 1849 | 39.8 | 1297 | 38.2 | 1027 | 40.32 | |
| Integrated Network Cancer Program | 11,065 | 19.78 | 9083 | 20.02 | 958 | 20.62 | 548 | 16.14 | 476 | 18.69 | |
| Community Cancer Program | 27,261 | 48.72 | 22,828 | 50.33 | 1839 | 39.58 | 1550 | 45.66 | 1044 | 40.99 | |
| Insurance * | <0.0001 | ||||||||||
| Private/Managed care | 24,525 | 43.83 | 20,175 | 44.48 | 1791 | 38.55 | 1342 | 39.53 | 1217 | 47.78 | |
| Uninsured | 2897 | 5.18 | 1918 | 4.23 | 395 | 8.5 | 411 | 12.11 | 173 | 6.79 | |
| Public | 28,527 | 50.99 | 23,268 | 51.3 | 2460 | 52.95 | 1642 | 48.37 | 1157 | 45.43 | |
| e Education * | <0.0001 | ||||||||||
| ≥29.0% | 11,020 | 19.7 | 6781 | 14.95 | 1868 | 40.21 | 1750 | 51.55 | 621 | 24.38 | |
| 20.0–28.9% | 14,710 | 26.29 | 11,873 | 26.17 | 1521 | 32.74 | 779 | 22.95 | 537 | 21.08 | |
| 14.0–19.9% | 15,855 | 28.34 | 13,890 | 30.62 | 803 | 17.28 | 513 | 15.11 | 649 | 25.48 | |
| <14.0% | 14,364 | 25.67 | 12,817 | 28.26 | 454 | 9.77 | 353 | 10.4 | 740 | 29.05 | |
| f Region of USA * | <0.0001 | ||||||||||
| Northeast | 10,749 | 19.21 | 9039 | 19.93 | 716 | 15.41 | 528 | 15.55 | 466 | 18.3 | |
| Midwest | 14,782 | 26.42 | 13,269 | 29.25 | 911 | 19.61 | 291 | 8.57 | 311 | 12.21 | |
| South | 21,052 | 37.63 | 16,303 | 35.94 | 2770 | 59.62 | 1420 | 41.83 | 559 | 21.95 | |
| West | 9366 | 16.74 | 6750 | 14.88 | 249 | 5.36 | 1156 | 34.05 | 1211 | 47.55 | |
| Odds Ratio Estimates and Wald Confidence Intervals | 95% Confidence Limits | p-Value | ||
|---|---|---|---|---|
| Description of Characteristics | b OR | c LCL | d UCL | p-Value |
| Race and Ethnicity | ||||
| Hispanic vs. Non-Hispanic White | 0.96 | 0.85 | 1.08 | 0.45 |
| Non-Hispanic Black vs. Non-Hispanic White | 1.12 * | 1.01 | 1.23 | 0.029 |
| Non-Hispanic Other vs. Non-Hispanic White | 0.92 | 0.80 | 1.06 | 0.26 |
| Facility Type | ||||
| Academic/Research vs. Community Cancer Program | 0.89 * | 0.83 | 0.95 | 0.0006 |
| Facility Integrated Network Cancer vs. Community Cancer Program | 1.03 | 0.95 | 1.11 | 0.48 |
| Region | ||||
| Midwest vs. South | 0.99 | 0.92 | 1.06 | 0.76 |
| Northeast vs. South | 0.91 * | 0.84 | 0.99 | 0.023 |
| West vs. South | 1.05 | 0.97 | 1.14 | 0.24 |
| Race/Ethnicity | In Region | Compared to Race/Ethnicity | In Region | a OR | b LCL for OR | c UCL for OR | p-Value |
|---|---|---|---|---|---|---|---|
| Non-Hispanic Black | West | Non-Hispanic White | West | 1.46 * | 1.03 | 2.09 | 0.036 |
| Non-Hispanic Black | West | Non-Hispanic Other | West | 1.54 * | 1.03 | 2.29 | 0.035 |
| Non-Hispanic Black | Northeast | Non-Hispanic Black | West | 0.58 * | 0.37 | 0.89 | 0.012 |
| Non-Hispanic White | Northeast | Non-Hispanic White | West | 0.89 * | 0.80 | 0.99 | 0.037 |
| Race/Ethnicity | In Facility Type | Compared to Race/Ethnicity | In Facility Type | a OR | b LCL for OR | c UCL for OR | p-Value |
|---|---|---|---|---|---|---|---|
| Non-Hispanic Black | Academic/Research | Non-Hispanic Other | Academic/ Research | 1.53 * | 1.12 | 2.07 | 0.007 |
| Non-Hispanic White | Community Cancer Program | Non-Hispanic White | Academic/ Research | 1.12 * | 1.03 | 1.20 | 0.007 |
| Non-Hispanic White | Integrated Network Cancer Program | Non-Hispanic White | Academic/ Research | 1.15 * | 1.05 | 1.26 | 0.002 |
| Non-Hispanic other | Community Cancer Program | Non-Hispanic Other | Academic/ Research | 1.46 * | 1.06 | 2.00 | 0.02 |
Disclaimer/Publisher’s Note: The statements, opinions and data contained in all publications are solely those of the individual author(s) and contributor(s) and not of MDPI and/or the editor(s). MDPI and/or the editor(s) disclaim responsibility for any injury to people or property resulting from any ideas, methods, instructions or products referred to in the content. |
© 2024 by the authors. Licensee MDPI, Basel, Switzerland. This article is an open access article distributed under the terms and conditions of the Creative Commons Attribution (CC BY) license (https://creativecommons.org/licenses/by/4.0/).
Share and Cite
Luo, W.Y.; Varvoglis, D.N.; Agala, C.B.; Comer, L.H.; Shetty, P.; Wood, T.; Kapadia, M.R.; Stem, J.M.; Guillem, J.G. Disparities in Outcomes following Resection of Locally Advanced Rectal Cancer. Curr. Oncol. 2024, 31, 3798-3807. https://doi.org/10.3390/curroncol31070280
Luo WY, Varvoglis DN, Agala CB, Comer LH, Shetty P, Wood T, Kapadia MR, Stem JM, Guillem JG. Disparities in Outcomes following Resection of Locally Advanced Rectal Cancer. Current Oncology. 2024; 31(7):3798-3807. https://doi.org/10.3390/curroncol31070280
Chicago/Turabian StyleLuo, William Y., Dimitrios N. Varvoglis, Chris B. Agala, Lydia H. Comer, Pragna Shetty, Trevor Wood, Muneera R. Kapadia, Jonathan M. Stem, and José G. Guillem. 2024. "Disparities in Outcomes following Resection of Locally Advanced Rectal Cancer" Current Oncology 31, no. 7: 3798-3807. https://doi.org/10.3390/curroncol31070280
APA StyleLuo, W. Y., Varvoglis, D. N., Agala, C. B., Comer, L. H., Shetty, P., Wood, T., Kapadia, M. R., Stem, J. M., & Guillem, J. G. (2024). Disparities in Outcomes following Resection of Locally Advanced Rectal Cancer. Current Oncology, 31(7), 3798-3807. https://doi.org/10.3390/curroncol31070280