3.1. Comparison of Measurements
A good scale should be able to distinguish between different levels of financial literacy. A scale where all participants get all (or no) questions right would not be very useful.
Table 3 shows, however, that this is not a major issue—probably, with the exception of the scale proposed by
Lusardi and Mitchell (
2011), which might have been too easy for our subjects. A comparison of the proportion of correct answers in our sample with other studies would be of interest, but, given the inherent differences between subject groups, we will refrain from it within the framework of this paper.
Another point to examine is the validity of the proposed scales. To this end, we calculated Cronbach’s Alpha for all eight scales. Generally, high values are desirable, with 0.5 typically being considered as the smallest acceptable value. Yet, given that some of the scales comprised very few items, we cannot expect Cronbach’s Alpha to be too high, so that even a value of 0.4 could be considered sufficient in this case. We found, however, that some of the scales failed to reach this low threshold, which suggests that they might measure other concepts along with financial literacy (compare
Table 4). Accordingly, the scale proposed by
Ćumurović and Hyll (
2019), with or without CRT, was most reliable, while we consider the scale proposed by
Lusardi and Mitchell (
2011) still to be acceptable, given that it consists of only three items.
Reliability, however, is not sufficient for a good scale: A scale can be highly reliable, but, if it measures something entirely different, it cannot successfully serve our purposes. Therefore, we tested the correlations between the various financial literacy measures (see
Table 5). The good news is that most measures do significantly correlate with each other. Thus, despite the fact that the questions included in the scales usually focus on different topics, the scales are still related with each other. The correlation coefficients, however, are often relatively small and sometimes not statistically significant. This means that it matters which scale we use.
Next, we calculated the correlations between the scales and the scores in the five categories mentioned above (specific financial knowledge, financial mathematics, inflation rates, mathematics, and cognitive reflection). In most cases, the correlations were statistically significant (see
Table 6). There were, however, considerable differences between the correlation coefficients (see
Table A1 for a robustness check).
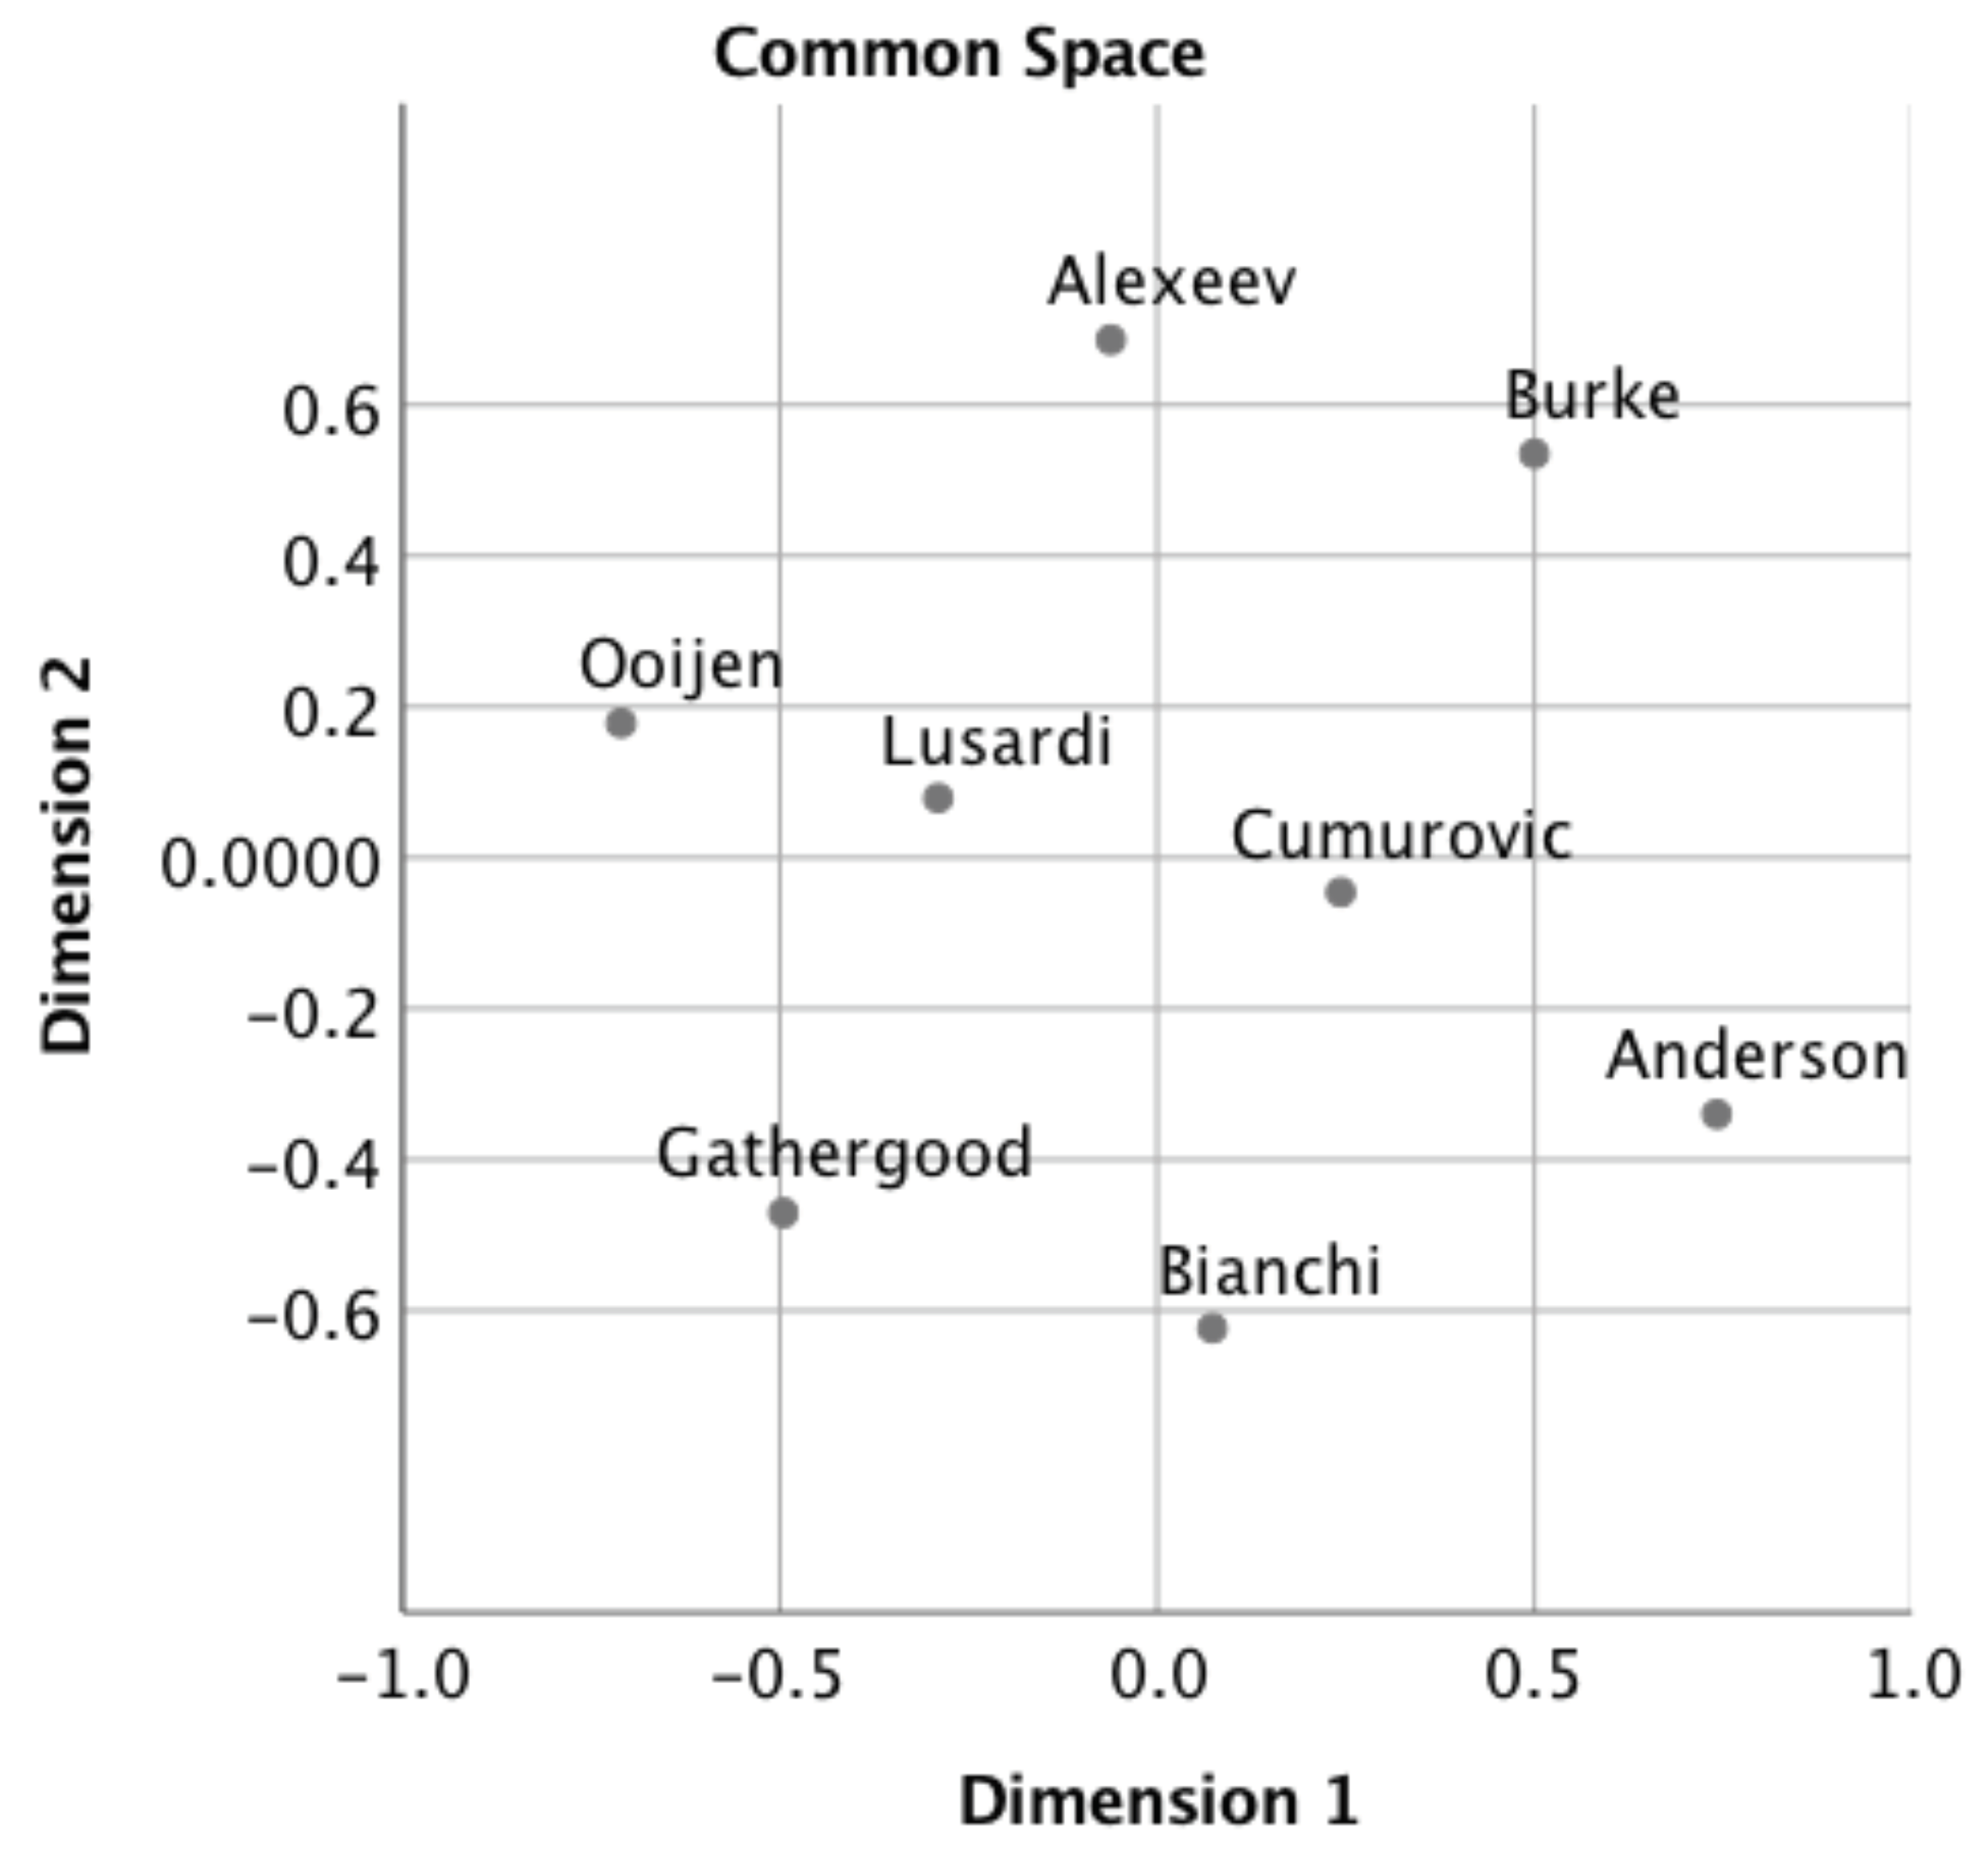
To illustrate the relationship between the existing measures and to find out which of them are the most representative ones, we used multidimensional scaling (PROXimity. SCALing (PROXSCAL)), which allows to depict these relationships graphically (
Figure 1). The graph suggests that the scales proposed by
Lusardi and Mitchell (
2011) and
Ćumurović and Hyll (
2019) might be most representative for the various financial literacy scales.
3.2. Suggested New Measure
In the previous sections, we came to the conclusion that the scales proposed by
Lusardi and Mitchell (
2011) and
Ćumurović and Hyll (
2019) are the ones best suited for measuring financial literacy. We also found that the removal of CRT questions from
Ćumurović and Hyll (
2019) does not impair the overall performance of the scale (compare
Table 4 and
Table 5). Thus, we decided to combine the non-CRT part of the scale proposed by
Ćumurović and Hyll (
2019) with the scale proposed by
Lusardi and Mitchell (
2011). The resulting scale consists of six items, which is a reasonable quantity of items that enables easy measurements. The reliability of the scale is good with Cronbach’s Alpha being 0.62.
The correlation of the suggested scale with other scales is also good, as shown in
Table 7. We also find that the correlation of the suggested scale with the total financial literacy score, which is calculated as the total of the questions included in the eight scales, is excellent (above 80%, see
Table 7). Multidimensional scaling with these additional variables shows that the combined measure gives an even better representation of financial literacy than the scales individually (
Figure 2).
The percentages of correct answers for the individual items in the combined scale are between 60% and 90% (see
Table 8).
3.3. Dependence of Measurement on Other Factors
In the following, we will study several characteristics of the new combined Cumurovic-Lusardi measure (“CL” for short). In particular, we want to find out whether self-assessed financial literacy is related to CL and how demographics (age, gender, education) and cognitive reflection affect CL. Finally, we will also test whether the attitude of individuals towards money is correlated with this financial literacy measure.
As seen in
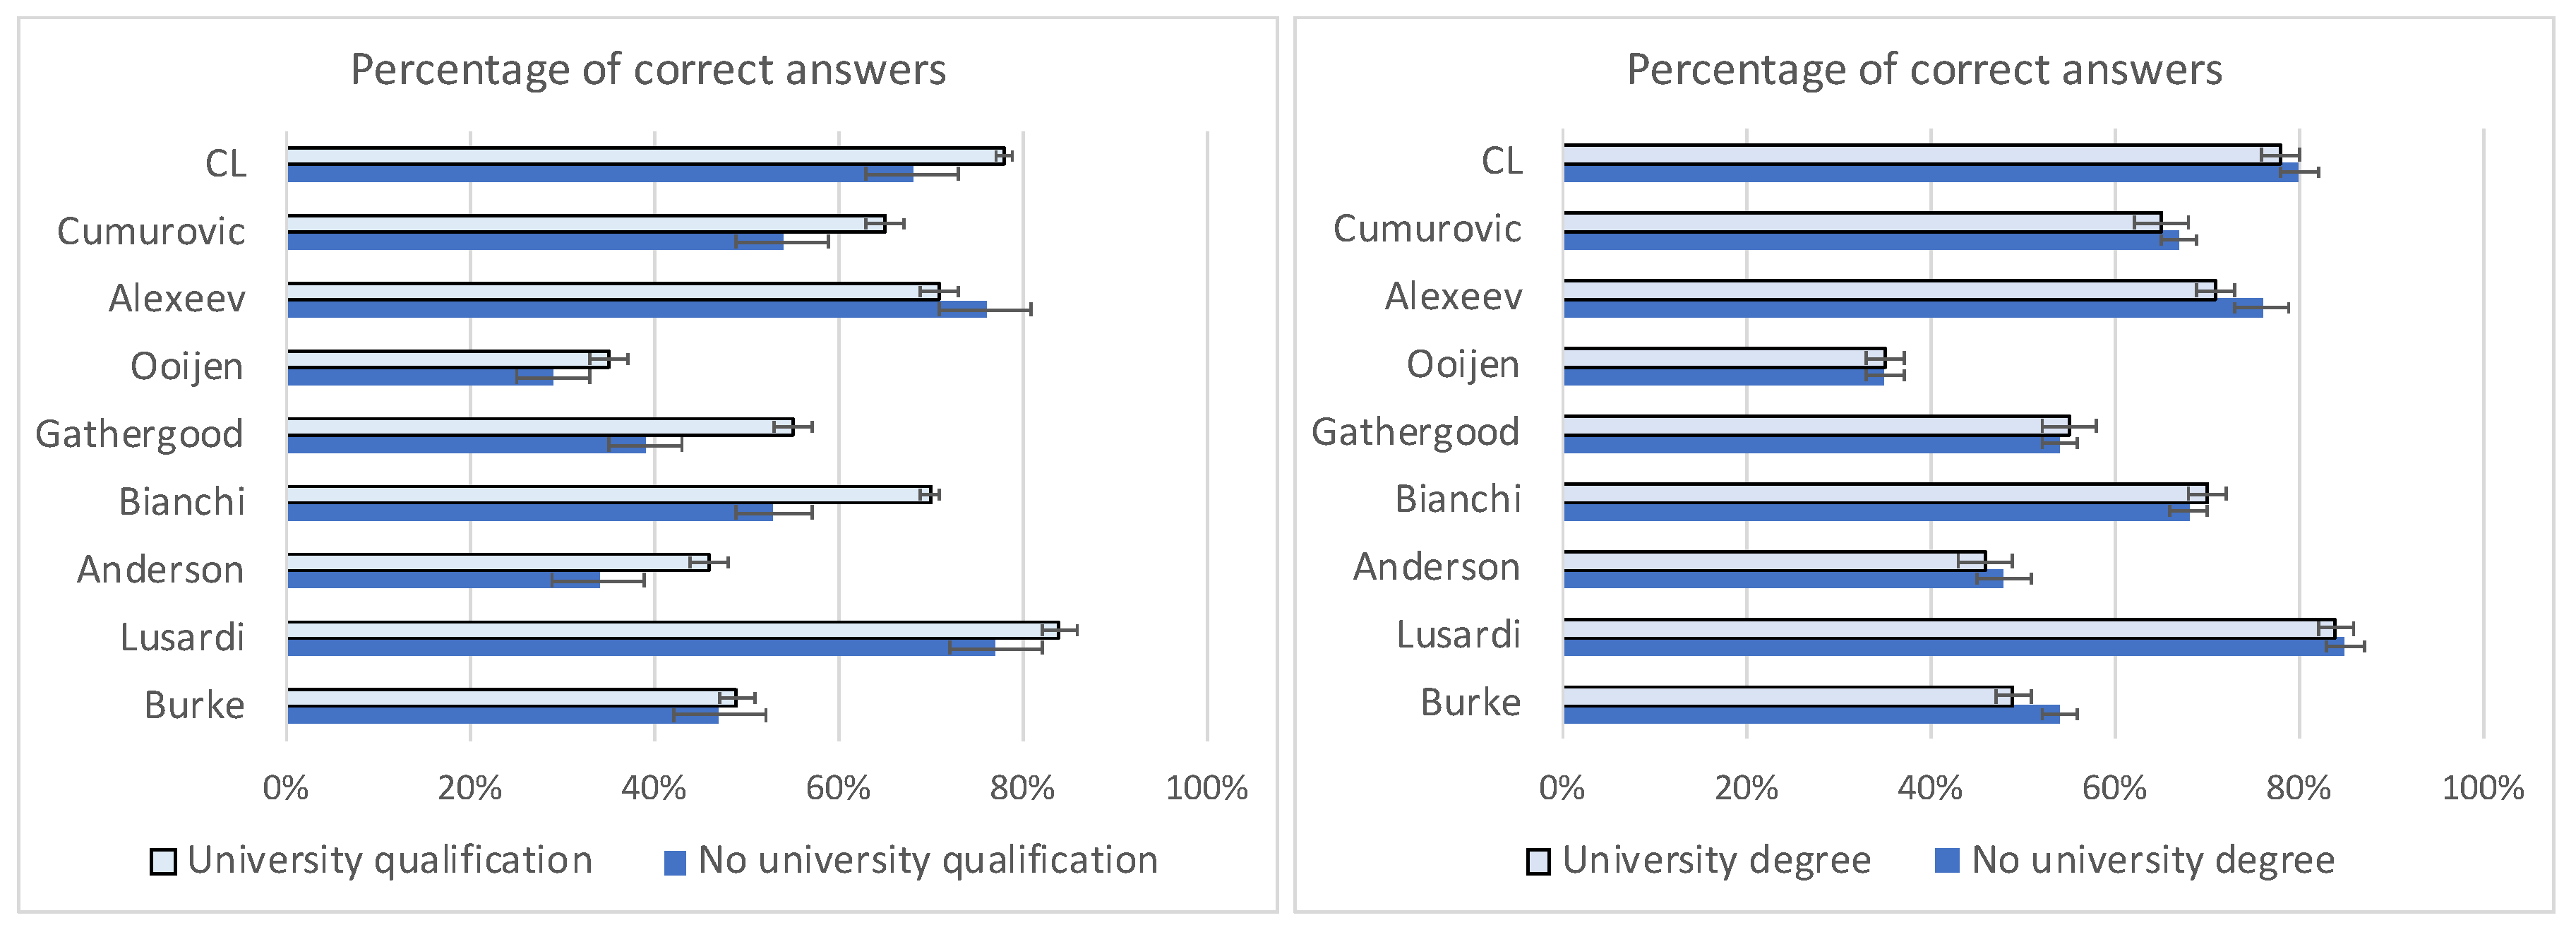
Table 9, CL is higher for males, students, working people, and those having a university degree.
2 There is no significant correlation between the CL-scale and age. Given that the sample is very homogeneous in terms of age, it is no surprise that we do not find age effects. Thus, this finding might be attributable to the composition of our subject pool and should be tested on a more heterogeneous sample.
We also find that CL is not higher for students majoring in economics, but it is higher for students having a university degree. This might appear surprising, but a possible explanation to this is that our undergraduate programs in Business and Economics do not include a finance class in the first year of studies. This means that many students that took our survey had not taken finance classes before. Moreover, the finance class in the second year of studies concentrates mostly on corporate finance and, therefore, might not considerably promote the enhancement of general financial literacy. Subjects with a Bachelor’s degree, on the other hand, do exhibit a higher level of financial literacy.
In addition, further analysis reveals a seemingly surprising result: there is no significant correlation between CL and self-assessed financial literacy (with a Pearson correlation coefficient of 6%). Does this signal a potential error of the new scale?
To find this out, we should take a look at other financial literacy measures for comparison: Burke’s and Anderson’s scales show modest significant correlations with self-assessed financial literacy (21% and 18%, respectively), but all other measures show no significant correlation. It appears that self-assessed financial literacy and measured financial literacy are barely related.
A possible explanation for this interesting observation could be that people tend to compare their knowledge level with that of their peers with similar backgrounds, and, as a result, they report a “relative” level of knowledge. This can also explain why there is no effect of education on self-assessed financial literacy, while we have already observed such an effect for the measured financial literacy. To sum up, one should be cautious about trusting self-assessed financial literacy in surveys.
How is financial literacy related to the attitudes towards money (
Fünfgeld and Wang 2009)? Of the five dimensions (anxiety, need for saving, interest in financial issues, free-spending, and intuitive decisions), only interest in financial issues, anxiety and intuitive decision-making should be a priori related to financial literacy. (Anxiety about financial issues could discourage subjects from familiarizing themselves with this topic, which is needed to increase financial literacy. Intuitive decision-making would be indicative of a less thoughtful approach towards financial affairs, which would again prevent people from making more effort to enhance their financial literacy.) Indeed, in our correlation analysis, we find that these three factors are significantly related to CL, while the same cannot be said about the other two factors (see
Table 10). With the exception of one scale (Burke), none of the other financial literacy measures correlate significantly with these three scales.
3.4. Predictive Power of the New Scale: Stock Investment and Belief in Stock Returns
Within the framework of this study, we have defined a more reliable financial literacy scale that seems to perform well. But we have not discussed its predictive power for actual behavior and attitudes.
To test this, we included two relevant items into our survey regarding stock market investment. The first one was an incentivized question on asset allocation where the subjects could select stocks, and the second one was a question, where the subjects were asked to state to what extent they agreed with the statement that stocks yielded good returns in the long-run.
Table 11 shows that financial literacy—as measured with the CL scale—does, indeed, have an impact on these survey items. This is the case even after controlling for a number of other items, including CRT, demographics or the self-assessed financial literacy. In fact, CL is the only variable that has a strong significant impact on all of these items.
When comparing the external validity of CL with the external validity of other financial literacy measures (see
Table 12 and
Table 13), we see that some of them seem to have no significant external validity with regard to stock investments or the fact of viewing stocks as good long-term investments. In fact, only three scales (Burke, Lusardi, Ooijen) perform as well as CL. We do not claim that this alone proves the superiority of the CL scale because other external validity tests could be conducted that might produce different results. The lack of significance for some of the measures, however, may be indicative of crucial limitations.


