Abstract
The drivers of financial success of the insurance industry are of interest to several players in any economy including the government; policymakers; policyholders; and investors. In Kenya; there have been relatively few studies on this topic; most of which look at narrow elements that determine insurance companies’ performance. This article sought to explore the components contributing to the financial performance of insurance firms. We employed a sample consisting of 37 general insurers and 16 life insurers for the period running from 2009 to 2018 and utilised panel data methods in order to establish the determinants of financial performance of Kenyan insurers. The pooled OLS; fixed effects and random effects models were estimated with the financial performance measures (proxied by either ROA or ROE) as the dependent variables. The results of the study documented that insurer financial performance and size were positively related. The study also found that insurer financial performance was negatively related to the age variable. The study also unraveled that higher leveraged insurance companies performed better than their lowly geared peers. This article provides broad analyses of the various drivers of financial performance of the insurance industry in Kenya. The findings of this study contribute to the academic literature on the financial performance of the insurance sector in Kenya and Africa as a whole. Furthermore; it gives pointers to the management of insurance companies on the aspects of their business that would need greater attention to drive and sustain superior financial performance.
JEL Classification:
G22; G32
1. Introduction
The insurance sector plays a positive part in propelling Kenya’s economy and has registered noteworthy growth over the years. Kenya’s industry gross written premium in 2016, was KES 195.2 billion, a 13% growth on the KES 172.5 billion figure for 2015. Insurance plays a useful role in the economy in general. Life insurance allows main policy holders and their beneficiaries to safeguard against unforeseen deprivation in income through premature death or disability. Property insurance provides a cushion against the loss of business and individual property. Liability insurance provides coverage against legal liability exposures (Cornett and Saunders 2003, pp. 64–74).
Insurance companies are a source of long-term savings which can be used to fund projects that have long maturity periods. Institutional stakeholders such as insurers, pension trusts and sovereign wealth funds have more than USD 80 trillion in assets under management globally that can be deployed to fund long term projects (PwC AWM Research Centre 2017, pp. 6–7). As such the sustainability of the insurance sector is of paramount significance to any economy. There is a demonstrable link between sustainability and financial performance of firms. According to Oncioiu et al. (2020, p. 3) assessing sustainability has become a common practice for all companies that respect their position in the market place and seek to improve or maintain their place there. Notwithstanding the importance of the insurance industry in Kenya, there has been limited research on the determinants of financial performance of insurance firms. The few articles on the drivers of financial performance of insurance firms in Kenya have focused on single issues. Among others, Jelle (2015) examined the contribution of capital structure on the financial soundness of insurance firms recorded on the Nairobi Securities Exchange whereas Nyongesa (2017) analysed the effect of the capital structure of insurance firms on financial performance.
In this study, we sought to address the following objectives: Firstly, we sought to establish whether firm-level factors explain financial performance of Kenyan insurance firms. Secondly, we aimed to find out the influence of insurer-specific determinants on the financial performance of the insurance sector, with particular focus on debt and reinsurance ratios. Lastly, this research effort also intended to assess the impact of investment performance and decisions on the financial performance of insurers in Kenya.
It is envisaged that the findings of this study will build onto the existing academic literature on the financial performance of insurance companies in Africa which is scant. Moreover, management of insurance companies may potentially take cue from this study and identify the business aspects that they should focus on in order to improve the financial performance of the companies that they run.
The remainder of paper is arranged as follows: the next section reviews the theoretical literature as well as empirical literature which focuses on the solvency and underwriting risk in the insurance sector. Section 3 describes the research methodology employed in the study. Section 4 presents and discusses the empirical findings of the study. Section 5 concludes the study and discusses economic and policy implications thereof.
2. Review of Related Literature
2.1. Theoretical Literature
The theories analysed in this section included the shareholder value, stakeholder and financial performance theories.
2.1.1. Shareholder Value Theory
The key narrative around shareholder value is the notion that the overriding objective of management should be the maximization of shareholders’ wealth. The rise in shareholder’s wealth is measured by the increase in monetary value of the investment (capital gains) and escalations in dividend payments. In terms of assessing the performance of the management team of a company, growing the return on assets in the balance sheet over time is an indicator of success (Fligstein and Shin 2007, pp. 403–4).
Greater emphasis on shareholder value has been a major aspect in capitalist countries since the 1980s (Martin et al. 2007, pp. 3–4). Shareholder satisfaction, which has been flagged as a fundamental concept of corporate administration among firms in the United States of America, Australia, and Great Britain in the course of the 1980s and 1990s, has picked steam in many other countries (Lazonick and O’Sullivan 2000, pp. 13–14). The focus on “maximising shareholder value” has kept gathering momentum well into the twenty-first century. The growth of institutional shareholders, as compared to governments and individual shareholders has accelerated the quest for maximisation of shareholder value. The relocation for stockholding from individuals to institutions made it easier to execute the takeovers recommended by agency theorists (Lazonick and O’Sullivan 2000, pp. 13–35). The objective of maximising shareholder value provides the basis for setting performance metrics to motivate managers and signals to investors how well the organisation is performing (Martin et al. 2007, pp. 6–7).
There has been a surge in individual activist investors taking up a sizable stake in companies with the main objective of changing the way management is running a firm, with a view to improve the market and intrinsic worth of the company and as a consequence boost the value of their stakes (Ponomareva 2018). Among institutional investors, hedge funds have played a growing and significant role in shareholder activism (Armour and Cheffins 2009).
2.1.2. Stakeholder Theory
An alternative to the shareholder value theory is the “stakeholder theory”. This theory suggests that managers must come up with and put into action procedures to consider the needs of all the parties that are impacted by the business. The approach for the management of a company under this theory to consider the interests of key company stakeholders for the betterment of the whole organization in the foreseeable long-term. The success of a company is dependent on how well it can balance the diverging needs of its stakeholders (Schwab and Kroos 1971, pp. 20–21).
In Freeman’s (1984) ground-breaking enactment of stakeholder theory he advanced that the main justification of an organization is to be a vehicle looking after the welfare and satisfaction of stakeholder interests over and above its goal of seeking profitability. A stakeholder approach encompasses the active driving of the business conditions, relationships, and the promotion of joint affairs (Freeman and McVea 2001, pp. 10–11).
Jensen (2001) faulted the stakeholder theory arguing that managers are put in a situation in which they are not able to make effective decisions. The theory does not outline specific measurements of performance, therefore; it makes managers unaccountable for their performance. The theory is thus, appealing to managers who are focused on their self-interest. Jensen (2001) further noted that based on evidence running over more than two centuries, social welfare has been maximised when each firm in an economy has the free opportunity to maximise its market value.
Firms with strong shareholder rights have been found to report superior performance across a wide range of metrics (Gompers et al. 2003). An analysis of 1500 large firms during the 1990s came to the conclusion that firms where shareholders’ rights are strong, are found to have higher valuations, greater profitability, have greater revenue growth, incur less capital expenditure and have less need to make acquisitions.
2.1.3. Financial Performance Theory
Financial performance can be stipulated as a subjective estimate of how effectively an organisation uses assets to earn and accumulate revenues (Nandan 2010, pp. 66–74). If a company is utilising its assets in a better way than its peers or competitors, it can be deemed to be doing well from a financial performance perspective.
There are several basic measures of financial performance. These can be expressed as financial ratios which are used to appraise performance by focusing on the company’s financial statement; the balance sheet, income statement, and cash flow statements (Engle 2010). The estimates of return on equity (ROE) and return on assets (ROA) are the key metrics employed in such an assessment.
2.2. Empirical Literature Review
The age of insurer, and corresponding size of the company are the main firm level variables employed in this study. These factors are characteristics of a business and the resources that are unique to a firm. These resources may be financial might, unique technology, in-house knowledge and other privileges including human capital (Barney 1986, pp. 1231–41). The difference in performance levels among competitors within an industry is as a result of the development of these unique attributes to a point where they generate core resources that are difficult to replicate (Barney 1986, pp. 1231–41).
In a paper on the empirical evidence of financial soundness of insurance companies in the United Kingdom by Jadi (2015), size was found to be the most essential element that dictates the financial performance. Further Jadi (2015, pp. 177–79) established that size was of particular importance to general insurers as their performance accelerates more with scale compared to that of life insurers.
In an assessment of the influence of firm-specific factors on the profitability and financial productiveness of general insurance firms within Turkey over eight-year period from 2006 to 2013 Kaya (2015, pp. 525–26) documented that the profitability of non-life insurance establishments was positively connected to the size of the company and premium growth rate. Whereas the financial soundness of Turkish insurance companies was found to have a negative relationship with the age of the company, loss ratio, and current ratio.
According to Derbali (2014, pp. 90–95) size, age, and premium growth rate are the main determinants of the financial performance of insurers in Tunisia. The advantage of age is attributable to the longer experience in the Tunisian insurance market (Derbali 2014, pp. 94–95). Further, size was documented to have statistically negative impact on the performance of insurance firms in Tunisia. Thus, smaller insurance establishments exhibited more efficient operations.
Mehari and Aemiro (2013, pp. 245–46) examined the impact of firm level features on financial performance of nine underwriters in Ethiopia. They established that insurer’s size, tangibility, and leverage were statistically significant and positively related with return on assets (ROA). Growth in written premiums, insurer’s age and liquidity were found to have a statistically insignificant relationship with ROA. They concluded that insurers that are bigger in size, more leveraged, and that have a higher proportion of tangible assets report superior performance than those that have a smaller asset base, have lower debt levels and with a higher proportion of intangible assets. Nyongesa (2017) set out to establish the influence of financial management practices on financial performance of insurers in Kenya. He documented that working capital management, capital budgeting techniques, capital structure decisions, claims management policies and corporate governance a positive impact on performance.
In a study to identify the factors that affect the profitability of general insurance firms in Kenya, Mwangi and Murigu (2015, pp. 295–96) found that profitability was positively correlated to higher debt levels, equity capital, quality of management staff and negatively related to size (measured by total assets) and majority ownership by foreign shareholders. Kollie (2017, pp. 28–30) corroborated this finding and documented that larger insurance companies in Kenya are more profitable than their smaller counterparts since they can benefit from economies of scale and better access to capital.
Lastly, Njiiri (2015) explored the influence of investments on the financial performance of insurance companies in Kenya and found that investments made by insurer had a positive and significant impact on their financial performance. Further the results of the study documented that investments in real estate had the greatest impact, followed by government securities and bank deposits. Njiiri (2015, pp. 31–33) reasoned that the contribution by equities and corporate bonds was relatively weak; which was attributable to the smaller portions invested in these asset classes and their relatively lower returns.
3. Data and Methodology
3.1. Sample Description and Data Sources
The main source of the data used in the analysis was the Insurance Regulatory Authority Annual Reports (Insurance Regulatory Authority 2018) from 2009 to 2018. This information is considered credible as the regulator enforces strict rules ensuring authenticity. The second source used in the study was the annual financial reports sourced from the individual company audited financial statements. Companies are bound to file reliable information due to the high penalties imposed on those that fail to adhere. Industry annual reports from the Association of Kenyan Insurance for the ten-year period from 2009 to 2018 were also relied on to fill in gaps from the other primary data sources.
There are 52 insurance companies operating in Kenya, please see Table 1 below. Out of the 52, 16 write long term business (life) only, 9 are composite insurers (writing both life and general business), while the rest are general insurance only businesses (Insurance Regulatory Authority 2018, pp. 154–58).

Table 1.
Breakdown of the Number Insurance Companies in Kenya, 2009–2018.
The determinants assessed included the standard firm-level factors, debt ratio, reinsurance ratio and investment decisions. This study employed panel data for the 10-year period from 2009 to 2018. The following variables were employed to evaluate the determinants of financial performance of Kenyan insurance companies:
- Dependent Variables
- ➢
- Return on Assets (ROA)
- ➢
- Return on Equity (ROE)
- Independent Variables
- ➢
- Debt ratio
- ➢
- Reinsurance ratio
- ➢
- Investment ratio
- ➢
- Size of insurer
- ➢
- Age
The variables are defined in Table 2.
Table 2.
Summary of Variables Under Study.
3.2. Model Specification
In the testing of the association between financial performance and its determinants, the following static panel data model was specified:
where:
= financial performance measures (ROA or ROE)
= vectors of explanative variables (solvency ratio, size, age, combined ratio, debt ratio, total assets)
= constant of a group
εi,t = error.
This model can be restated as follows as follows;
where;
= financial performance of insurance company i at duration t
= debt ratio/leverage of insure i at duration t
= solvency ratio of insurer i at duration t
= size of insurer i at duration t
= age of insurer i at duration t
= investment income of insurer i at duration t
= reinsurance factor for insurer i at duration t
= combined ratio of insurer i at duration t
= error term of insurer i at duration t
4. Empirical Results
This section presents the empirical results of the study. It presents and analyses the descriptive and panel regression results in a quest to establish the main elements contributing to the financial performance of Kenyan insurance firms. Three models were assessed, namely, the pooled ordinary least squares (POLS), fixed effects and random effects models. Diagnostics evaluations and tests were explored to establish which model should be used for inference purposes. Two metrics of financial performance measurement, namely ROA and ROE were employed for robustness.
4.1. Descriptive Statistics
The trends in the insurance industry financial performance with return on assets (ROA) and return on equity (ROE) displayed as general and life for the period under study is as shown in Figure 1. ROA showed steady increase and decrease within a 1% to 9% range in average values. General insurance underwriters show higher ROA than life insurance underwriters. Furthermore, the trends in independent variables under study are shown in Figure 2.
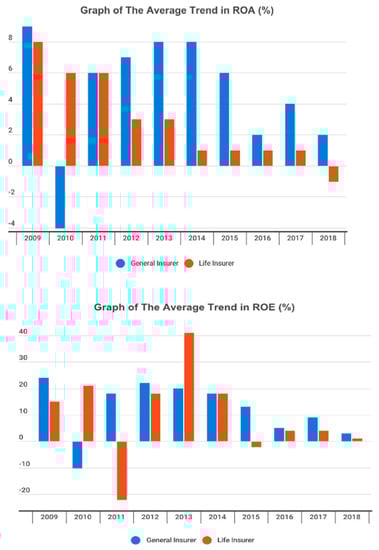
Figure 1.
Trends in Return on Assets (ROA) for Both General and Life Insurers, 2009–2018.
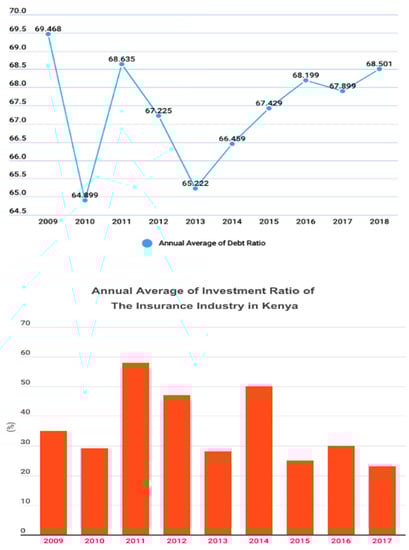
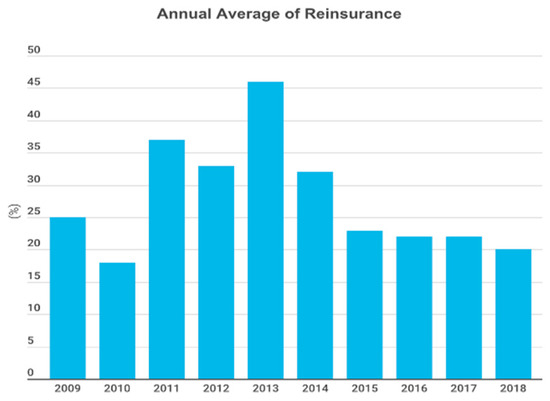
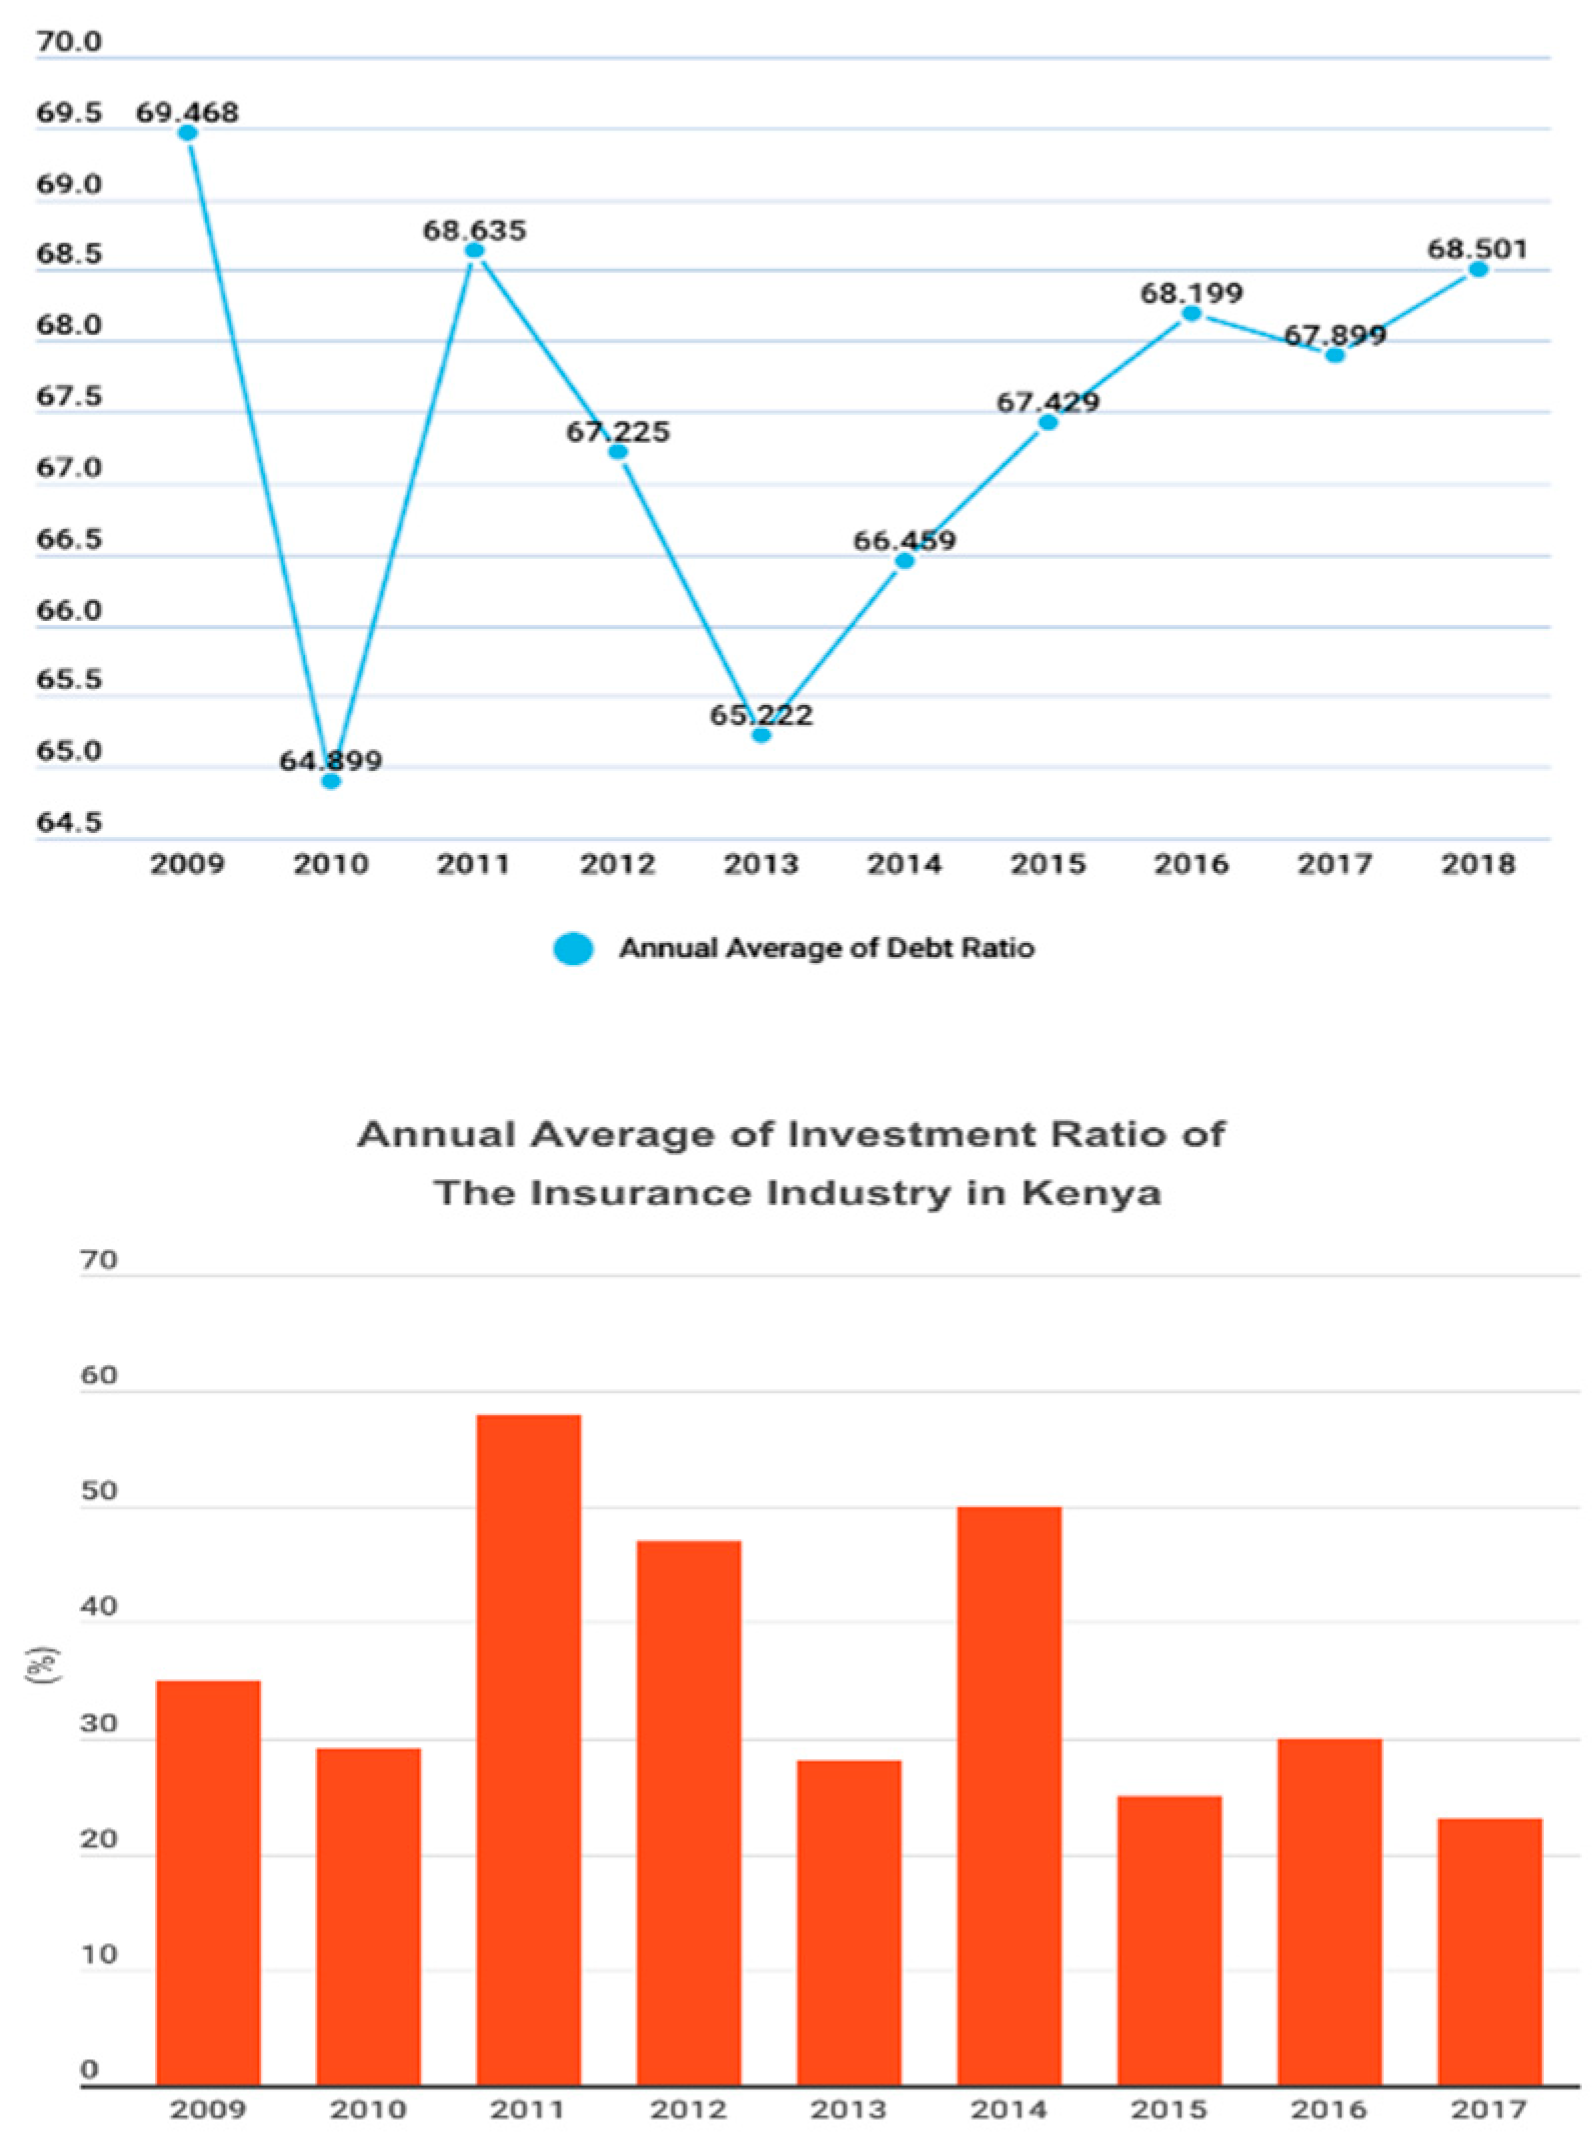
Figure 2.
Trends in Debt Ratio, Investment Ratio and Reinsurance Ratios for both General and Life Insurers, 2009–2018.
Figure 2 documents the trends in debt, investment and reinsurance ratios for both the general and life insurers. The trend in debt ratio can be inferred above as ranging from 65% to 70%. There has been a steady growth in the measure over the years from 2013 to 2018. Random fluctuations were realised in the earlier years from 2009 to 2013, with a gradual rise picking up at the end of 2013. Insurers depicted some reliance on debt as leverage on their long-term functions.
The investment ratio consists of total investment income to gross premium income earned. The trend in ratio can be inferred above as ranging from 30% to 60%. There have been random fluctuations in the measure over the years from 2013 to 2018. The mean investment ratio for the sample under review was 35%. The average investment ratio started off at peak levels of about 60% then fell during the period corresponding years. Hence, based on the investment income ratios, the profitability of the industry averaged at 35% over the period of study.
Reinsurance fluctuated widely within the 20% range. What can be inferred is that the reinsurance numbers showed a fluctuation in figures for the period 2009–2018. It highlighted some downturn from a high of around 46% in 2013, to a low of 20% in 2018.
4.2. Correlation Analysis
The results for correlation analysis are presented in Table 3. The results of the correlation analysis shows that the estimated model was well specified and there was no multicollinearity amongst the variables as none of the correlation coefficients are greater than the threshold of 0.70.
Table 3.
Correlation Matrix.
Objective 1: To investigate whether firm-level factors explain financial performance of Kenyan insurers.
The outcome of the correlation analysis established that the size of the insurer was positively correlated to its ROA and impact was valid at the 1% level of significance. Similarly, size was positively linked to ROE. Thus, the results revealed a positive influence of size on the financial performance of insurers. Larger firms have capacity to earn better returns. This is in line with prior expectations. For both ROA and ROE measures, debt ratios of the industry are negatively correlated and have 20% and 5% explanatory power.
Furthermore, correlation analysis established that the age of the insurer was negatively correlated to ROA, and effect was highly visible at 5% level of significance. Meanwhile, the age variable positively correlated to ROE and strength of relationship was statically insignificant and had a 0.12% explanatory power on the latter. Hence, the results are inconclusive and contrary to the a priori expectation. Financial performance is not conclusively determined by the age of the insurer, making more analysis on this matter imperative.
Objective 2: To find out the influence of insurer specific determinants of financial performance in the insurance sector, with particular interest on debt ratio and reinsurance ratios.
The debt ratio of insurers was negatively correlated to both ROA and ROE at offering a 20% and 5% explanatory power, respectively. The investment ratio variable positively correlated to reinsurance ratio and strength of relationship was statically significant at 24%. This implied that most insurers with good investment returns mitigate their risk of loss by reinsuring some a percentage of their products. This also implied that insurers who reinsure themselves against huge risks make better investment decisions.
Objective 3: To find out if investment decisions have a bearing on the financial performance of insurance companies in Kenya.
The findings on this analysis settled that investment ratio/decisions were positively correlated to both ROA and ROE. The impact is noteworthy, with a strength relationship at 4.7% and 3.2%. Investment ratio variable positively correlated to reinsurance ratio and strength of relationship was statistically significant and with a 24% explanatory power. We reason that this indicated that most insurers with good investment returns mitigate their risk of loss by reinsuring some a percentage of their products.
4.3. Panel Regression Results
This section presents the panel regression results establishing the main elements contributing to the financial performance of Kenyan insurance firms. Three models were assessed, namely, the pooled ordinary least squares (POLS), fixed effects and random effects models. Diagnostics tests were explored to establish which model should be used for inference purposes. Two metrics of financial measurement, namely ROA and ROE were employed for robustness. Before the panel regression results are presented, the diagnostics tests results are reported. Diagnostic tests results are highlighted in Table 4 and Table 5 while results for panel regression are shown in Table 6 and Table 7.
Table 4.
Diagnostic Tests Using ROA as a Measure of Performance.
Table 5.
Diagnostic Tests Using ROE as a Measure of Performance.
Table 6.
Empirical Results when ROA is used a Measure in Panel Regression.
Table 7.
Empirical Results When ROE is Used as the Measure in Panel Regression.
Empirical Finding 1: To investigate whether firm-level factors explain financial performance of Kenyan insurers.
The relationship between firm specific factors and financial performance of Kenyan insurers was found to be positive. The size variable was positively related to ROE and the relationship was highly statistically significant. Further the other hand, the size variable was found to be negatively related to ROA, though the relationship was weak. On the other hand, age depicted a positive relationship with ROE only in line with a priori expectations. Previous studies established that the size of insurance particularly affects the ability of general insurers in attracting more policyholders and improving their profitability. More evidence suggests that size is directly related to profitability and the strength of the relationship is significant, according to Jadi (2015), Kaya (2015), Mehari and Aemiro (2013), Mwangi and Murigu (2015) and Burca and Batrinca (2014) among others.
Empirical Finding 2: To find out the influence of insurer specific determinants of financial performance in the insurance sector, with particular interest on debt ratio and reinsurance ratios
In testing the relationship between ROA and debt ratio, a negative and highly significant relationship was documented. Results from the analysis using pooled OLS estimator showed that a 1% fall in the debt ratio translates to a drop of 0.03% in ROA. The result was statistically insignificant. Similar results were found based on the random effects (RE) model, where a 1% increase in the debt ratio would result in an insignificant 0.03% decrease in ROA. Different results are documented for inference, the fixed effects showed that a 1% rise in debt ratio would result in a valid 0.6% shrink in ROA. The result was valid at a 5% level of significance.
Furthermore, the estimation results in using pooled OLS estimation results highlighted that a 1% jump in reinsurance ratio translated to a rise of 2.5% in ROA, which is statistically valid at a 1% level. Similarly, based on the random effects (RE) model, a 1% rise in reinsurance ratio results in a valid rise in ROA of 2.5%. For deduction, the fixed effects estimator established that a 1% increase in reinsurance would result in a 2.55% invalid fall in ROE.
Furthermore, results from the analysis using the pooled OLS showed that a 1% decrease in the debt ratio would lead to a decrease of 0.2% in ROE. The result was settled as insignificant. Similar results were found based on random effects (RE) model, where a 1% increase in the debt ratio would result in an insignificant 0.2% decrease in ROE. Different results are documented for inference, the fixed effects showed that a 1% increase in debt ratio would result in a highly significant 0.4% decrease in ROE. The outcome was highly noteworthy at 10% validity.
The estimation results in using pooled OLS outcome highlighted that a 1% jump in reinsurance ratio would lead to a rise of 0.4% in ROE. Similarly, based on the random effects (RE) model, a 1% increase in reinsurance ratio corresponded to a significant rise in ROE of 0.4%. For deduction, the fixed effects estimator established that a 1% increase in reinsurance would result in a 0.45% insignificant decrease in ROE.
Related studies in this realm includes Odira (2018), Burca and Batrinca (2014) and Mwangi and Murigu (2015). These studies found that solvency margin is a key element in the financial performance of the insurance market.
Empirical Finding 3: To find out if investment decisions have a bearing on the financial performance of insurance companies in Kenya.
Pooled OLS estimation results highlighted that a 1% rise in investment ratio would translate in a 0.1% increase in ROA. The random effects (RE) model also showed that a 1% jump in investment ratio translated into a 0.1% upsurge in ROA. Similarly, the fixed effects model documented that a 1% hike in investment corresponded to a 0.11% rise in ROA. Though the results are statistically insignificant.
Furthermore, Pooled OLS outcome highlighted that a 1% upsurge in investment ratio resulted in a 0.87% rise in ROE. The random effects (RE) model also showed that a 1% jump in investment would result in a 0.87% ascent in ROE. Similarly, the fixed effects model settled that a 1% uptake in investment corresponded to a 0.7% rise in ROE.
5. Conclusions
The first research objective of this study was to find out whether the standard firm-level factors explain the financial performance of Kenyan insurance companies. Two firm level variable factors were employed in this study, namely, size of insurer and the age of firm. The results of this evaluation documented that insurer financial performance and size are positively related. This suggests that large insurance companies in terms of total assets are likely to be more profitable. Age on the other hand was found to have a negative relationship with performance. This implies that older insurance firms will not necessarily perform better in comparison to insurance firms which recently started operations.
The second objective of this article was geared towards explaining the influence of reinsurance and debt ratios on the financial performance of insurers in Kenya. We established that higher leveraged insurers perform better in Kenya. This deduction implies that insurance companies should raise most of their capital by borrowing rather than by equity capital. The caveat that pertains to debt ratio is that although a higher ratio seems to improve performance, companies need to take caution with regards to over-leveraging as this might result in them failing to service their debt obligations. Debt ratio should be set at a level which allows a company to operate optimally. Furthermore, this research effort revealed that the financial performance of Kenyan insurers and their reinsurance ratios was positively associated.
Lastly, this study examined the relationship between financial performance and investment. The outcome of the study established that the insurer’s financial performance and investment returns were positively related. As such, we suggest that insurers should maximize their returns by making good investment decisions.
The findings that flow from this article could be of use to various stakeholders in the insurance industry in Kenya. It would be of essence for the Government to liaise with insurance regulators in deriving regulations that focuses on capping leverage, reinsurance protocols/floors and investments for different insurers in order to sustain performance in the long term.
There are two main limitations of this study which could be addressed by future research. Firstly, the study employed a sample of insurance companies comprising of life, non-life, composites and reinsurance companies. As such this could have muddled the results. Future studies could concentrate on one industry in order to test the robustness of the results of this study. Secondly, this study employed the ROE and ROA variables as measures of financial performance for robustness. The inherent limitation is that these variables are intertwined through the financial leverage multiplier. However, a better proxy that future studies could employ for robustness could be the stock price return. Lastly, future studies could also investigate the effect of the COVID-19 pandemic on the financial performance of insurance companies.
Author Contributions
Conceptualization, K.M. and A.B.S.; methodology, K.M. and A.B.S.; Software, K.M. and A.B.S.; validation, K.M. and A.B.S.; formal analysis, K.M. and A.B.S.; investigation, K.M. and A.B.S.; resources, K.M. and A.B.S.; data curation, K.M. and A.B.S.; writing—original draft preparation, K.M. and A.B.S.; writing—review and editing, K.M. and A.B.S.; visualization, K.M. and A.B.S.; supervision, K.M. and A.B.S.; project administration, K.M. and A.B.S.; funding acquisition, K.M. and A.B.S.; All authors have read and agreed to the published version of the manuscript.
Funding
This research received no external funding.
Institutional Review Board Statement
Not applicable.
Informed Consent Statement
Not applicable.
Data Availability Statement
Datasets available on request.
Conflicts of Interest
The authors declare no conflict of interest.
References
- Armour, John, and Brian R. Cheffins. 2009. The Rise and Fall of Shareholder Activism by Hedge Funds (September 1, 2009). ECGI—Law Working Paper No. 136/2009. Available online: https://papers.ssrn.com/sol3/papers.cfm?abstract_id=1489336 (accessed on 22 September 2021).
- Barney, Jay. 1986. Strategic Factor Markets: Expectations, Luck and Business Strategy. Management Science 32: 1231–41. [Google Scholar] [CrossRef]
- Burca, Ana Maria, and Ghiorghe Batrinca. 2014. The determinants of financial performance in the Romanian insurance market. International Journal of Academic Research in Accounting, Finance and Management Sciences 4: 299–308. [Google Scholar] [CrossRef] [Green Version]
- Cornett, Marcia, and Anthony Saunders. 2003. Financial Institutions Management: A Risk Management Approach. Columbus: McGraw-Hill/Irwin, pp. 64–91. [Google Scholar]
- Derbali, Abdelkader. 2014. Determinants of Performance of Insurance Companies in Tunisia: The Case of Life Insurance. International Journal of Innovation and Applied Studies 6: 90–96. [Google Scholar]
- Engle, Carole. 2010. Aquaculture Economics and Financing: Management and Analysis. New York: John Wiley & Sons. [Google Scholar]
- Fligstein, Neil, and Taekjin Shin. 2007. Shareholder Value and the Transformation of the U.S. Economy, 1984–2000. Sociological Forum 22: 399–424. [Google Scholar]
- Freeman, R. Edward. 1984. Strategic Management: A Stakeholder Approach. Boston: Pitman. [Google Scholar]
- Freeman, R. Edward, and John McVea. 2001. A stakeholder approach to strategic management. In The Blackwell Handbook of Strategic Management. Hoboken: Wiley Online Library, pp. 189–207. [Google Scholar]
- Gompers, Paul, Joy Ishii, and Andrew Metrick. 2003. Corporate Governance and Equity Prices. Quarterly Journal of Economics 118: 107–55. [Google Scholar] [CrossRef] [Green Version]
- Insurance Regulatory Authority. 2018. Insurance Industry Annual Report for the Year Ended 31 December 2017. Nairobi: Insurance Regulatory Authority. [Google Scholar]
- Jadi, Diara. 2015. An Empirical Analysis of Determinants of Financial Performance of Insurance Companies in the United Kingdom. Ph.D. dissertation, University of Bradford, West Yorkshire, UK. [Google Scholar]
- Jelle, Hakima. 2015. Effect of Capital Structure of Financial Performance of Insurance Companies Listed at the Nairobi Securities Exchange. Nairobi: University of Nairobi. [Google Scholar]
- Jensen, Michael. 2001. Value Maximisation, Stakeholder Theory, and the Corporate Objective Function. European Financial Management 7: 297–317. [Google Scholar] [CrossRef] [Green Version]
- Kaya, E. Oner. 2015. The Effects of Firm-Specific Factors on the Profitability of Non-Life Insurance Companies in Turkey. International Journal of Financial Studies 3: 510–29. [Google Scholar] [CrossRef] [Green Version]
- Kollie, Grace. 2017. Determinants of Performance of Insurance Companies in Kenya. Nairobi: University of Nairobi. [Google Scholar]
- Lazonick, William, and Mary O’Sullivan. 2000. Maximizing Shareholder Value: A New Ideology for Corporate Governance. Economy and Society 29: 13–35. [Google Scholar] [CrossRef]
- Martin, Roderick, Peter Casson, and Tahir Nisar. 2007. Investor Engagement: Investors and Management Practice under Shareholder Value. Oxford: Oxford University Press. [Google Scholar]
- Mehari, Daniel, and Tilahun Aemiro. 2013. Firm Specific Factors that Determine Insurance Companies’ Performance in Ethiopia. European Scientific Journal 9: 245–55. [Google Scholar]
- Mwangi, Mirie, and Jane Murigu. 2015. The Determinants of Financial Performance in General Insurance Companies in Kenya. European Scientific Journal 11: 288–97. [Google Scholar]
- Nandan, Ruvendra. 2010. Management Accounting Needs of Companies and the Role of Professional Accountants: A Renewed Research Agenda. Journal of Applied Management Accounting Research 8: 65–78. [Google Scholar]
- Njiiri, Veronica. 2015. The Relationship between Investment and Financial Performance of Insurance Companies in Kenya. Nairobi: University of Nairobi. [Google Scholar]
- Nyongesa, Meshack. 2017. Effect of Financial Management Practices on Financial Performance of Insurance Companies in Kenya. Juja: Jomo Kenyatta University of Agriculture and Technology. [Google Scholar]
- Odira, Agar. 2018. Effect of Firm Specific Characteristics on Financial Performance of Firms; Evidence from General Insurance Companies in Kenya. Nairobi: University of Nairobi. [Google Scholar]
- Oncioiu, Ionica, Ania-Gabriela Petrescu, Florentina-Raluca Bîlcan, Marius Petrescu, Delia-Mioara Popescu, and Elena Anghel. 2020. Corporate Sustainability Reporting and Financial Performance. Sustainability 12: 4297. [Google Scholar] [CrossRef]
- Ponomareva, Yuliya. 2018. Shareholder Activism Is on the Rise: Caution Required. Forbes, December 10. [Google Scholar]
- PwC AWM Research Centre. 2017. Asset & Wealth Management Revolution: Embracing Exponential Change. London: PwC. [Google Scholar]
- Schwab, Klaus, and Hein Kroos. 1971. Modern Company Management in Mechanical Engineering. Frankfurt/Main-Niederrad: Verein Deutscher Maschinenbau-Anstalten. [Google Scholar]


Publisher’s Note: MDPI stays neutral with regard to jurisdictional claims in published maps and institutional affiliations. |
© 2021 by the authors. Licensee MDPI, Basel, Switzerland. This article is an open access article distributed under the terms and conditions of the Creative Commons Attribution (CC BY) license (https://creativecommons.org/licenses/by/4.0/).