
Evaluation of the Financial Performance of the Municipalities in Slovakia in the Context of Multidimensional Statistics


Abstract
:1. Introduction
2. Literature Review
3. Materials and Methods
- entering input data;
- selecting the variables;
- creating object names;
- choosing the agglomeration process;
- choosing the type of bonding method—in our case, we used Ward’s method;
- selecting the degree of similarity of objects, which was adjusted on the basis of the Euclidean distance;
- determining the number of significant clusters; and
- interpreting the results.
- the number of main components must resolve at least 70% of the data’s total spread; and
- the number of main components must be determined by using a graphical representation of the spread, reasoning by the main components.
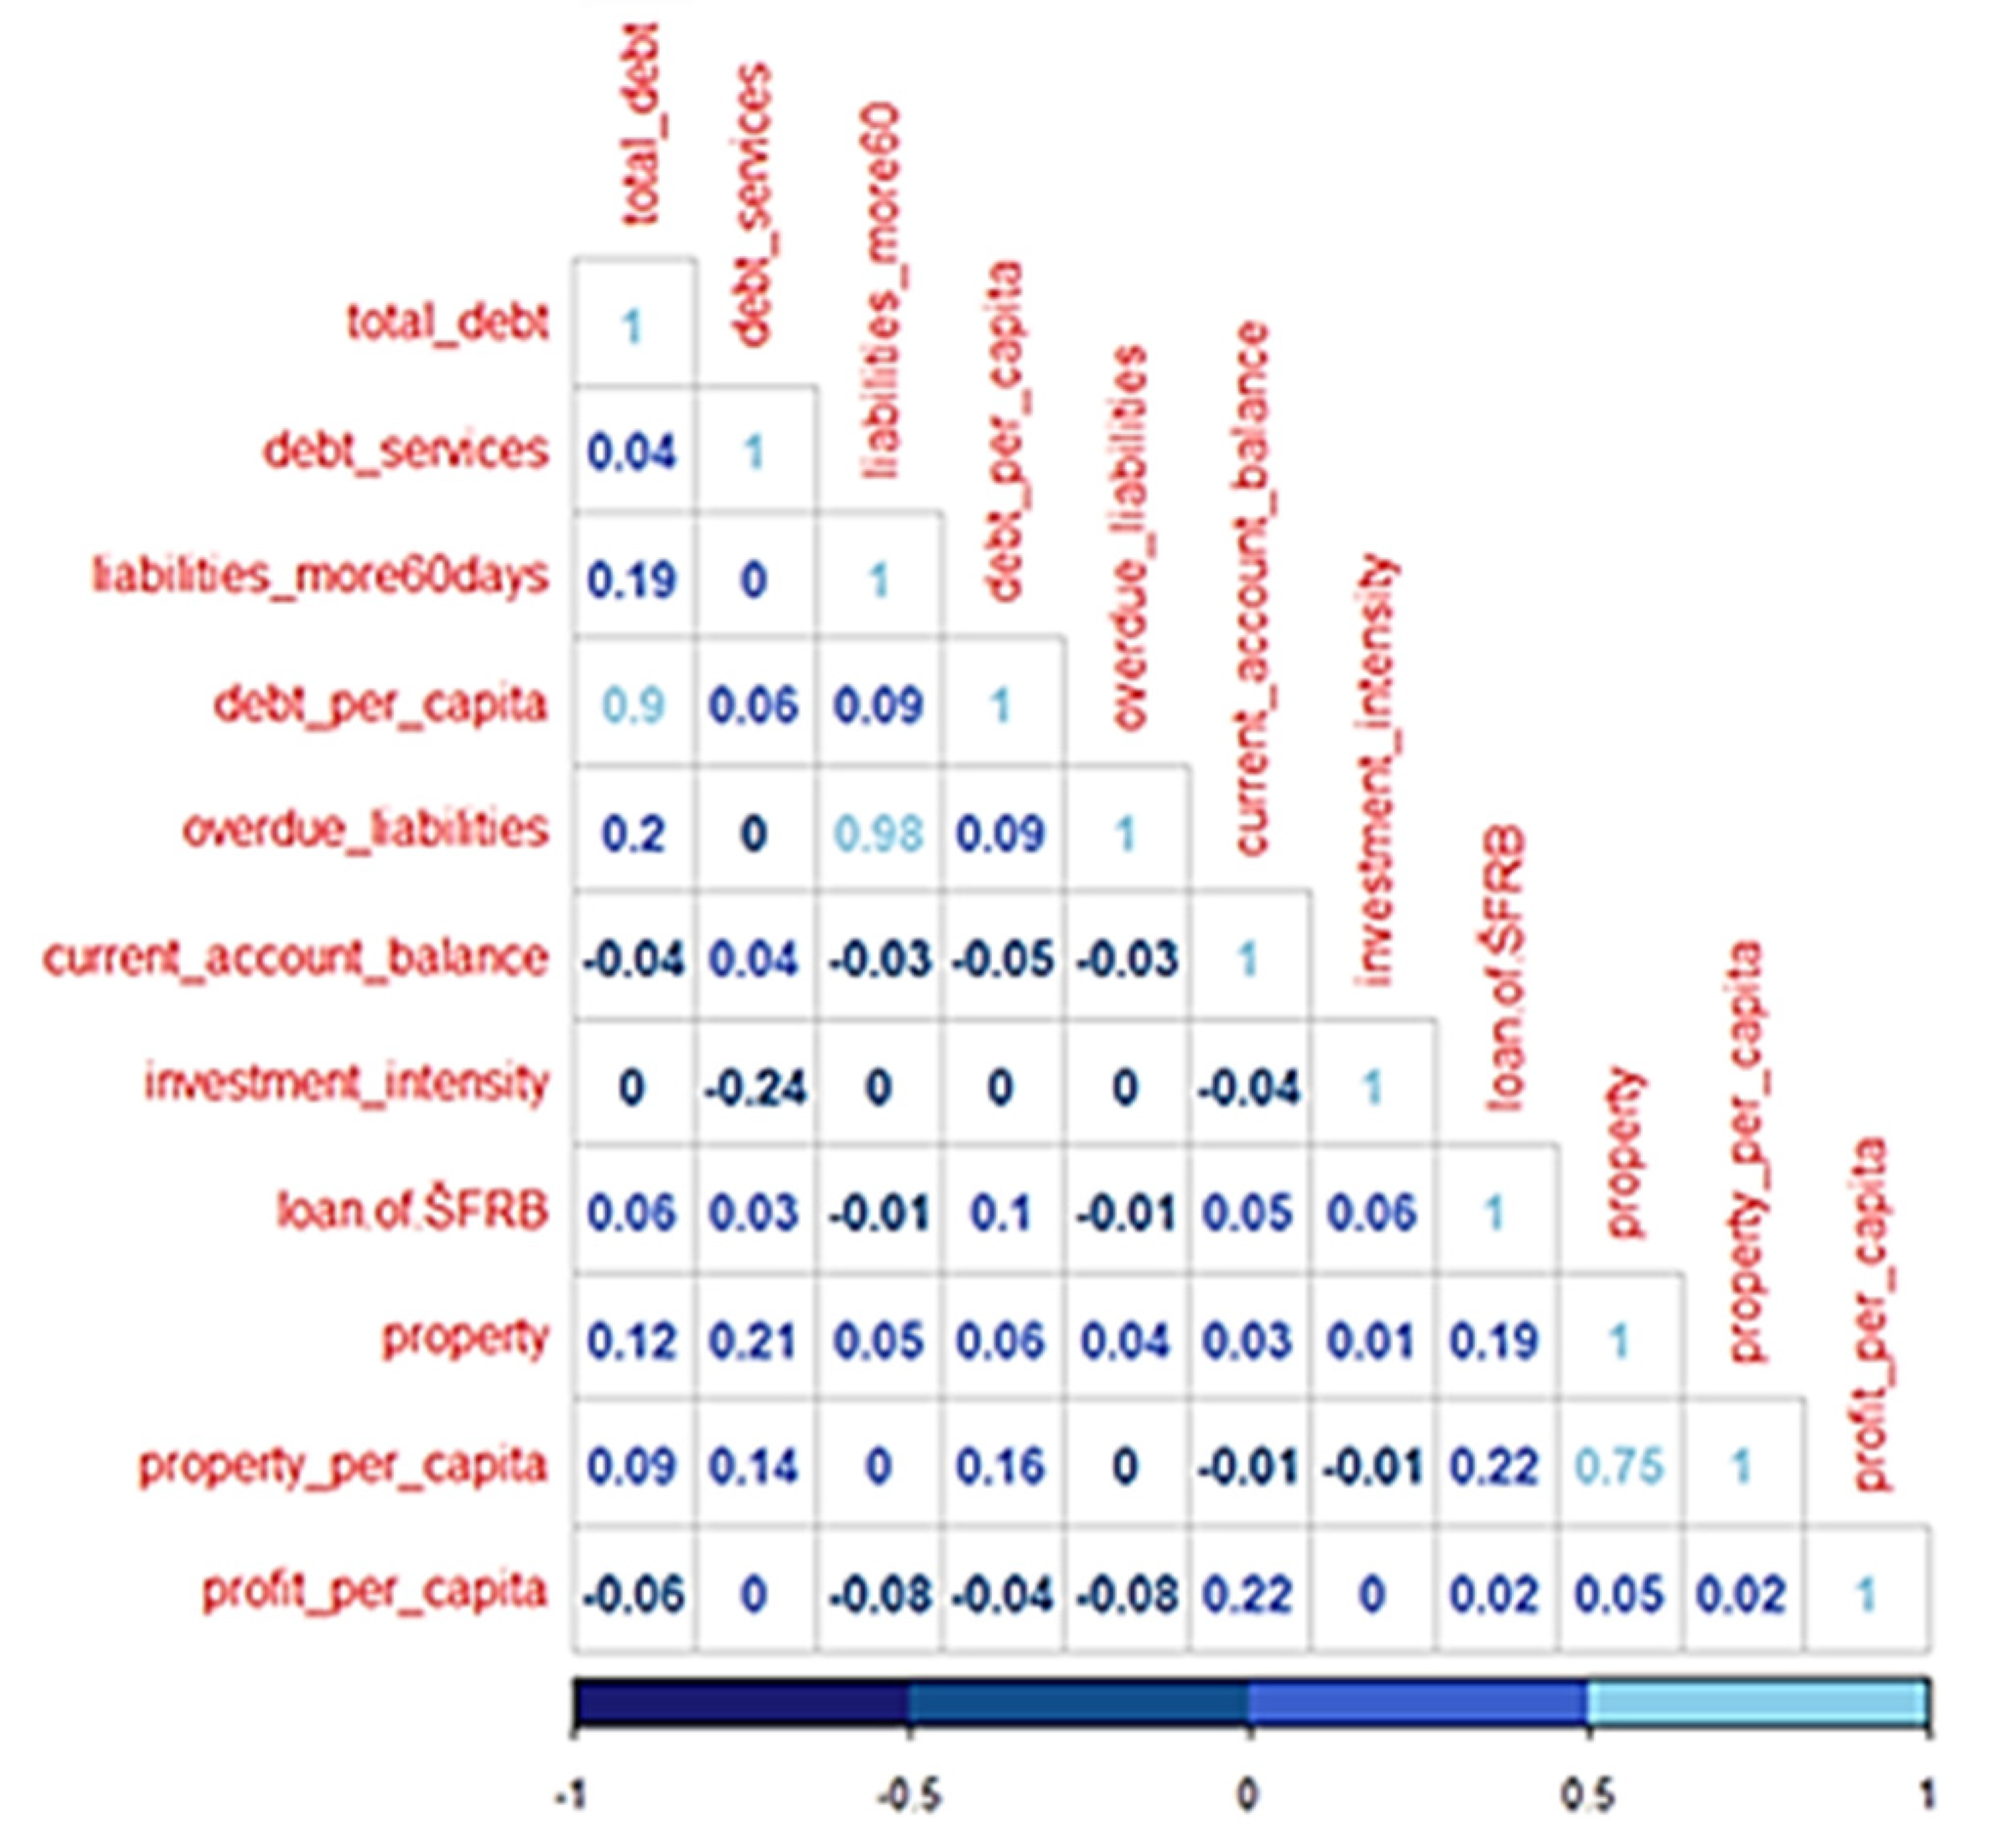
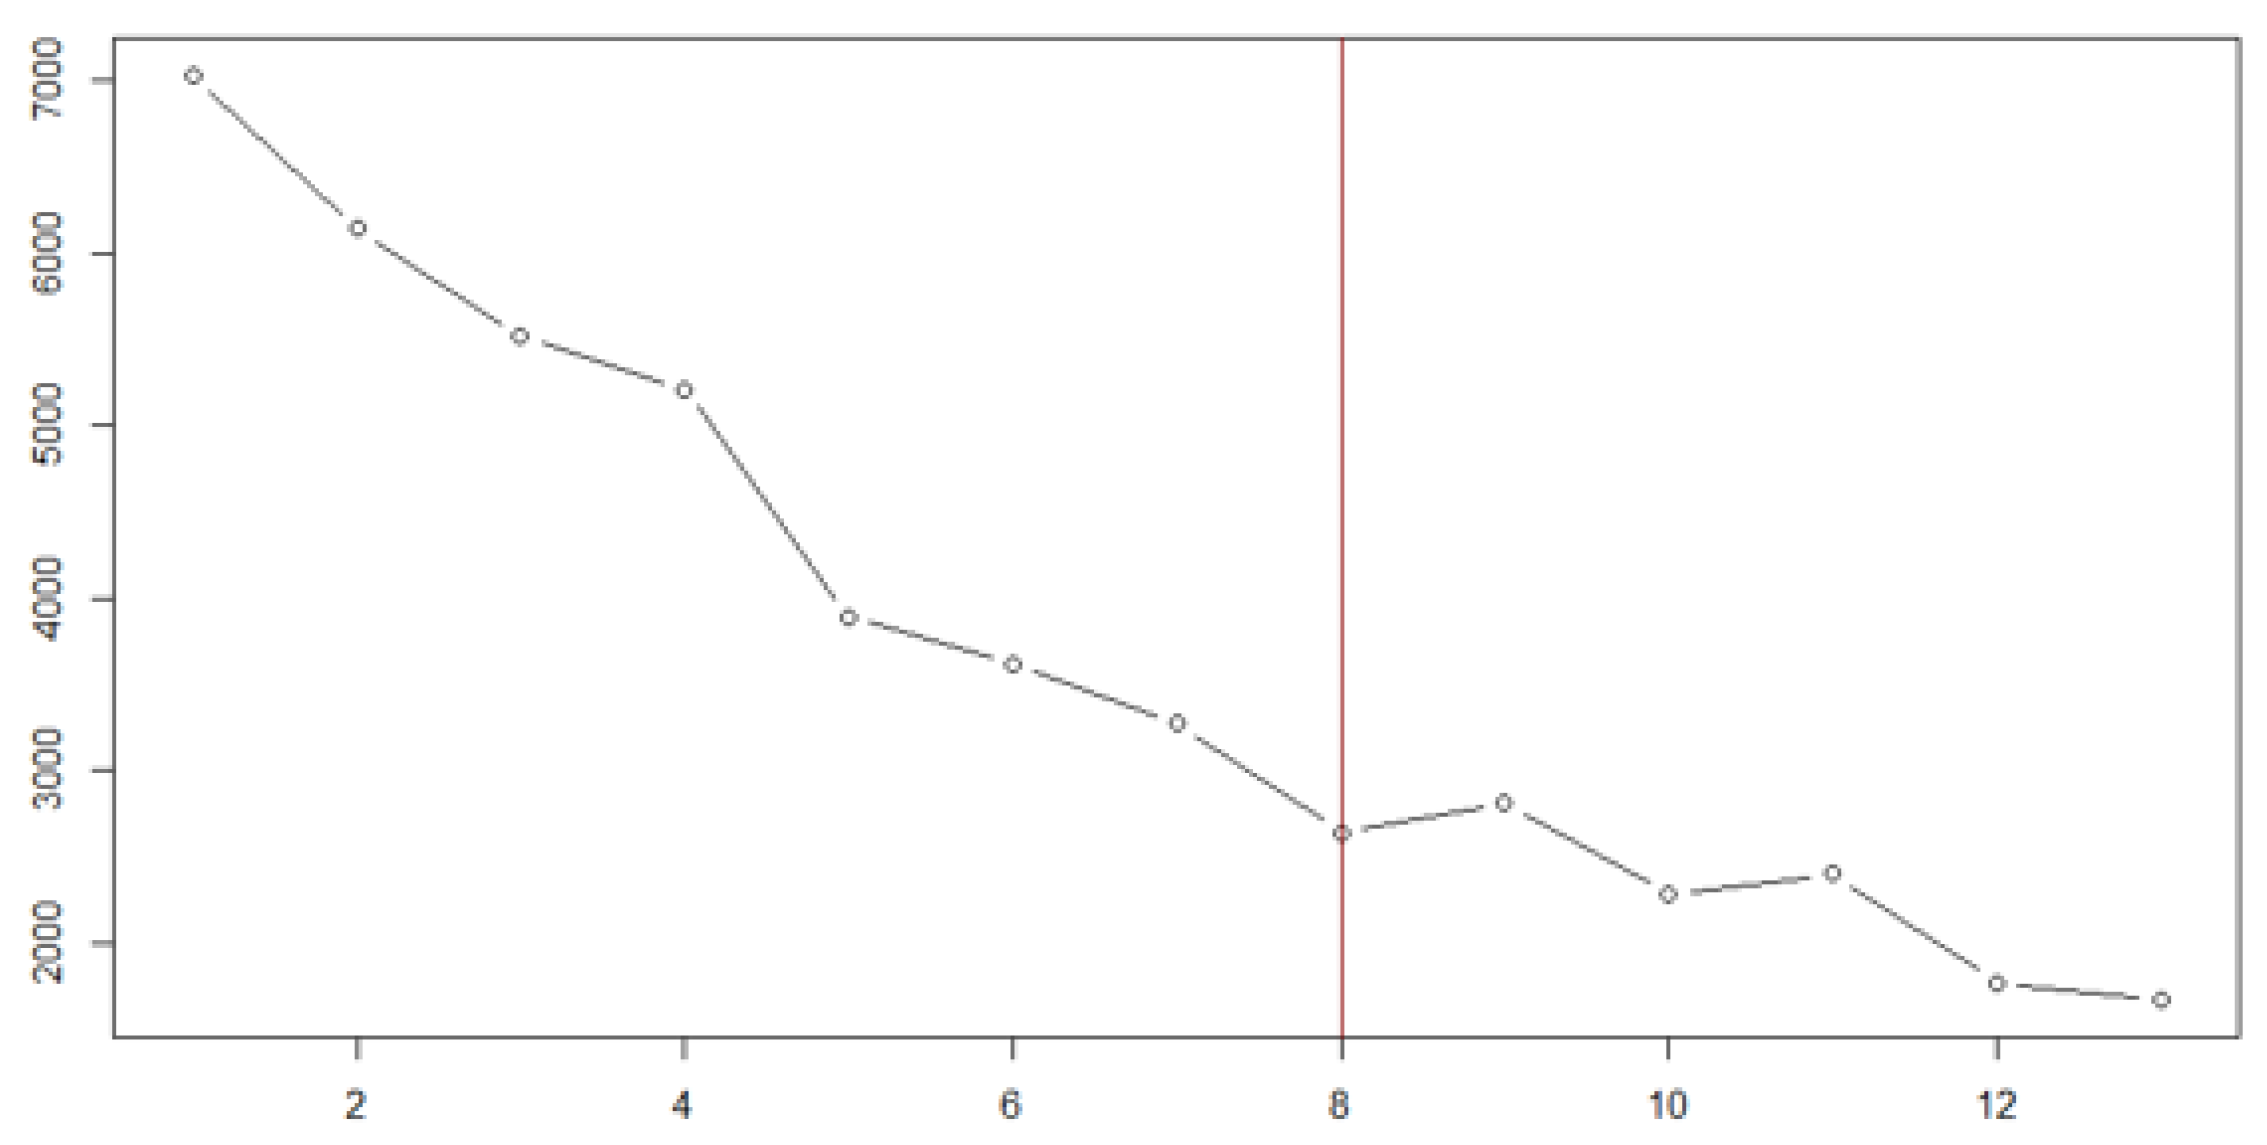
4. Results
5. Discussion and Conclusions
Author Contributions
Funding
Institutional Review Board Statement
Informed Consent Statement
Conflicts of Interest
References
- Ahmaro, Ismail H. 2014. Controlling the Financial Performance of Jordanian Municipalities by Improving Financial Regulations: An Analytical Study. Journal of Business Studies Quarterly 6: 1–18. [Google Scholar]
- Arcas, Maria Jose, and Caridad Martí. 2016. Financial Performance Adjustment in English local Governments. Australian Accounting Review 26: 141–52. [Google Scholar] [CrossRef]
- Bartolacci, Francesca, and Soverchia Michela. 2018. The relationship between good environmental practices and financial performance: Evidence from Italian waste management companies. Sustainable Production and Consumption 14: 129–35. [Google Scholar] [CrossRef]
- Batrancea, Larissa. 2021. An Econometric Approach Regarding the Impact of Fiscal Pressure on Equilibrium: Evidence from Electricity, Gas and Oil Companies Listed on the New York Stock Exchange. Mathematics 9: 630. [Google Scholar] [CrossRef]
- Berne, Robert. 1992. The Relationships between Financial Reporting and the Measurement of Financial Condition. Norwalk: Governmental Accounting Standards Board of the Financial Accounting Foundation. [Google Scholar]
- Brown, Ken W. 1993. The 10-point test of financial condition: Toward an easy-to-use assessment tool for smaller cities. Government Finance Review 9: 21–26. [Google Scholar]
- Budding, Tjerk, Bram Faber, and Martijn Schoute. 2021. Integrating non-financial performance indicators in budget documents: The continuing search of Dutch municipalities. Journal of Public Budgeting, Accounting and Financial Management. [Google Scholar] [CrossRef]
- Chaney, Barbara A., Dean Michael Mead, and Kenneth R. Schermann. 2002. The new governmental financial reporting model: What it means for analysing government financial condition. The Journal of Government Financial Management 51: 26. [Google Scholar]
- Clark, Terry Nichols. 1977. Fiscal management of American cities: Funds flow indicators. Journal of Accounting Research 15: 54–94. [Google Scholar] [CrossRef]
- Cohen, Sandra. 2008. Identifying the moderator factors of financial performance in Greek Municipalities. Financial Accountability & Management 24: 265–94. [Google Scholar] [CrossRef]
- Cohen, Sandra, Michael Doumpos, Evi Neofytou, and Constantin Zopounidis. 2012. Assessing financial distress where bankruptcy is not an option: An alternative approach for local municipalities. European Journal of Operational Research 218: 270–79. [Google Scholar] [CrossRef]
- Collin, Sven-Olof, Matias Haraldsson, Torbjorn Tagesson, and Veronica Blank. 2017. Explaining municipal audit costs in Sweden: Reconsidering the political environment, the municipal organization and the audit market. Financial Accountability and Management 33: 391–405. [Google Scholar] [CrossRef]
- Donatella, Pierre. 2019. Is political competition a driver of financial performance adjustments? An examination of Swedish municipalities. Public Money and Management 40: 122–30. [Google Scholar] [CrossRef]
- Dynowska, Joanna, and Sandra Janet Cereola. 2018. Expectations Related to the Implementation of Performance Budget in Municipalities. Olsztyn Economic Journal 13: 475–86. [Google Scholar] [CrossRef]
- Goeminne, Stijn, and Bert George. 2019. New development: Determinants of financial performance in public organizations. Public Money & Management 39: 70–73. [Google Scholar] [CrossRef] [Green Version]
- Gomes, Ricardo Correa, Solange Alfinito, and Pedro Henrique Melo Albuquerque. 2013. Analysing local government financial performance: Evidence from Brazilian municipalities 2005–2008. Revista de Administração Contemporânea 17: 704–19. [Google Scholar] [CrossRef] [Green Version]
- Kablan, Ali. 2020. Altman’s Z-Score to Predict Accounting Based Financial Distress of Municipalities: Bankruptcy Risk map for Metropolitan Municipalities in Turkey. İşletme Araştırmaları Dergisi 12: 498–509. [Google Scholar]
- Kloha, Philip, Carol S. Weissert, and Robert Kleine. 2005. Developing and testing a composite model to predict local fiscal distress. Public Administration Review 65: 313–23. [Google Scholar] [CrossRef]
- Larissa, Batrancea, Rathnaswamy Malar Maran, Batrancea Ioan, Nichita Anca, Rus Mircea-Iosif, Tulai Horia, Fatacean Gheorghe, Masca Ema Speranta, and Morar Ioan Dan. 2020. Adjusted Net Savings of CEE and Baltic Nations in the context of Sustainable Economic Growth: A panel data analysis. Journal of Risk and Financial Management 13: 234. [Google Scholar] [CrossRef]
- Lindermüller, Dávid, Matthias Sohn, and Bernhard Hirsch. 2020. Trading off financial and non-financial performance information to evaluate state-owned enterprise performance—A process tracing-experiment. International Public Management Journal, 1–21. [Google Scholar] [CrossRef]
- Lopez-Hernandez, Antonio, Jose Luis Zafra-Gomez, and David Ortiz-Rodriquez. 2012. Effects of the crisis in Spanish municipalities’ financial condition: An empirical evidence (2005–2008). International Journal of Critical Accounting 4: 631–45. [Google Scholar] [CrossRef]
- Mercer, Timothy, and Mark Gilbert. 1996. A financial condition index for Nova Scotia municipalities. Government Finance Review 12: 36–38. [Google Scholar]
- Opstrup, Niels, and Anders R. Villadsen. 2014. The right mix? Gender diversity in top management teams and financial performance. Public Administration Review 75: 291–301. [Google Scholar] [CrossRef]
- Papcunová, Viera. 2013. Evaluation of financial performance of contributory organizations under the jurisdiction of municipalities. Acta regionalia et environmentalica 10: 13–18. [Google Scholar] [CrossRef]
- Stankovičová, Iveta, and Mária Vojtková. 2007. Multidimensional Statistical Methods with Application. Bratislava: Iura Edition. (In Slovak) [Google Scholar]
- Wang, Xiaohu, Lynda Dennis, and Yuan Sen Tu. 2007. Measuring financial condition: A study of US states. Public Budgeting & Finance 27: 1–21. [Google Scholar] [CrossRef]
- Zafra-Gómez, José Luis, Antonio Manuel López-Hernández, and Agustín Hernández-Bastida. 2009. Evaluating financial performance in local government: Maximizing the benchmarking value. International Review of Administrative Sciences 75: 151–67. [Google Scholar] [CrossRef]


| Indicator | Median | Standard Deviation | Variance | Minimum | Maximum |
|---|---|---|---|---|---|
| total_debt | 0 | 0.129637 | 0.016806 | 0 | 1.08 |
| debt_services | 0.01 | 0.482052 | 0.232374 | 0 | 11.18 |
| liabilities_more60days | 0 | 0.061848 | 0.003825 | 0 | 1.56 |
| debt_per_capita | 0 | 70.10719 | 4915.019 | 0 | 803.37 |
| overdue_liabilities | 0 | 0.06317 | 0.00399 | 0 | 1.56 |
| current_account_balance | 0.1 | 0.102027 | 0.01041 | −0.46 | 0.64 |
| investment_intensity | 0.06 | 1.386149 | 1.92141 | −10.45 | 25.83 |
| loan from the ŠFRB | 0 | 0.444963 | 0.197992 | 0 | 7.56 |
| property | 3.425 | 3.439398 | 11.82946 | −0.13 | 37.13 |
| property_per_capita | 1648.055 | 1837.058 | 3,374,783 | −52.8 | 18,518.6 |
| profit_per_capita | 24.995 | 134.564 | 18,107.47 | −585.63 | 1793.93 |
| PC1 | PC2 | PC3 | PC4 | PC5 | |
|---|---|---|---|---|---|
| Standard deviation | 1.528164 | 1.390042 | 1.253923 | 1.111289 | 1.091277 |
| Proportion of Variance | 0.212300 | 0.175660 | 0.142940 | 0.112270 | 0.108260 |
| Cumulative Proportion | 0.212300 | 0.387950 | 0.530890 | 0.643160 | 0.751420 |
| PC6 | PC7 | PC8 | PC9 | PC10 | |
| Standard deviation | 0.9416353 | 0.8718078 | 0.8539837 | 0.5135944 | 0.2721569 |
| Proportion of Variance | 0.0806100 | 0.0691000 | 0.0663000 | 0.0239800 | 0.0067300 |
| Cumulative Proportion | 0.8320300 | 0.9011300 | 0.9674300 | 0.9914100 | 0.9981400 |
| PC11 | |||||
| Standard deviation | 0.1430524 | ||||
| Proportion of Variance | 0.0018600 | ||||
| Cumulative Proportion | 1.0000000 |
| Cluster | 1 | 2 | 3 | 4 | 5 | 6 | 7 | 8 |
| Municipalities | 476 | 161 | 3 | 4 | 8 | 8 | 1 | 1 |
| Group | Total_Debt | Debt_Services | Liabilities_Morethan60days | Debt_per_Capita |
|---|---|---|---|---|
| 1 | 0.02153361 | 0.03216387 | 0.0007983193 | 10.59277 |
| 2 | 0.23900621 | 0.06080745 | 0.0034782609 | 126.32882 |
| 3 | 0.00000000 | 0.03000000 | 0.0000000000 | 0.00000 |
| 4 | 0.06750000 | 0.16500000 | 0.0000000000 | 24.07000 |
| 5 | 0.07250000 | 0.02875000 | 0.0012500000 | 32.50875 |
| 6 | 0.09875000 | 0.02625000 | 0.0050000000 | 37.16375 |
| 7 | 0.00000000 | 11.18000000 | 0.0000000000 | 0.00000 |
| 8 | 0.66000000 | 0.07000000 | 1.5600000000 | 174.94000 |
| Overdue_Liabilities | Current_Account_Balance | Investment_Intensity | ||
| 1 | 0.001176471 | 0.111470588 | 0.1219118 | |
| 2 | 0.008136646 | 0.098881988 | 0.1493789 | |
| 3 | 0.000000000 | 0.003333333 | 17.6100000 | |
| 4 | 0.000000000 | 0.147500000 | 0.9225000 | |
| 5 | 0.005000000 | 0.036250000 | −0.1375000 | |
| 6 | 0.005000000 | 0.210000000 | 0.3537500 | |
| 7 | 0.000000000 | 0.210000000 | −10.4500000 | |
| 8 | 1.560000000 | 0.080000000 | 0.0700000 | |
| Loan from the ŠFRB | Property | |||
| 1 | 0.06663866 | 4.151933 | ||
| 2 | 0.08869565 | 3.626770 | ||
| 3 | 0.00000000 | 4.793333 | ||
| 4 | 4.64000000 | 10.302500 | ||
| 5 | 0.21875000 | 19.701250 | ||
| 6 | 0.20000000 | 8.048750 | ||
| 7 | 0.00000000 | 18.280000 | ||
| 8 | 0.00000000 | 8.290000 |
Publisher’s Note: MDPI stays neutral with regard to jurisdictional claims in published maps and institutional affiliations. |
© 2021 by the authors. Licensee MDPI, Basel, Switzerland. This article is an open access article distributed under the terms and conditions of the Creative Commons Attribution (CC BY) license (https://creativecommons.org/licenses/by/4.0/).
Share and Cite
Lukáč, J.; Teplická, K.; Čulková, K.; Hrehová, D. Evaluation of the Financial Performance of the Municipalities in Slovakia in the Context of Multidimensional Statistics. J. Risk Financial Manag. 2021, 14, 570. https://doi.org/10.3390/jrfm14120570
Lukáč J, Teplická K, Čulková K, Hrehová D. Evaluation of the Financial Performance of the Municipalities in Slovakia in the Context of Multidimensional Statistics. Journal of Risk and Financial Management. 2021; 14(12):570. https://doi.org/10.3390/jrfm14120570
Chicago/Turabian StyleLukáč, Jozef, Katarína Teplická, Katarína Čulková, and Daniela Hrehová. 2021. "Evaluation of the Financial Performance of the Municipalities in Slovakia in the Context of Multidimensional Statistics" Journal of Risk and Financial Management 14, no. 12: 570. https://doi.org/10.3390/jrfm14120570
APA StyleLukáč, J., Teplická, K., Čulková, K., & Hrehová, D. (2021). Evaluation of the Financial Performance of the Municipalities in Slovakia in the Context of Multidimensional Statistics. Journal of Risk and Financial Management, 14(12), 570. https://doi.org/10.3390/jrfm14120570