Abstract
In the United States, flood events are the most economically damaging type of natural disaster. Some of the most widely used tools for understanding property flood risk in the United States are the Flood Insurance Rate Maps (FIRMs) produced by the Federal Emergency Management Agency (FEMA). Numerous previous studies have attempted to estimate the impact on property valuation from a home’s being mapped into a Special Flood Hazard Area (SFHA) within FIRMs. However, as these maps have widely served as the source of data about true flood risk, there have been limits on the ability of researchers to disentangle these zone designation impacts as due to actual flood risk or as due to perceived flood risk. New advancements in flood modeling have allowed for the prediction of high-quality property-level flood inundation, both now and in the future. By integrating these flood modeling advancements, true flood risk may be controlled for in models looking to explore the avenues by which property valuation impacts occur. To this end, this study builds on insights from recent research looking at the valuation of single-family residential properties in Miami-Dade County (MDC), which utilizes a high-resolution floodplain model to estimate the impact of actual property inundation on sales prices. By controlling for actual property flood risk, impacts of SFHA designations are estimated in MDC through implementation of a difference in difference model which utilizes the release of updated FIRMS in 2009 and the 217,222 transactions and 120,693 property designation changes which occurred within the dataset.
1. Introduction
The financial and economic impacts of flooding are significant and growing (Smith 2020; Jongman et al. 2014; Gall et al. 2011). In the U.S., riverine, rainfall, and tidal flooding, together with hurricane-driven storm surge, have resulted in more direct economic damage than has any other type of natural disaster over the last four decades (Smith 2020). Within the last few decades, climatic changes have caused an accelerated rate of sea-level rise (Kulp and Strauss 2017). Increasing development of coastal and riverine areas, rising sea levels, and changing precipitation patterns are expected to put more people and property at risk in the coming years (Wobus et al. 2019; Dottori et al. 2018; Hallegatte et al. 2013; Mendelsohn et al. 2012; Brody et al. 2011; Brody et al. 2007).
In addition to the devastating physical damages associated with flooding, there are additional impacts, such as losses in home valuation arising from actual or perceived flood risk, which have significant financial consequences for households and communities across the U.S. (McAlpine and Porter 2018; Bakkensen and Barrage 2017). The importance of flood risk information is illustrated by the impact on climate gentrification of increased coverage of flooding events (Keenan et al. 2018), increases in observed flooding at individual properties resulting in decreased property appreciation rates (McAlpine and Porter 2018), and the effects of projected future sea-level rise on real-estate pricing (Bernstein et al. 2019). It is therefore important to understand how various sources of information available to homeowners, prospective buyers, and the public impact changes in home valuations.
The Federal Emergency Management Agency’s (FEMA) Flood Insurance Rate Maps (FIRMs) have typically served as the nation’s most widely used and relied upon flood risk communication tool. In creating these maps, the Agency places a special focus on identifying the one-percent annual chance floodplain (also known as the 100-year floodplain, Special Flood Hazard Area, or SFHA). The SFHA designation is critical because it dictates whether a homeowner is required to purchase flood insurance, and can also significantly increase the price of flood insurance compared to areas outside this zone. For households located in the SFHA, the requirement to carry flood insurance and the higher premiums associated with a high-risk designation drive up the cost of homeownership, which may drive down home values as prospective homebuyers factor-in annual insurance costs and flood risks. This paper aims to extend this line of research by taking advantage of a quasi-experimental design that makes use of historic transaction data and the introduction of new FEMA FIRMS in Miami-Dade, FL. It is our hypothesis that, due to the additional perceived risk associated with being rezoned into a flood zone and the additional insurance burden that accompanies all federal mortgages of flood zone properties, we will see a decrease in property value for those properties versus all other properties in the region.
Several studies have shown that properties located in FEMA’s 1% annual chance floodplain (the SFHA) sell at a discount, and the discount tends to be most pronounced in the aftermath of a major flood event (Atreya et al. 2013; Bin and Landry 2013; Bin et al. 2008; Bin and Polasky 2004;). In Virginia Beach, VA, Indaco et al. (2019) found that being mapped into the SFHA leads to a large reduction in sale price (a $64,000 reduction at the mean over their study period). In New York City, Ortega and Taṣpınar (2018) found that in the aftermath of Hurricane Sandy, undamaged homes located in the SFHA persistently sold at discounts that reached 8% in 2017 and that the trend did not show signs of abating. In Dougherty County, GA, Atreya et al. (2013) found that a major flood in 1994 caused property values in flood zones to drop significantly, but that the impact was relatively short-lived, disappearing within a decade. In similar studies of Carteret County, NC (Bin et al. 2008) and Pitt County, NC (Bin and Polasky 2004), researchers similarly found that location within the SFHA has a significant negative impact on property value.
While it is reasonable to expect high risk properties to sell at a discount, the impact that FEMA maps have on property value is problematic because they do not provide a complete characterization of flood risk for individual properties. FIRMs do not reflect risk variation among homes in the same flood zone. They simply specify whether a property is in the 100-year floodplain, the 500-year floodplain, or neither. While that information may be useful, flood risk is not an “in or out” proposition, as the maps might otherwise imply. There is risk beyond the boundary of the 100-year floodplain, and risk within the SFHA can vary substantially, as properties are exposed to floods of various depths and return periods (First Street Foundation 2020; Wing et al. 2018). Within the SFHA, for example, there may be properties exposed to the 5-year, 20-year, and 50-year return period flood, while others would only experience flooding in the 100-year event. Moreover, the flood risk information that they do provide is subject to several well-known limitations (TMAC 2015). For example, FEMA does not study all locations comprehensively and may not use the most recent or highest-quality data. While federal law requires FEMA to assess the need to revise and update flood maps every five years, Congress often fails to allocate sufficient funds for the agency to do so. As a result, about two-thirds of FIRMs are out of date, with many dating back to the 1970s or 1980s (Keller et al. 2017). Finally, FEMA maps do not account for the changing environmental conditions that are causing flood risks to rise in many parts of the country.
Despite these limitations, FIRMs have become the de facto flood risk assessment and communication tool for households and communities throughout the country. They are used by mortgage lenders to enforce flood insurance requirements, by land use planners in crafting development plans, and by emergency management personnel in planning hazard mitigation and response efforts. While FIRMs provide a baseline level of information, they do not provide the detailed, future-facing flood risk information necessary for individuals, businesses, and investors to make informed location and investment decisions. Homeowners in the SFHA are right to be concerned that an outdated or incomplete map may be diminishing their home’s value. Conversely, those outside the SFHA are rightly wary that a new flood map may lead to a sudden drop in their home’s value, upending their financial outlook and making the property more difficult to sell.
Given the importance of these maps as the nation’s most widely used and relied upon source of information for a property’s flood risk, it is important to better understand the impacts of SFHA zone designations on property valuations. While research has shown that homes with a formal SFHA designation from FEMA are likely to sell at a discount (Atreya et al. 2013; Bin and Landry 2013; Bin et al. 2008; Bin and Polasky 2004), little is known about the impact of SFHA designations on property valuation when actual flood risk is also accounted for. That is, past studies have faced limitations in the information available to them regarding high-quality flood risk data, which have not allowed them to disentangle the impact of SFHA zone designations on property valuation from impacts due to actual flood risk. The integration of information on actual flood risk allows us to advance our understanding of the causal mechanism involved in home valuation changes following SFHA designations. That is, the impact of a property’s actual flood risk on its valuation may be evaluated separately from the impact of a property’s formal SFHA zone designation. Recent advances in flood modeling have enabled researchers and engineers to quantify flood risk probabilistically and at higher resolutions than were previously possible (Bates et al. 2021). As a result of the availability of this type of high-resolution and high-quality flood risk information, recent research by McAlpine and Porter (2018) was able to isolate the designation’s impact on home valuation from a property’s actual flood risk in the Miami-Dade County area. This was possible by controlling for hedonic variables that affect home valuation, as well as inundation of a property parcel and surrounding roads by tidal flooding sources.
Importantly, McAlpine and Porter (2018) provide a framework for isolating valuation impacts due to actual changes in flood risk as a result of sea level rise (as opposed to perceived changes in flood risk which may be provided by information from the FIRM designations). This analysis builds upon the model developed by McAlpine and Porter (2018) to estimate the impacts of sea-level rise on current real-estate losses in Miami-Dade County. This study adapts the McAlpine and Porter framework in order to control for the impacts from actual changes in flood risk due to sea level rise so that the impact of changes in a property’s FEMA flood zone designation may be isolated for the properties under consideration: single-family homes. Controlling for a wide range of additional variables that may impact property value (building characteristics, spatial desirability, temporal market fluctuations, environmental conditions, etc.), the model developed here estimates the independent effect that changes in FEMA flood zone designation have on residential property values.
2. Methods
2.1. Study Area and Data
In this analysis, we estimate the impact that changes in FEMA flood zone designations have historically had on property values in the Miami-Dade County (MDC) housing market—a community whose potential economic losses due to climate change have been well-documented (Kulp and Strauss 2017; Wdowinski et al. 2016). Miami-Dade County is home to 2.7 million people (inhabiting over 1 million housing units), and it faces significant and increasing risk from tidal, storm surge, and pluvial flooding (e.g., Genovese et al. 2011; Wdowinski et al. 2016; Raimi et al. 2020), risks exacerbated by an increasing rate of sea level rise. Research by Keenan et al. (2018) indicates that buyers in this region may be increasingly considering flood risk to properties when buying homes, given the observed increased importance of elevation and requests for elevations certificates in the home buying process. That is, information about home flood risk is an increasingly important factor for understanding consumer utility. Miami-Dade County is also one of the more expensive real estate markets in the country, with a median home value of approximately $330,000 (per the Zillow.com website at the time of analysis; accessed on 5 February 2022) and over $400 billion in assets at risk of flooding (Raimi et al. 2020). MDC also has extensive real estate transaction history, and there is a high availability of flood risk data (Figure 1a).
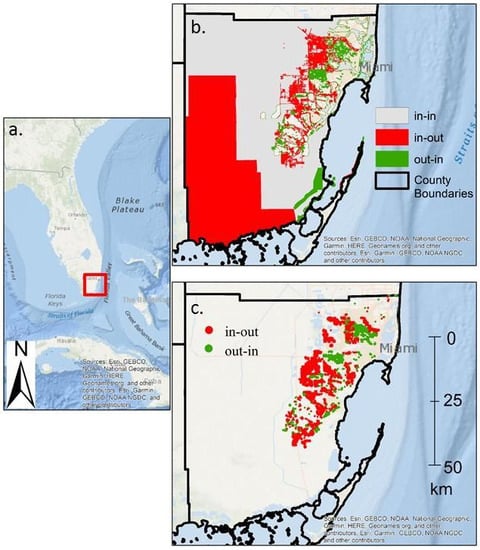
Figure 1.
(a) The study area for this research, which is located within the southeastern portion of the state of Florida, (b) SFHA status for areas within Miami-Dade County for the 1994 and 2009 FEMA FIRM maps (1994–2009), and (c) the centroids of properties that experienced a change in SFHA zone designation from the 1994 to the 2009 FIRM.
To determine if changes in flood zone status are correlated with differences in property valuations when compared to properties that did not experience changes, flood zone data were gathered from the Miami Dade County Open Data Hub. We use the 1994 Flood Insurance Rate Map (FIRM) and the 2009 FIRM—the two most recent flood zone designation datasets released by FEMA for Miami-Dade County (Figure 1b). Prior to the release of MDC’s current flood maps released in 2009, the county relied on maps from 1994. When the redrawn maps became effective in 2009, some properties previously located outside the SFHA were now determined to be within it (and vice versa). When MDC’s FIRMs were updated in 2009, nearly 16,000 properties were remapped from outside to inside the SFHA (“out to in”), where flood insurance is required. About 48,000 properties were reclassified from inside to outside of the SFHA (“in to out”), where flood insurance is voluntary. The majority of properties, just over 218,000, experienced no change in their SFHA status (“always in” or “always out”. Some of these properties had their status reconfirmed as within the SFHA zones, while the rest remained outside.
Real-estate transaction data for the 2005–2017 period were gathered from the universe of real-estate transactions (http://bbs.miamidade.gov/; accessed on 5 February 2022). The year 2005 serves as a proxy year for substantially increased rates of inundation due to flooding events, identified by McAlpine and Porter (2018) as useful for understanding the impact of inundation (modeled at a high-resolution) on property valuation. In 2012, Congress passed the Biggert-Waters Flood Insurance Reform Act, which reduced subsidies available for flood insurance rates as a result of the large amount of debt NFIP accumulated following major hurricane events, such as Katrina (made landfall in 2005) and Sandy (made landfall in 2012). The goal was to create insurance rates that better reflected the costs of flood risk (Indaco et al. 2019). However, these rate changes were implemented gradually over time and the assumption underlying the difference in difference model approach is still valid–that without treatment (zone redesignation), the “treated” groups would continue to follow the temporal sale valuation trends of the “untreated” groups. Future research will benefit from the analysis of flood zone designation changes which occurred after the full implementation of insurance rate changes, to better capture these redesignation effects, as estimates in such an analysis are likely to be more conservative than those considering current impacts.
Figure 2 and Figure 3 represent the temporal trends associated with fluctuations in both the number of sales and the sale price per square foot over the study period.
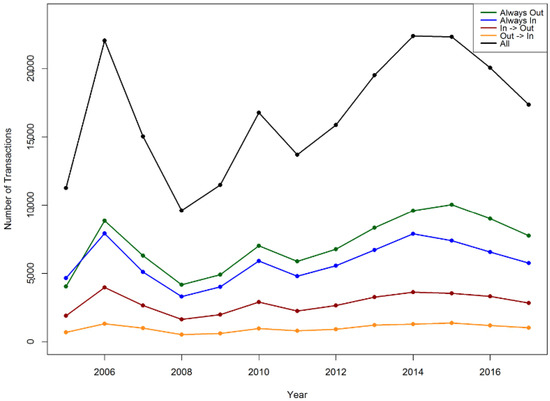
Figure 2.
Temporal trend in transaction history by flood zone change category, 2005–2011.
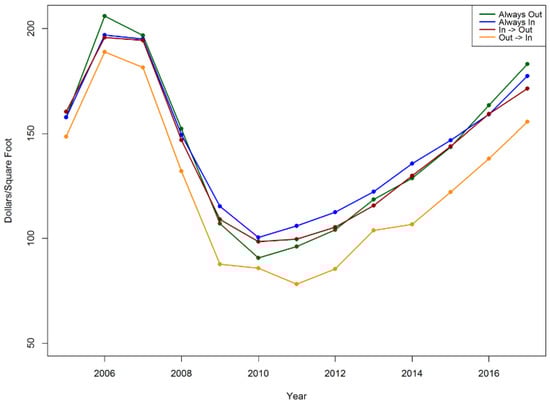
Figure 3.
Temporal trend in sale price ($/per sqft), 2005–2011.
Following guidance from McAlpine and Porter (2018), transaction records with a sale price less than USD 1000, or those not containing square footage information, were removed from the dataset. This helps to clean the data of incorrect or inappropriate financial records and ensures that for each data point the outcome of interest may be calculated. Additionally, only transactions that were identified as single-family homes were retained, as these are the only properties where insurance is required based on FEMA zone designation. The final transaction dataset used for the analyses presented here includes 217,222 transactions from 2005 through 2017 across 120,693 single family homes (Table 1).

Table 1.
The number of unique single-family homes sold and the number of transactions in each SFHA change category from 2005–2011.
We take steps to control for the influence of actual flood risk on property values over the study period. Repeated tidal flooding is more predictable than other causes of coastal flooding (e.g., storm surge from tropical cyclones), and is a persistent nuisance in many coastal areas, one often not severe enough to require insurance intervention. As such, research has shown it to be likely to be accounted for by a local housing market (Keenan et al. 2018; McAlpine and Porter 2018; Bernstein et al. 2019). Here, we used the proportion of property inundated and roads inundated within one quarter mile of a given property to estimate the impacts that frequent tidal flooding has on home valuation. Specifically, we use the property level tidal flooding statistics that McAlpine and Porter (2018) computed. These inundation statistics are calculated by generating a high resolution (5 foot) interpolated raster of the local mean higher high water (MHHW) using data obtained from the National Oceanic and Atmospheric Administration’s (NOAA) Vertical Datum Transformation. The difference between the interpolated raster and a high-resolution digital elevation model (DEM) is then taken and zonal statistics are computed for inundation for each property and for the road network within one quarter mile of each property (McAlpine and Porter 2018).
2.2. Regression Model with Interactions
To determine if changes in flood zone designation are related to the sales price per square foot of single-family homes in Miami-Dade County, a hedonic model with a difference in differences (DID) framework is utilized (Equation (1)). The model has been developed in the traditional hedonic framework presented in McAlpine and Porter (2018) with the addition of terms treating the FEMA Zone status as an amenity (“in to out”), a disamenity (“out to in”), or no significant impact (“always out” and “always in”). The basic OLS model framework developed here may be characterized as:
The price per square foot for all property sales between the years 2005 and 2017, which is obtained through the universe of real estate transactions and determined to be real transactions, operates as the dependent variable (y) in this model. This follows guidance from McAlpine and Porter (2018), as the price per square foot is useful for indicating the overall value of an area and is a better indicator of valuation differences than is the total sales price.
The term X represents a matrix of the structural characteristics for each home, such as the number of bedrooms, size of the property lot, and year built. The indicators included here are well-known predictors of home value and include characteristics which are very closely associated with value (such as number of bedrooms, number of bedrooms, size of home, and acreage). In the examples list here, generally more of each is associated with a larger property value. Additionally, the N term captures characteristics of the surrounding environment, including variables such as beach proximity, diversity of the surrounding area, and proximity to infrastructures (medical facilities, fossil fuel plants, highways, etc.). In some cases (such as proximity to beaches and golf courses) there is a well-established positive relationship with property value. However, in others (such as proximity to highways, fossil fuel plants, etc.) there is a well-established negative impact on property values. A control for census tract membership is also included to indicate differences in neighborhood characteristics that may not have been captured by the other variables included in the model. The term D is a matrix of variables which control for the overall time-series trends, including market fluctuations and flood inundation probabilities for each property and its surrounding roads. Both the census tract and the time (year) controls were included to hold constant any location or temporal effects associated with neighborhood desirability and market demand. With regard to the control for year of sale, this variable is introduced as a first through fifth order polynomial (YR, YR^2, YR^3, YR^4, YR^5) in order to account for the larger temporal impact of fluctuating market trends in the area. To assess the proper order of the temporal polynomial to include in the model, higher orders were tested in successive models until there was a loss in the reduction of error (MSE). The term F is a matrix of variables which control for flood risk at the property level. The variables are presented later in the model as LT18 (proportion of property lot at risk of flooding) and RD18 (proportion of roads within 1/10th of a mile at risk of flooding). The remaining terms capture the difference in difference model variables. Flood zone status (FZstatus) represents a dummy variable indicating a property’s membership in a SFHA change cohort: out-to-out, out-to-in, in-to-in, or in-to-out based on the property’s SFHA designation in the 1994 and 2009 FIRMs (1994 designation to 2009 designation), respectively (Figure 1c). The FEMAtp variable is a dummy variable indicating if a sale had occurred in 2009 when the updated FIRMs were released, or occurred later. The final term, FZstatus * FEMAtp, produces the difference-in-difference estimates for the valuation changes which occured following the release of the 2009 FIRMs.
Three separate models are run, all of which follow the same basic framework outlined above. Separate models are run for cohorts of properties originating from outside the SFHA zones (Model 1) and for those originating from within the SFHA zones (Model 2). Model 1 estimates the impact of a property being rezoned from outside to within an SFHA zone (out-to-in), utilizing the out-to-out cohort as the counterfactual, assuming that property valuations of properties in the out-to-in cohort would follow a similar trend as those in the out-to-out in the absence of the 2009 designation change. With similar assumptions, Model 2 estimates the impact of a property being rezoned from within to outside of an SFHA zone (in-to-out), where the in-to-in cohort is used as representative of the counterfactual scenario. A third model (Model 3) includes all cohorts in its analysis and utilizes the out-to-out group as the counterfactual. Model 3 therefore utilizes the assumption that the in-to-out and in-to-in cohorts would follow similar valuation trends as the out-to-out cohort in the absence of the “treatment” of the release of the updated FIRMs. However, there is less certainty in the validity of this assumption, so while the model results are presented here, estimates for the difference in difference terms (FZstatus * FEMAtp) should not as readily be interpreted as the impact from the release of the updated FIRM designations. All data sources are presented below in Table 2.
Table 2.
Variable Data Sources.
3. Results
Table 3 reports the descriptive statistics delineated by the origin disposition of the property (in a FEMA flood zone versus out of a FEMA flood zone). The results indicate that properties in a FEMA flood zone had higher property values (based on price per square foot), tended to be older, had more bedrooms on average, were further from the beach, golf courses, highways, and landfills, while being nearer to fossil fuel plants, military bases, and medical facilities. Additionally, there was very little in the way of meaningful differences with regard to their tidal flood experiences, with one percent or less of the properties being impacted by high probability flooding at the property or on the nearby roads.
Table 3.
Sample Statistics.
Controlling for overall temporal market trends, inundation due to tidal flooding, and hedonic property-specific variables which are important for the prediction of property valuation, the impact of SFHA zone designation updates on changes in property valuations (as measured by price per square foot) may be isolated. The difference in differences parameters make use of the FIRM release year (2009) as the “treatment time” and a property’s designation status (in-to-in, in-to-out, out-to-out, out-to-in) to inform groupings into “treatment” and “control” cohorts.
For the parameters assessing the impact on home valuation for the properties which were redesignated from outside of the SFHA to inside (out-to-in), the estimates are consistently negative and statistically significant when compared to properties which were consistently outside of the SFHA zones. Results of the regression analysis indicate that in the time period following the release of the 2009 Miami-Dade FIRM, single family homes that moved from out to within the SFHA experienced an additional loss in price per square foot of $2.55 in Model 1 (p-value < 0.05) and $2.82 in Model 3 (p-value < 0.05) when compared to single family homes which were consistently located outside of the SFHA in both 1994 and 2009 FIRMs (Table 4). While both Model 1 and Model 3 utilize the out-to-out cohort valuations as the counterfactual, Model 3 includes the additional observations of the properties in the in-to-in and in-to-out cohorts for estimating all other variable coefficients.
Table 4.
Regression results predicting price per square foot.
Single family homes which moved from in-to-out of SFHA zones were estimated to experience a gain of $2.26 per square foot (p-value < 0.01) when compared to homes which were consistently within the SFHA zones (Table 4, Model 2). This positive estimate aligns with our expectations, considering that the additional cost burden of flood insurance is no longer required for homes with federally-backed mortgages (or as required by other lenders) and that the re-designation may indicate to buyers that there is decreased flood risk for the property.
The full model (Model 3) includes all of the cohorts in the analysis and utilizes the out-to-out group as the “control” group. In Model 3, the difference in difference coefficients for the in-to-out and in-to-in groups are both positive and statistically significant ($7.81 with p-value < 0.001, and $5.65 with p-value < 0.001, respectively). While this model is less useful for understanding the impact of zone re-designations, as there is less integrity in comparing in-to-out and in-to-in valuation differences following the release of the updated FIRMs against the property valuations of the out-to-out group, the results of this model may provide insight into the limitations of this study and additional exploratory research opportunities aiming to further refine the time-series models developed here. These positive coefficient estimates may be a result of varying reactivity to market changes not captured by the trend proxies used in this study (such as the varying elasticities of certain variables with regard to market crashes or recoveries). Additionally, coefficient estimates may potentially be explained by specific behavioral reactions from receiving the updated flood hazard and exposure information. For example, confirmation that a property is still within an SFHA zone may reduce uncertainty of it belonging there or not (it was zoned within an SFHA in multiple FIRMs, so it seems more likely to property owners that the information is correct), so valuation may increase as the contribution of ambiguity aversion is decreased.
4. Discussion
The results of this study indicate a relationship between SFHA zone designation and price per square foot of single-family homes in Miami-Dade County that is separate from actual observed flooding inundation of a property. Past research has indicated that separately from the actual observed risk of tidal flooding, simply receiving additional information about a property’s flood risk, such as from higher media coverage of nearby flood events, may be an important influence on driving home sale prices (Keenan et al. 2018). In this study, the impact of SFHA designations on property valuations are estimated while controlling for the actual likelihood of flood inundation to the property and surrounding roads, so that the impact of SFHA designations may be interpreted more independently as a source of information (influencing the perceived flood risk by insurance rates and consumers). While this study does not isolate the contribution of changed insurance cost burdens versus changed consumer preferences as a result of the newly released flood zone designations, both of these factors are likely to be present. Detailed property-specific insurance pricing information is necessary for future studies looking to isolate the contribution of insurance pricing and consumer valuation changes due to this type of additional information being provided.
To contextualize the loss estimates by Model 1, the mean home size in our sample for the out-to-in cohort is 1642 square feet and would have seen an average annual loss of $4187 in valuation following the release of the 2009 FIRM. While this finding is informative for understanding valuation changes as a result of SFHA zone designations, there are several additional factors which future research should explore. Homes in the out-to-in cohort which already were enrolled in flood insurance are not likely to have a sales price drop as a result of the new requirement for flood insurance, as there are several options for ensuring their insurance prices are minimal regardless of their new SFHA designation. For example, these homes may apply for grandfathering their Zone X rates, may use a Pre-Firm rate, and/or obtain elevation certificates. NFIP’s grandfathering rules allow owners of homes built in compliance with the FIRM in effect at the time of construction to keep their lower-risk flood insurance rate if their property is mapped into a new, higher risk zone. Savings from these rules can be substantial. For example, an insured home outside the SFHA that is then mapped into the SFHA at several feet below base flood elevation (BFE) can save thousands of dollars annually thanks to grandfathering rules (for more discussion on the potential price impacts of grandfathering, see Kousky et al. 2016). Therefore, valuation changes for homes where insurance cost burdens remain unchanged may be assumed to be the result of behavioral preferences (risk aversion, ambiguity aversion, etc.).
The mean home size in the sample for the in-to-out cohort is 1884 square feet and thus would have experienced an additional gain of $4257 under the estimates provided by Model 2. The role of changed insurance burden is likely to be responsible for a large portion of this estimated change. While future research should look to isolate the pricing changes resulting only from consumer valuation, analysis of this in-to-out change will face further difficulties than those faced for estimating impacts for the out-to-in changes, as there are complex insurance pricing rules involved which reveal themselves especially for this type of change. For properties within the SFHA zones, receiving an elevation certificate showing that buildings within the property are elevated above the BFE may result in substantial savings (Flood Insurance: Miami-Dade County n.d.). For example, an insured structure that is four feet above BFE and newly mapped outside of the SFHA, could see their premium increase from roughly $400 per year to more than $1100 (Kousky et al. 2016). This may be especially relevant in places like Miami-Dade, where flooding is prevalent, and many people want to carry flood insurance regardless of SFHA status. Essentially, the remapping for properties from inside to outside of the SFHA may actually increase the insurance liability of the home if they previously received savings through the consideration of elevation certificates. This may result in consumers deciding to discontinue flood insurance coverage for reasons other than just that it is no longer required for their property.
Bernstein et al. (2019) found that the liquidity of the real estate market is important for observation of discounts associated with sea level rise risk valuation as when there are a large amount of buyers; buyers who understand the magnitude of the risk of future flood risk projections and thus price it into their offer prices are likely to be outbid by buyers who do not include this sophisticated risk information in their valuations. Relatedly, it may be expected that this would be true for any source of additional information about future flood risk. Therefore, the effects estimated here may vary through time with the total number of transactions (how liquid the market is). To this point, future analysis may benefit from the inclusion of information which segments models by varying consumer characteristics.
Additionally, it should be noted that while the model developed here generally controls for market trends and fluctuations, the specific variabilities of individual control variables in response to market changes are not included here, as they could introduce multicollinearity. For example, the valuation of proximity to the beach may change over time in a way that is different from valuation changes of proximity to hospitals over time, but those homes with close proximity to the beach may have higher likelihoods of designation within SFHA zones. This limitation is especially illustrated when considering the housing market crash of 2008. Additional research and data points would be required to create several models which separate based on these factors. However, the general market controls utilized in the models here as well as the separation of original designations prior to the FIRM update by Model 1 and Model 2 are deemed sufficient for capturing estimates of these changes in order to fulfill the purpose of this study.
While the directionality of the coefficient estimates is expected, the relative magnitudes of each will likely require additional investigation, especially for research looking to apply estimates to other related scenarios. Magnitudes of each of the coefficient results may potentially be explained through the role of the 2008 market crash as well as through sample-specific characteristics such as market liquidity. While estimating the impact of the market crash will have several limitations, efforts to conduct a causal inference on the impact of the SFHA zone designation changes would benefit from an enhanced version of this model which includes these additional controls. The inclusion of these factors for this time period will require substantial data and econometric modeling, but will likely prove useful in further isolating the effects of the SFHA designation changes. However, this may be avoided for studies which estimate the impact coefficients over a longer time period and where a largely influential market change did not overlap with the date of the map update’s release.
5. Concluding Remarks
These results carry with them extremely important policy implications. First, it is clear that local property values are statistically associated with the changes in flood zones. In a time when flood risk is known to be increasing and FEMA is known to be integrating additional measures into their mapping methodologies, this could have large ramifications for the future of property values in flood-prone areas. Generally, this means that many communities where flood maps do not exist, or where the maps need to be updated, likely have an overvalued set of property assets. Importantly, the values of homes tended to be less sensitive if they were being removed from a flood zone. This has long been an issue that FEMA has had to deal with in the institutionalization of new community flood maps and this research indicates that it will likely continue to be so. The second important policy implication is associated with recent movements in the federal government to adjust the federal insurance program through the introduction of Risk Rating 2.0 (RR2.0). RR2.0 has the potential to right-size the insurance pricing market, but could also introduce additional risk to property value through the perceived risk associated with new insurance rates and the insurance burden that comes with that risk. As individuals perceive more cost associated with home-ownership, they will respond by requiring concessions at sale that will cover those costs (at least in the short term). What this ultimately amounts to is lower transaction prices and ultimately, lower property values.
The results of this study are in line with expectations set by previous research insights and with a basic understanding of concepts relevant to home valuation under risk scenarios. Several potential research opportunities are presented following the presentation of the findings within this study, opportunities which may utilize the framework developed here to inform the construction of a research question and the design of an appropriate methodology. Ultimately, this study presents an improvement in methodologies and a path forward for increasing the scientific community’s understanding of the impact of SFHA designations on residential property valuations.
Author Contributions
Conceptualization, J.R.P.; methodology, J.R.P. and E.G.S.; validation, M.B., M.L.P. and B.W.; formal analysis, J.R.P. and E.G.S.; data curation, J.R.P.; writing—original draft preparation, J.R.P. and E.G.S.; writing—review and editing, J.R.P., E.G.S., B.W., M.B. and M.L.P.; visualization, J.R.P. and E.G.S. All authors have read and agreed to the published version of the manuscript.
Funding
The authors declare that no funds, grants, or other support were received during the preparation of this manuscript.
Data Availability Statement
The datasets generated during and/or analyzed during the current study are available from the corresponding author on reasonable request.
Conflicts of Interest
The authors have no relevant financial or non-financial interest to disclose.
References
- Atreya, Ajita, Susana Ferreira, and Warren Kriesel. 2013. Forgetting the flood? An analysis of the flood risk discount over time. Land Economics 89: 577–96. [Google Scholar] [CrossRef]
- Bakkensen, Laura, and Lint Barrage. 2017. Flood Risk Belief Heterogeneity and Coastal Home Price Dynamics: Going under Water? No. w23854. Cambridge: National Bureau of Economic Research. [Google Scholar]
- Bates, Paul, Niall Quinn, Christopher Sampson, Andy Smith, Oliver Wing, Jason Sosa, and Witek Krajewski. 2021. Combined modeling of US fluvial, pluvial, and coastal flood hazard under current and future climates. Water Resources Research 57: e2020WR028673. [Google Scholar] [CrossRef]
- Bernstein, Asaf, Matthew Gustafson, and Ryan Lewis. 2019. Disaster on the horizon: The price effect of sea level rise. Journal of Financial Economics 134: 253–72. [Google Scholar] [CrossRef]
- Bin, Okmyung, and Craig E. Landry. 2013. Changes in implicit flood risk premiums: Empirical evidence from the housing market. Journal of Environmental Economics and Management 65: 361–76. [Google Scholar] [CrossRef]
- Bin, Okmyung, and Stephen Polasky. 2004. Effects of flood hazards on property values: Evidence before and after Hurricane Floyd. Land Economics 80: 490–500. [Google Scholar] [CrossRef]
- Bin, Okmyung, Jamie Brown Kruse, and Craig Landry. 2008. Flood hazards, insurance rates, and amenities: Evidence from the coastal housing market. Journal of Risk and Insurance 75: 63–82. [Google Scholar] [CrossRef]
- Brody, Samuel D., Joshua Gunn, Walter Peacock, and Wesley E. Highfield. 2011. Examining the influence of development patterns on flood damages along the Gulf of Mexico. Journal of Planning Education and Research 31: 438–48. [Google Scholar] [CrossRef]
- Brody, Samuel D., Sammy Zahran, Praveen Maghelal, Himanshu Grover, and Wesley E. Highfield. 2007. The rising costs of floods: Examining the impact of planning and development decisions on property damage in Florida. Journal of the American Planning Association 73: 330–45. [Google Scholar] [CrossRef]
- Dottori, Francesco, Wojciech Szewczyk, Juan Carlos Ciscar, Fang Zhao, Lorenzo Alfieri, Yukuko Hirabayashi, Alessandra Bianchi, Ignazio Mongelli, Katia Frieler, Richard Betts, and et al. 2018. Increased human and economic losses from river flooding with anthropogenic warming. Nature Climate Change 8: 781–86. [Google Scholar] [CrossRef]
- First Street Foundation. 2020. The First National Flood Risk Assessment: Defining America’s Growing Risk. Available online: https://assets.firststreet.org/uploads/2020/06/first_street_foundation__first_national_flood_risk_assessment.pdf (accessed on 20 January 2022).
- Flood Insurance: Miami-Dade County. n.d. Available online: https://www.miamidade.gov/environment/flood-insurance.asp (accessed on 21 January 2022).
- Gall, Melanie, Kevin A. Borden, Christopher T. Emrich, and Susan L. Cutter. 2011. The unsustainable trend of natural hazard losses in the United States. Sustainability 3: 2157–81. [Google Scholar] [CrossRef]
- Genovese, Elisabetta, Stephane Hallegatte, and Patrice Dumas. 2011. Damage assessment from storm surge to coastal cities: Lessons from the Miami area. In Advancing Geoinformation Science for a Changing World. Berlin and Heidelberg: Springer, pp. 21–43. [Google Scholar]
- Hallegatte, Stephane, Colin Green, Robert J. Nicholls, and Jan Corfee-Morlot. 2013. Future flood losses in major coastal cities. Nature Climate Change 3: 802–6. [Google Scholar] [CrossRef]
- Indaco, Agustin, Francesc Ortega, and Süleyman Taşpınar. 2019. The effects of flood insurance on housing markets. Cityscape 21: 129–56. [Google Scholar] [CrossRef]
- Jongman, Brenden, Stefan Hochrainer-Stigler, Luc Feyen, Jeroen C. Aerts, Reinhard Mechler, Wouter W. Botzen, Laurens M. Bouwer, Georg Pflug, and Philip J. Ward. 2014. Increasing stress on disaster-risk finance due to large floods. Nature Climate Change 4: 264–68. [Google Scholar] [CrossRef]
- Keenan, Jesse, Thomas Hill, and Anurag Gumber. 2018. Climate gentrification: From theory to empiricism in Miami-Dade County, Florida. Environmental Research Letters 13: 054001. [Google Scholar] [CrossRef]
- Keller, Michael, Mira Rojanasakul, David Ingold, Christopher Flavelle, and Brittany Harris. 2017. Outdated and Unreliable: FEMA’s Faulty Flood Maps Put Homeowners at Risk” Bloomberg. Available online: www.bloomberg.com/graphics/2017-fema-faulty-flood-maps/ (accessed on 6 February 2022).
- Kousky, Carolyn, Brett Lingle, and Leonard Shabman. 2016. NFIP Premiums for Single-Family Residential Properties: Today and Tomorrow. RFF Policy Brief, Resources for the Future. No. 16-10. Available online: https://media.rff.org/archive/files/document/file/RFF-PB-16-10.pdf (accessed on 6 February 2022).
- Kulp, Scott, and Benjamin H. Strauss. 2017. Rapid escalation of coastal flood exposure in US municipalities from sea level rise. Climatic Change 142: 477–89. [Google Scholar] [CrossRef]
- McAlpine, Steven A., and Jeremy R. Porter. 2018. Estimating recent local impacts of sea-level rise on current real-estate losses: A housing market case study in Miami-Dade, Florida. Population Research and Policy Review 37: 871–95. [Google Scholar] [CrossRef]
- Mendelsohn, Robert, Kerry Emanuel, Shun Chonabayashi, and Laura Bakkensen. 2012. The impact of climate change on global tropical cyclone damage. Nature Climate Change 2: 205–9. [Google Scholar] [CrossRef]
- Ortega, Francesc, and Süleyman Taṣpınar. 2018. Rising sea levels and sinking property values: Hurricane Sandy and New York’s housing market. Journal of Urban Economics 106: 81–100. [Google Scholar] [CrossRef]
- Raimi, Daniel, Ameila Keyes, and Cora Kingdon. 2020. Florida Climate Outlook: Assessing Physical and Economic Impacts through 2040. Resources for the Future Report. 20-01. Available online: http://resp.llas.ac.cn/C666/handle/2XK7JSWQ/275194 (accessed on 6 February 2022).
- Smith, Adam B. 2020. US Billion-Dollar Weather and Climate Disasters, 1980–Present; (NCEI Accession 0209268); Asheville: NOAA National Centers for Environmental Information.
- Technical Mapping Advisory Council. 2015. TMAC 2015 Annual Report. Federal Emergency Management Agency. Available online: https://www.fema.gov/sites/default/files/documents/fema_tmac_2015_annual_report.pdf (accessed on 15 January 2022).
- Wdowinski, Shimon, Ronald Bray, Ben P. Kirtman, and Zhaohua Wu. 2016. Increasing flooding hazard in coastal communities due to rising sea level: Case study of Miami Beach, Florida. Ocean and Coastal Management 126: 1–8. [Google Scholar] [CrossRef]
- Wing, Oliver E., Paul D. Bates, Andrew M. Smith, Christopher C. Sampson, Kris A. Johnson, Joseph Fargione, and Philip Morefield. 2018. Estimates of present and future flood risk in the conterminous United States. Environmental Research Letters 13: 034023. [Google Scholar] [CrossRef]
- Wobus, Cameron, Pearl Zheng, Justin Stein, Claire Lay, Hardee Mahoney, Mark Lorie, David Mills, Bill Szafranski, and Jeremy Martinich. 2019. Projecting changes in expected annual damages from riverine flooding in the United States. Earth’s Future 7: 516–27. [Google Scholar] [CrossRef] [PubMed]


Publisher’s Note: MDPI stays neutral with regard to jurisdictional claims in published maps and institutional affiliations. |
© 2022 by the authors. Licensee MDPI, Basel, Switzerland. This article is an open access article distributed under the terms and conditions of the Creative Commons Attribution (CC BY) license (https://creativecommons.org/licenses/by/4.0/).