Article

Regional Economic and Financial Interconnectedness and the Impact of Sanctions: The Case of the Commonwealth of Independent States

by
Mirzosaid Sultonov
Department of Global Innovation Studies, Faculty of Global and Regional Studies, Toyo University, 5-28-20, Hakusan, Bunkyo-ku, Tokyo 112-8608, Japan
J. Risk Financial Manag. 2022, 15(12), 565; https://doi.org/10.3390/jrfm15120565
Submission received: 5 November 2022 / Revised: 25 November 2022 / Accepted: 27 November 2022 / Published: 29 November 2022
(This article belongs to the Special Issue Financial Markets, Financial Volatility and Beyond, 2nd Edition)

Abstract

:
The war in Ukraine and the direct and indirect political, economic and financial involvement of many countries worldwide in this conflict demonstrates the difficult process of developing the new world order. Over 10,000 sanctions have already been imposed on Russia by the United States, the European Union and their allies. Many countries are significantly affected by sanctions regardless of whether they are imposing them, being targeted by them, or have economic and trade partnerships with either—or both—of the sides. Commonwealth of Independent States (CIS) countries have been significantly affected by sanctions related to the Russian–Ukrainian war. Seasonally adjusted real quarterly time series, including gross domestic product and external trade, monthly nominal exchange rate time series, exogenous dummy variables for sanctions, and a combination of the vector autoregressive model and the Granger causality test were used in the estimations. We demonstrate how sanctions have affected the Russian economy and foreign exchange market and how their impact may spill over to the economies and foreign exchange markets of other CIS countries. Based on the research findings and contemporary political and economic conditions in the region and the world, we make suggestions helpful for improving the international economic and trade policies of the CIS countries.

1. Introduction

Over the past seven decades, the United States (US) with its allies has maintained the balance of power and peace globally (Haas 2020). The status of global leader for the US has been justified not only by its military power but also by its political and economic ability and willingness to coordinate responses to international and global issues (Campbell and Doshi 2020). Today, the formation of the new world order is incomplete and international relations are in a very serious phase. Some countries, such as Russia and China, are calling for a multipolar world order (Devonshire-Ellis 2022). Meanwhile, the White House claims that no nation is better positioned to navigate the future than America and mentions Russia and China as the new threats of the changing world (White House 2021).
The war in Ukraine and the direct and indirect political, economic and financial involvement of many countries worldwide in this conflict demonstrates the difficult process of developing the new world order. Over 10,000 sanctions have already been imposed on Russia by the US, the European Union (EU) and their allies. The imposed country, imposing countries, and the economic and trade partners of both the imposed and imposing countries are being significantly affected by these sanctions. Consequently, uncertainty is increasing in the global commodity, energy and financial markets.
The Commonwealth of Independent States (CIS) is being significantly affected by sanctions related to the Russian–Ukrainian war. After their independence in the early 1990s, the CIS countries started economic reforms, yet their transition to a market economy is not complete. The legacy of socialism and significant political and economic dependence on Russia are impediments to the economic and social development of other CIS countries.
In this paper, we assess changes in and interdependence between the economies of eight full members of the CIS (Armenia, Azerbaijan, Belarus, Kazakhstan, Kyrgyzstan, Moldova, Russia and Tajikistan) and one associate state (Ukraine) over the last 20 years. Although Uzbekistan is also a full member of the CIS, data needed to conduct our assessment were not available for this country and it was therefore excluded from our estimations. While Ukraine ratified the CIS agreement in 1991, it did not ratify the charter of the CIS; and although it had the status of associate state by 2018, it has never been a full member of the CIS. Ukraine has stopped participating in the CIS since 2014, withdrew representatives from statutory bodies of the CIS in 2018, and terminated many association agreements with the CIS in the last few years.
We explain the process of globalisation, changing trade structures and the remaining regional interconnectedness between CIS countries. Seasonally adjusted real quarterly time series, including gross domestic product (GDP) and external trade, monthly nominal exchange rate time series, and additional exogenous dummy variables for sanctions, were used to estimate the impact of sanctions on the Russian economy and on Russian trade with other CIS countries, as well as the interconnectedness between the economies and financial markets of the CIS countries.
The impact of economic sanctions on the Russian economy and Russian financial markets has attracted the attention of many researchers. IMF (2015), Shirov et al. (2015), Kholodilin and Netsunajev (2016), and Pestova and Mamonov (2019) examined the relationship between sanctions and Russian GDP and revealed that sanctions have caused the Russian GDP to decrease. Dreger et al. (2015), Tyll et al. (2018), Kholodilin and Netšunajev (2019), and Sultonov (2020) evaluated the relationship between sanctions and the foreign exchange markets of Russia and revealed that sanctions have had a significant impact on the exchange rate of the Russian ruble. Such research findings demonstrate that sanctions have depreciated the ruble (Kholodilin and Netšunajev 2019; Sultonov 2020), affected the conditional volatility of the exchange rate of the ruble (Dreger et al. 2015), and made the ruble more dependent on oil price changes (Tyll et al. 2018).
The lack of appropriate data makes the analysis of the indirect impact of sanctions (imposed on Russia) on the economies of CIS countries difficult to conduct. The researchers (Bayramov et al. 2020) sought to address the lack of data by disaggregating annual data into quarterly data and pooling the limited number of observations into panel data, although doing so made the research findings less robust.
The Interstate Statistical Committee of the CIS (CIS STAT 2022) provides quarterly nominal GDP data in local currency (cumulative data for each year), monthly exchange rates per one USD (average from the beginning of the year) and Consumer Price Index (CPI) as a percentage of the last month of the previous year since 2000. Preparing seasonally adjusted real quarterly GDP time series and nominal monthly exchange rate time series from the data provided by CIS STAT (2022) and using the arranged data in our estimations, we demonstrate how sanctions have affected the Russian economy and foreign exchange market and how their impact may spill over to the economies and foreign exchange markets of other CIS countries. Based on the research findings and contemporary political and economic conditions in the region and the world, we make suggestions helpful for improving the international economic and trade policies of the CIS countries.
The next section explains the important social and economic features of CIS countries, including their major indicators, their interconnectedness with the Russian economy and the economic and political environment in which they exist. Section 3 describes the data and methodology. Section 4 presents the empirical findings. The last two sections discuss the research findings, conclude the paper and provide policy implications.

2. The Economies of CIS Countries

2.1. Major Economic and Social Indicators

Major economic and social indicators for the CIS countries are presented in Table 1. As of 2020, the total population of the CIS countries was 248.1 million, comprising 3.2 percent of the world population. Of these countries, Russia has the largest population (144.1 million). Ukraine and Kazakhstan have the second (44.1 million) and third (18.8 million) largest populations, respectively. Armenia (3.0 million) and Moldova (2.6 million) have comparatively smaller populations. The remaining countries have medium-size (6.6 million to 10.1 million) populations (World Bank 2022a).
The CIS countries have a combined GDP of 1960.6 billion USD, which, in 2020, was equal to 2.3 percent of the world GDP. Russia has the largest economy: 1488.3 billion USD in 2020. Kazakhstan has the second largest economy (171.1 billion USD), followed by Ukraine (156.6 billion USD). Other countries with comparatively large economies include Belarus (61.5 billion USD) and Azerbaijan (42.7 billion USD). The remaining countries have comparatively smaller (7.8 billion USD to 12.6 billion USD) economies (World Bank 2022b).
In 2020, the average GDP per capita of the CIS countries was 4960.87 USD, higher than the average of lower-middle-income countries and lower than the average of upper-middle-income countries. Russia’s per capita income (10,161.98 USD) was higher than the average per capita income of upper-middle-income countries. Kyrgyzstan and Tajikistan have per capita incomes lower than the average per capita income of lower-middle-income countries. Other CIS countries have per capita incomes higher than the average per capita income of lower-middle-income countries but lower than the average per capita income of upper-middle-income countries (World Bank 2022c).
The average Human Development Index (HDI) is high in the CIS countries. The HDI is very high in Belarus, Kazakhstan and Russia, high in Armenia, Azerbaijan, Moldova and Ukraine, and medium in Kyrgyzstan and Tajikistan (UNDP 2020).
In the first half of the 1990s, political and economic disintegration caused a deep economic recession in the CIS countries. From 1991 to 1995, the average annual decrease in GDP in these countries was 11.9 percent. The economic recession continued during the second half of the 1990s for Moldova and Ukraine. The average annual growth rates for the CIS countries were lower than both the world average and the average for high-, middle- and low-income countries in the 1990s. The recovery process lasted for approximately a decade. Growth rates were high in the 2000s, especially for Azerbaijan and Kazakhstan, as these countries benefited from the significant share of fuels in their exports. In the first half of the 2000s, the average growth rate of the CIS countries was 8.7 percent, higher than the world average and the average for high-, middle- and low-income countries. In the second half of the 2000s, the average growth rate of the CIS countries was 6.1 percent, higher than the world average and the average for high- and low-income countries but lower than the average for middle-income countries. In the first half of the 2010s, the average growth rate of the CIS countries was 3 percent, equal to the world average, higher than the average for high- and low-income countries, and lower than the average for middle-income countries. In the second half of the 2010s, the average growth rate of the CIS countries was 2 percent, higher than the world average and the average for high-income countries, and lower than the average of middle- and low-income countries (World Bank 2022d).

2.2. Interconnectedness with the Russian Economy

In the 2000s and 2010s, average annual trade as a share of GDP was 99.1 percent and 85.2 percent for the CIS countries, respectively, higher than the world average and the average for high-, middle- and low-income countries (World Bank 2022e, 2022f). Those CIS countries that had fuels as a significant share of their exports (Azerbaijan, Kazakhstan and Russia) had positive trade balances, while those that did not had trade deficits. Trade deficits were high for small and remittance-dependent economies (Armenia, Kyrgyzstan, Moldova and Tajikistan).
A comparison of exports and imports of CIS countries in 2000, 2010 and 2020 years shows a decreasing trend in share of exports to and imports from the CIS countries and an increasing trend in share of exports to and imports from other countries worldwide. In 2020, Belarus was the only country whose exports to CIS countries constituted more than 50 percent of its total exports. In 2020, imports from CIS countries comprised more than 50 percent of total imports to Belarus, Kyrgyzstan and Tajikistan (CIS STAT 2022).
According to the latest available data from World Integrated Trade Solutions (WITS 2022), during 2011–2019, Russia was a major export destination for Armenia (21.7 percent of total exports), Belarus (40.6 percent), Kyrgyzstan (12.5 percent), Moldova (17.1 percent) and Ukraine (17.0 percent). Comparative figures for the remaining CIS countries were as follows: Azerbaijan (3.7 percent), Kazakhstan (8.7 percent) and Tajikistan (5.7 percent). Other major export destinations for the CIS countries were Italy, China, Turkey, the Netherlands, Switzerland and Germany. Fuels were major exports for Azerbaijan, Kazakhstan and Russia. Minerals, metals, vegetables, textiles and clothing, machines and electronics were major exports for the CIS countries (Table 2).
Russia is the major import country for all CIS countries. During 2011–2019, imports from Russia as a share of total imports for the CIS countries were as follows: Armenia (27.2 percent), Azerbaijan (16.2 percent), Belarus (55.4 percent), Kazakhstan (37.5 percent), Kyrgyzstan (29.9 percent), Moldova (13.7 percent), Tajikistan (28.8 percent) and Ukraine (22.9 percent). Other major import countries for the CIS countries were China, Turkey and Germany. Machines and electronics, chemicals, metals, and transportation goods were major imports for all CIS countries, while fuels were major imports for fuel-poor CIS countries (Table 2).
Remittance inflows as a share of GDP in the CIS countries (including Russia) were 10.0 percent in the 2000s and 12.2 percent in the 2010s, higher than the world average and the average for high-, middle- and low-income countries (World Bank 2022g). Small and fuel-poor CIS countries (Armenia, Kyrgyzstan, Moldova and Tajikistan) were more remittance-dependent. In the last two decades, Kyrgyzstan, Moldova and Tajikistan have been on the list of major remittance-dependent economies worldwide. A significant share of remittances flows from Russia to other CIS countries. The numbers in brackets for 2011–2020 (Table 2, column 4) show remittances from Russia (according to the Central Bank of Russia 2022) as the percentage of total remittances received from abroad.
The average foreign direct investment (FDI) net inflow as a share of GDP for the CIS countries (including Russia) was 7.4 percent in the 2000s and 3.5 percent in the 2010s. The average FDI net inflow for the CIS countries was higher than the world average and the average for high-, middle- and low-income countries in the 2000s and higher than the world average and the average for high- and middle-income countries, yet lower than the average for low-income countries, in the 2010s. Azerbaijan and Kazakhstan had comparatively higher levels of FDI net inflow as a share of GDP in the 2000s (World Bank 2022h).
The net inflow of FDI from Russia as a share of total FDI for 2011–2020 was comparatively higher for Armenia, Belarus and Kyrgyzstan (Table 2).

2.3. Economic and Political Environment

Table 3 presents economic freedom scores for the CIS countries as reported by the Heritage Foundation (2022). The average overall score for the CIS countries is mostly unfree, with repressed property rights, investment freedom and financial freedom. Average business freedom is evaluated as moderately free, average monetary and trade freedom as mostly free, and tax burden as free.
Tajikistan has the lowest overall score evaluated as repressed. Armenia, Azerbaijan, Kazakhstan and Moldova have comparatively higher overall scores, evaluated as moderately free. The overall scores of the other countries are evaluated as mostly unfree.
Property rights are evaluated as repressed in Belarus, Kyrgyzstan, Russia, Tajikistan and Ukraine, and mostly unfree in other CIS countries. Tax burdens are evaluated as free for all CIS countries. Business freedom is reported as mostly unfree for Belarus, Kyrgyzstan and Tajikistan, and moderately free for other CIS countries. Monetary freedom is reported as moderately free for Kazakhstan, Russia and Tajikistan, and mostly free for other CIS countries. Trade freedom is reported as moderately free for Azerbaijan, Russia and Tajikistan, and mostly free for other CIS countries. Investment freedom is reported as repressed in Belarus, Russia, Tajikistan and Ukraine, mostly unfree in Kazakhstan and Moldova, moderately free in Kyrgyzstan, and mostly free in Armenia and Azerbaijan. Financial freedom is reported as repressed in Belarus, Russia, Tajikistan and Ukraine, mostly unfree in Kazakhstan, Kyrgyzstan and Moldova, moderately free in Azerbaijan, and mostly free in Armenia.
Freedom House (2022) reports the freedom scores as partly free for Armenia, Moldova and Ukraine, and not free for other CIS countries. Internet freedom scores are evaluated as free for Armenia, partly free for Kyrgyzstan and Ukraine, and not free for other countries (data for Moldova and Tajikistan are not reported). Democracy scores are evaluated as transitional or hybrid regimes for Armenia, Moldova and Ukraine, and as consolidated authoritarian regimes for other CIS countries. Transparency International (2021) reports more corruption in all CIS countries—in particular, high levels of corruption are reported for Azerbaijan, Kyrgyzstan, Russia and Tajikistan (Table 4).

3. Data and Methodology

3.1. Data Description

The logarithmic difference of seasonally adjusted real quarterly time series for the 2000Q2–2019Q4 period, at constant prices of 2010Q1 (Table 5), were used to estimate the relationship between Russian GDP and Russian trade with other CIS countries, and between the GDPs of the CIS countries. The arranged time series are based on raw data provided by CIS STAT (2022) and the Central Bank of Russia (2022).
The mean of the time series demonstrates decreasing trends for the GDPs of Belarus and Ukraine, and for Russian trade with other CIS countries, and increasing trends for other variables. The Phillips-Perron test for unit root rejects the null hypothesis of a unit root at the 1% significance level for all variables.
Logarithmic differences of seasonally adjusted nominal monthly time series for the 2001M2–2021M11 period were used in the estimation of the relationship between the foreign exchange markets of the CIS countries. The time series were arranged from the raw data provided by CIS STAT (2022). The mean of the time series demonstrates increasing trends (depreciation) for all currencies in terms of USD, excluding Armenia. The Phillips-Perron test for unit root rejects the null hypothesis of a unit root at the 1% significance level (Table 6).
Data for sanctions imposed on Russia by the US and the EU were used as an exogenous dummy variable to estimate the impact of the sanctions on Russian GDP and Russian trade with other CIS countries. A total of 19 sanctions for the 2014Q1 to 2018Q3 period, including five economic sanctions, six financial sanctions and eight corporate sanctions, were used in the estimations.
Economic sanctions comprise trade suspension, export and import restrictions, and restrictions on the export of oil and gas technologies. Financial sanctions targeted Russian banks and financial institutions, restricting access to capital markets for Sberbank, Vneshekonombank, Gazprombank, the Russian National Commercial Bank, the Bank of Moscow, Bank Rossia, the Russian Agricultural Bank and VTB Bank. Corporate sanctions comprise the suspension of financing for Russian companies and the inclusion of Russian companies (Crimean energy companies, Russian key energy companies, Russian military and defence companies, and companies linked to the Russian president) in the sanctions list. The sanctions data are based on original information reported by Radio Free Europe/Radio Liberty (2018).

3.2. Methodology

Based on the statistical features of the data, a combination of the vector autoregressive (VAR) model and the Granger causality test (Granger 1969) were used in the estimations. Pre-tests for a unit root and cointegration were implemented before estimating the VAR model. If the first differences of the variables did not have a unit root and there was no cointegration relation (long-run relationship) between the variables, the VAR model was used. Otherwise, a vector-error correction model (VECM) was used.
In the VAR model (Equation (1)), the current values of each variable depend on their own lagged values as well as on the lagged values of the other variables. We considered a VAR model with p lags, where y t is the vector of variables, c is the vector of parameters, A i is the matrix of parameters and ε t is the vector of residuals. The number of lags was chosen based on the Akaike (Akaike 1974) information criterion (AIC). The Lagrange-multiplier test (Johansen 1995) was used as a post-estimation test to examine the null hypothesis that no autocorrelation would appear in the residuals.
y t = c + A 1 y t 1 + A 2 y t 2 + + A p y t p + ε t
The VECM of Equation (1) is
Δ y t = c + Π y t 1 + i = 1 p 1 Γ i Δ y t i + ε t
where
Π = j = 1 p A j     I k   and   Γ i =     j = i + 1 p A j .
According to Engle and Granger (1987), if the variables y t are I (1), the matrix Π has a rank 0 ≤ r < K. If the number of linearly independent cointegrating vectors (r) is 0 < r < K, then the variables cointegrate and a VAR in the first differences is mis-specified. Using Johansen’s test (Johansen 1988), we checked the cointegration between the variables. If the y t variables cointegrate, then the VECM equation can be rewritten as
Δ y t = α β y t 1 + i = 1 p 1 Γ i Δ y t i + ε t
where
β y t 1 = E C T t 1
Here, ECT stands for ‘error correction term’.

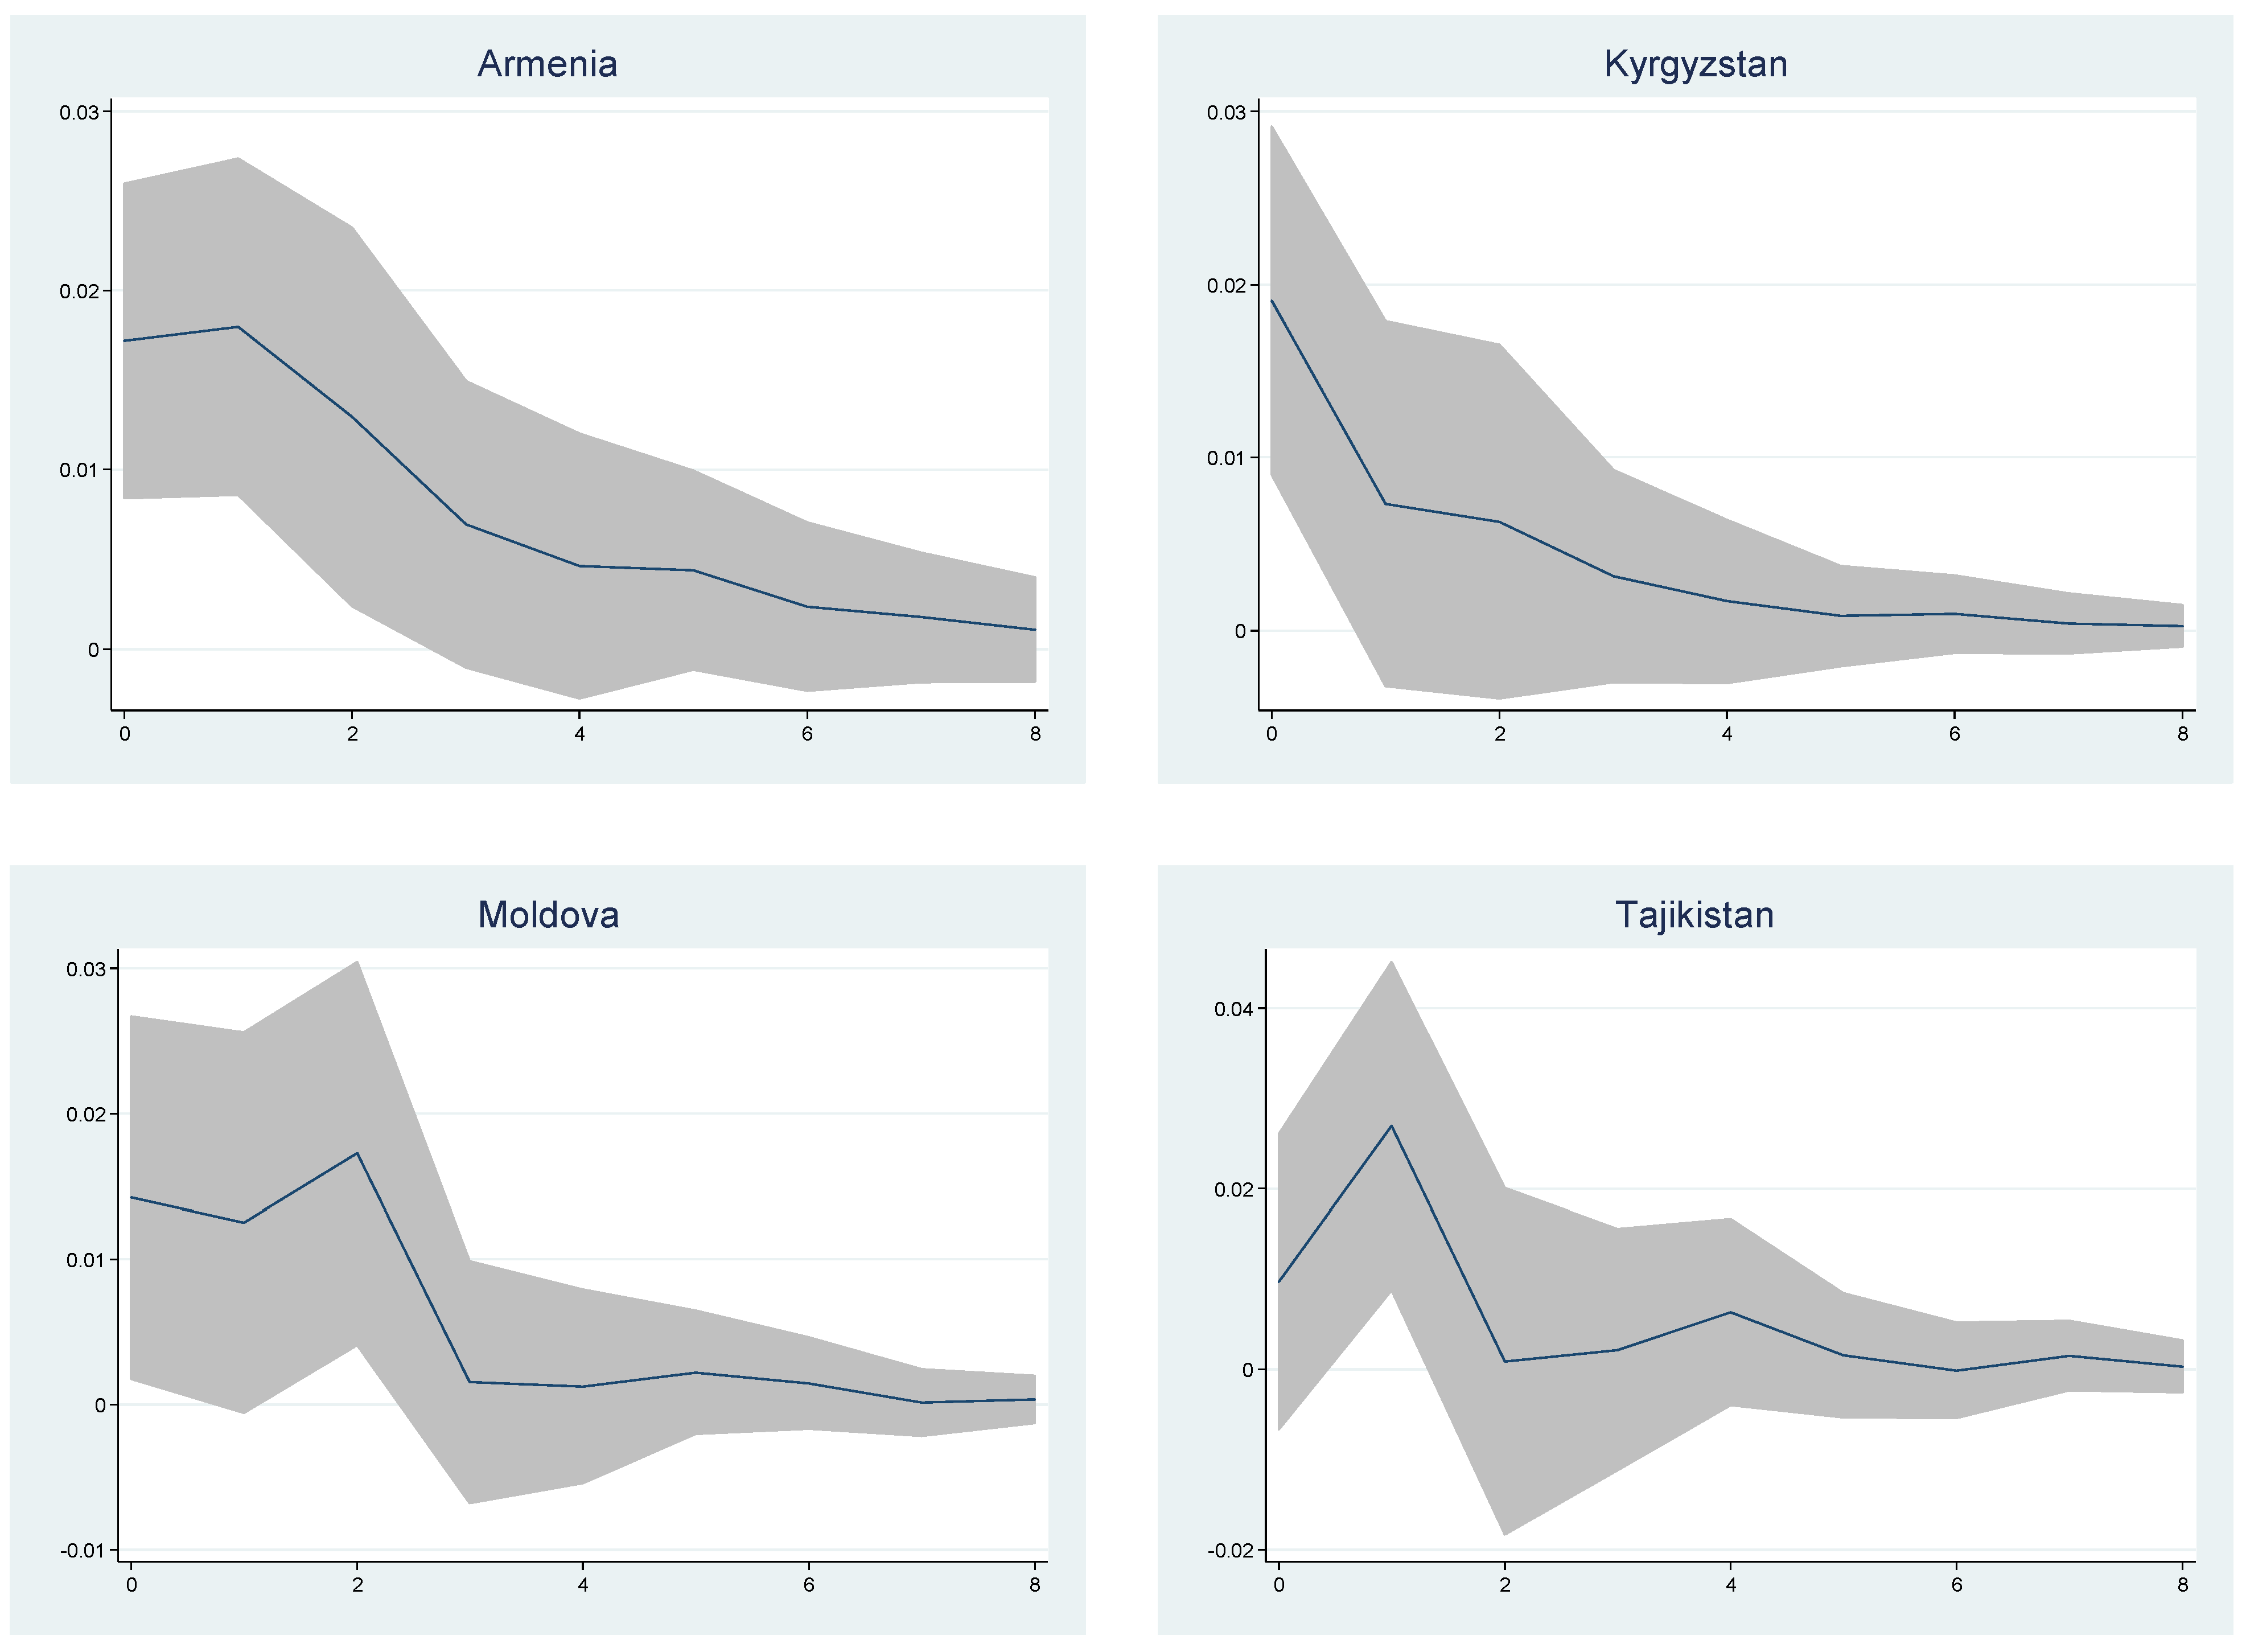
4. Empirical Findings

Table 7 presents the VAR model estimation results for the logarithmic differences of Russian GDP and Russian trade with other CIS countries. The right side of the table includes two exogenous dummy variables for the sanctions imposed on Russia by the US and the EU and the financial crisis of 2008. The number of lags selected by the AIC criterion was one. The number of lags was increased for the estimations with exogenous dummy variables to avoid autocorrelation in the residuals.
The estimation results show a statistically significant positive impact of one and two periods of lagged Russian trade with CIS countries on the current-period GDP of Russia. This impact is statistically significant at the 1% to 5% significance levels. Russia’s GDP and its trade with other CIS countries are negatively affected by sanctions and the financial crisis of 2008. The impact of sanctions and the financial crisis on Russian GDP and Russian trade with other CIS countries is statistically significant at the 1% significance level. The Lagrange-multiplier test results indicate no serial correlation in the residuals. Johansen’s test for cointegration does not reject the null hypothesis of no cointegration between variables.
Substitution of the general sanction dummy by sanction type dummy (economic, financial and corporate) shows the same impact (as the impact from the general sanction dummy) from financial and corporate dummy variables. Only the impact of economic sanctions on Russian GDP was statistically insignificant, whereas the impact on Russian trade with other CIS countries was statistically significant at the 5% significance level. The estimations for the impact of economic sanctions demonstrate autocorrelation in the residuals in the fourth lag and should therefore be considered with caution.
Considering the limited number of observations available and the major economic and trade characteristics of the CIS countries, we estimated the relationship between the GDPs of Russia and other CIS countries separately for each group. Table 8 presents VAR model estimation results for the logarithmic difference of the GDPs of Russia and small economies in the CIS (Armenia, Kyrgyzstan, Moldova and Tajikistan). The number of lags selected by the AIC criterion was two. The estimation results show a statistically significant positive impact of one-period-lagged Russian GDP on the current-period GDPs of Armenia, Moldova and Tajikistan. The impact is statistically significant at the 1% significance level for Armenia and Tajikistan, and at the 5% significance level for Moldova. The Lagrange-multiplier test results indicate no serial correlation in the residuals. Johansen’s test for cointegration does not reject the null hypothesis of no cointegration between the variables.
The responses of the GDPs of Armenia, Kyrgyzstan, Moldova and Tajikistan to a positive shock in the Russian GDP are depicted in Figure 1. The line indicates the orthogonalized impulse response function (IRF), and the shaded area shows the 95% confidence interval. An increase in the orthogonalized shock to Russia’s GDP causes a short series of increases in the GDPs of Armenia, Kyrgyzstan, Moldova and Tajikistan that die out after six periods.
Table 9 presents the VAR model estimation results for the logarithmic difference of the GDPs of Russia and two large economies (Belarus and Ukraine) without significant fuel resources. The number of lags selected by the AIC criterion was one. The estimation results show a statistically significant positive impact of one-period-lagged Russian GDP on the current-period GDP of Ukraine. The impact is statistically significant at the 1% significance level. The Lagrange-multiplier test results indicate no serial correlation in the residuals. Johansen’s test for cointegration does not reject the null hypothesis of no cointegration between the variables.
The responses of the GDPs of Belarus and Ukraine to a positive shock in the Russian GDP are given in Figure 2. An increase in the orthogonalized shock to Russia’s GDP causes increases in the GDPs of both countries that die out after three or four periods.
Table 10 presents the VAR model estimation results for the logarithmic difference of the GDPs of Russia and Azerbaijan (a comparatively large economy with fuels as major exports). The number of lags selected by the AIC criterion was one. The estimation results show a statistically significant positive impact of one-period-lagged Russian GDP on the current-period GDP of Azerbaijan. The impact is statistically significant at the 5% significance level. The Lagrange-multiplier test results indicate no serial correlation in the residuals up to lag 3. As an autocorrelation is present in lag 4, these results should be considered with caution. Johansen’s test for cointegration does not reject the null hypothesis of no cointegration between the variables.
The response of the GDP of Azerbaijan to a positive shock in Russia’s GDP is given in Figure 3. An increase in the orthogonalized shock to Russia’s GDP causes an increase in the GDP of Azerbaijan that dies out after two or three periods.
Table 11 presents the VECM estimation results for the logarithmic difference of the GDPs of Russia and Kazakhstan (a large economy with fuels as major exports). The number of lags selected by the AIC criterion was three. In short-run equations, the adjustment term for Kazakhstan’s GDP (−0.105) is statistically significant at the 5% significance level, suggesting that the previous period’s errors are corrected for within the current period at a convergence speed of 10.5%. In the short run, two-period-lagged Russian GDP has a negative impact (statistically significant at the 10% significance level), while three-period-lagged Russian GDP has a positive impact (statistically significant at the 1% significance level) on Kazakhstan’s GDP. Kazakhstan’s GDP is positioned as the dependent variable in the long-run equation. As the signs of the coefficients are reversed in the long run, the estimation results show a statistically significant positive long-term impact of Russian GDP on the GDP of Kazakhstan. The impact is statistically significant at the 1% significance level. The Lagrange-multiplier test results indicate no serial correlation in the residuals. Johansen’s test for cointegration does not reject the null hypothesis of one cointegration equation between the variables.
The IRF of the VECM model for the case of Kazakhstan is depicted in Figure 4. The figure indicates that an orthogonalized shock to Russia’s GDP has a permanent positive effect on the GDP of Kazakhstan.
Table 12 presents the Granger causality test estimation results after the VAR for the logarithmic difference of seasonally adjusted monthly exchange rates of the CIS countries (per one USD). Azerbaijan was excluded from the estimation because the data for the exchange rate of its currency were fixed for a significant number of observations. The number of lags for the VAR model selected by the AIC criterion was four. The estimation results show that the exchange rate of the Russian currency Granger-causes the exchange rates of the currencies of other CIS countries, excluding Tajikistan. The Lagrange-multiplier test results indicate no serial correlation in the residuals derived from the VAR model. Johansen’s test for cointegration does not reject the null hypothesis of no cointegration equation between the variables in the VAR model.
The coefficients of the exchange rates of the ruble as an endogenous variable in the VAR model show a positive and statistically significant (at the 1% significance level) impact of one-period-lagged exchange rate of the ruble on the exchange rate of the CIS countries, excluding Tajikistan. The impact of the three-period-lagged exchange rate is positive and statistically significant at the 5% significance level for Ukraine. The impact of the four-period-lagged exchange rate is negative and statistically significant at the 5% significance level for Belarus, positive and statistically significant at the 5% significance level for Kyrgyzstan, and positive and statistically significant at the 10% significance level for Tajikistan (Table 13).
The exchange rates of all CIS countries are affected by the exchange rate of the Russian ruble within one to five quarters, mostly depreciating as the ruble depreciates. Furthermore, the existence of both positive and negative signs of the coefficients indicates uncertainty in the foreign exchange markets of the CIS countries, which is caused by changes in the exchange rate of the ruble (Table 13).
The incorporation of dummy variables for sanctions as an exogenous variable in the VAR model shows a significant impact of economic sanctions, financial sanctions and corporate sanctions on the exchange rate of the ruble. The impact of economic sanctions and financial sanctions is positive and statically significant at the 1% to 5% significance levels, while the impact of corporate sanctions is negative and statistically significant at the 1% significance level (Table 14).

5. Discussion

The statistically significant negative impact of sanctions on Russia’s GDP demonstrated in our estimations confirms the findings of the IMF (2015), Shirov et al. (2015), Kholodilin and Netsunajev (2016), and Pestova and Mamonov (2019). Although our estimations include longer periods (while the mentioned research covers the impact of sanctions imposed only in 2014–2015), they are based on appropriate econometric models for the data (unlike the IMF (2015) and Shirov et al. (2015)) and use sanctions data instead of a proxy (unlike Pestova and Mamonov (2019)).
While previous research has demonstrated that sanctions have depreciated the ruble (Kholodilin and Netšunajev 2019; Sultonov 2020) and affected the conditional volatility of the exchange rate of the ruble (Dreger et al. 2015), our findings reveal that the impact of sanctions on the exchange rate of the ruble could be different based on the type of sanction and even statistically insignificant if different types of sanctions are pooled together.
Attempts to research the indirect impact of sanctions imposed on Russia on the economies of CIS countries are constrained by the lack of appropriate data. Bayramov et al. (2020) addressed the lack of data by disaggregating annual data into quarterly data and pooling the limited number of observations into panel data, which makes the estimation results less robust. The robustness of the estimations of Bayramov et al. (2020) is not proven by pre- or post-estimation tests. By preparing proper time series and selecting a suitable econometric model with the required pre- and post-estimations, we made our estimation result trustworthy.
Our research findings fill the research gap on the indirect impact of sanctions imposed on Russia on the economies of CIS countries.

6. Concluding Remarks and Policy Implications

In this paper, we described the major social and economic characteristics of the CIS countries and examined the impact of sanctions on the Russian economy, Russian trade with other CIS countries, and the exchange rate of the Russian ruble. We assessed the interconnectedness between the GDPs and foreign exchange markets of Russia and other CIS countries. A comparison of the data showed higher growth rates for the CIS countries in the 2000s, which could be explained by the high price of fuels in the international energy markets. The lower growth rates in the 2010s could be explained by the impact of the 2008–2009 financial crisis, the decrease in the price of fuels, and the situation in Ukraine.
Despite the increase in the share of trade with other countries in the world, the CIS countries remain dependent on trade with Russia. Moreover, remittances and FDI flows from Russia still constitute a significant share of flows to the majority of CIS countries. This dependency could be explained by the long-run historical, political, economic and cultural relationship between the CIS countries and their social and economic similarities.
The CIS countries have remained authoritarian regimes with a high level of corruption and poor political and economic freedom, which could be attributable to the legacy of socialism.
The estimation findings demonstrate that sanctions negatively affect the Russian economy and its trade with other CIS countries and increase volatility in the Russian foreign exchange market. Moreover, we found that the impact of Russian GDP on the GDPs of other CIS countries is significant and positive, and volatility in the CIS foreign exchange markets is associated with changes in the Russian foreign exchange market. The empirical findings clearly demonstrate a firm interconnectedness between the CIS countries and Russia as well as the dependency of the economies and foreign exchange markets of CIS countries on the Russian economy and foreign exchange market. This strong interconnectedness with and dependence on the Russian economy may cause the negative effect of sanctions on the Russian economy to spill over to the economies of other CIS countries within six quarters (according to IRF). The arrangement of seasonally adjusted data, use of appropriate pre- and post-estimation tests and selection of the models based on the characteristics of the data for each country made the estimation results robust.
Political instability, the introduction of sanctions and exchange rate fluctuations increase the economic risk, that is, the likelihood that deteriorated macroeconomic and financial conditions may negatively affect economic performance and financial management in the region. Considering the changing international political and economic conditions–in particular the rising number of sanctions on Russia–the CIS countries should further diversify their international relations and take measures to decrease their economic, trade and financial dependence on the Russian economy. Improvements in the political, social, economic and business conditions of CIS countries should be regarded as preconditions for the diversification of their international political and economic relations and for their further integration with the global economy.
The research scope is limited to the impact of the sanctions imposed on Russia in the period between 2000Q2 and 2019Q4 on a limited number of macroeconomic variables. Analysis of the impact of the sanctions in the following years and the incorporation of other important macroeconomic fundamentals in estimations are considered future research tasks.

Funding

This research is supported by a grant-in-aid from the Japan Society for the Promotion of Science (JSPS, Grant-in-Aid for Scientific Research (C), Number 21K01350).

Data Availability Statement

Data available on request from the author.

Conflicts of Interest

The author declares no conflict of interest.

References

  1. Akaike, Hirotugu. 1974. A new look at the statistical model identification. IEEE Transactions on Automatic Control 19: 716–23. [Google Scholar] [CrossRef]
  2. Bayramov, Vugar, Nabi Rustamli, and Gulnara Abbas. 2020. Collateral damage: The Western sanctions on Russia and the evaluation of implications for Russia’s post-communist neighbourhood. International Economics 162: 92–109. [Google Scholar] [CrossRef]
  3. Campbell, M. Kurt, and Rush Doshi. 2020. The Coronavirus Could Reshape Global Order: China Is Maneuvering for International Leadership as the United States Falters. Foreign Affairs. March 18. Available online: https://www.foreignaffairs.com/articles/china/2020-03-18/coronavirus-could-reshape-global-order (accessed on 20 August 2022).
  4. Central Bank of Russia. 2022. External Sector Statistics. The Central Bank of the Russian Federation. Available online: https://www.cbr.ru/eng/statistics/macro_itm/svs/ (accessed on 8 June 2022).
  5. CIS STAT. 2022. CIS in Figures. Interstate Statistical Committee of the Commonwealth of Independent States. Available online: http://www.cisstat.com/eng (accessed on 6 June 2022).
  6. Devonshire-Ellis, Chris. 2022. China, Russia Stand Firm in ‘New, Fair, Multipolar World Order’. China Briefing. March 30. Available online: https://www.china-briefing.com/news/china-russia-stand-firm-in-new-fair-multipolar-world-order/ (accessed on 4 June 2022).
  7. Dreger, Christian, Jarko Fidrmuc, Konstantin Kholodilin, and Dirk Ulbricht. 2015. The Ruble between the Hammer and the Anvil: Oil Prices and Economic Sanctions. Discussion Papers 1488. Berlin: DIW Berlin, German Institute for Economic Research. [Google Scholar]
  8. Engle, R. Robert, and John C. W. Granger. 1987. Co-integration and error correction: Representation, estimation, and testing. Econometrica 55: 251–76. [Google Scholar] [CrossRef]
  9. Freedom House. 2022. Countries and Territories: Global Freedom Scores, Internet Freedom Scores, Democracy Scores. Freedom House. Available online: https://freedomhouse.org/countries/freedom-world/scores (accessed on 2 June 2022).
  10. Granger, C. W. John. 1969. Investigating causal relations by econometric models and cross-spectral methods. Econometrica 37: 424–38. [Google Scholar] [CrossRef]
  11. Haas, Richard. 2020. The World: A Brief Introduction. New York: Penguin Press. [Google Scholar]
  12. Heritage Foundation. 2022. 2022 Index of ECONOMIC Freedom. The Heritage Foundation. Available online: https://www.heritage.org/index/heatmap (accessed on 4 June 2022).
  13. IMF. 2015. Russian Federation, 2015 Article IV Consultation. IMF Country Report, No. 15/211. Washington, DC: International Monetary Fund. [Google Scholar]
  14. Johansen, Soren. 1988. Statistical analysis of cointegration vectors. Journal of Economic Dynamics and Control 12: 231–54. [Google Scholar] [CrossRef]
  15. Johansen, Soren. 1995. Likelihood-Based Inference in Cointegrated Vector Autoregressive Models. Oxford: Oxford University Press. [Google Scholar]
  16. Kholodilin, Konstantin, and Aleksei Netsunajev. 2016. Crimea and Punishment: The Impact of Sanctions on Russian and European Economies. Discussion Papers of DIW Berlin 1569. Berlin: DIW Berlin, German Institute for Economic Research. [Google Scholar]
  17. Kholodilin, Konstantin, and Aleksei Netšunajev. 2019. Crimea and punishment: The impact of sanctions on Russian economy and economies of the Euro Area. Baltic Journal of Economics 19: 39–51. [Google Scholar] [CrossRef]
  18. NBT. 2022. Analytical Table of Export and Import of Goods by Country. National Bank of Tajikistan. Available online: https://nbt.tj/en/statistics/tavozuni-pardokhti-jt/savdoi-molu-khikhmatrasonihoi-berunai-jumhurii-tojikiston/jadvali_tahlili_sodirot.php (accessed on 16 June 2022).
  19. Pestova, Anna, and Mikhail Mamonov. 2019. Should We Care? The Economic Effects of Financial Sanctions on the Russian Economy. BOFIT Discussion Paper No. 13/2019. Available online: https://www.econstor.eu/handle/10419/212921 (accessed on 14 August 2022). [CrossRef]
  20. Radio Free Europe/Radio Liberty. 2018. A timeline of all Russia-related sanctions: A detailed look at all the sanctions levied against Russia, and its countersanctions, since 2014. Paper presented at Ivan Gutterman, Wojtek Grojec, and RFE/RL’s Current Time, Prague, Czechia, September 19. [Google Scholar]
  21. Shirov, Alexanderovich Alexander, Alexey Anatolievich Yantovskii, and Vadim Viktorovich Potapenko. 2015. Evaluation of the potential effect of sanctions on the economic development of Russia and the European Union. Studies on Russian Economic Development 26: 317–26. [Google Scholar] [CrossRef]
  22. Sultonov, Mirzosaid. 2020. The impact of international sanctions on Russian financial markets. Economies 8: 107. [Google Scholar] [CrossRef]
  23. Transparency International. 2021. Corruption Perceptions Index. Transparency International. Available online: https://www.transparency.org/en/cpi/2021 (accessed on 16 August 2022).
  24. Tyll, Ladislav, Karel Pernica, and Markéta Arltová. 2018. The impact of economic sanctions on Russian economy and the RUB/USD exchange rate. Journal of International Studies 11: 21–33. [Google Scholar] [CrossRef]
  25. UNDP. 2020. Human Development Report 2020: The Next Frontier, Human Development and the Anthropocene. New York: The United Nations Development Programme. [Google Scholar]
  26. White House. 2021. Renewing America’s Advantages: Interim National Security Strategic Guidance. President Joseph R. Biden, Jr, The White House, Washington, March 2021. Available online: https://www.whitehouse.gov/wp-content/uploads/2021/03/NSC-1v2.pdf (accessed on 15 August 2022).
  27. WITS. 2022. Detailed Country Analysis. World Integrated Trade Solutions, UNSD COMTRADE. Available online: http://wits.worldbank.org/visualization/detailed-country-analysis-visualization.html (accessed on 5 August 2022).
  28. World Bank. 2022a. Population, Total. World Development Indicators, The World Bank Group. Available online: https://data.worldbank.org/indicator/SP.POP.TOTL (accessed on 10 August 2022).
  29. World Bank. 2022b. GDP (Current US$). World Development Indicators, The World Bank Group. Available online: https://data.worldbank.org/indicator/NY.GDP.MKTP.CD (accessed on 10 August 2022).
  30. World Bank. 2022c. GDP per Capita (current US$). World Development Indicators, The World Bank Group. Available online: https://data.worldbank.org/indicator/NY.GDP.PCAP.CD (accessed on 10 August 2022).
  31. World Bank. 2022d. GDP Growth (Annual %). World Development Indicators, The World Bank Group. Available online: https://data.worldbank.org/indicator/NY.GDP.MKTP.KD.ZG (accessed on 12 August 2022).
  32. World Bank. 2022e. Exports of Goods and Services (% of GDP). World Development Indicators, The World Bank Group. Available online: https://data.worldbank.org/indicator/NE.EXP.GNFS.ZS (accessed on 12 August 2022).
  33. World Bank. 2022f. Imports of Goods and Services (% of GDP). World Development Indicators, The World Bank Group. Available online: https://data.worldbank.org/indicator/NE.IMP.GNFS.ZS (accessed on 11 August 2022).
  34. World Bank. 2022g. Personal Remittances, Received (% of GDP). World Development Indicators, The World Bank Group. Available online: https://data.worldbank.org/indicator/BX.TRF.PWKR.DT.GD.ZS (accessed on 13 August 2022).
  35. World Bank. 2022h. Foreign Direct Investment, Net Inflows (% of GDP). World Development Indicators, The World Bank Group. Available online: https://data.worldbank.org/indicator/BX.KLT.DINV.WD.GD.ZS (accessed on 14 August 2022).
Figure 1. Impulse Response Functions (IRFs) of the VAR Model, Small Economies. Note: Response of the GDPs of CIS countries to the Russian GDP.
Jrfm 15 00565 g001
Figure 2. Impulse Response Functions (IRFs) of the VAR Model, Large Economies. Note: Responses of the GDPs of CIS countries to Russia’s GDP.
Jrfm 15 00565 g002
Figure 3. Impulse Response Functions (IRFs) of the VAR Model, Azerbaijan. Note: Response of Azerbaijan’s GDP to Russian GDP.
Jrfm 15 00565 g003
Figure 4. Impulse Response Functions (IRFs) of the VECM Model, Kazakhstan. Note: Response of Kazakhstan’s GDP to the Russian GDP.
Jrfm 15 00565 g004
Table 1. Major Economic and Social Indicators.
CountryPopulation, Million People, 2020GDP, Billion USD, 2020GDP per Capita, USD, 2020Human Development Index, 2019
Armenia3.012.64266.020.776, High
Azerbaijan10.142.74229.910.756, High
Belarus9.461.56555.430.823, Very high
Kazakhstan18.8171.19121.640.825, Very high
Kyrgyzstan6.67.81182.520.697, Medium
Moldova2.611.94525.760.750, High
Russia144.11488.310,161.980.824, Very high
Tajikistan9.58.1852.830.668, Medium
Ukraine44.1156.63751.740.779, High
CIS total248.11960.6
CIS as world share3.22.3
CIS average 4960.870.766, High
High-income countries average 43,282.42
Middle-income countries average 5237.02
Upper-middle-income countries average 9166.46
Lower-middle-income countries average 2285.71
Low-income countries average 703.73
World average 10,936.06
Table 2. Interconnectedness of CIS Countries with the Russian Economy.
CountryExports to Russia, % of Total Exports, Average for 2011–2019Imports from Russia, % of Total Imports, Average for 2011–2019Remittance Inflow as % of GDP (Remittance from Russia % of Total Remittances), Average of 2011–2020FDI Net Inflow % GDP (FDI Net Inflow from Russia, Percent of Total) Average of 2011–2020
Armenia21.727.214.8 (70.6)2.8 (25.8)
Azerbaijan3.716.22.6 (76.0)5.8 (0.5)
Belarus40.655.41.8 (26.1)2.9 (46.7)
Kazakhstan8.737.50.2 (>90.0)4.7 (6.3)
Kyrgyzstan12.529.929.7 (86.7)5.4 (17.0)
Moldova17.113.719.2 (40.2)2.7 (-2.7)
Tajikistan5.728.833.2 (>90.0)3.0 (3.8)
Ukraine17.022.98.1 (18.1)2.7 (8.1)
Table 3. Index of Economic Freedom.
CountryOverall ScoreProperty RightsTax BurdenBusiness FreedomMonetary FreedomTrade FreedomInvestment FreedomFinancial Freedom
Armenia65.350.486.964.977.573.675.070.0
Azerbaijan61.653.687.764.674.566.670.060.0
Belarus53.034.593.354.570.275.630.020.0
Kazakhstan64.455.392.764.769.175.450.050.0
Kyrgyzstan55.825.194.856.171.473.260.050.0
Moldova61.355.994.164.272.476.655.050.0
Russia56.136.893.162.568.069.030.030.0
Tajikistan49.729.595.356.967.169.625.030.0
Ukraine54.139.789.161.171.278.635.030.0
CIS average57.942.391.961.171.373.147.843.3
Free (80–100), Mostly free (70.0–79.9), Moderately free (60.0–69.9), Mostly unfree (50.0–59.9), Repressed (0–49.9)
Table 4. Freedom Status and Corruption Perception Index.
CountryFreedom ScoreInternet Freedom ScoreDemocracy ScoreCorruption Perception Index
Armenia55, Partly free71, Free34, Transitional or hybrid regime49
Azerbaijan9, Not free35, Not free1, Consolidated authoritarian regime30
Belarus8, Not free31, Not free3, Consolidated authoritarian regime41
Kazakhstan23, Not free33, Not free6, Consolidated authoritarian regime37
Kyrgyzstan27, Not free53, Partly free13, Consolidated authoritarian regime27
Moldova62, Partly freeNA35, Transitional or hybrid regime36
Russia19, Not free30, Not free5, Consolidated authoritarian regime29
Tajikistan8, Not freeNA2, Consolidated authoritarian regime25
Ukraine61, Partly free62, Partly free39, Transitional or hybrid regime32
Table 5. Logarithmic Difference of Quarterly Data.
VariablesObservationsMeanStandard
Deviation
MinimumMaximumPhillips-Perron Test for Unit Root
Armenia, GDP790.01680.0531−0.23360.1118−6.793 ***
Azerbaijan, GDP790.01540.1191−0.33150.5595−9.133 ***
Belarus, GDP79−0.02280.1240−0.51530.2956−7.466 ***
Kazakhstan, GDP790.01120.0856−0.47300.1418−6.872 ***
Kyrgyzstan, GDP790.01150.0494−0.15470.1842−8.043 ***
Moldova, GDP790.01000.0644−0.22820.3377−10.016 ***
Russia, GDP790.00140.0920−0.40750.1696−6.880 ***
Tajikistan, GDP790.00350.0961−0.32770.4625−13.183 ***
Ukraine, GDP79−0.00560.0976−0.43990.1925−5.369 ***
Russian trade with CIS79−0.00940.1083−0.47250.1680−6.681 ***
Source: Author’s calculations based on raw data from CIS STAT (2022) and the Central Bank of Russia (2022). Note: Seasonally adjusted quarterly data for the 2000Q2–2019Q4 period. *** means the rejection of the null hypothesis of a unit root at the 1% significance level.
Table 6. Logarithmic Difference of Monthly Exchange Rate.
VariablesObservationsMeanStandard DeviationMinimumMaximumPhillips-Perron Test for Unit Root
Armenia250−0.00060.0205−0.09610.1801−14.225 ***
Azerbaijan2500.00250.0265−0.10720.2083−12.047 ***
Belarus2500.01210.0511−0.20950.4243−12.538 ***
Kazakhstan 2500.00430.0573−0.33300.3524−16.394 ***
Kyrgyzstan2500.00220.0410−0.26700.4815−27.364 ***
Moldova2500.00130.0204−0.12790.1201−13.752 ***
Russia2500.00380.0341−0.14000.1680−8.744 ***
Tajikistan2500.00650.1118−1.32631.0986−38.226 ***
Ukraine2500.00630.0562−0.24800.3886−18.801 ***
Source: Author’s calculations based on raw data from CIS STAT (2022). Note: Seasonally adjusted monthly data for the 2001M2–2021M11 period. *** means the rejection of the null hypothesis of a unit root at the 1% significance level.
Table 7. VAR Model Estimation Results for Logarithmic Difference of Russian GDP and Trade with Other CIS Countries.
Independent VariablesDependent Variables
GDPTrade with CISGDPTrade with CIS
Coef.Std. Err.Coef.Std. Err.Coef.Std. Err.Coef.Std. Err.
GDP, L1
−0.16820.1515−0.03220.1840−0.2832 **0.1331−0.00210.1514
GDP, L2 −0.2686 **0.12400.05280.1410
Trade with CIS, L10.4545 ***0.12870.3018 *0.15630.3190 ***0.1162−0.02000.1322
Trade with CIS, L2 0.2530 **0.11110.01510.1264
Sanctions −0.0846 ***0.0199−0.0887 ***0.0227
Financial crisis −0.2823 ***0.0527−0.4413 ***0.0600
Constant0.00600.0095−0.00380.01160.0304 ***0.00880.0218 **0.0100
Lagrange-multiplier test
LagsTest statisticspTest statisticsp
L16.29650.17815.01240.2860
L28.00970.09126.85750.1436
L33.31550.50654.07590.3958
L47.00720.13557.85790.0969
Sample period: 2000Q3–2019Q4
Selection-order criteria: AIC
Johansen tests for cointegration
Maximum rankTrace statistic5% critical value
09.1508 *15.41
11.39763.76
Source: Author’s calculations based on raw data from the Central Bank of Russia (2022), CIS STAT (2022) and Radio Free Europe/Radio Liberty (2018). Note: ***, ** and * for coefficients mean statistically significant at the 1%, 5% and 10% significance levels, respectively. * for Johansen’s tests means the test for cointegration does not reject the null hypothesis of no cointegration between variables.
Table 8. VAR Model Estimation Results for Logarithmic Difference of GDPs, Small Economies.
Independent VariablesDependent Variables
RussiaArmeniaKyrgyzstanMoldovaTajikistan
Coef.Std. Err.Coef.Std. Err.Coef.Std. Err.Coef.Std. Err.Coef.Std. Err.
Russia
L10.07820.12550.2086 ***0.06100.07580.06970.2021 **0.08420.4181 ***0.1092
L2−0.19700.14250.02890.06930.03860.07910.1845 *0.09560.02580.1240
Armenia
L10.3915 *0.21920.05960.10660.2177 *0.12170.13970.1470−0.3635 *0.1907
L2−0.28170.21890.4120 ***0.1064−0.04630.1215−0.01470.14680.4426 **0.1905
Kyrgyzstan
L10.25880.2559−0.02720.1244−0.16090.1420−0.13490.17160.12570.2226
L20.31580.25610.01870.1245−0.02730.14220.04540.1718−0.03300.2228
Moldova
L10.26150.1725−0.00330.08380.05670.0957−0.2597 **0.1157−0.02360.1500
L20.21620.1693−0.1367 *0.08230.06190.09400.00110.11350.08320.1473
Tajikistan
L1−0.07240.1290−0.01200.0627−0.05750.0716−0.07420.0865−0.4342 ***0.1123
L2−0.02760.11960.00450.0582−0.00300.06640.04680.0802−0.08050.1041
Constant−0.01060.01100.0105 **0.00530.00860.00610.01090.00740.00200.0095
Lagrange-multiplier testJohansen tests for cointegration
Lags Test statisticspMaximum rankTrace statistic5% critical value
L133.71340.1142061.2470 *68.52
L235.44920.0804132.833747.21
L321.81520.6464210.862229.68
L429.57180.240733.633715.41
Selection-order criteria: AIC40.89333.76
Sample period: 2000Q4–2019Q4
Source: Author’s calculations based on raw data from CIS STAT (2022). Note: ***, ** and * for coefficients mean statistically significant at the 1%, 5% and 10% significance levels, respectively. * for Johansen’s tests means the test for cointegration does not reject the null hypothesis of no cointegration between variables.
Table 9. VAR Model Estimation Results for Logarithmic Difference of GDP, Large Economies without Significant Fuel Resources.
Independent VariablesDependent Variables
RussiaBelarusUkraine
Coef. Std. Err.Coef. Std. Err.Coef. Std. Err.
Russia, L10.12880.1521−0.04100.20800.3699 ***0.1435
Belarus, L1−0.05070.08810.11160.1204−0.09370.0831
Ukraine, L10.17540.13790.20720.18860.2524 *0.1301
Constant0.00100.0103−0.01780.0141−0.00690.0097
Lagrange-multiplier testJohansen tests for cointegration
LagsTest statisticspMaximum rankTrace statistic5% critical value
L110.52740.3095021.7939 *29.68
L212.73110.175217.571815.41
L33.73030.928320.72043.76
L49.51300.3913
Sample period: 2000Q3–2019Q4
Selection-order criteria: AIC
Source: Author’s calculations based on raw data from CIS STAT (2022). Note: *** and * for coefficients mean statistically significant at the 1% and 10% significance levels, respectively. * for Johansen’s tests means the test for cointegration does not reject the null hypothesis of no cointegration between variables.
Table 10. VAR Model Estimation Results for Logarithmic Difference of GDP, Azerbaijan.
Independent VariablesDependent Variables
RussiaAzerbaijan
Coef. Std. Err.Coef. Std. Err.
Russia, L10.18900.12040.3672 **0.1547
Azerbaijan, L10.06990.0930−0.16230.1196
Constant0.00000.01020.01640.0131
Lagrange-multiplier testJohansen tests for cointegration
LagsTest statisticspMaximum rankTrace statistic5% critical value
L14.36090.3594015.1713 *15.41
L25.04830.282412.48393.76
L31.76470.7789
L415.22700.0043
Sample period: 2000Q3–2019Q4
Selection-order criteria: AIC
Source: Author’s calculations based on raw data from CIS STAT (2022). Note: ** for coefficients means statistically significant at the 5% significance level. * for Johansen’s tests means the test for cointegration does not reject the null hypothesis of no cointegration between variables.
Table 11. VECM Estimation Results for Logarithmic Difference of GDP, Kazakhstan.
Independent VariablesDependent Variables
KazakhstanRussiaECT L1
Coef. Std. Err.Coef. Std. Err.Coef. Std. Err.
ECT, L1−0.1051 **0.04290.02680.0465
Kazakhstan, L10.2167 *0.11240.5816 ***0.12171
Kazakhstan, L2−0.18150.1286−0.3844 ***0.1393
Kazakhstan, L3−0.12250.13200.13420.1429
Russia, L10.17940.12410.21850.1344−1.1666 ***0.2006
Russia, L2−0.2005 *0.1173−0.07720.1271
Russia, L30.3996 ***0.10810.10440.1171
Constant0.0002 **0.00950.0006 *0.01034.4207
Lagrange-multiplier testJohansen tests for cointegration
LagsTest statisticspMaximum rankTrace statistic5% critical value
L17.40920.1158017.16215.41
L27.05680.132912.6537 *3.76
L37.31770.1200
L46.03290.1967
Sample period: 2001Q2–2019Q4
Source: Author’s calculations based on raw data from CIS STAT (2022). Note: ***, ** and * for coefficients mean statistically significant at the 1%, 5% and 10% significance levels, respectively. * for Johansen’s tests means the test for cointegration does not reject the null hypothesis of one cointegration equation between the variables.
Table 12. Granger Causality Tests, Monthly Exchange Rates.
ArmeniaBelarusKazakhstanKyrgyzstanMoldovaRussiaTajikistanUkraine
Armenia 3.24826.99529.6471 **13.3300 ***3.2780101.6500 ***3.0803
Belarus1.7136 3.73230.49622.26022.98871.15595.9091
Kazakhstan4.95430.2997 6.07891.41523.14927.67181.5528
Kyrgyzstan1.13623.72073.5109 4.05691.59825.55900.9200
Moldova3.37121.68671.33162.1955 5.04903.30523.4693
Russia19.0850 ***17.4480 ***13.8910 ***23.5410 ***35.0900 *** 3.988824.8070 ***
Tajikistan1.69394.94040.72800.582010.8840 **3.3138 1.3074
Ukraine7.9161 *2.40800.89831.27343.25951.871913.2210 ***
All51.8000 ***29.101035.94365.2340 ***82.3160 ***25.0710163.3800 ***74.4190 ***
Lagrange-multiplier testJohansen tests for cointegration
LagsTest statisticspMaximum ranksTrace statistic5% critical value
Sample period: 2001M6-2021M11
Selection-order criteria: AIC
Number of lags for VAR: 4
164.87550.44590143.1525 *156.00
265.17310.43571101.6010124.24
359.50870.6358267.258994.15
464.22330.4687342.185468.52
Source: Author’s calculations based on raw data from CIS STAT (2022). Note: ***, ** and * mean statistically significant at the 1%, 5% and 10% significance levels, respectively. Based on the VAR model. * for Johansen’s tests means the test for cointegration does not reject the null hypothesis of no cointegration between variables.
Table 13. Coefficients of Exchange Rates of Ruble as an Independent Variable in the VAR Model.
ArmeniaBelarusKazakhstanKyrgyzstanMoldovaTajikistanUkraine
Russia, L10.187 ***
(0.049)
0.394 ***
(0.126)
0.513 ***
(0.140)
0.334 ***
(0.085)
0.226 ***
(0.046)
−0.055
(0.177)
0.529 ***
(0.129)
Russia, L20.018
(0.059)
−0.184
(0.150)
−0.237
(0.166)
0.070
(0.102)
0.085
(0.055)
0.042
(0.211)
0.088
(0.154)
Russia, L3−0.051
(0.057)
0.029
(0.145)
0.090
(0.160)
−0.129
(0.098)
−0.021
(0.053)
−0.108
(0.203)
0.335 **
(0.149)
Russia, L40.068
(0.054)
−0.311 **
(0.138)
−0.011
(0.153)
0.193 **
(0.093)
0.030
(0.051)
0.372 *
(0.194)
0.082
(0.142)
Source: Author’s calculations based on raw data from the Central Bank of Russia (2022). Note: Standard errors are reported in parentheses. ***, ** and * mean statistically significant at the 1%, 5% and 10% significance levels, respectively.
Table 14. Coefficients of Sanctions as an Independent Exogenous Variable in the VAR Model.
SanctionsExchange Rate of Ruble
All0.004 (0.007)
Economic sanctions0. 031 *** (0.010)
Financial sanctions0.028 ** (0.012)
Corporate sanctions−0.021 *** (0.007)
Source: Author’s calculations based on raw data from the Central Bank of Russia (2022). Note: Standard errors are reported in parentheses. *** and ** mean statistically significant at the 1% and 5% significance levels, respectively.
Publisher’s Note: MDPI stays neutral with regard to jurisdictional claims in published maps and institutional affiliations.

