1. Introduction
The CBOE VIX Index is a short-term measure of real-time risk in the stock market and is viewed as a fear index. The day-to-day movements in the VIX Index indicate how the market’s perceptions fluctuate over time, and it is an important tool for risk management in the capital market. The movements of the VIX Index from day to day are of interest, not only as a good check on the shifting market perceptions of risk, but also for volatility trading, using options strategies, or VIX futures. Some researchers (
Carr 2017;
Onan et al. 2014;
Sarwar 2012) believe the VIX acts as a fear index or a market perception of risk, while others (
Bantwa 2017;
Chandra and Thenmozhi 2015) propose risk handling and portfolio diversification.
The VIX Index was initially created by the Chicago Board of Options Exchange for options written on the S&P 100 Index, and later it was shifted to the S&P 500 Index. Since 2003, the VIX Index is the implied volatility of the options written on the S&P 500 Index. Further details including calculation methodology can be found on its White Paper (
CBOE VIX White Paper 2021). Since the index is based on observed prices, it provides a market-based appraisal of the riskiness of stocks.
Considering such an important revelation, the main motivation behind this study is to examine the role of macroeconomic variables on the risk contribution to the stock market, unlike most of the studies on returns where risk is measured by the VIX Index. Though most of the previous studies based on macroeconomic variables examined correlation tests and applied linear regression and hypothesis testing, this study applied a recently developed machine learning technique called the classification technique on daily and weekly data to study the impact of macroeconomic variables on the VIX Index, because the VIX Index is assumed to be the most important measure of the risk of the U.S. stock market. To examine the importance and significance of feature variables derived from daily and weekly macroeconomic variables, the classification techniques called Light GBM (
Ke et al. 2017), XG Boost (
Chen and Guestrin 2016, August), and logistic regression were applied for predicting the day-to-day and week-to-week upward and downward movements in the VIX Index. Once the optimality of the models was achieved after training and validation, the ranked feature variables were captured, and thereafter the models were asked to predict the VIX target’s labels on the testing dataset, though the prediction is not the prime focus of this study.
The remainder of this document is organized as follows:
Section 2 discusses past research consisting of macroeconomic variables affecting the stock market,
Section 3 lays out the research design and the methodology used,
Section 4 displays the findings and their interpretation, and, lastly,
Section 5 is the conclusion, with implications and future scope.
2. Literature Review
Using the VAR (vector autoregressive) and the EGARCH (exponential general autoregressive conditional heteroskedastic) models,
Rizwan and Khan (
2007) inspected the importance of domestic and global macroeconomic determinants on the stock returns volatility and found that domestic macroeconomic factors have different levels of significance in describing the association between volatility in the stock market and stock returns. However, the two global factors, the 6-month LIBOR rate, and the MSCI World Index describe the stock returns.
Prasad and Seetharaman (
2021) highlighted the importance of machine learning techniques on the trading of financial securities, while
Zhong and Enke (
2017), by incorporating 60 financial and economic variables that were processed through a thorough data mining process, built classification models, ANNs (artificial neural networks) and logistic regression, to foretell the daily trend of the S&P 500 Index. Additionally,
Milosevic (
2016) applied various machine learning classification algorithms by considering annual fundamental indicators as features taken from the Bloomberg terminal to evaluate the future price of equity over the long horizon. The author assumed that if the stock price increases by 10%, it is considered “Good”, otherwise it is “Bad”. “Good” and “Bad” are taken as the target variables.
Using EGARCH and TGARCH,
Olweny and Omondi (
2011) studied the influence of macroeconomic factors: the inflation rate, forex rate, and variation in the interest rate on the monthly volatility of stock returns at the Nairobi Securities Exchange, and noted that, though the inflation rate, forex rate, and interest rate impacted the stock volatility, the forex rate had a greater impact on the stock return volatility.
To study the ripple effect of U.S. economic uncertainty on volatility in the stock market,
Su et al. (
2019) applied a bivariate GARCH-MIDAS model and computed its volatility impact on six industrialized and three advanced market countries. Considering U.S. uncertainty indices, FU (financial uncertainty), EPU (economic policy uncertainty), and NVIX (news-implied uncertainty), the results depict that FU does not properly forecast the long-term volatility in the stock market, EPU is positively connected with the volatility in the stock markets of the industrialized countries, and NVIX is more important in the prediction of market volatility; that is, a greater NVIX leads to lesser volatility. Additionally,
Hasan et al. (
2020) investigated the degree to which the ripple effect of uncertainty among global stock markets is powered by the cross-country association of EPU and applied data on stock market uncertainty and EPU indices for 13 nations for the period from January 2011 to December 2018. The study found that the EPU association between any two nations remarkably powers the association of uncertainty between their stock markets. Such linkage stands for short- and long-term uncertainty.
Le et al. (
2019) studied the macroeconomic factors affecting the volatility of stock indices to overcome shortcomings in the Vietnam stock market. Results indicate that, for a small period, the stock market index is causally associated with the M2 money supply, interest rates, and oil prices. However, for a longer duration, the stock market index of Vietnam is affected by the money supply, interest rate, oil price, SJC gold price, and exchange rate. Moreover, based on a survey-based study using a correlation study and econometric modeling,
Markowski and Keller (
2020) analyzed the influence of 80 macroeconomic variables on the level of the VIX Index and found that the unemployment rate is the most impactful.
Cheng (
1995) discovered that there was a positive association between the security returns and the unemployment rate.
Park (
1997) discovered that growth in the employment rate had the greatest negative impacts on stock returns.
Shaikh and Padhi (
2013) examined the influence of macroeconomic announcements from RBI, a central bank in India, on the India VIX Index and revealed from the study that during the pre-announcement period, the India VIX Index increased significantly, while once the announcement was made, the India VIX Index returned to the original level, as the uncertainty was resolved. Furthermore, the result also revealed that the India VIX Index decreased sharply after the planned GDP announcement news but increased sharply on the declaration of monthly inflation rates. The combined impact of the macroeconomic announcements of the employment rate, GDP, monetary policy, and industrial output was discovered to be statistically significant with a negative association.
Vähämaa and Äijö (
2011) investigated the impact of Fed’s monetary policy on the VIX Index and found that the Fed’s policy decisions significantly affected stock market uncertainty. Particularly, following the FOMC meeting decreased the implied volatility. However, the target rate surprises were positively related to market uncertainty.
Grieb et al. (
2016) investigated the influence of macroeconomic announcements on the VIX Index and found that a change in the VIX Index was negative on the day when the FOMC and the employment rate were publicly announced, and that during the PPI and CPI announcement day, a decreasing level in the VIX Index was partly explained by seasonal patterns.
Gustavsen and Oterhals (
2018) built a model based on empirical observation and explored the impact of macroeconomic variables on the VIX Index. This model did not try to explain the effect of different variables on actual volatility. However, the model tried to explain what affected the expectations of the market’s volatility over the forthcoming 30 days by measuring the impact of the release of new information about macroeconomic conditions. The results depicted that the market regarded the actions taken by the Federal Open Market Committee (FOMC), as such a decision is very important for its outlook on the economy.
Using quantile regression,
Xiao et al. (
2019) examined the influence of variations in the implied volatility index of the oil market (OVX) on the variations in the implied volatility index of the Chinese stock market (VXFXI). The authors found that the effects of the variations in the OVX Index on the variations in the VXFXI Index were positive and were more pronounced in the falling markets.
Bai and Cai (
2021) applied machine learning techniques on 278 economic and financial variables to foretell the daily movement on CBOE VIX Index and found that adaptive boosting achieved an average rate of 57%. Additionally, it was observed that the predictability was mostly contributed by the technical indicators of some constituent stocks of the S&P 500 and the weekly U.S. jobless report. Utilizing the augmented HAR (heterogeneous autoregressive) method with exogenous covariates,
Han et al. (
2015) investigated the predictability of financial and macroeconomic factors for estimating the VKOSPI Index, an implied volatility index inherited from the options written on the KOSPI 200, and found that few domestic macroeconomic factors could describe the variation in the VKOSPI Index, and that the returns on S&P 500 Index and the VIX Index played an essential role in forecasting the level of the VKOSPI Index, though the return on the domestic stock market did not forecast the VKOSPI Index.
In view of the concern for the traders during early 2018′s spike in the VIX Index,
Canorea (
2018) studied the relationship between the VIX Index and industrial metals, and suggested that the CRB commodities index and the VIX Index shared a long-term negative correlation which further improves over the longer horizon. The author further said that base metals and commodities have a positive correlation and concluded that industrial metals and the VIX Index have a negative relationship. To examine the influence of macroeconomic factors on the stock returns of the listed banks in the Nairobi Securities Exchange (NSE),
Okech and Mugambi (
2016) conducted a statistical analysis and applied OLS (ordinary least squares) regression to determine the regression coefficients. It was estimated from the statistical analysis that the inflation rate, forex rate, and interest rate have a noticeable influence on banking stock returns. However, the GDP had no significant impact at a 5% level of significance.
Jain and Biswal (
2016) examined the dynamic linkage among the USD/INR forex rate, crude oil prices, gold prices, and the Indian stock market. The result indicated that a decline in crude oil prices and gold prices caused the deterioration in the INR and a decrease in the value of the stock index.
Hibbert et al. (
2011) discovered a roughly opposite association between changes in the bond yield spread and the stock return of the issuing firm.
Loncarski and Szilagyi (
2012) stated a negative association between changes in credit spreads and changes in both the equity index returns and the risk-free short-term interest rate.
During the review of the related past studies, it has been discovered that some studies applied regression techniques while others used different statistical techniques such as hypothesis testing to discover the statistical relationship between the macroeconomic variables and the stock market. Additionally, some other studies (
Chaudhary et al. 2020a,
2020b) focused on analyzing volatility using traditional statistical methods and by incorporating financial variables. This confirms that most authors previously examined the linear association on mostly weekly and monthly macroeconomic data in a regression setting in which the target variable is the number. However, it has been seen that previous studies did not look up classification problems for studying the influence of macroeconomic variables on stock market volatility. The classification technique, a machine learning approach, gives the score of the applied feature variables while modeling and predicting the target labels. The score of the feature variables indicates their sensitivity to the target. Therefore, it is important to construct classification problems for analyzing the impact of daily and weekly macroeconomic variables on the stock market volatility index.
4. Results
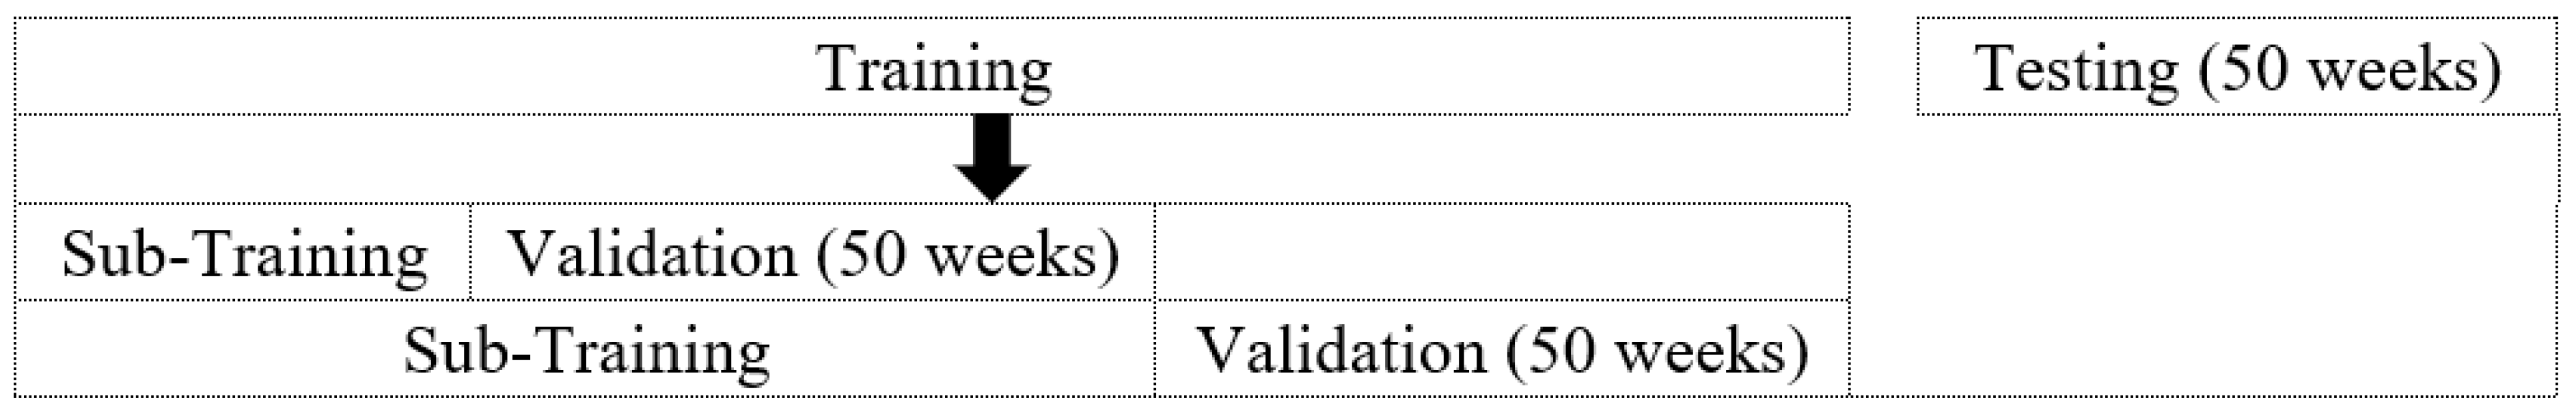
To study the significance of the macroeconomic variables on predicting the day-to-day and week-to-week movements of the CBOE VIX Index, the selected set of features are fed into the models and, after performing the hyperparameters tuning as mentioned in the steps in
Section 3, the feature coefficients from the logistic regression and the feature scores from the Light GBM and XG Boost are captured and, subsequently, the models are tested to predict the categorical labels of the VIX Index for the testing dataset. During validation, it was observed that the Light GBM ranked twenty-nine daily features and twenty-three weekly features, as depicted in
Table A1, and put the scores of the remaining redundant features to zero. The ranked features according to their importance are depicted in
Figure 3 for the daily and
Figure 4 for the weekly Light GBM classifier. Moreover, XG Boost ranked twenty-two daily features and three weekly features, as displayed in
Table A2, and set the scores of the remaining redundant features to zero. The ranked features according to their importance are depicted in
Figure 5 for the daily and
Figure 6 for the weekly XG Boost classifier. Lastly, logistic regression returned the coefficient of all one hundred and twenty daily features and thirty-three weekly features, as depicted in
Table A3 and
Table A4, respectively. The ranked features according to their significance are stated in
Figure 7 for the daily and
Figure 8 for the weekly logistic regression.
Table A1,
Table A2,
Table A3 and
Table A4 are displayed in
Appendix A. The elimination and ranking of the features depend mainly on the regularization parameters, which are required to be set during the hyperparameters tuning for achieving optimal performance in the validation dataset. For the testing dataset, the accuracy scores, the MCC, and the
p-value are displayed in
Table 7, and the classification reports are displayed in
Table 8 for the daily and
Table 9 for the weekly models. The data displayed in
Table 7 are rounded to four decimal places and the data displayed in
Table 8 and
Table 9 are rounded to two decimal places.
4.1. Results from Daily Light GBM
It achieved a mean accuracy score of 61% in the validation and 62% in the testing dataset. An MCC of 0.2793 indicates that the model is not random and has predictive power. The
p-value of 0.0049 indicates that the MCC is statistically significant at a 2.5% significance level. It is observed from
Figure 3 and
Table A1 that the one-day prior change in the value of the VIX Index ranked the highest and, subsequently, the two-day, three-day, and four-day prior change in the value of the VIX ranked third, fifth, and sixth, respectively. Hence, it can be stated that the VIX’s closing value is the most important for predicting the next day’s labels in sequence. Additionally, the gold price, the Economic Policy Uncertainty Index: Infectious Disease Tracker (EPU IDT Index), the U.S. Dollar Index, the CBOE Crude Oil ETF Volatility Index, and the TED Spread are ranked significantly in the top ten. It is further observed that the economic policy uncertainty indices ranked multiple times in the ranked features. Among the fixed income securities, the TED Spread, Credit Spread, option-adjusted spread, the 10-year yield on inflation-indexed, and the Fed Rate do make an impact, but the TED Spread and the Credit Spread are more significant.
Hence, it can be stated that economic policy uncertainty indices, gold price, USD Index, CBOE Crude Oil ETF Volatility Index, and TED Spread are termed as strong predictors. Most of them are ranked under the top ten features and repeated under a ranked set of twenty-nine features. Additionally, 10-year yield on inflation-indexed instruments, option-adjusted spread, interest rate, and the spread on bonds do also make an impact on predicting the daily movement of the VIX Index. The redundant features are the 1M T-Yield Curve Rate, 4w T-Bill Rate, 5Y Breakeven Inflation Rate, 5Y Yield Inflation Indexed, AAA Corp OAS, BBB Corp OAS, BBB Corp Yield, Corp Yield, Silver Price, and Yield Spread.
4.2. Results from Daily XG Boost
It achieved a mean accuracy score of 55.62% in the validation and 62% in the testing datasets. The MCC of 0.2793 indicates that the model is not random and has predictive power. The
p-value of 0.0049 signifies that the MCC is statistically significant. It can be revealed from
Figure 5 and
Table A2 that the changes in the VIX Index are significant for predicting its movements. The changes in the Economic Policy Uncertainty Index: Infectious Disease Tracker (EPU IDT Index) are the most important feature. Other important features are the Gold Price, USD Index, EPU Policy and Equity Index, Silver Price, Fed Rate, and the TED Spread. The AAA Corp OAS, 5Y Breakeven Inflation Rate, OVX, and the 4w T-Bill Rate are also important, but they are repeated once in the top twenty-two important features. Redundant features are the 10Y Breakeven Inflation Rate, 10Y Yield Inflation Indexed, 1M T-Yield Curve Rate, 5Y Yield Inflation Indexed, AAA Corp Yield, BBB Corp OAS, BBB Corp Yield, Corp OAS, Corp Yield, Credit Spread, and Yield Spread.
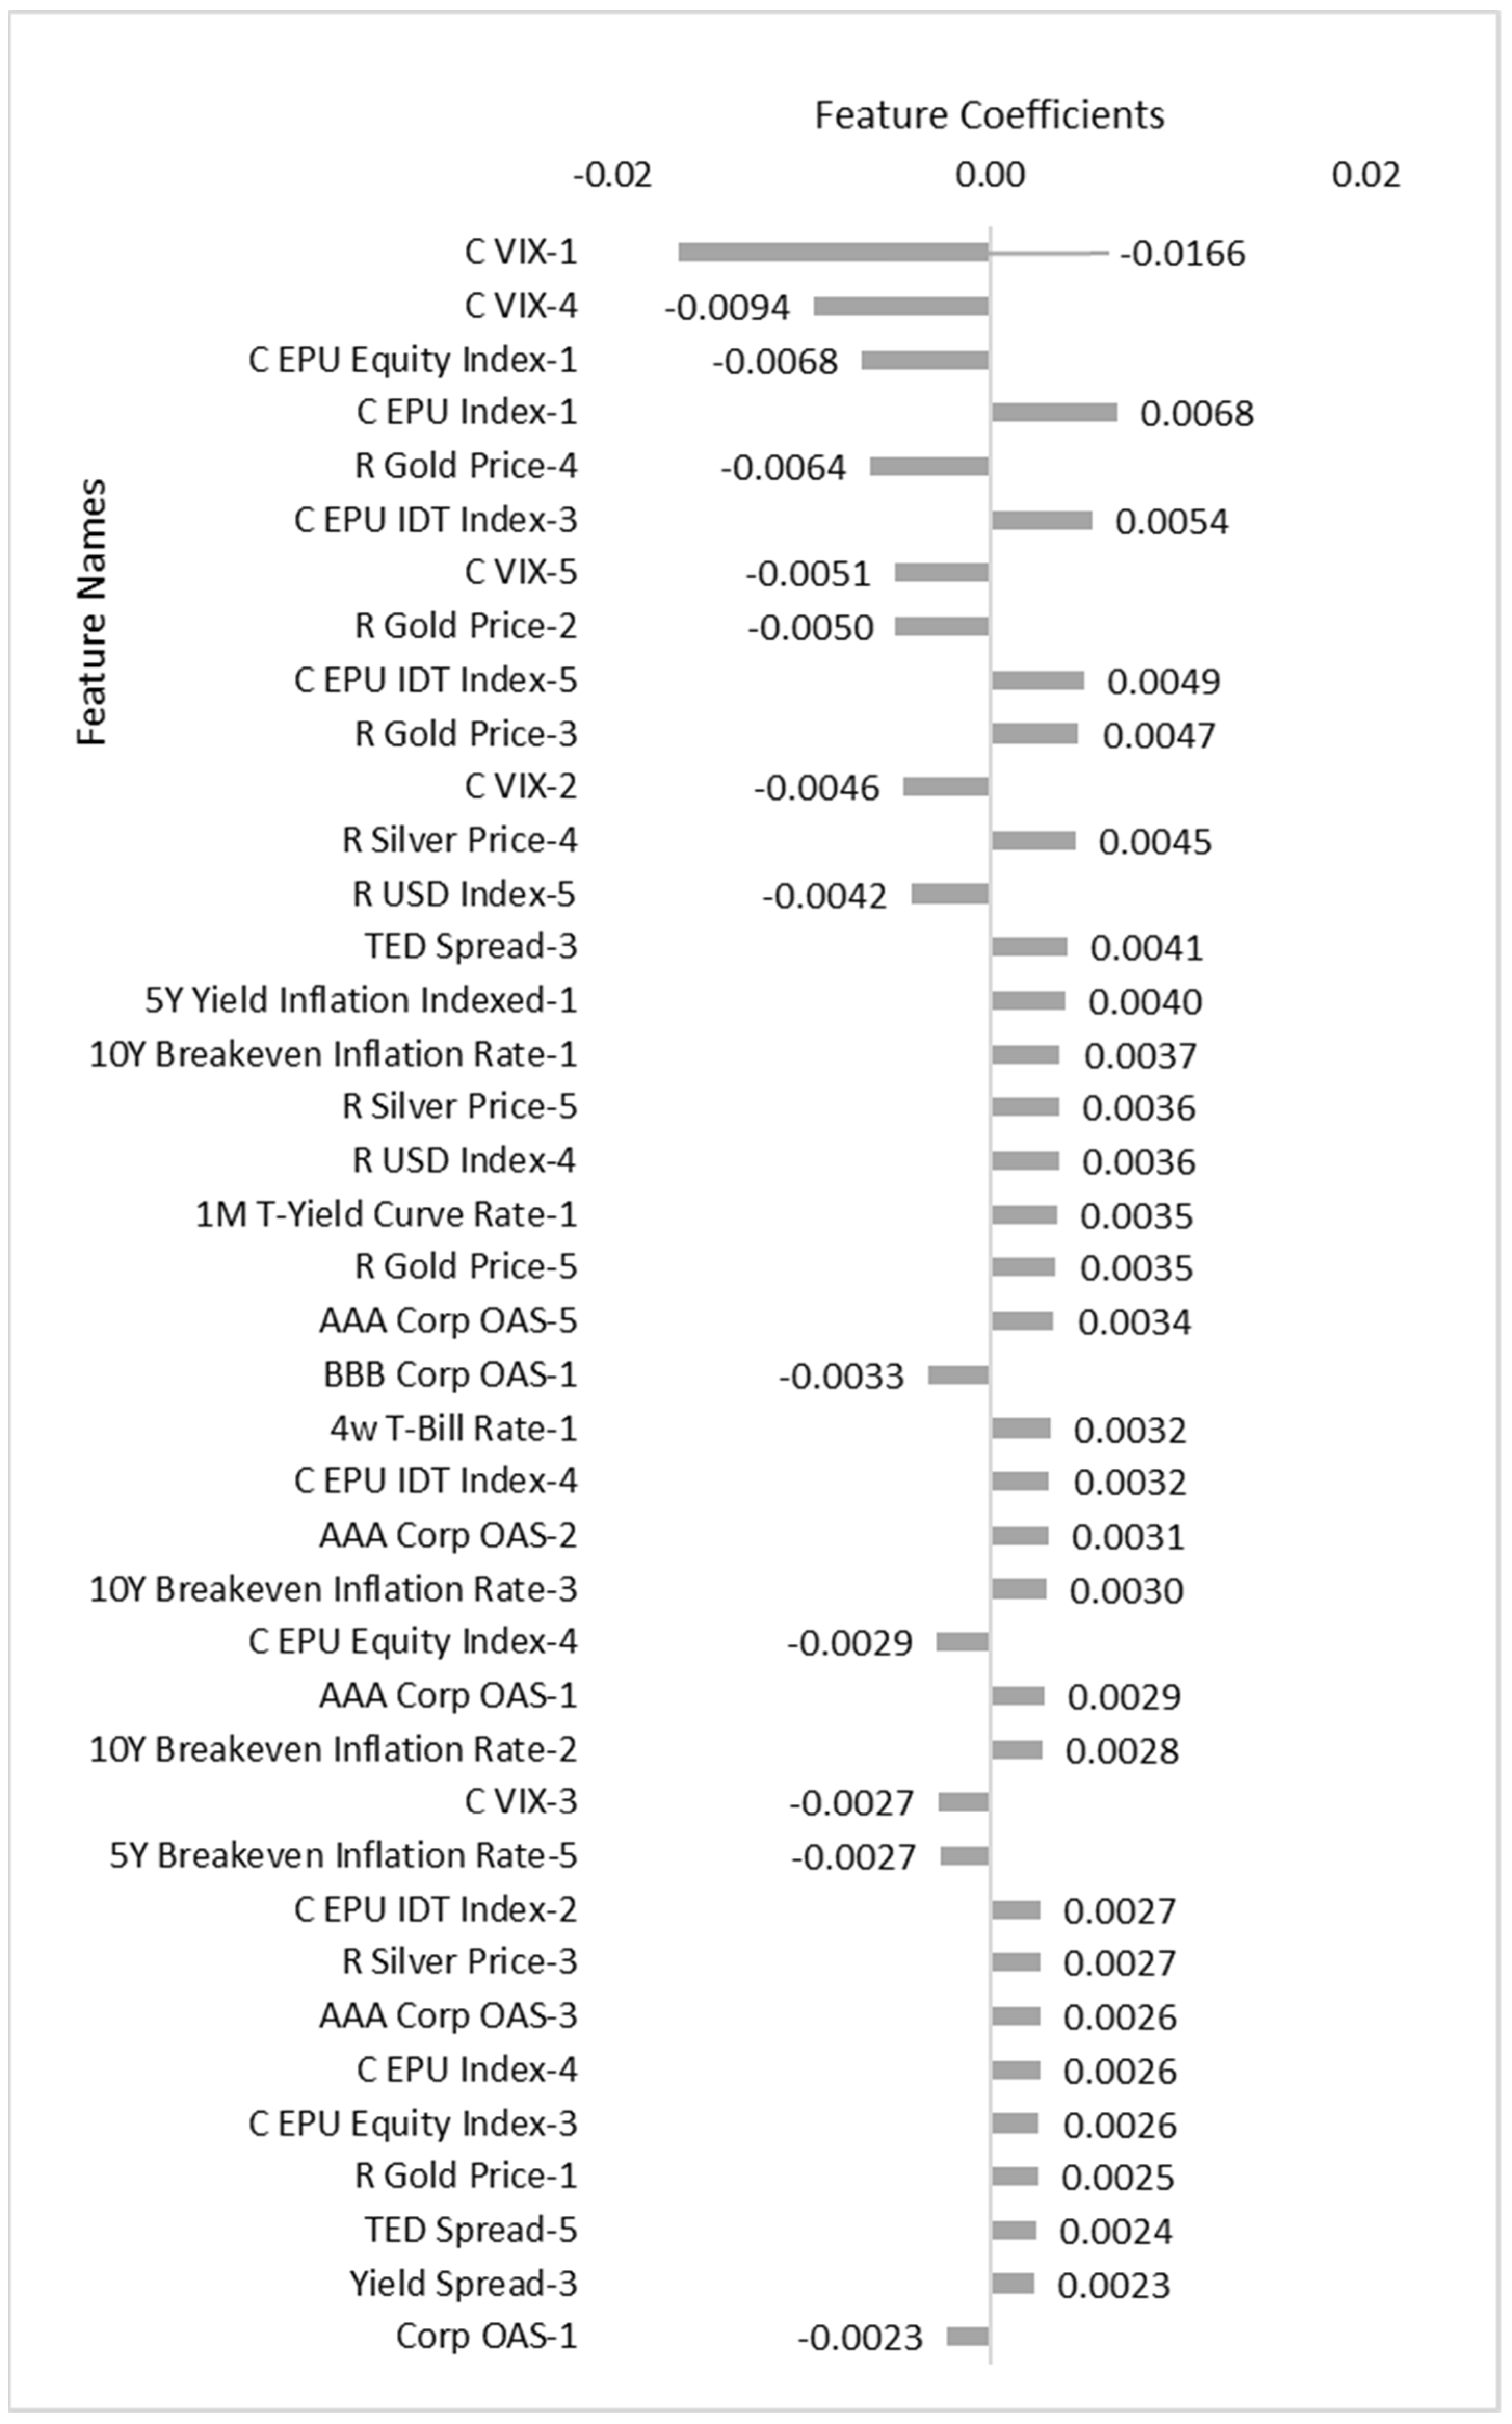
4.3. Results from Daily Logistic Regression
It achieved a mean accuracy score of 47% in the validation and 52% in the testing datasets. The MCC of 0.0162 and
p-value of 0.8733 indicate that it is a weak classifier, and the result is not significant. Fortunately, it is only used here for anticipating the directional relationship. It is found from
Figure 7 and
Table A3 that the changes in the VIX Index are the most important, and their negative coefficients could roughly indicate a reversal tendency. Economic policy uncertainty indices, Gold Price, U.S. Dollar Index, Silver Price, and TED Spread are strong predictors because their coefficients are comparatively highly sensitive. Since all the coefficients of the Economic Policy Uncertainty Index: Infectious Disease Tracker (EPU IDT Index) are positive, it indicates a positive association with the VIX Index, while Economic Policy Uncertainty Equity Market Index is roughly negatively associated with the VIX Index. However, the Economic Policy Uncertainty Index is somewhat positively related. Additionally, the yield on inflation-indexed instruments, the 1-month Treasury yield curve rate, the 4-week Treasury bill rate, and the other spreads do also make an impact on the VIX Index, but fixed income securities are relatively low predictors. The all-positive coefficients of the credit spread indicate that the VIX Index increases when the credit spread increases. Inflation is positively related to the VIX Index, while the CBOE Crude Oil ETF Volatility Index is negatively associated. Because a higher credit spread and inflation are the negative signals for the economy, they are positively associated with the VIX Index.
Furthermore, the coefficients of 1-day, 2-day, 3-day, 4-day, and 5-day prior returns on the gold price are positive, negative, positive, negative, and positive, respectively. This could indicate that the level of the VIX Index is positively associated with the previous day’s return on the gold price and negatively associated with a day-before-yesterday’s return on the gold price. Hence, it can be loosely speculated that the VIX Index and gold price are concurrently negatively associated.
4.4. Results from Weekly Light GBM
It achieved a mean accuracy score of 62% in the validation and 62% in the testing datasets. The MCC of 0.2522 indicates that the model is not random and has predictive power. The
p-value of 0.0772 indicates that the MCC is not significant at a 2.5% significant level; however, it can be significant at 7.72% or a higher significance level. The weekly model does not do well as compared to the daily model because the VIX Index tried to subside itself during a week’s time. From
Figure 4 and
Table A1, the previous week’s change in the value of the VIX Index is the most significant. The Financial Stress Index is a strong predictor. The Inflation rate, TED Spread, Fed Rate, M2 Money Supply, initial unemployment claims, U.S. Dollar Index, Gold Price, Crude Oil Price, and CBOE Crude Oil ETF Volatility Index, in addition to the spread on fixed income securities, affect the VIX Index significantly but with lesser intensity. The Economic Policy Uncertainty Equity Market Index does qualify in the ranked features, but the Economic Policy Uncertainty: Infectious Disease Tracker (EPU IDT Index) does not because it can be speculated that EPU IDT Index goes up or down and returns to the level in a week’s time. The list of redundant features is the 10Y Yield Inflation Indexed, 1m T-Yield Curve Rate, 30Y Mortgage Rate, 3m T-Bill 2nd Rate, 4w T-Bill 2nd Rate, 4w T-Bill Rate, Bank Prime Loan Rate, C EPU IDT Index, Corp OAS, and R Silver Price.
4.5. Results from Weekly XG Boost
It achieved a mean accuracy score of 57.81% in the validation and 60% in the testing datasets. The MCC of 0.2077 indicates that the model is not random and has some predictive power. However, the p-value of 0.1477 indicates that the MCC is not statistically significant. The performance is even poorer to that of the weekly Light GBM. It gives importance to only three features, the 5Y Breakeven Inflation Rate and the Financial Stress Index in addition to the VIX Index. It sets rest of the features’ scores to zero.
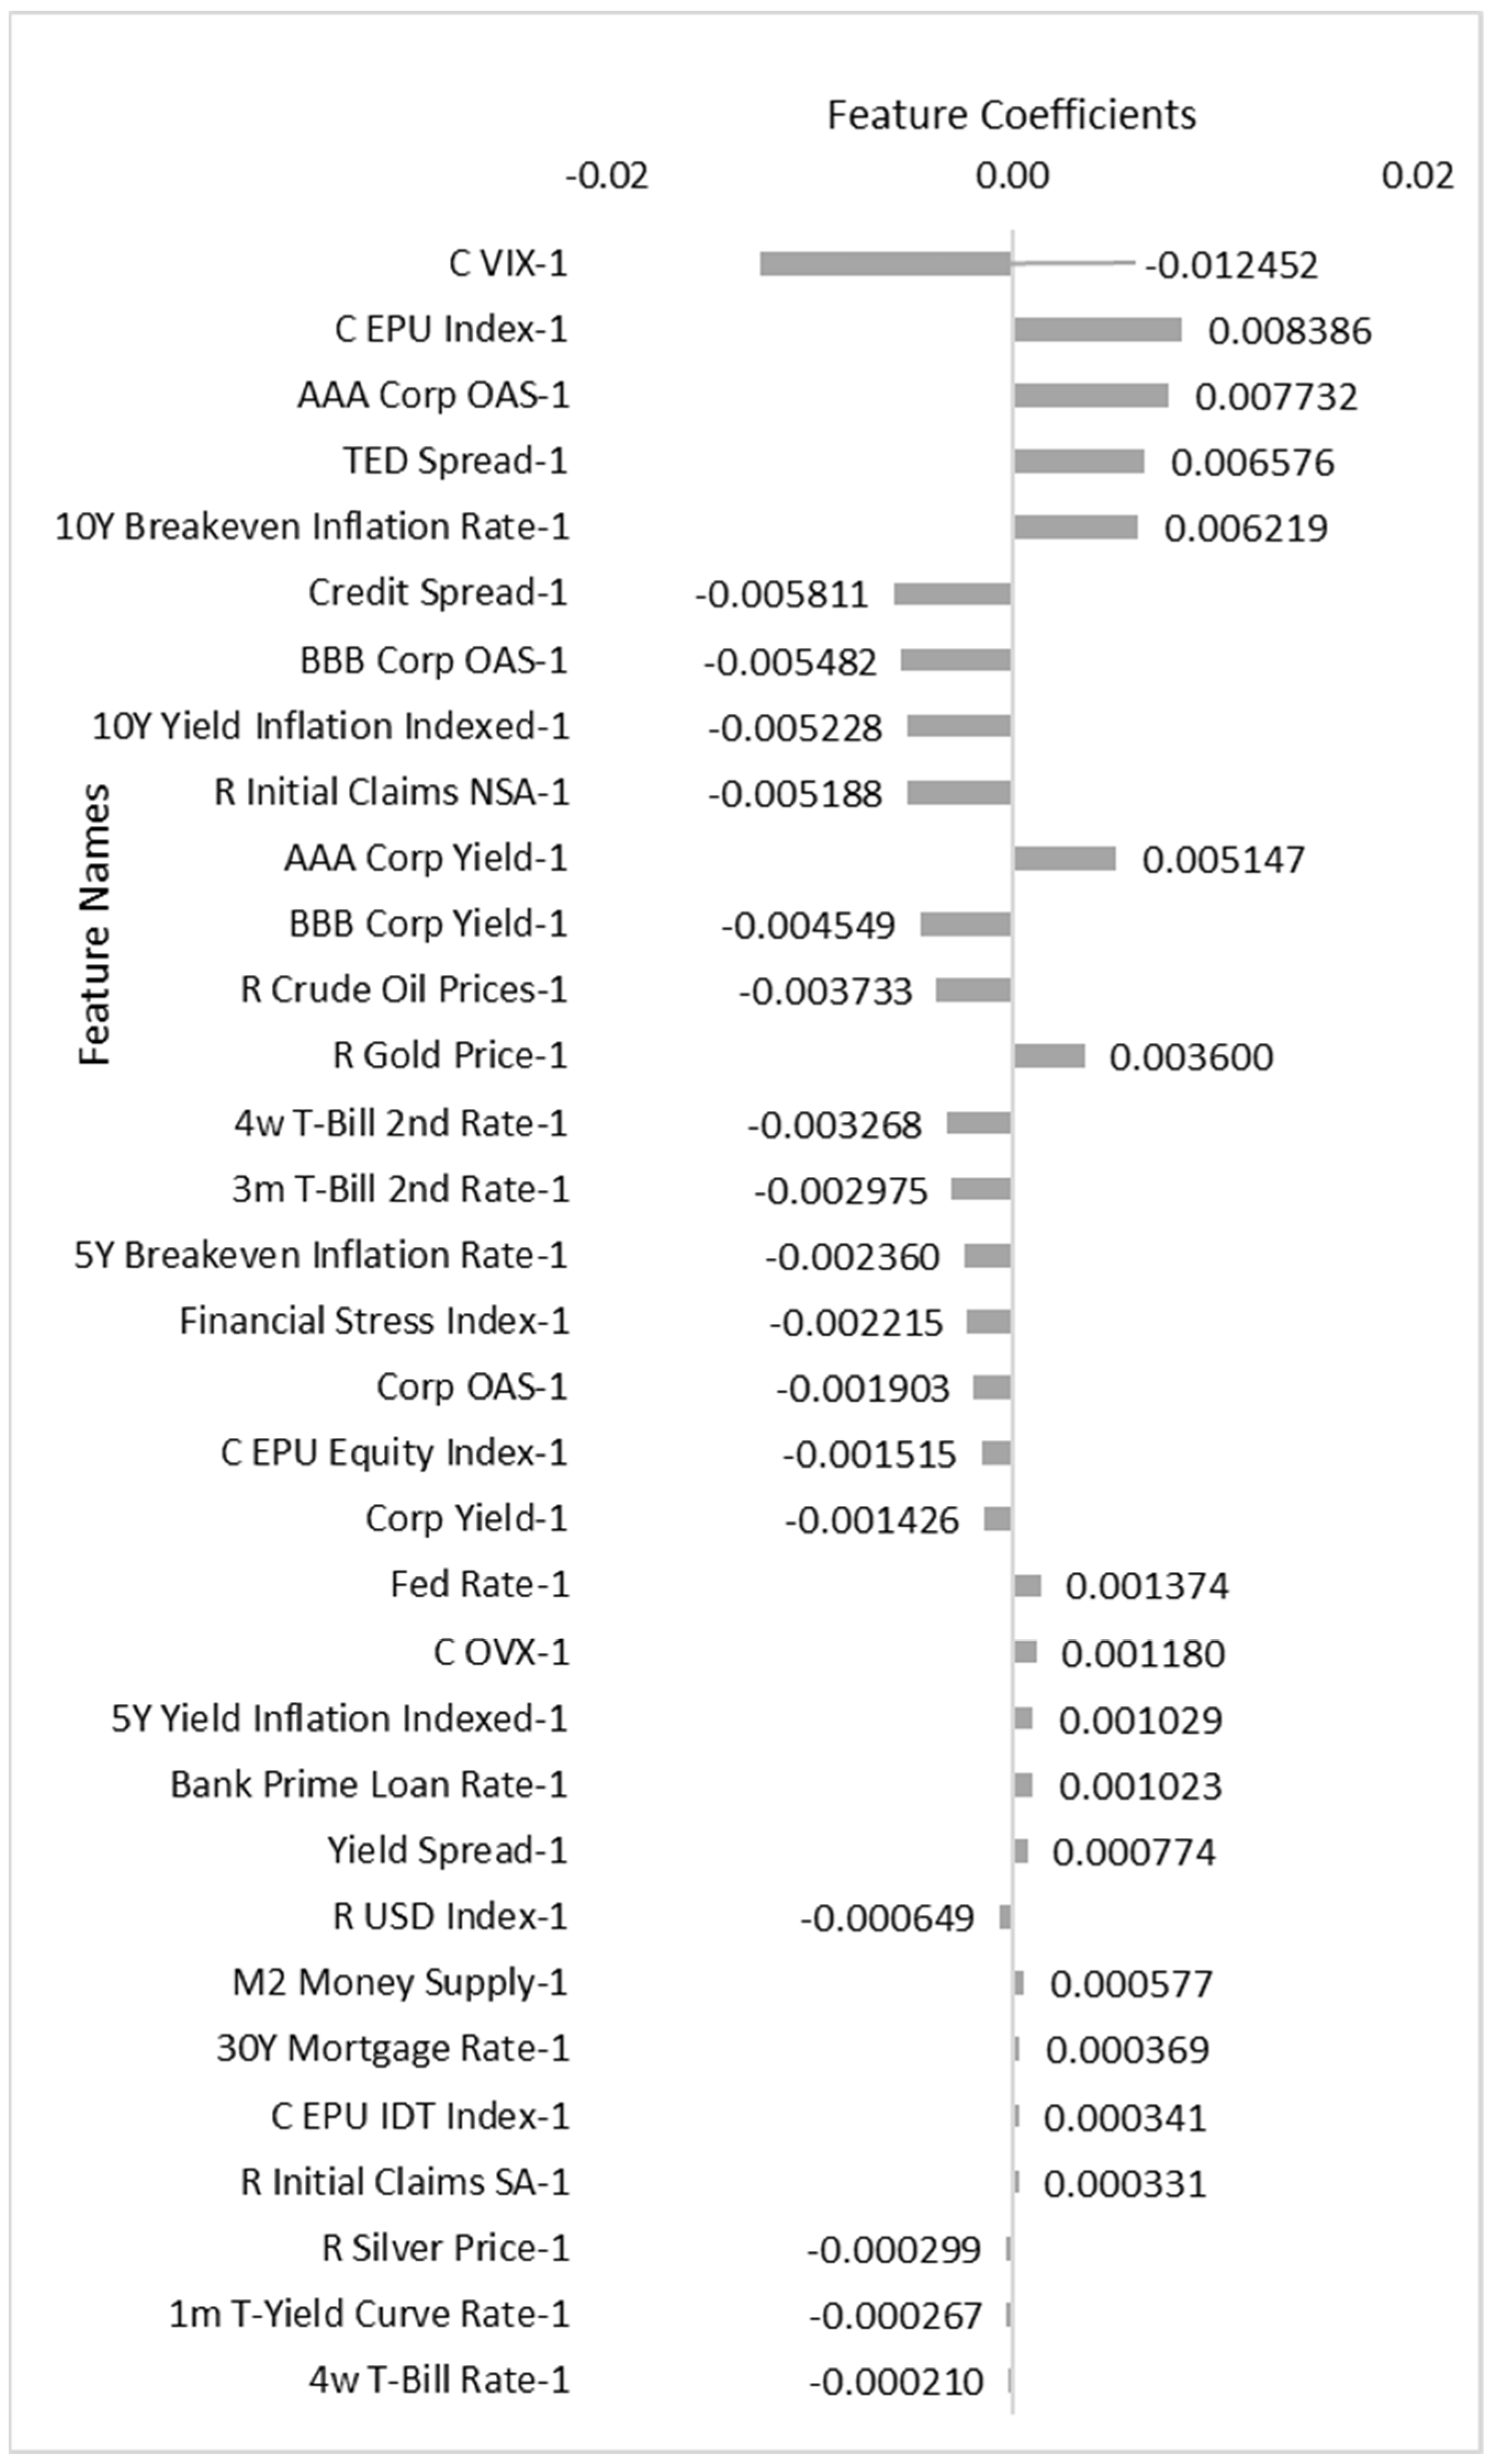
4.6. Results from Weekly Logistic Regression
It achieved a mean accuracy score of 56% in the validation and 44% in the testing datasets. The MCC of −0.0933 indicates that the classifier is useless and the
p-value of 0.5192 further indicates the weaker predictability of the classifier. The previous week’s change in the VIX Index is the most significant, as shown in
Figure 6 and
Table A3. The Economic Policy Uncertainty Equity Market Index, AAA-rated corporate bond option-adjusted spread, TED Spread, and the inflation rate are strong predictors and positively correlated. Surprisingly, the Credit Spread, inflation-indexed bonds, and initial claims (NSA) on unemployment are negatively, but significantly, associated with the VIX Index. Some findings are contradicted with the daily logistic regression model.
Considering the performance of all six models applied in this study, as the Light GBM and XG Boost outperformed the logistic regression, the decision made by the Light GBM and XG Boost supersedes the logistic regression. The performances of the daily Light GBM and XG Boost models are comparable, while the performance of the weekly XG Boost deteriorated compared to the performance of the weekly Light GBM, though both performed poorly. As a weak classifier, logistic regression is applied in this study for the estimation of the directional relationship. It can be inferred from the study that the economic policy uncertainty indices, gold price, USD Index, CBOE Crude Oil ETF Volatility Index, Financial Stress Index, and the yield on inflation-indexed Treasury securities are termed as strong predictors. Moreover, the credit spread and TED spread do make a significant impact on the VIX Index, but the impact of the other fixed-income securities is placed thereafter. The M2 money supply, the initial claims on unemployment, and Fed rate are also strong predictors. The weekly Light GBM has given importance to the yield spread.
Both the Economic Policy Uncertainty Index of Equity Market Volatility: Infectious Disease Tracker (EPU IDT Index) and Economic Policy Uncertainty Daily Policy Index (EPU Index) are positively associated with the level of the VIX Index, and this relationship is in line with the findings of
Su et al. (
2019), but the findings from our research are more comprehensive. However, the Economic Policy Uncertainty Equity Market Index is mostly negatively associated with the level of the VIX Index. Some have given importance to 5Y Yield Inflation Indexed, while some have given importance to 10Y Yield Inflation Indexed.
The features that are weak to redundant are the 1M T-Yield Curve Rate, 5Y Yield Inflation Indexed, 10Y Yield Inflation Indexed, BBB Corp OAS, BBB Corp Yield, Corp Yield, Silver Price, Yield Spread, and 4w T-Bill Rate, though some have conflicting importance.
5. Conclusions
As predicting the day-to-day and week-to-week movements of the VIX Index is interesting, and its association with the macroeconomic variables is highly important, machine learning algorithms, such as logistic regression, XG Boost, and Light GBM, are applied on the set of feature variables derived from the daily and weekly macroeconomic variables and a closing value of the VIX Index, and after performing hyperparameters tuning, the captured feature variables are ranked according to their importance in predicting the daily and weekly movements of the VIX Index. Thereafter, the models are asked to predict the binary labels in the testing datasets. The outcome of the models was depicted and analyzed in detail in
Section 4.
It can be suggested from the results that, with the given set of feature variables, the Light GBM achieved an accuracy score of 62% for both the daily and weekly models, which is higher than that of the logistic regression. The Daily XG Boost model was also accurate. However, when the t-test on the MCC is taken into consideration, the performances of the weekly models based on their p-values deteriorated, though the weekly Light GBM performed slightly better. Hence, the decision made by the daily Light GBM and XG Boost and the weekly Light GBM on the ranking features can be significantly accepted. The economic policy uncertainty indices, gold price, USD Index, and CBOE Crude Oil ETF Volatility Index are termed as strong predictors. The Financial Stress Index, Treasury securities, M2 money supply, initial claims on unemployment, Fed rate, credit spread, and the TED spread are also strong predictors, while various yields on fixed income securities make a little less impact on the VIX Index. The Financial Stress Index and the TED spread are positively related to the VIX Index, while the credit spread and the yield spread have conflicting results in a directional relationship with the VIX Index. The features that are weak to redundant are the 1M T-Yield Curve Rate, yield on inflation-indexed security, BBB Corp OAS, BBB Corp Yield, Corp Yield, Silver Price, Yield Spread, and the 4w T-Bill Rate, though some have conflicting importance levels.
Both the Economic Policy Uncertainty Index of Equity Market Volatility: Infectious Disease Tracker and the Economic Policy Uncertainty Daily Policy Index (EPU Index) are positively associated with the level of the VIX Index, and this relationship is in line with the findings of
Su et al. (
2019). However, the Economic Policy Uncertainty Equity Market Index is mostly negatively associated with the level of the VIX Index.


