Article

A Study of Private Equity Rounds of Entrepreneurial Finance in EU: Are Buyout Funds Uninvited Guests for Startup Ecosystems?

Department of Innovation Science, Tokyo Institute of Technology, Tokyo 105-0023, Japan
*
Author to whom correspondence should be addressed.
J. Risk Financial Manag. 2022, 15(6), 236; https://doi.org/10.3390/jrfm15060236
Submission received: 4 May 2022 / Revised: 21 May 2022 / Accepted: 24 May 2022 / Published: 26 May 2022
(This article belongs to the Section Business and Entrepreneurship)

Abstract

:
This paper studies the difference between startup investments by private equity funds (buyout funds; PE) and venture capital funds (VC). PEs, which have traditionally invested in mature companies, have been increasingly investing in later-stage startups in recent years. Based on Crunchbase’s data on EU startup investments from 2011 to the first half of 2021, we find that: (1) later-stage VC-backed startups and PE-backed startups differ in terms of the industry domain, (2) PE-backed startups tend to have higher revenue when they receive investments, and (3) VC-backed startups are more likely to exit via Initial Public Offering (IPO) and slightly less likely to exit via Mergers and Acquisitions (M&A) than PE-backed startups. These results connect previous studies on VC and PE and deepen our understanding of later-stage startup investment. It also suggests that PE invests differently than VCs and provides new added value to the startup ecosystem. In addition, it adds insights into corporate behavior in new business domain expansion.

1. Introduction

Venture capital (VC) has been studied as a central entity to provide funds to rapidly growing startups (e.g., Da Rin et al. 2013; Cumming and Johan 2017). However, with the recent increase in the amount of funding required by startups and the lengthening of the period until startups exit, the entities that provide funding to startups, especially startups in the scale-up phase called the later stage, have become more diverse (Kupor 2019).
Private equity funds (buyout funds; PE) attract particular attention as a new funding source for startups. PEs mainly invest in mature companies using a method known as a leveraged buyout (LBO), where a company is acquired by a specialized investment firm using a relatively small portion of equity and a relatively large portion of outside debt financing (Kaplan and Strömberg 2009; Robinson and Sensoy 2012). In the 2010s, there was an increase in the rate at which private equity funds invested in later-stage startups, either through the same fund that invests in mature companies or through a separate fund specializing in startup investments. Such startup financing is often recognized as a “private equity round (PE round)”. According to the Crunchbase dataset, which we analyze in this study, the aggregated deal volume of PE rounds in the EU were $3.9 bn, $1.6 bn, and $1.6 bn in 2011, 2012, and 2013, respectively, and $9.5 bn, $4.2 bn, and $8.7 bn in 2019, 2020, and the first half of 2021, respectively. In the first half of 2021, PE round deal volume accounted for 41% of all venture capital startup investments for Series A or onwards ($21 bn), and PE’s startup investments have been widely spread.
Indeed, Pitchbook highlighted the increase of nontraditional investors including PEs, hedge funds, pension funds, sovereign wealth funds, and corporate VCs in the European entrepreneurial finance scene during the past five years in its report in 2021. According to Pitchbook, the pace increased amid the pandemic, as the deal value with nontraditional investor participation topped €14.1 billion in Q1 2021, and tech startup investment became an important strategy for nontraditional investors. (European Venture Report Q1 2021).
As far as we know, there is no research on PE investments in startups. Some previous studies compare the differences between VC and PE as they share the same fund structure and the similar work of fund managers who source, select and invest in private companies. However, they have mostly been studied separately, investing in fast-growing startups and mature companies (Metrick and Yasuda 2011). The objective of this article is to fill the research gap in the intersection of VC and PE in entrepreneurial financing by studying the growing later-stage startup investment by PEs. More specifically, we study the difference between later-stage VC investment and PE investment in startups, as well as the difference between later-stage VC-backed startups and PE-backed startups.
In addition to the above objective, when considering the lifecycle of startup investment, most of the previous research on entrepreneurial finance focused on seed and early-stage finance. There was less research on the later stages, while there is much research on when startups exit, i.e., initial public offerings (IPOs) and mergers and acquisitions (M&As) such as those by Lee and Wahal (2004) and Amor and Kooli (2020). This can be attributed to the fact that there is a great deal of interest in the commercialization of R&D in this research area and in the recent diversification of seed-stage investment methods such as crowdfunding and accelerators.
This study aims to fill a research gap in the later-stage startup financing by studying PE’s startup investment for the first time. At the same time, PE’s startup investment can be regarded as PE’s new business exploration into a new asset class. How does a PE firm, which has been investing in mature companies as its existing business, behave when it moves into the field of startup investment, where there are many VC players? How much of this behavior is influenced by the behavior of existing businesses, and how much is not?
The study of PE’s startup investment is also of great practical significance. From the perspective of traditional players in the startup ecosystem (startups, VCs, etc.), PE is an enigmatic newcomer. Are they uninvited guests to the startup ecosystem? In particular, from the perspective of VCs, who also invest in startups, PEs are likely to be perceived as competitors. Also, from the perspective of startups, it is unclear whether PE’s funding contributes to its development and ecosystem. Our analysis aims to provide such suggestions.
In this study, we compare later-stage VC-backed startups and PE-backed startups. First, in the next section, we review the previous studies on the common elements between PE and VC and the differences in their business types and derive research questions and hypotheses. Next, we discuss the data and analysis methodology used in this study. We use the dataset in the European Union (EU) from 2011 to the first half of 2021. Much of the previous research is based on the US dataset (e.g., Ferrary and Granovetter 2009; Guler and Guillén 2010). This paper studies the EU due to its relatively mature startup ecosystems and various countries (Groh et al. 2010). According to a Crunchbase news report, for the first half of 2021, European startups captured 20 percent of global capital, an increase of approximately 13 to 14 percent since the first half of 2019 (Crunchbase News 2021).

2. Literature Review

Research on private equity (PE) and venture capital (VC) covers two definitions of PE, in the broad sense and the narrow sense (Buchner et al. 2019; Harris et al. 2020). PE in the broad sense refers to private equity, which means entities that invest in private companies, especially in the form of funds. On the other hand, PE in the narrow sense refers to a fund-type entity that invests in mature private companies among PE in the broad sense, including private investment in public equity (PIPEs) referring to investments that invest in public companies and makes them private (Metrick and Yasuda 2010). PE, in the narrow sense, is often referred to as buyout funds, LBO funds, or simply PE (Cumming et al. 2007). VC refers to fund-type entities that invest in long-term, unquoted, risk equity finance in new firms, i.e., fast-growing startups (Bertoni et al. 2013). It may or may not include funds that specialize in the later stages, called growth equity funds. In this study, funds that mainly invest in startups, including growth equity funds, are referred to as VCs, while buyout funds are referred to as PEs. Although PE and VC are adjacent fields, they are often studied separately in academic research due to differences in their investment targets and investment styles (Kaplan and Strömberg 2009; Da Rin et al. 2013; Robinson and Sensoy 2012).
Among the previous literature that studied the differences and intersections between PE and VC, Metrick and Yasuda (2011) studied the commonalities across PE and VC and defined it with the following four common characteristics: (1) it is a financial intermediary that receives funds from investors and invests directly in portfolio companies, (2) it invests only in private companies, (3) it is actively involved in monitoring and supporting portfolio companies, and (4) it maximizes financial returns by exiting invested companies through sale or IPO.
In addition to the above conceptual and theoretical research, there are several empirical and comparative studies on the performance of PE and VC. For example, Harris et al. (2020) report similarities in performance persistence for both PE and VC at the fund level. While finding consistency in the returns of funds originated by the same general partner, i.e., whether good funds are always good and bad funds are always bad, they find that the consistency has diminished since 2000 compared to before 2000. Also, the consistency is slightly higher for VCs than for PEs. This paper also focuses on successful PE and VC firms that have formed non-core sub-funds separate from the main asset class, such as Bain Ventures by Bain Capital and Sequoia Growth by Sequoia Capital. When PE firms form such secondary-style funds, the secondary funds underperform, while this underperformance is not seen in the case of VC funds. Paglia and Harjoto (2014) study the portfolio companies of PE and VC and find that PE and VC funding positively affect the growth of the portfolio company’s sales and employment and that the impact of PE funding on growth is smaller than that of VC funding. At the same time, however, the study found that the effect of PE funding lasts longer than that of VC funding. Buchner et al. (2019) compare PE-sponsored IPOs and VC-sponsored IPOs in the United States and report that VC-sponsored IPOs are significantly underpriced in the short run. On the other hand, in the long run, they find that PE-sponsored IPOs are superior to VC-sponsored IPOs in terms of return on assets and operating margin, suggesting that the improvement in post-IPO operating performance of PE-sponsored companies is fully included in the price at IPO.
Another study investigates differences between PE and VC at the behavioral level like Block et al. (2019). They study the differences between PE and VC at the level of fund managers’ behavior using experimental conjoint analysis. They investigate the investment criteria of 749 fund managers separately for family offices, business angels, VCs, growth equity funds, and PEs. The results show that family office, growth equity fund, and PE fund managers focus more on profitability, while VCs focus on the company’s earnings growth potential, business model, and current investors. The following Table 1 summarizes the previous literature on differences and intersections between PE and VC.
However, there is no research on PE investments and their comparisons with those by VCs in startups. Of course, there are many studies on seed or early-stage startups and VCs, especially on technology seed commercialization and crowdfunding (Zucker et al. 2002; Mollick 2014). On the other hand, there are fewer studies on later stages, and most of them are in stage financing. (Dahiya and Ray 2012), for example, argue that stage financing allows investors to sort out good and bad companies, making investments in a later stage more efficient. Gompers et al. (2020) conducted a detailed study of 681 VCs on pre-investment screening (sourcing, evaluation, and selection of investments), investment structuring, and post-investment monitoring and advice. It finds that especially for later-stage investments, (1) a slightly higher percentage of investors consider valuation to be important when selecting investments, (2) a higher percentage of investors find deal flow to be “self-generated”, and (3) a higher percentage of investors consider business-related factors to be important in determining the success or failure of investments (especially in healthcare).
To summarize, PE and VC both invest in private companies through similar fund structures, but there are few studies on their differences. There is especially room for comparative research between PE and VC on investment preference and outcome. There are some studies on various aspects of the difference, such as fund returns, growth and exit, and the behavioral level of fund managers. The research on the later stage is mainly related to the research on stage finance. Previous research on the differences and intersections between PE and VC, as well as those on later-stage startup investments, were written on the premise that PE and VC are entities that invest in different investment targets. In contrast, this paper is distinct because it discusses the differences and intersections between PE and VC when investing in the same investment target—startups. While Block et al. (2019), who examine the differences in fund manager-level evaluation of the same investment target based on a hypothetical investment case, have the closest perspective to this paper, this paper is different and new in that it deals with PE’s startup investment as a real (and recently growing) event.

3. Materials and Methods

3.1. Hypothesis Development
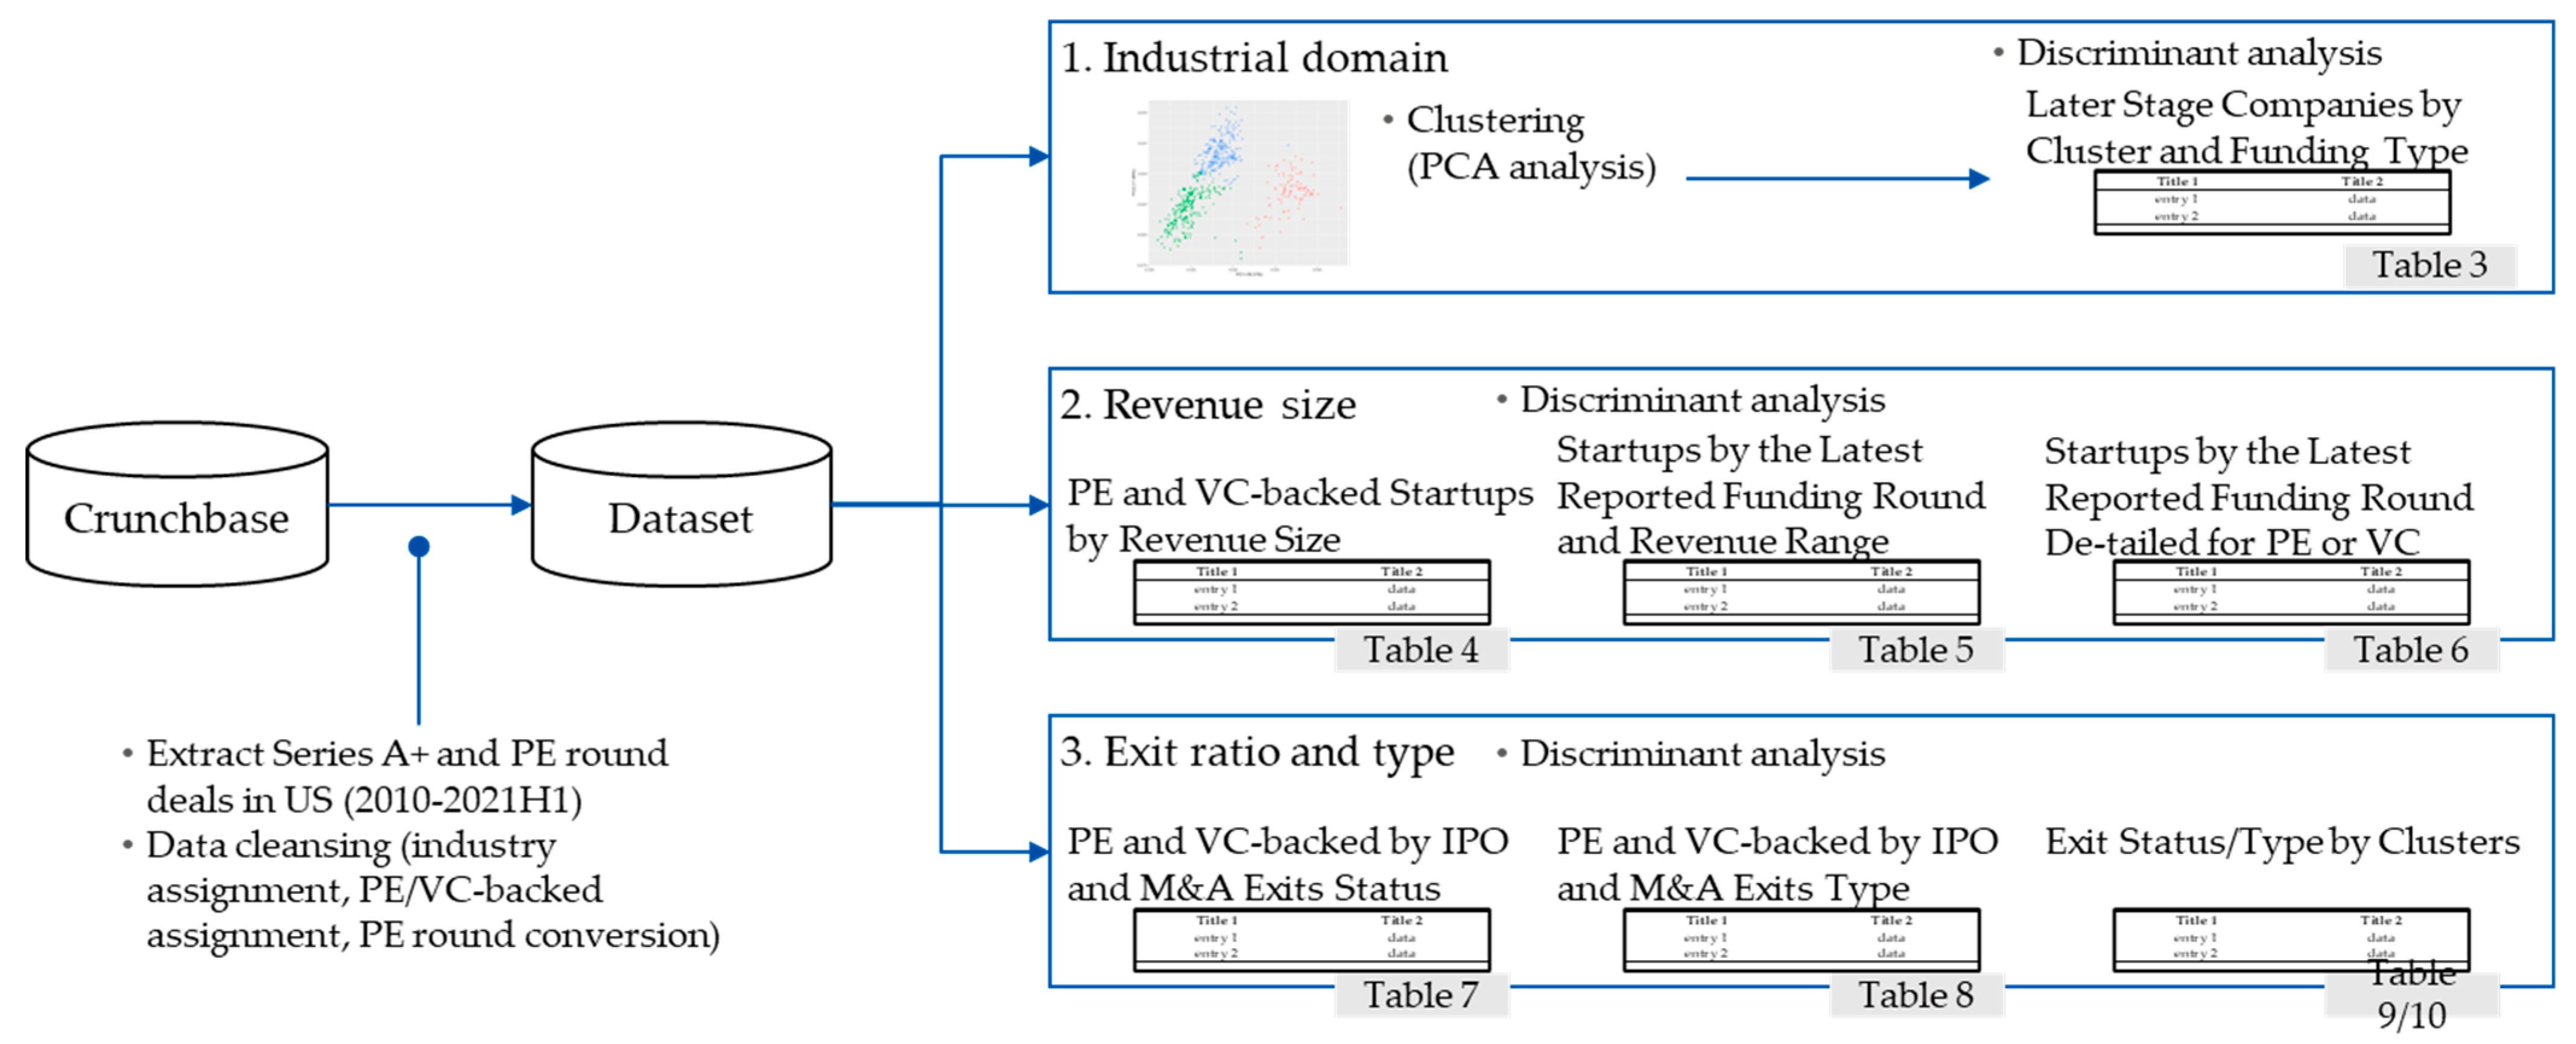
Based on the previous studies described above, we formulate three hypotheses covering the main research streams of those studies, these being PE and VC investments when targeting industry domains, preferences based on revenue range, and their influence on achieving an exit.
First, the investment volume when a PE fund makes a regular buyout investment is larger than the investment amount when a VC makes a startup investment. This is due to the difference in whether the target company is a mature company or a startup and whether the fund acquires a majority or minority stake. For these reasons, when PE invests in startups, it mostly invests in startups with large financing needs. In other words, PE rounds are typically in the later stage of startup financing rounds and are, in most cases, larger than the later-stage VC rounds. The required investment amount for startups will differ among different industrial domains, resulting in different investment preferences between PE and VC.
The question is what industry domain of companies the PE rounds take place. If startups in all industries eventually scale, PE round investment opportunities should arise in the same industries as VC later stages. On the other hand, PE rounds are a new asset class for PE funds and new development in an area with many existing players, namely VCs. PE funds should study what industries VCs invest in, especially in the later stages, and consider investing in startups. If so, will PE funds invest intensively in the “hot” industries where VC funds invest intensively?
If PE “learns” from VC’s investment industries and PE also chooses to invest in “hot” industries from the VC’s point of view, PE’s investment should be concentrated in VC’s “hot” industries. On the other hand, if PE “learns” the industry in which VC invests differently, avoids the “hot” industry in which VC invests, and invests in an industry in which it can find its winning strategy, PE’s investment should be diversified from the “hot” industry of VC. Here, the following hypothesis arises:
Hypothesis 1 (H1).
There is no difference between PE-backed and VC-backed startups in the industry domain. PE-backed startups are similarly concentrated in hot industry domains where VC-backed startups operate.
Following the industry domain in which PE rounds occur, we hypothesize how individual portfolio companies differ. As reviewed above, Block et al. (2019) find that PE fund managers focus more on profitability when selecting the portfolio compared to VC fund managers. However, it should be noted that the comparison here is about the investment criteria of fund managers who make regular buyout investments and VC fund managers who make startup investments. This seems natural given the nature of buyout investments, which invest in mature companies that are already profitable, and startup investments, which invest in growth companies that are in most cases not yet profitable.
The analysis in this paper discusses the characteristics of startup investment by PEs, using revenue as an indicator that significantly affects profitability from the perspective of data availability. If PE unlearns the investment selection criteria for buyout investments and imitates how VCs do it, there should be no difference in revenue. On the other hand, if PE does not unlearn the criteria for selecting investments in buyout investments, and if it continues to follow the way it has been doing business, the targets of PE round investments should be those with high revenue. The following is the hypothesis for the characteristics of startups.
Hypothesis 2 (H2).
PE-backed startups have the same revenue size as VC-backed startups when they are invested.
Finally, in the case of PE rounds or later-stage investments by VCs, exit, i.e., IPO or M&A often follows soon after the successful investment. Most of the previous studies are on startup investment exit research on IPOs, not on M&A. In the real world, the proportion of exits through M&A is increasing. Gao et al. (2013) argue that the reason why exits through IPOs have been decreasing since the 2000s is that exits through M&A are more likely to enjoy the benefits of economies of scale due to the lower profitability of small IPOs. Amor and Kooli (2020) report that M&A exits have the same importance as IPO exits in explaining the incentives for young VCs to grandstand. It also finds that young VCs are willing to accept a lower premium in the case of M&A and bear a higher cost of underpricing in the case of IPO to enhance their reputation and that the presence of a reputable VC has a greater impact on the probability of an exit by IPO than an exit by M&A.
These theories are not directly tied to the exit of a PE startup investment. However, by examining whether there are differences in the way exits are between PE-backed startups and VC-backed startups, we believe that we can make a certain contribution to previous literature comparing IPO and M&A exits. The following is our hypothesis on whether PE rounds achieve the same kind of exit as later-stage investments by VCs.
Hypothesis 3 (H3).
There is no difference between PE-backed startups and VC-backed startups in terms of the success rate of exit and the types of exit (IPO or M&A).
This paper aims to answer the above three research questions regarding investment preference in the industry domain and revenue size and exit by the following methodology.

3.2. Data

Investment and funding information was sourced from Crunchbase, the main information solution offered by TechCrunch for startup funding research. Crunchbase is a platform that collects information about startups’ business overviews, funding, and investors and is used for academic research and practical purposes (Alexy et al. 2012; Cumming et al. 2019).
Crunchbase data consist of publicly declared funding information on private companies acquired through multiple channels, including venture partners who provide portfolio data, machine-learning tools that process funding, acquisitions news which the internal analysts add daily, and a community of contributors who provide data on their own companies. Publicly available data come from US Securities and Exchange Commission (SEC) documents and news articles (according to the statement received on 14 August 2021).
Crunchbase has been found to slightly outperform other similar data providers like PrivCo (Ingham and Kodner 2017) in terms of coverage. Other financial databases like Zephyr and SDC Platinum focus on IPO and merger and acquisition data, while others like Mattermark, PitchBook, and CB Insights focus on aggregated insights or digests on startup information, leaving Crunchbase as the sole and most adequate data source for the scope of this research.
Each funding transaction registered in Crunchbase is assigned to a funding round. The startup investment typically deploys a method called stage financing. Conventionally, each funding round starts with a Seed round, followed by Series A, Series B, Series C, and so on (Tian 2011). There is no uniform definition of startup funding rounds, but in practice, a sense of the business status of the startup and the amount of funding has been formed. For example, in terms of business conditions, Series A means that the startup has a product, not just an idea, and has gained a certain amount of transactions, while Series C means that the startup’s product is well established in a particular market and the startup is looking for further investment to expand its business. We applied Crunchbase’s definition of each Series and PE round, which corresponded to the following (Crunchbase 2021a):
  • Series A and Series B rounds: Funding rounds for early-stage startups. The range is on average between $1 M–$30 M. Aimed at product development.
  • Series C rounds and onwards: Funding rounds for later-stage startups. The range is usually $10 M or more. Aimed for scaling and market penetration.
  • Private Equity rounds (PE rounds): Later-stage funding rounds led by a private equity firm or a hedge fund. The range is typically upwards of $50 M.
Crunchbase assigns each company involved to one or more industry groups. The industry group is a classification of 47 industries, including Agriculture, Artificial Intelligence, Biotechnology, and so on. A list of all industry groups can be found in Appendix A.
For the present study, we extracted two datasets from Crunchbase, one describing funding transactions and the other describing general information about the companies. Since we analyze a form of transaction that has been increasing in recent years, the period is a relatively new data set since 2010, and the region is the entire EU, which is a developed region with mature startup investment and active cross-border investment. Therefore, the funding data covers all reported transactions in the EU from 2010 to the first half of 2021 in Series A onwards, including PE rounds.
Crunchbase data was queried from their web platform as tabular data. The dataset covering funding transactions contains the funding round, the startup name, investors, description of the transaction, and, if available, the amount of investment. The dataset covering company data includes assigned industry groups, current status (IPO, M&A, late state, early state), number of founders, employees, estimated revenue range, etc. Both datasets were merged at the startup level, thus obtaining the history of funding rounds per company. By the date of retrieval on 19 July 2021, 7559 funding transactions covered 4531 European companies.
In testing Hypothesis 3, we focus on companies that have exited through IPO or M&A and those in the later stage of funding. Hence, we first retain the subset of companies that achieved an IPO or M&A. Secondly, we retain a subset of companies in the later stage. Following the adopted definitions of each series, a later stage startup is the one that has achieved a series C or above. Thus, we removed from the dataset companies in the early stage (Series A or B).
We would like to compare exited startups to those that reached a later stage but have difficulty reaching an exit. According to Pitchbook’s Q2 2021 European VC Valuations Report, the median year between VC rounds in a later stage startup is 1.8 years (European VC Valuations Report Q2 2021). Based on that, we exclude from the dataset startups that reported their latest funding series in or after 2019 because there is no information if they are on their way for IPO or M&A in recent years (i.e., due to lack of information, we are unable to label them as successfully exiting or not). A total of 1363 companies fulfilled the above-mentioned conditions and are the target of this study.
Once the data was filtered and companies were classified as exited or not, we proceeded to prepare the remaining variables, including the country of headquarters location, number of founders, number of employees, year of foundation, number of acquisitions, last funding type, number of funding rounds, and industry groups. For these last three variables, additional processing was required.
PE rounds are expected to occur later, although they are observed in the earlier stage. To estimate the occurrence of a PE series with a VC series, we labeled each PE funding round based on the previous VC round. For example, if a startup has received series A, B, C, and D, and the last round is PE, then the PE round is labeled series E. For comparison purposes, we treat that PE round as series E. Because a company can receive multiple series of the same type, we also computed the number of funding rounds received. Table 2 summarizes the data used in this study.

3.3. Method

Figure 1 above is a research method diagram that summarizes the research step of this article step by step.
First, we evaluate the investment preferences of PE and VC in terms of the industries they target. In Crunchbase, each company is classified into one or more industry groups, and these groups can belong to similar fields such as “Software”, “Information Technology”, and “Internet Services”. To have a birds-eye view of the aggregated industry groups, we clustered together companies sharing a similar mix of industry classification. To normalize the presence of a company in an industry group, we weighted their total assignment as 1. In the case of multiple assignments, the weight is divided by the number of industry groups. For example, companies labeled as “Financial Services” and “Professional Services” were assigned a weight of 0.5 to each industry group. We computed cosine similarity on the weighted industries and conducted a principal component analysis, and then the two principal components are used to plot a 2-dimensional representation from where clusters are extracted using k-means. Each cluster is then described by its most frequent industry groups.
With this, we can evaluate the presence of VC and PE-backed startups in each cluster and establish a relationship between the two types of funding and their industry preference at the cluster level, using Chi-square statistics.
Second, we evaluate whether there is an association between PE and VC funding and the reported revenue of the companies they invest in. When the investments happened, the Crunchbase dataset had four revenue ranges (all in USD): less than one million, between 1 and 10 million, between 10 and 100 million, and over 100 million. Revenue range data is unavailable for all the startups in the dataset, so the subset of companies with available information is used instead. We confirmed that this subset has the same PE and VC-backed startup distributions as the main dataset. Similar to the industry group association, the preference of PE and VC for targeting companies in a determined revenue range is evaluated with the Chi-squared statistic.
Finally, we evaluate the association between being backed by PE or VC funding and reaching an exit through IPO or M&A and the exit difference at industry group clusters.

4. Results

4.1. Industrial Domain

Figure 2 shows European startups clustered by their industry group similarity. Axes represent the 2 main components from a PCA analysis on the similarity matrix of industry weights. They represent 19.31% and 11.68% of the variance, respectively, across the 47 original dimensions representing the industry groups. Their purpose is to represent the relative proximity between the companies. Those companies with overlapping industry group assignments appear near to each other. Three clusters are differentiated, and the five most frequent industry groups of each cluster are mentioned in Table 3, along with the number of companies backed by PE or VC funding.
Since we get a p-value less than the significance level of 0.05, we reject the null hypothesis and conclude that the two variables are dependent. The relationship between clusters and funding type is significant. In Cluster 1, PE-backed startups are statistically predominant. In Cluster 2, VC-backed startups are statistically dominant. Cluster 3 has a relatively similar proportion of PE-backed and VC-backed startups. These results confirm a difference in the industry domain between PE-backed and VC-backed startups. PE-backed startups are not necessarily concentrated in hot industry domains where VC-backed startups operate (i.e., Software and IT), and this implies that PEs are investing startups from their angles, not mimicking VC’s investment behavior entirely.

4.2. Revenue Size

Table 4 below summarizes the revenue size of PE-backed and VC-backed startups.
This table observes a statistically significant relationship between the revenue range and funding type. Startups with revenues of either less than $1 M or over $100 M are comparatively backed up by PE, while VC funding tends to target startups in the range of $1 M to $10 M. Startups with revenue in the range of $10 M to $100 M follow a more balanced distribution. PE-backed startups are statistically more likely to have a revenue of $100 M+, while PE-backed startups are also more likely to have a revenue of less than $1 M, although our analysis excludes early-stage VC investments. In this regard, it should be noted that our analysis excludes early-stage VC investments (i.e., startups with a revenue of less than $1 M are in the early-stage category).
Considering that PE rounds are generally the largest funding rounds in the later stages, we further test the above hypothesis by dividing the data into Series C only, Series D only, and Series E and later only. We attempted to control the results of the analysis by funding size, but due to missing data, we could not perform the analysis with the precision required to obtain superior results.
We controlled the PE round by converting it to an equivalent VC round. For instance, if a PE round is granted after a VC round C, it would be treated as a round D. With this conversion, we observed that all PE rounds occur in a timing equivalent to VC’s round C. The table presents the relationship between the latest reported revenue range and the latest controlled rounds. Table 5 and Table 6 below summarize the analysis.
The relationship between revenue range and funding round is marginally significant. Startups with the latest round C are observed across the different revenue ranges. A late-stage startup in the first revenue range is comparatively expected to have reached round C, which aligns with the funding rounds’ general understanding. Although round C startups are also present in the second and third revenue ranges, both rounds D and E+ are expected to be more predominant in these ranges. Startups in the fourth revenue range reached either round C or E+.
These results confirm that Pes prefer companies with larger revenue sizes than $1 M–$10 M when they invest in startups than VCs do, which is close to the results of previous studies.

4.3. Exit Ratio and Type

Table 7 below summarizes the PE-backed and VC-backed startups’ exit status. The results show that VC-backed startups are more likely to exit when looking at overall exits (total of IPOs and M&A). In the absence of studies comparing the exit decisions of PE-backed startups and VC-backed startups, or studies examining PE and VC involvement in portfolio startups, several interpretations of the results of this analysis are possible. First, VCs may continue to have more expertise in helping startups succeed than PEs, who are new entrants. It is also possible that the better startups that are more likely to exit are choosing VC funding. The details await further research. Table 8 analyzes exits by IPO and exits by M&A, respectively.
Here, we observed that startups backed by VCs are comparatively more likely to exit through IPO. In contrast, startups backed by Pes have a slightly higher chance than expected to exit through M&A. However, both values are near as expected in the case of M&A. Several interpretations of this result are also possible regarding the mechanism of the details. First, VCs may be better than Pes at supporting the symbolic startup exit of an IPO. Also, IPO-oriented startups may prefer funding from VCs. On the other hand, when it comes to M&A, PE has frequently achieved exits through M&A in buyout investments, and it can be interpreted that M&A know-how and networks with potential acquirers are also utilized in startup exits. Future research is also awaited.
We also examine whether the industry domain a company belongs to is related to them reaching the exit and if so whether they exit through IPO or M&A. Distinct clusters of industry groups were identified through the cluster analysis from Hypothesis 1. Table 9 and Table 10 are the summary of the analysis.
The relationship between a successful exit and a startup in different clusters is statistically significant. Startups targeting manufacturing, engineering, consumer goods, and other industries specified in cluster 1 are comparatively less prone to achieve an exit, and the opposite is true for startups in software, information technology, and others in cluster 2. Meanwhile, cluster 3 has a balanced distribution. Startups in specific industries like hardware and transportation may appear in different clusters; thus, their relation to their exit and exit strategy remains unclear. These results are aligned with the ones observed in Table 2. VC-backed startups are more likely to belong to Software and IT industries and be more likely to reach an exit.
Companies in cluster 1, where we observe a comparatively stronger presence of PE-backed startups, have a balanced distribution with their exit type; both IPO and M&A are possible. Companies in cluster 2 are observed to be more related to an exit through M&A. Finally, startups in cluster 3, as shown in Table 3 have similar chances of being backed by VC or PE and have a balanced distribution in their chances of reaching an exit. But when they do, the exit is more likely to be through an IPO.

5. Discussion

These results are useful for understanding the nature of PEs in the startup ecosystem: they contribute their expertise and diversity to the source of funding. The results also have significant practical implications for startups as a guide for selecting investors in the later stage. Despite some limitations, it is significant as the first academic study to explore PE’s startup investment, and further research on the detailed mechanism is desirable.
The academic significance of this study is, first of all, that it clarified the diversity of entrepreneurial finance in the later stage, which has been of relatively little interest compared with research in the early-stage financing and after IPOs. It is also significant because it is the first study of the intersection of VC and PE, which had been divided except for limited areas such as the commonality of fund structures and return consistency. In addition, it adds insights on corporate behavior in new business domain expansion, as it analyzes how PE funds make use of and discard their past investment behavior when they expand into a new asset class, namely startup investment.
The practical implication can be summarized in answer to the following question: Is PE an uninvited guest for the startup ecosystem? Simply, the answer is no. As the results show, PE rounds have similar but different characteristics from later-stage VC rounds and diversify the financing of later-stage startups. In this sense, it can be said that they contribute to the development of the ecosystem. In particular, from the perspective of VCs, PE, as a new entrant, may appear to be a competitor with a large scale of funding, but coexistence seems to be possible. Rather, this research suggests the possibility that inviting PEs to the later stage funding round can benefit VCs to improve their exit performance. From the perspective of startups, PE rounds can be welcomed as a new option to provide funds to startups that are close to an exit such as IPO or M&A, especially in the industry domain where PEs have track records. The result can be a guideline for selecting the appropriate funding entity based on the type of exit the startup is considering. Finally, for the policymakers in the entrepreneurial ecosystem, this research suggests that inviting PEs to the network of potential equity investors diversifies the ecosystem and may bring more startup successes to the ecosystem.
However, our study has some limitations in its data used and approaches. The first one is that the data of the study is limited to the data after 2011 in the EU. The external validity of this research out of this period or outside of the geography is not confirmed. It will be a subject of future research whether the results obtained from this study can be verified in regions where startup investment is more advanced, such as the United States, or in regions where startup investment lags, such as developing countries.
Crunchbase, the data source that this study relied on, also has its limitations. As mentioned above, Crunchbase is a database based on public information and information collected by contributors, but it does not cover all data on startup investments. Since it targets later-stage investments, the data is considered to be more comprehensive than that of seed and early-stage investments, but another data source or a full survey in a specific area can be used for future research if available.
In addition to the limitation of approaches, this study defined PE rounds as investments led by private equity or hedge funds but did not include variables such as the more detailed classification of the investor (buyout fund or hedge fund) or the extent to which the investor has experience with startups. While we conducted this study as a general understanding of PE rounds, such details should be studied in the future. As for the exit analysis, it could be combined with the industry track record of PE buyouts to analyze the probability of success, especially for the cases where PE-backed startups made M&A exits.
Finally, this study has identified the characteristics of PE rounds from the dataset, but the mechanisms that bring them about remain unclear. How PE funds that invest in startups study the industries in which VCs invest, how investment targets and conditions are determined, and how exits are made are some of the mechanisms that need to be elaborated by both quantitative and qualitative research that tracks and investigates the decision-making process in the funds.

6. Conclusions

We analyzed the difference between startup investments by PE and VC using Crunchbase’s data on EU startup investments from 2011 to the first half of 2021. As a result of the analysis, we find that later-stage VC-backed startups and PE-backed startups differ in terms of the industry domain, and the prominent industry domain in which PE invests includes Manufacturing, Science and Engineering, Consumer Goods, Hardware, and Transportation. This suggests that PE rounds do not simply mimic VC later-stage investments and invest in similar industries with VCs, but rather study VC’s investment areas and PE’s strengths and diversify their investments into different industries with their angles. In addition, PE-backed startups tend to have high revenue when they are invested in, even after controlling for the rounds. This is consistent with previous studies that PE seeks profitability in its investments in existing businesses. Finally, VC-backed startups are more likely to exit via IPO and slightly less likely to exit via M&A than PE-backed startups, suggesting that PE rounds may be deploying know-how to invest in mature businesses for M&A exits.
We contributed to the literature on entrepreneurial finance, especially on the differences and intersections of PE and VC. We brought this new later-stage entrepreneurial financing topic to the research table and clarified the diversity of entrepreneurial finance in the later stage. Despite some limitations, we hope that research on PE’s startup investment will advance in the future and that this study will be the first step.

Author Contributions

Conceptualization, H.M.; Data curation, H.M.; Formal analysis, C.M.; Supervision, Y.K.; Visualization, C.M.; Writing—original draft, H.M. All authors have read and agreed to the published version of the manuscript.

Funding

This research received no external funding.

Institutional Review Board Statement

Not applicable.

Informed Consent Statement

Not applicable.

Data Availability Statement

Publicly available datasets were analyzed in this study. This data can be found here: www.crunchbase.com (accessed on 19 July 2021).

Conflicts of Interest

The authors declare no conflict of interest.

Appendix A

List of Industry Group (Crunchbase 2021b)
Administrative Services
Advertising
Agriculture and Farming
Apps
Artificial Intelligence
Biotechnology
Clothing and Apparel
Commerce and Shopping
Community and Lifestyle
Consumer Electronics
Consumer Goods
Content and Publishing
Data and Analytics
Design
Education
Energy
Events
Financial Services
Food and Beverage
Gaming
Government and Military
Hardware
Health Care
Information Technology
Internet Services
Lending and Investments
Manufacturing
Media and Entertainment
Messaging and Telecommunications
Mobile
Music and Audio
Natural Resources
Navigation and Mapping
Other
Payments
Platforms
Privacy and Security
Professional Services
Real Estate
Sales and Marketing
Science and Engineering
Software
Sports
Sustainability
Transportation
Travel and Tourism
Video

References

  1. Alexy, Oliver T., Joern H. Block, Philipp Sandner, and Anne L. J. Ter Wal. 2012. Social Capital of Venture Capitalists and Startup Funding. Small Business Economics 39: 835–51. [Google Scholar] [CrossRef] [Green Version]
  2. Amor, Salma Ben, and Maher Kooli. 2020. Do M&A Exits Have the Same Effect on Venture Capital Reputation than IPO Exits? Journal of Banking and Finance 111: 105704. [Google Scholar] [CrossRef]
  3. Bertoni, Fabio, María Alejandra Ferrer, and José Martí. 2013. The Different Roles Played by Venture Capital and Private Equity Investors on the Investment Activity of Their Portfolio Firms. Small Business Economics 40: 607–33. [Google Scholar] [CrossRef]
  4. Block, Joern, Christian Fisch, Silvio Vismara, and René Andres. 2019. Private Equity Investment Criteria: An Experimental Conjoint Analysis of Venture Capital, Business Angels, and Family Offices. Journal of Corporate Finance 58: 329–52. [Google Scholar] [CrossRef]
  5. Buchner, Axel, Abdulkadir Mohamed, and Niklas Wagner. 2019. Are Venture Capital and Buyout Backed IPOs Any Different? Journal of International Financial Markets, Institutions and Money 60: 39–49. [Google Scholar] [CrossRef]
  6. Crunchbase. 2021a. Glossary of Funding Types. Available online: https://support.crunchbase.com/hc/en-us/articles/115010458467-Glossary-of-Funding-Types (accessed on 30 December 2021).
  7. Crunchbase. 2021b. What Industries Are Included in Crunchbase? Available online: https://support.crunchbase.com/hc/en-us/articles/360043146954-What-Industries-are-included-in-Crunchbase- (accessed on 30 December 2021).
  8. Crunchbase News. 2021. European Startups Got A Bigger Share of Record Global VC Invested in H1 2021. Available online: https://news.crunchbase.com/news/european-vc-funding-h1-2021/ (accessed on 30 December 2021).
  9. Cumming, Douglas, and Sofia Johan. 2017. The Problems with and Promise of Entrepreneurial Finance. Strategic Entrepreneurship Journal 11: 357–70. [Google Scholar] [CrossRef]
  10. Cumming, Douglas, Donald S. Siegel, and Mike Wright. 2007. Private Equity, Leveraged Buyouts and Governance. Journal of Corporate Finance 13: 439–60. [Google Scholar] [CrossRef]
  11. Cumming, Douglas, Jochen Christian Werth, and Yelin Zhang. 2019. Governance in Entrepreneurial Ecosystems: Venture Capitalists vs. Technology Parks. Small Business Economics 52: 455–84. [Google Scholar] [CrossRef] [Green Version]
  12. Da Rin, Marco, Thomas Hellmann, and Manju Puri. 2013. A Survey of Venture Capital Research. Handbook of the Economics of Finance 2: 573–648. [Google Scholar] [CrossRef] [Green Version]
  13. Dahiya, Sandeep, and Korok Ray. 2012. Staged Investments in Entrepreneurial Financing. Journal of Corporate Finance 18: 1193–216. [Google Scholar] [CrossRef]
  14. European VC Valuations Report Q2. 2021. PitchBook. Available online: https://pitchbook.com/news/reports/q2-2021-european-vc-valuations-report (accessed on 30 December 2021).
  15. European Venture Report Q1. 2021. PitchBook. Available online: https://pitchbook.com/news/reports/q1-2021-european-venture-report (accessed on 30 December 2021).
  16. Ferrary, Michel, and Mark Granovetter. 2009. The Role of Venture Capital Firms in Silicon Valley’s Complex Innovation Network. Economy and Society 38: 326–59. [Google Scholar] [CrossRef] [Green Version]
  17. Gao, Xiaohui, Jay R. Ritter, and Zhongyan Zhu. 2013. Where Have All the IPOs Gone? Journal of Financial and Quantitative Analysis 48: 1663–92. [Google Scholar] [CrossRef] [Green Version]
  18. Gompers, Paul A., Will Gornall, Steven N. Kaplan, and Ilya A. Strebulaev. 2020. How Do Venture Capitalists Make Decisions? Journal of Financial Economics 135: 169–90. [Google Scholar] [CrossRef]
  19. Groh, Alexander Peter, Heinrich Von Liechtenstein, and Karsten Lieser. 2010. The European Venture Capital and Private Equity Country Attractiveness Indices. Journal of Corporate Finance 16: 205–24. [Google Scholar] [CrossRef]
  20. Guler, Isin, and Mauro F. Guillén. 2010. Institutions and the Internationalization of US Venture Capital Firms. Journal of International Business Studies 41: 185–205. [Google Scholar] [CrossRef] [Green Version]
  21. Harris, Robert S., Tim Jenkinson, Steven N. Kaplan, and Ruediger Stucke. 2020. Has Persistence Persisted in Private Equity? Evidence from Buyout and Venture Capital Funds. SSRN Electronic Journal. [Google Scholar] [CrossRef]
  22. Ingham, Alexander, and Leah Kodner. 2017. PrivCo versus Crunchbase. Journal of Business and Finance Librarianship 22: 250–52. [Google Scholar] [CrossRef]
  23. Kaplan, Steven N., and Per Strömberg. 2009. Leveraged Buyouts and Private Equity. Journal of Economic Perspectives 23: 121–46. [Google Scholar] [CrossRef] [Green Version]
  24. Kupor, Scott. 2019. Secrets of Sand Hill Road: Venture Capital and How to Get It. Portfolio. Available online: https://a16z.com/book/secrets-of-sand-hill-road/ (accessed on 30 December 2021).
  25. Lee, Peggy M., and Sunil Wahal. 2004. Grandstanding, Certification and the Underpricing of Venture Capital-Backed IPOs. Journal of Financial Economics 73: 375–407. [Google Scholar] [CrossRef]
  26. Metrick, Andrew, and Ayako Yasuda. 2010. The Economics of Private Equity Funds. Review of Financial Studies 23: 2303–41. [Google Scholar] [CrossRef] [Green Version]
  27. Metrick, Andrew, and Ayako Yasuda. 2011. Venture Capital and Other Private Equity: A Survey. European Financial Management 17: 619–54. [Google Scholar] [CrossRef] [Green Version]
  28. Mollick, Ethan. 2014. The Dynamics of Crowdfunding: An Exploratory Study. Journal of Business Venturing 29: 1–16. [Google Scholar] [CrossRef] [Green Version]
  29. Paglia, John K., and Maretno A. Harjoto. 2014. The Effects of Private Equity and Venture Capital on Sales and Employment Growth in Small and Medium-Sized Businesses. Journal of Banking and Finance 47: 177–97. [Google Scholar] [CrossRef]
  30. Robinson, David T., and Berk A. Sensoy. 2012. Private Equity in the 21st Century: Cash Flows, Liquidity, Contract Terms, and Performance from 1984–2010. SSRN Electronic Journal. [Google Scholar] [CrossRef]
  31. Tian, Xuan. 2011. The Causes and Consequences of Venture Capital Stage Financing. Journal of Financial Economics 101: 132–59. [Google Scholar] [CrossRef]
  32. Zucker, Lynne G., Michael R. Darby, and Jeff S. Armstrong. 2002. Commercializing Knowledge: University Science, Knowledge Capture, and Firm Performance in Biotechnology. Management Science 48: 138–53. [Google Scholar] [CrossRef] [Green Version]
Figure 1. Overview of the methodological approach. Publicly declared M&A data was sourced from the database. Then, different patterns between PE and VC-backed startups were studied regarding the industrial domain, revenue size, exit ratio, and type.
Jrfm 15 00236 g001
Figure 2. 1363 companies clustered by industry group similarity. 3 Clusters were found.
Jrfm 15 00236 g002
Table 1. Summary of the previous literature on differences and intersections between PE and VC.
CategoryPapersFindings and Contributions of the Paper
Conceptual and theoretical study on commonalitiesMetrick and Yasuda (2011)Report the commonalities of PE and VC as financial intermediaries.
Empirical and comparative studies on the performanceHarris et al. (2020)
Paglia and Harjoto (2014)
Buchner et al. (2019)
Report similarities in performance persistence.
Reports differences in growth impact on portfolio companies.
Report differences in IPO underpricing and post-IPO operating performance.
Experimental study on the behavioral level differencesBlock et al. (2019)Report behavioral differences of fund managers in their investment angles.
Table 2. Variables Used in the Dataset.
VariableDetails
ExitBinary. True for companies that have IPO or been acquired
True: 461
False: 902
Later Stage FundingEither VC or PE:
VC: 172
PE: 1191
Number of funding roundsThe number of reported funding rounds
Min: 1; Mean: 1.58; Median: 1; Max:11
Last roundAny of the VC rounds (Series A to J) or PE
Series C: 120
Series D: 39
Series E: 13
Series F: 2
Series G, H: 1
PE: 1187
Last funding yearThe year when the last funding round took place
Min: 2011; Mean:2015; Median: 2015; Max: 2021
Founded yearThe year the company was founded
Min: 1703; Mean: 1992: Median: 2001; Max: 2020
Made acquisitionsBinary. True for companies that have acquired other companies
True: 269
False: 1094
Number of foundersThe number of founders of the company
Min: 1; Mean: 1.6; Median: 1; Max: 6
Number of employeesAny of 4 categories:
1 to 100: 670
101 to 500: 395
501 to 5000: 210
5000+: 32
No data: 38
Revenue rangeAny of four categories:
Less than $1 M: 110
$1 M to $10 M: 269
$10 M to $100 M: 224
$100 M+: 72
No data: 688
Total FundingTotal funding in Millions of US Dollars accumulated until the day of data retrieval
Min: 1200 USD;
Median: 25.97 M USD;
Mean: 80.57 M USD;
Max: 1913 M USD;
No data: 1097
Industry GroupsOne or more of the 47 Industry Groups
Table 3. Later Stage Companies by Cluster and Funding Type.
ClusterMain Industry Groups of Companies in the ClusterPE-Backed StartupsVC-Backed Startups
1Manufacturing; Science_and_Engineering; Consumer_Goods; Hardware; Transportation288
(24.5%)
11
(6.3%)
2Software; Information_Technology; Hardware; Internet_Services; Professional_Services267
(22.7%)
67
(39.0%)
3Health_Care; Food_and_Beverage; Commerce_and_Shopping; Transportation; Financial_Services622
(52.8%)
94
(54.7%)
Note: Pearson’s Chi-squared test: X-squared = 38.251, df = 2, p-value = 4.941 × 10⁻⁹. The shares (%) in each cluster are calculated for the total PE-backed and VC-backed startups, respectively.
Table 4. PE and VC-backed Startups by Revenue Size.
Revenue RangePE-Backed StartupsVC-Backed Startups
Less than $1 M103 (19.4%)7 (4.9%)
$1–10 M182 (34.2%)87 (60.8%)
$10–100 M179 (33.6%)45 (31.5%)
$100 M+68 (12.8%)4 (2.8%)
Note: X-squared = 45.221, df = 3, p-value = 8.304 × 10⁻¹⁰. The shares (%) in each cluster are calculated for the total PE-backed and VC-backed startups, respectively. Reported revenue by startups backed by VC or PE, for available data, in millions of dollars.
Table 5. Number of Startups by the Latest Reported Funding Round and Revenue Range.
Revenue RangeRound CRound DRound E+
Less than $1 M108 (17.3%)2 (5.7%)0 (0%)
$1 M to $10 M246 (39.3%)17 (48.6%)6 (42.9%)
$10 M to $100 M202 (32.3%)16 (45.7%)6 (42.9%)
$100 M+70 (11.1%)0 (0%)2 (14.2%)
Note: X-squared = 12.055, df = 6, p-value = 0.06074. The shares (%) in each cluster are calculated for the total Rounds C, D, and E+, respectively.
Table 6. Number of Startups by the Latest Reported Funding Round and Revenue Range Detailed for PE or VC Funding.
Revenue RangeRound CRound DRound E+
PE-BackedVC-BackedPE-BackedVC-BackedPE-BackedVC-Backed
Less than $1 M103 (19.4%)5 (5.3%)02 (5.7%)00
$1 M to $10 M182 (34.2%)64 (68.1%)017 (48.6%)06 (42.9%)
$10 M to $100 M179 (33.6%)23 (24.5%)016 (45.7%)06 (42.9%)
$100 M+68(12.8%)2 (2.1%)0002 (14.2%)
Note: The shares (%) in each cluster are calculated for the total Rounds C, D, and E+ of each PE-backed or VC-backed, respectively.
Table 7. PE and VC-backed Startups by Exit Status.
Exit StatusPE-Backed StartupsVC-Backed StartupsTotal
Not exited809 (67.9%)93 (54.1%)902
Exited382 (32.1%)79 (45.9%)461
Total11911721363
Note: X-squared = 12.281, df = 1, p-value = 0.0004577. The shares (%) in each cluster are calculated for the total PE-backed and VC-backed startups, respectively.
Table 8. PE and VC-backed Startups by IPO and M&A Exits Type.
Exit TypePE-Backed StartupsVC-Backed StartupsTotal
Exit with IPO14 (3.7%)12 (15.2%)26
Exit with MA368 (96.3%)67 (84.8%)435
Total38279461
Note: X-squared = 14.244, df = 1, p-value = 0.0001605. The shares (%) in each cluster are calculated for the total PE-backed and VC-backed startups, respectively.
Table 9. Later Stage Companies by Cluster and Exit Status.
ClusterMain Industry Groups of Companies in the ClusterExitNot Exit
1Manufacturing; Science_and_Engineering; Consumer_Goods; Hardware; Transportation74 (16.2%)225 (25.2%)
2Software; Information_Technology; Hardware; Internet_Services; Professional_Services142 (32.1%)192 (21.5%)
3Health_Care; Food_and_Beverage; Commerce_and_Shopping; Transportation; Financial_Services241 (52.7%)475 (53.3%)
Note: X-squared = 22.262, df = 2, p-value = 1.465 × 10⁻⁵. The shares (%) in each cluster are calculated for the total PE-backed and VC-backed startups, respectively.
Table 10. Analysis of Exited Companies by Clusters.
ClusterMain Industry Groups of Companies in the ClusterIPOM&A
1Manufacturing; Science_and_Engineering; Consumer_Goods; Hardware; Transportation5
(19.3%)
69
(16.0%)
2Software; Information_Technology; Hardware; Internet_Services; Professional_Services1
(3.8%)
141
(32.7%)
3Health_Care; Food_and_Beverage; Commerce_and_Shopping; Transportation; Financial_Services20
(76.9%)
221
(5.13%)
Note: X-squared = 9.7924, df = 2, p-value = 0.007475. The relationship between success and clusters is statistically significant. The shares (%) in each cluster are calculated for the total PE-backed and VC-backed startups, respectively.
Publisher’s Note: MDPI stays neutral with regard to jurisdictional claims in published maps and institutional affiliations.

