Abstract
We examined volatility spillover effects from five prominent global stock markets to India’s stock market during the pre-and-post COVID-19 outbreak using daily adjusted closing prices between January 2019 and September 2021 from six capital markets. The structural breakpoint was identified as 23 March 2020, as per the breakpoint unit root test, to examine and compare the results pre-and-post COVID-19. Results show that previous period news and volatility feeds the next period’s volatility significantly and the volatility is found to be persistent. The analysis also shows that during the pre-COVID period there is a negative significant volatility spillover from four of the five selected stock markets (Australia, China, Japan, and Germany) to the Indian stock market, and that spillover continues in the post-COVID period. There is a positive significant return and volatility spillover from the US market to the Indian stock market in the post-COVID-19 period. The results of our study will be useful for retail investors and portfolio managers in understanding the portfolio allocation methods in case of volatility spillover arising due to the crisis caused by the COVID-19 outbreak.
1. Introduction
Several empirical studies (Bae and Karolyi 1994; Gallo and Otranto 2007; Bhargava et al. 2012; Jebran and Iqbal 2016) have investigated how information transmission and shocks affect financial market volatility; these empirical works have identified and examined the channels through which such shocks are transmitted among markets. Several key factors such as global ease of trade, investment policies, macroeconomic similarities, capital inflows, foreign assets and liabilities, free workforce mobility, advances in information technology, rapid broadcasting speed of global news, and other factors have all contributed to information transmission from one market to another; these factors have aided the flow of information between marketplaces (Booth et al. 1997; Dornbusch et al. 2000; Gallo and Otranto 2007); these long-term changes in the composition of information flows from one or more markets to other markets have bought in structural changes over the years. Information transmission among markets led to the strengthening and integration of financial markets (Singh et al. 2010). In addition to information flow, liberalization, and deregulation of various stock markets in recent years, have resulted in a rise of direct and portfolio investments from established countries to emerging markets. Due to the market integration globally, any social, economic, or financial shocks had a significant impact on the stock markets. The Mexican Peso crisis (1994), the Asian Financial crisis (1997), the US Subprime crisis (2007–2008), the European Debt crisis (2010), and the Brexit (2016) are just a few examples of important economic and financial shocks. Empirical studies show that the relationships among global markets have strengthened because of the crisis (Cha and Oh 2000; Hoque 2007). King and Wadhwani (1990) investigated the stock market crisis during 1987. Bekaert et al. (2005) examined whether the Asian and Mexican crises in the late 1980s and early 1990s caused the Contagion effect or not. When a crisis strikes, the literature places a greater emphasis on financial market volatility and spillover between developed and emerging markets. Chen et al. (2018) developed a novel technical analysis-based method for stock market forecast that assisted investors in making stock investment decisions. Our study analyzes the interconnection between the Indian stock market with stock markets of five (US, Australia, China, Japan, and Germany) countries. The paper investigates the asymmetric responses and spillover effect from these five economies to the Indian stock markets before and after the COVID-19 epidemic.
Novel coronavirus (COVID-19) started in China and then impacted the rest of the world. COVID-19 spread at an exponential rate, affecting millions of individuals in a matter of weeks, causing social, economic, and global chaos. The rapid spread of this virus prompted the World Health Organization (WHO) to designate it as a pandemic, and practically all governments were forced to declare a state of emergency to combat the virus spread. A sudden and unexpected state-wide lockdown wreaked havoc on society and severely harmed the livelihoods of millions of people. Financial support and relief measures provided by governments assisted citizens and businesses in overcoming economic hardships to some extent, but this had a negative impact on the government’s budget. The impact of this outbreak was considerably more on the public and public health apprehensions (Bakhshi and Chaudhary 2020).
Pandemic had a significant negative impact on the markets throughout the world. Financial integration and the well-connectedness of the global markets ensured that, the impact had severe ramifications across the global financial markets within a few months. As a result, policymakers and portfolio managers believed it was critical to examine the volatility of financial assets and the consequences of information spillover from one economy to another in the context of this epidemic. Extreme downside risk-return volatilities during the pandemic from developed economies to emerging economies were examined and the results show downside abnormal returns to be more prominent in developed economies rather than emerging economies (Shah et al. 2022). Similarly, volatility in the stock market hampers economic performance through reduced consumer spending (Garner 1988) and it may also negatively affect business investment spending (Gertler and Hubbard 1988). Higher volatility in the stock market is perceived as an increased risk in the equity market and may lead to the movement of funds from risky investments to less-risky investment avenues. As the volatility spillover generally results from the interdependence among the nations, it is essential to understand the underlying drivers of cross-country stock market correlation and volatility from the perspective of market participants and policymakers (Baele 2005).
Since the COVID-19 crisis is different in its velocity and intensity from previous ones, researchers, policymakers, investors, and other stakeholders have paid not only close attention to the variations in stock market return and volatility, but also subsequent impact caused by information transmission across global financial markets during the crisis period. Thus, in response to the pandemic, global financial market risk also increased substantially (Zhang et al. 2020). Due to the pandemic, the global stock market struck out about USD 6 trillion in 1 week from 24 to 28 February (Ozili and Arun 2020).
According to Bloomberg data, before COVID-19, total market capitalization in India was about USD 2.16 trillion but the COVID-19 outbreak caused market capitalization to reduce to USD 1.3 trillion on 23 March 2020; this would be attributed to the first lockdown imposed by the government. As per the Stringency Index score by the University of Oxford1 India’s score was at around 90 during this period when the number of COVID-19 cases registered were less than 1000. During the same time stringency score for countries such as USA, Germany and China, the stringency was in the range of 70–85. After the lockdown, India’s stock market capitalization crossed USD 2.5 trillion with ease of norms and with a stringency index score remaining between 80 and 90, thereby gaining confidence among the investors.
Our study is the first one to measure information transmission and volatility spillover from the five economies (USA, China, Japan, Germany, and Australia) to Indian stock markets specifically during the pre-and-post COVID-19 periods. Though there are studies examining downside risk volatilities among the developed and emerging economies, fewer studies have focused on measuring information transmission among the major economies of the world. Thus, our study is relevant from that perspective. The results of our study will be useful for retail investors and portfolio managers in understanding the portfolio allocation methods in case of volatility spillover arising from the crisis caused by the COVID-19 outbreak or other similar unexpected future events. The current empirical study proceeds as follows; section two briefly reviews available literature on the topic. Section three highlights the theoretical framework and research design adopted for the current study to realize the stated objectives. Fourth section provides an analysis of data and discussion on the outcome. Last section provides a summary of major outcomes and their implications and compares them with results of similar existing studies.
2. Literature Review
In estimating the returns and volatility, researchers have tried to understand the extent of spillover in financial information and its transmission across international stock markets. Over the years, various modelling techniques have been used and applied to capture volatility clustering in financial data. Engle (1982) proposed ARCH, Bollerslev (1986) proposed GARCH, Nelson (1991) suggested EGARCH. Later, various ARCH extension models were developed to capture the volatility and spillover effects. Studies examined spillover effects across time dimensions within and between various countries’ stock markets, forex markets, and swap markets to study the economic integration of global stock markets (Bae and Karolyi 1994; Worthington and Higgs 2004; Li 2007; Yepes-Rios et al. 2015; Paramati et al. 2016). Sabri (2004) examined the increasing stock return volatility of emerging economies such as Mexico, Korea, South Africa, Turkey, and Malaysia. The study found that the volume of stock trading and exchange rates were common predicting factors for the volatility of these emerging markets. Mishra et al. (2007) explored the long-run relationship and bidirectional volatility spillover between the stock and forex markets in India using GARCH, EGARCH, and Cointegration approach. Bhargava et al. (2012) investigated if the volatility in the US dollar interest rate swap market spillover to the Indian swap market. The results show that there is a unidirectional volatility spillover from the US swap market to the Indian swap market; moreover, the volatility spillover impact was found to be asymmetric for one-year swaps. Kumar (2013) found the presence of return and volatility spillover effects between forex rates and stock prices within the IBSA (India, Brazil, and South Africa) countries.
Researchers also examined the impact of specific events on the stock market interconnectedness and volatility spillover. Yong and Laing (2020) investigated the reaction of the U.S stock market to World Health Organization COVID-19 Global Emergency announcement while focusing on firms having global exposure. He et al. (2020) applied event study methodology to compare the pre- and post-pandemic performance of the traditional Chinese industries in the Shanghai Stock Exchange with hi-tech industries belonging to Shenzhen Stock Exchange. The study found that sectors like transportation, electricity, mining, and environmental industries have been unfavorably impacted by the pandemic.
In the recent years, researchers across the world have shown keen interest in modeling the effect of the COVID-19 virus outbreak on returns and volatility using event-based methods in developed and emerging economies. Anh and Gan (2020) applied event study methodology to examine the impact of the COVID-19 outbreak and subsequent lockdowns, using panel data of 723 listed firms returns in Vietnam. The study concluded significant changes in the returns prior to and after the COVID-19 outbreak. Gherghina et al. (2020) examined the influence of COVID-19 on the financial market by considering daily stock market returns for seven Countries viz., USA, Germany, UK, Spain, Italy, France, and Romania. The study applied an autoregressive distributed lag (ARDL) model to study the impact of the pandemic outbreak on the Romanian stock market. The empirical study found Romanian 10-year government bond to be more sensitive to COVID-19 news than the stock index of the Bucharest Stock Exchange. Thakur (2020) analyzed the US stock market movements during the COVID-19 epidemic by employing the VAR model and using time series data from 23 Jan 2020 to 19 June 2020. The result showed that the Standard and Poor (S&P) index has exhibited an adverse causality effect with the upsurge in the number of new cases at the global level.
Yan et al. (2020) analyzed the consequence of COVID-19 across various sectors such as the entertainment sector, travel and tourism and gold investment. The study established that the pandemic had significant adverse effect in the short-run but in the long-run, there would be course correction. Baker et al. (2020) opined that compared to any other infectious disease which had hit the world, the COVID-19 pandemic has left a stronger impact on the U.S. stock market. Baek et al. (2020) conducted an industry-level analysis on the impact of COVID-19 on US stock market volatility. The study examined economic indicators to identify the change in volatility. The study found that volatility is largely determined by certain macroeconomic indicators and the negative news due to COVID-19 was more impactful than positive news, suggesting a negativity bias. Adnan et al. (2020) analyzed the response of capital markets to COVID-19 by considering individual stock returns of 311 registered firms. The study revealed that the domestic stock market showed significant response to the event.
Studies subsequently examined the stock market integration on account of the COVID-19 pandemic on the global markets and the information spillover among the various economies. Capelle-Blancard and Desroziers (2020) assessed the stock markets’ integration on account of COVID-19 news, the successive lockdowns, and the policy announcements by examining a panel of 74 countries for a period of 4 months from January 2020 to April 2020. The study found that the stock prices had been relatively less sensitive to the country’s economic variables before the crisis compared to its short-term response at the time of crisis. Cao et al. (2020) using panel data analysis found that the stock indices moved with COVID-19’s domestic and global spreads. Sharif et al. (2020) examined the association between the COVID-19 spread, oil price instability, stock market price volatility, geopolitical risk, and economic policy ambiguity in the USA. The analysis revealed that the impact of the COVID-19 on the geopolitical risk is considerably greater than the economic uncertainty of the USA. The risk of COVID-19 spread is observed differently over the short-run and long-run.
To sum up, there are hardly any studies that are intended to capture information transmission and volatility spillover from the five major economies to Indian stock markets specifically during the pre-and-post COVID -19 periods. Our study intends to fill that gap in the current literature.
3. Objectives, Methodology and Framework
- Even though numerous research papers focused on capturing financial market spillover effects, downside risk-return spillovers and their effects on market volatility, there are few studies analyzing the change in spillover effect between the Indian stock market and global stock markets because of the COVID-19 pandemic. The purpose of this study is to examine information and volatility spillover from the five biggest economies to the Indian stock market during the pre-and-post COVID outbreak. Except for Australia, the other four economies have a higher GDP than India.
- Our study empirically examines the potential for asymmetry in information transmission and volatility spillover from select overseas stock markets to the Indian stock market. As of 2019, the top four economies in terms of nominal GDP are the USA, China, Japan and Germany2. We considered the Australian stock index, as there is a strong economic relationship between both countries. India was Australia’s seventh-largest trading partner and sixth-largest export market in 20203. Table 1 describes the stock market data used in the study.

Table 1.
Sources of Data.
Table 1.
Sources of Data.
| Scheme | Frequency | Source |
|---|---|---|
| Sensex (India) | Daily | www.bseindia.com, accessed on 31 December 2021 |
| S&P 500 (USA) | www.in.finance.yahoo.com, accessed on 31 December 2021 | |
| SSE Composite (China) | ||
| Nikkei 225 (Japan) | ||
| DAX (Germany) | ||
| ASX 200 (Australia) | www.moneycontrol.com, accessed on 31 December 2021 |
- The daily adjusted closing stock price data from January 2019 to September 2021 are used. Unit Root with Break Test is used to look for a structural break in the Sensex return series around which pre-and-post COVID-19 analysis is conducted. The stock price returns were computed using the formula given in Equation (1).
is the adjusted closing price of the stock index on day t, and is the adjusted closing price of the stock index for the previous day. Time plots were examined to identify if the stock returns exhibited continuous mean reversion and volatility clustering. To examine the impact of the pandemic on stock returns behavior and distribution, descriptive statistics along with Jarque-Bera (J-B) test was conducted. Jarque-Bera (J-B) test being goodness-of-fit test helped determine whether the time series data of indices is normally distributed considering measures of shape. The J-B test equation is as shown in Equation (2);
S = Skewness; K = Kurtosis and n = sample size.
‘Unit-root with Break test’ is used, which is better than the Dickey-Fuller (DF) tests, as these are biased towards non-rejection of a unit root when structural breaks are present. In this study, Dicky-Fuller breakpoint test is used as we look for specific structural breaks caused by COVID-19. Other tests like Bai and Perron (1998) multiple breakpoint test may be appropriate when we suspect that there is more than one structural break in the data that are unable to be easily explained. To avoid spurious regression by regressing one random walk time series data on another random walk time series data, a stationarity test was conducted using the Augmented Dicky-Fuller (ADF) unit-root test.
- To examine the relationship of five economies with the Sensex index, OLS regression analysis was used. In the study, OLS estimation results are considered consistent when the regressors are exogenous, have unbiased estimators, and the error terms are homoscedastic and serially uncorrelated. Autocorrelation and heteroscedasticity tests were conducted as diagnosis tests. Finally, to examine volatility spillover from foreign markets to Indian markets, E-GARCH model was considered over other models.
On a logarithmic expression, Nelson (1991) proposed an Exponential GARCH (E-GARCH) model; it is an improvement over the GARCH model, and it is useful in detecting the existence or absence of the leverage (asymmetry) impact. The traditional GARCH model assumes both positive and negative error terms will have a symmetric influence on the volatility i.e., good and bad news have an equal effect on the volatility; this assumption is mostly violated in economics and finance research.
We use the stepwise technique proposed by Jebran and Iqbal to investigate the volatility spillover (2016). First, we compute the returns of stock indices to examine the conditional variance of stochastic segments of returns. Secondly, to examine the ARCH effect, we apply the ARCH test by considering the first lag of all variables and checking for the significance of the chi-square statistic. If significant, it provides confirmation for using EGARCH model on variables with problem of autocorrelation and heteroscedasticity. As a third step, we examine the cross-market volatility spillover between the indices by first generating the volatility residual series from a specific EGARCH model for each index separately which acts a proxy for shock emanating to other markets and then examining the volatility spillover using EGARCH (1,1) from foreign markets to Indian markets by using the volatility residual series of foreign market indices as shock emanating to Indian markets and vice versa (Mishra et al. (2007)).
The EGARCH model to examine volatility spillover from foreign markets to Indian markets is given below:
Equation (3) is the conditional mean equation and (4) is the conditional variance equation. In the conditional mean equation, Rt(Indian) is the return of Indian indices and α2 measures the foreign market changes on Indian indices. In the conditional variance equation, ht(Indian) represents log of conditional variance of Indian indices; β0 represents constant of volatility; represents the consistency which is function of volatility, captures the impact of changes in news on volatility; measures asymmetric effect of volatility and finally, examines the volatility spillover emanating from foreign market to Indian market.
4. Analysis and Discussion
4.1. Time Plot and Descriptive Statistic
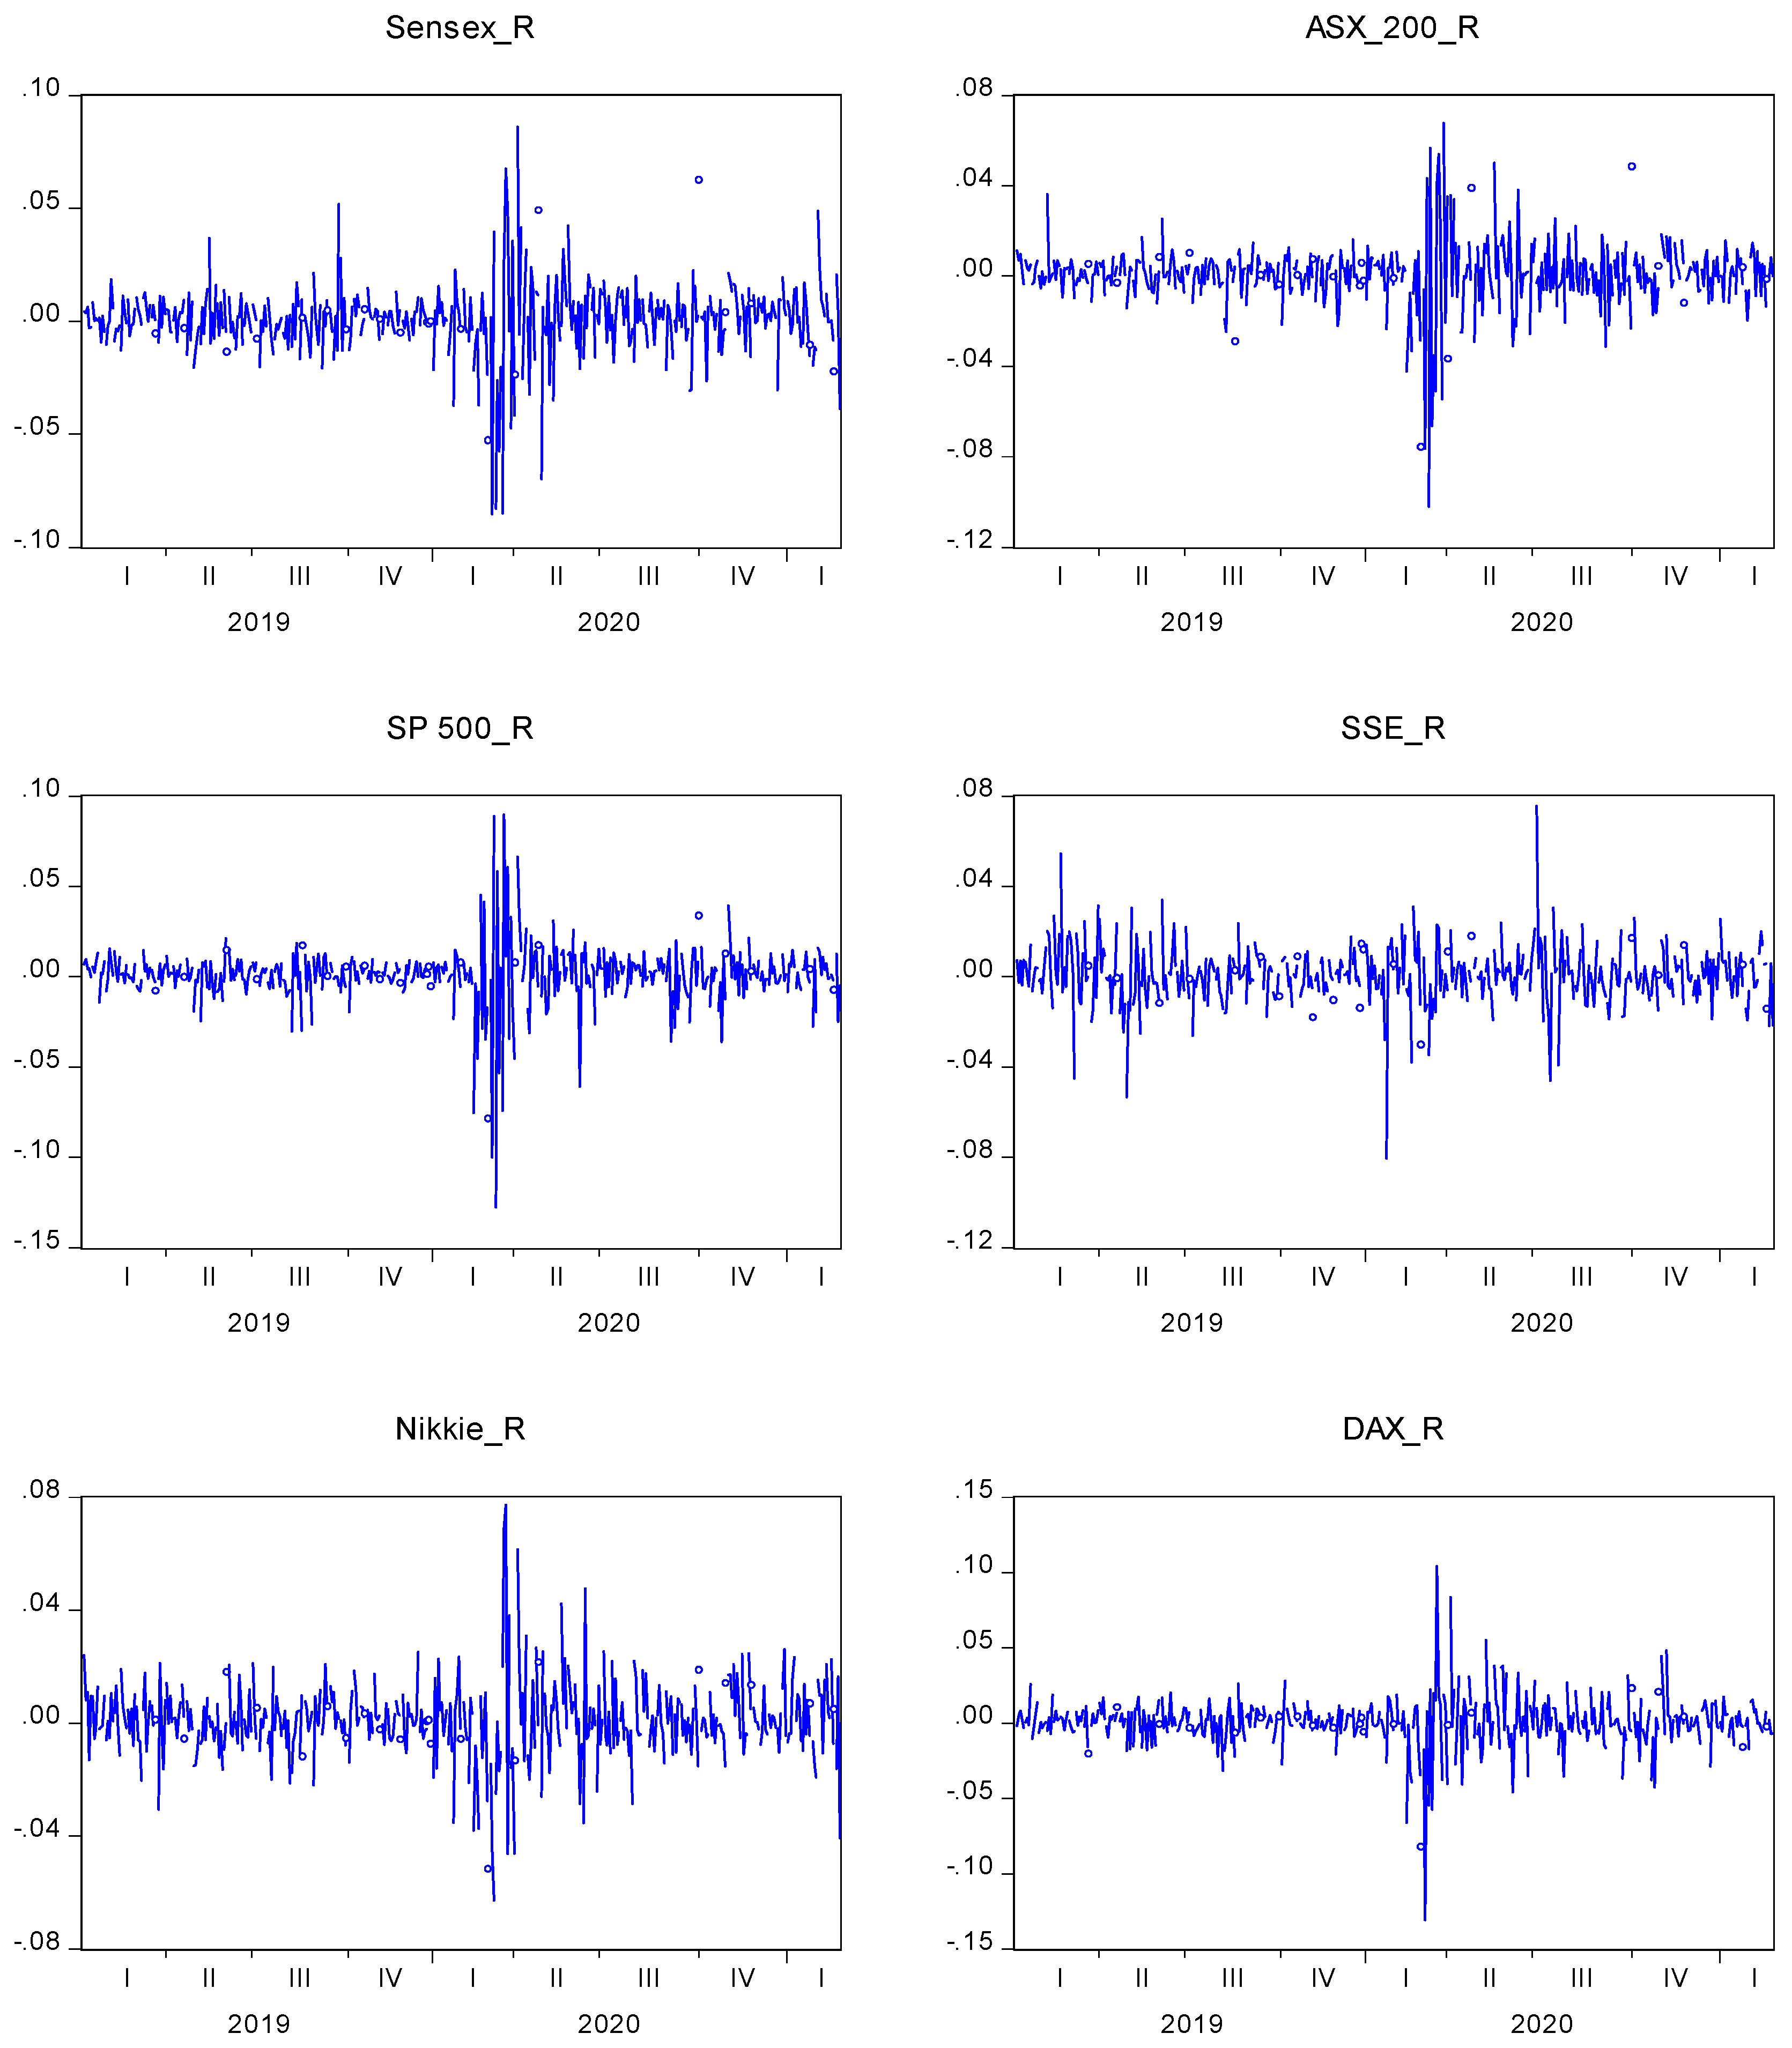
Our study uses the daily closing values of stock market indices in India (Sensex), the United States (S&P 500), China (SSE Composite), Germany (DAX), Australia (ASX 200), and Japan (Nikkei). The period of the study is from January 2019 to September 2021. For analysis, the daily closing numbers are transformed to log returns. Plotting the variable’s data series against time and observing its movement is the first step in a time series analysis; this is a simple and effective method to understand how the variable performed over time. The presence of trend in mean or variance of the data series signifies that the data is non-stationary. Figure 1 depicts a time plot of Sensex, S&P 500, ASX 200, SSE Composite, DAX, and Nikkei return series.
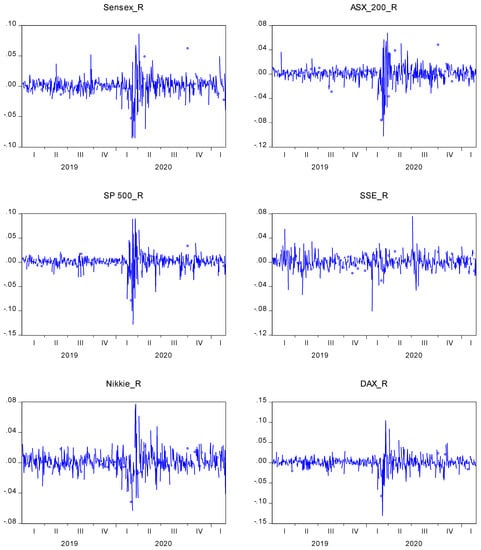
Figure 1.
Time plot of Stock Market indices Log returns.
As a result of widespread COVID-19, stock market returns in all economies show significant volatility towards the end of the first quarter of 2020. Many economies throughout the world imposed a rigorous lockdown, restricted people’s movement, and halted all economic activities. The quick and unexpected spread of the coronavirus had a significant negative impact on the financial markets, particularly the stock market. Figure 1 shows that volatility increased in all stock market returns since the COVID-19 outbreak in the first quarter of 2020, i.e., since the outbreak compared to prior period (2019). The time series plot of stock market returns exhibits continuous mean reversion and volatility clustering.
- The descriptive statistic numerically summarizes how the data series are distributed for all stock market indices. Table 2 exhibit the result of descriptive statistics. The standard deviation is higher than the mean and median for all index returns. The Sensex has a maximum return of 8.59% and a minimum return of −8.53%. Skewness and Kurtosis should have ideal values of 0 and 3 for a data series that follows a normal distribution. Negative skewness values for the Sensex, ASX 200, S&P 500, SSE Composite, and DAX show that data is negatively skewed, and the data series has a longer left tail. A leptokurtic characteristic of the distribution is represented by higher Kurtosis values. In all six stock market return series, the probability value is less than 5%, indicating that the data are not normally distributed.
Table 2. Descriptive Statistics.
4.2. Unit Root with Break-Point Test
- The presence of unit-root is examined in the underlying time series data. Most statistical tests and techniques rely on the assumption that statistical properties remain constant throughout time. Stationary time series data is preferable for modelling and predicting the relationship between the variables. Since the objective of the study is to determine whether there was a change in information transmission and volatility in the Indian stock market before and after the COVID-19 epidemic, a Unit Root with Break Test is used to look for a structural break in the Sensex return series. The Augmented Dickey-Fuller (ADF) test is employed as the test statistic. To have a serially uncorrelated error term, the ADF test includes the lagged difference terms of the dependent variable in the equation. Table 3 displays the results of the Breakpoint unit root test for Sensex and ADF test results of other stock indices return series.
Table 3. Unit Root with Break Point test.
For all log-returns of stock indices, the null hypothesis that “data series has the unit root” is rejected; this means that at the level, all the underlying variables are stationary. The unit root test with breakpoint indicates Sensex returns has a structural break on 23 March 2020. The study examines information transmission and volatility before and after the structural break date, using the breakpoint date as the event date for examining the transmission effects on the Indian stock market. Thus, the period from 1 January 2019 to 22 March 2020 is considered as the pre-COVID period and the period from 23 March 2020 onwards as the post-pandemic period throughout the study.
4.3. OLS Regression for Pre-and-Post COVID-19 Outbreak
During the pre-COVID-19 outbreak period, a regression model with Sensex returns as the dependent variable and other economies indices returns, namely ASX 200, S and P 500, SSE Composite, DAX, and NIKKEI being independent variables was estimated to assess the return spillover. In the same way, an assessment was carried out to determine spillover of the returns beyond the structural break date. Table 4 shows the results of OLS regression estimation for the pre-COVID-19 and post-COVID-19 periods.
Table 4.
OLS regression during Pre-and-Post COVID-19 phase.
The null hypothesis “No significant relationship between foreign stock markets and Indian stock markets” is rejected for ASX 200 and DAX 200 during the pre-COVID-19 era because the t-statistic likelihood value is less than 5%. The ASX 200, S&P 500, SSE Composite, and NIKKEI have all been significant at the 5% mark since the COVID-19 outbreak. Results support the theory that markets become increasingly integrated during times of crisis, as the Indian stock market is significantly linked to global stock markets during the COVID-19 period. During the pre-COVID and post-COVID periods, the adjusted R2 is 44.4%and 34.35%, respectively. Adjusted R2 values show the explanatory power of the model. The overall model is significant since the probability value of the F-statistic is less than the 5% level. The Durban-Watson test statistic in the pre-COVID phase is 1.89, which is near to 2, indicating that there may be no first-order autocorrelation in error terms. The Durban-Watson value in the post-COVID phase is 2.13, which is greater than the targeted value of 2.
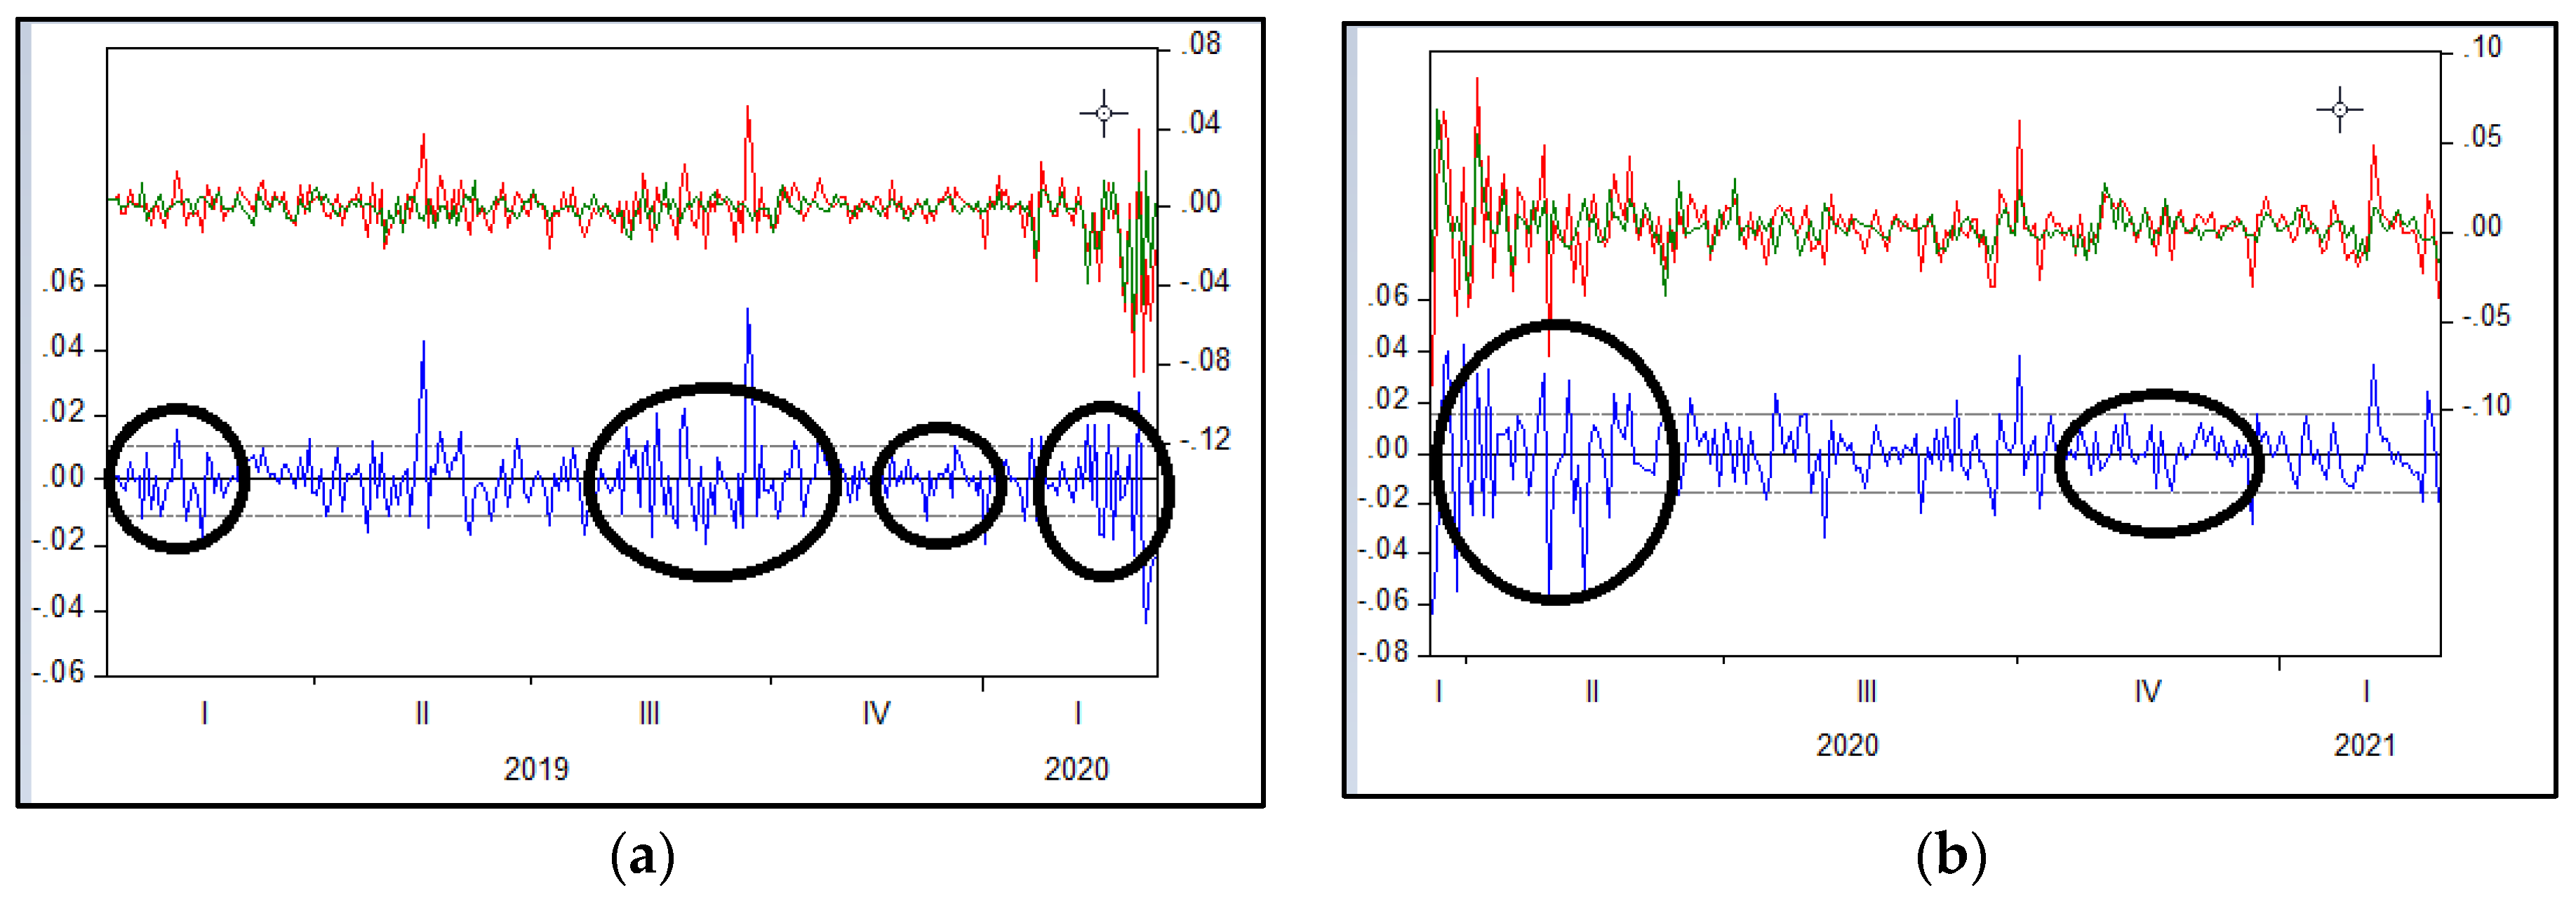
Figure 2 displays the pre-and-post COVID 19 OLS model residuals. The residuals in the plot are clustered according to the size of volatility. There is a volatility clustering in residuals, i.e., large variations follow large variations and small variations follow small variations. The constant variance assumption of OLS is violated by such clustering in residuals. The OLS estimation is reliable only if the model has constant variance and free from autocorrelation issue. Thus, to verify whether the residual of the model is abiding with the OLS assumption of constant variance and no autocorrelation, the ARCH heteroscedasticity test and Breusch-Godfrey Serial Correlation LM Test were carried out for both pre-and-post COVID 19 periods. The results as shown in Table 5, reject the null hypothesis of the ARCH test in both the pre- and post-COVID 19 stages because the p-value is less than 5%, showing that the residual models have an ARCH effect (heteroscedasticity). Breusch-Godfrey serial correlation test p-value is higher than the 5% limit during the pre-COVID phase, indicating that there is no autocorrelation problem; however, for the post-COVID 19 epidemic, the p-value is less than 5%, indicating that the model has an autocorrelation problem. Because of the presence of ARCH effect, the heteroscedasticity problem must be addressed using the ARCH framework.
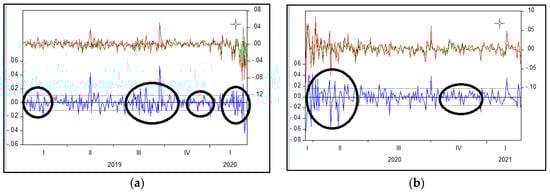
Figure 2.
Residual time plot of OLS regression. (a) Pre-COVID 19 residual plot; (b) Post-COVID 19 residual plot.
Table 5.
Diagnostic tests for OLS Regression analysis.
4.4. Volatility Spillover and Leverage Effect
The Exponential GARCH (E-GARCH) model is used to assess the information asymmetry and volatility spillover in the Indian stock market. The traditional GARCH model assumes symmetric responses to all the information and therefore it fails to capture the market’s asymmetric response to the good and bad news. In this context, the traditional GARCH model’s conditional variance fails to capture the Indian stock market’s asymmetric response to positive and negative shocks received from other stock markets; this possible leverage effect (asymmetric response) is more valuable in predicting market volatility. Table 6 shows the results of the EGARCH model before and after the COVID 19 outbreak.
Table 6.
Volatility spillover from foreign markets to Indian market.
Coefficients of return and variance equations during the pre-COVID 19 outbreak phases, are shown in the first section of Table 6. The α2 value is positive and significant for ASX_200, S&P 500 and Nikkei 225, indicating a positive return spillover from the Australian, USA and Japanese stock markets to the Indian stock market. In the variance equation, β1 (GARCH term) represents the impact of prior period volatility on current volatility. β1 is significant for SSE Composite, Nikkei 225, and DAX. The coefficients of β2 (ARCH term) are negative and significant for all five foreign markets; this represents that the change in volatility news from these stock markets disturbs the Indian stock market significantly. The coefficient of leverage effect (φ) is positive and significant for all five foreign market indices; it measures the asymmetric effect of volatility. The leverage effect is positive and significant, indicating that shocks are asymmetric, with positive shocks having a greater influence than negative shocks. Volatility spillover parameter () for all foreign stock markets are significantly negative suggesting that Indian stock market offers diversification opportunities for investors.
The second section of Table 6 contains information about the post-COVID outbreak phase. Significant positive return spillover is observed from S&P 500 and DAX to BSE Sensex. For the S&P 500 to Sensex and SSE Composite to Sensex, the GARCH coefficients (β1) are positive and significant, indicating that volatility is consistent across these markets. ARCH (β2) and EGARCH (φ) terms are significant for all five foreign markets. Negative significance of β2 represents that news on change in volatility affects conditional volatility in the Indian market. The positive φ values indicate leverage effect, wherein positive shocks show greater effect. The volatility spillover parameter () is positive and significant only for the S&P 500 (USA) indicating that there is a positive volatility spillover effect from the USA to India. Spillover effects are not observed from other foreign markets to India during the post-COVID phase. Our results show that during the post-COVID 19 outbreak, the Indian stock market volatility is triggered by a positive spillover effect from the USA markets. Based on the correlogram, the final diagnostic checking of the E-GARCH model was done and is shown in Table 7.
Table 7.
Heteroscedasticity Test after EGARCH model for the Post-COVID period.
The robustness test for the E-GARCH model was conducted. The p-value in the ARCH heteroscedasticity test is more than a 5% level of significance, indicating that the null hypothesis of ‘no heteroscedasticity’ fails to get rejected. Similarly, the null hypothesis of “no autocorrelation” is not rejected by the serial correlation test. As a result, the above EGARCH model is free from both heteroscedasticity and autocorrelation issues.
5. Conclusions
The financial markets have changed dramatically because of the COVID 19 outbreak, resulting in structural changes in stock market movements. The goal of our study was to determine the asymmetry and volatility spillover from stock market indexes in five major foreign nations—the United States (S&P 500), China (SSE), Germany (DAX), Australia (ASX 200) and Japan (NIKKEI 225) to the Indian stock market (Sensex). The structural change date was set for 23 March 2020, as per the breakpoint unit root test. The ADF unit root test results show that the Indian and foreign stock market return series are stationary. An OLS regression analysis was used to analyze the long-run link between Sensex returns and foreign stock market returns during the pre-COVID and post-COVID outbreak phases. Thus, our study examined the structural change, asymmetry, and volatility spillover in the Indian stock market. ASX 200 and DAX are revealed to be a strong influencers of Sensex performance during the pre-COVID epidemic timeframe. During the post-COVID outbreak phase, however, all foreign stock indices except DAX were found to have strong influence on Sensex performance. Thus, India’s stock market integration with these economies varied before and after the COVID 19 outbreak. The OLS regression analysis’ diagnostic test revealed that the residuals of the models are heteroscedastic. Autocorrelation is also a problem in the post-COVID outbreak regression model. Therefore, the ARCH model must be used when there is heteroscedasticity in the residuals. In conclusion, the EGARCH model confirmed that the information on volatility and historical variances is significant during the pre-COVID and post-COVID periods.
6. Policy Implications and Future Research
Our study investigated whether specific unexpected shocks have any significant impact on the volatility on the markets and if so, whether is any spillover from one market to another consistent during pre-COVID 19 and post-COVID 19. The study concludes that prior to the pandemic, the Indian markets were the preferred destination for investment among the bourses as evidenced by significant negative spillover coefficients in EGARCH (1,1) model; this resulted in positive inflows of capital into the Indian stock market as the Indian markets were viewed as an opportunity for portfolio reallocation and investment; however the positive and significant volatility spillover from the United States during the post-COVID phase suggests that asset reallocation to the Indian market may not provide the same return and diversification benefit as it did during the pre-COVID period; this implies that, at least during the pandemic period, when markets were volatile, the US became a better destination for diversification rather than other markets. Notably, post-COVID the Indian markets are considered the preferred destination for investments from other markets except for the US. The volatility spillover to India in the post-COVID outbreak phase is not as significant as it was in the pre-COVID period from Australia, China, Germany, and Japan. Thus, similar studies can be conducted to examine the spillover effect across various unexpected events and its impact on portfolio diversification across various emerging and developed markets. In addition, study of downside risk-return spillover between developed and emerging economies will provide significant addition to the literature.
Author Contributions
Conceptualization, M.T. and D.R.N.; methodology, M.T. and D.R.N.; software, D.R.N.; validation, S.M. and D.R.N.; formal analysis, D.R.N.; investigation, M.T. and D.R.N.; resources, S.M., M.T. and D.R.N.; data curation, D.R.N.; writing—original draft preparation, M.T. and D.R.N.; writing—review and editing, S.M.; visualization, D.R.N.; supervision, S.M.; project administration, S.M. All authors have read and agreed to the published version of the manuscript.
Funding
This research received no external funding.
Institutional Review Board Statement
Not applicable.
Informed Consent Statement
Not applicable.
Data Availability Statement
The data on indices used in the study were mainly obtained from secondary sources such as www.bseindia.com, www.in.finance.yahoo.com, www.moneycontrol.com as mentioned in Table 1 for the period January 2019 to September 2021.
Acknowledgments
Thanks to Rakesh Gupta, Senior Lecturer in Finance, Griffith University, Australia for his feedback.
Conflicts of Interest
The authors declare no conflict of interest.
Notes
| 1 | https://covidtracker.bsg.ox.ac.uk/stringency-scatter, accessed on 28 July 2022. |
| 2 | https://www.nasdaq.com/articles/the-5-largest-economies-in-the-world-and-their-growth-in-2020-2020-01-22, accessed on 29 July 2022. |
| 3 | Department of Foreign Affairs, Australian Government, https://www.dfat.gov.au/geo/india/india-country-brief, accessed on 28 July 2022. |
References
- Adnan, Abu Taleb Mohammad, Mohammad Mahadi Hasan, and Ezaz Ahmed. 2020. Capital Market Reactions to the Arrival of COVID-19: A Developing Market Perspective. Economic Research Guardian 10: 97–121. [Google Scholar]
- Anh, Dao Le Trang, and Christopher Gan. 2020. The impact of the COVID-19 lockdown on stock market performance: Evidence from Vietnam. Journal of Economic Studies 48: 836–51. [Google Scholar] [CrossRef]
- Bae, Kee-Hong, and G. Andrew Karolyi. 1994. Good news, bad news and international spillovers of stock return volatility between Japan and the U.S. Pacific-Basin Finance Journal 2: 405–38. [Google Scholar] [CrossRef]
- Baek, Seungho, Sunil K. Mohanty, and Mina Glambosky. 2020. COVID-19 and stock market volatility: An industry level analysis. Finance Research Letters 37: 101748. [Google Scholar] [CrossRef] [PubMed]
- Baele, Lieven. 2005. Volatility Spillover Effects in European Equity Markets. Journal of Financial and Quantitative Analysis 40: 373–401. [Google Scholar]
- Bai, Jushan, and Pierre Perron. 1998. Estimating and testing linear models with multiple structural changes. Econometrica 66: 47–78. [Google Scholar] [CrossRef]
- Baker, Scott R., Nicholas Bloom, Steven J. Davis, Kyle Kost, Marco Sammon, and Tasaneeya Viratyosin. 2020. The Unprecedented Stock Market Reaction to COVID-19. The Review of Asset Pricing Studies 10: 742–58. [Google Scholar] [CrossRef]
- Bakhshi, Priti, and Rashmi Chaudhary. 2020. Responsible Business Conduct for the Sustainable Development Goals: Lessons from Covid-19. International Journal of Disaster Recovery and Business Continuity 11: 2835–41. [Google Scholar]
- Bekaert, Geert, Campbell R. Harvey, and Ng Angela. 2005. Market Integration and Contagion. The Journal of Business 78: 39–69. [Google Scholar] [CrossRef]
- Bhargava, Vivek, D. K. Malhotra, Philip Russel, and Rahul Singh. 2012. An empirical examination of volatility spillover between the Indian and US swap markets. International Journal of Emerging Markets 7: 289–304. [Google Scholar] [CrossRef]
- Bollerslev, Tim. 1986. Generalized Autoregressive Conditional Hetroscedasticity. Journal of Econometrics 31: 307–27. [Google Scholar] [CrossRef]
- Booth, G. Geoffrey, Mustafa Chowdhury, Teppo Martikainen, and Yiuman Tse. 1997. Intraday Volatility in International Stock Index Futures Markets: Meteor Showers or Heat Waves? Management Science 43: 1564–76. [Google Scholar] [CrossRef]
- Cao, Kang Hua, Qiqi Li, Yun Liu, and Chi-Keung Woo. 2020. Covid-19′s adverse effects on a stock market index. Applied Economics Letters 28: 1–5. [Google Scholar] [CrossRef]
- Capelle-Blancard, Gunther, and Adrien Desroziers. 2020. The stock market is not the economy? Insights from the COVID-19 crisis. Insights from the COVID-19 Crisis. CEPR COVID Economics, 1–40. [Google Scholar] [CrossRef]
- Cha, Baekin, and Sekyung Oh. 2000. The relationship between developed equity markets and the Pacific Basin’s emerging equity markets. International Review of Economics and Finance 9: 299–322. [Google Scholar] [CrossRef]
- Chen, Yuh-Jen, Yuh-Min Chen, Shiang-Ting Tsao, and Shu-Fan Hsieh. 2018. A novel technical analysis-based method for stock market forecasting. Soft Computing 22: 1295–312. [Google Scholar] [CrossRef]
- Dornbusch, Rudiger, Yung Chul Park, and Stijn Claessens. 2000. Contagion: How it spreads and How it can be Stopped. World Bank Research Observer 15: 177–97. [Google Scholar] [CrossRef]
- Engle, Robert F. 1982. Autoregressive Conditional Heteroscedasticity with Estimates of the Variance of United Kingdom Inflation. Econometrica 50: 987–1007. [Google Scholar] [CrossRef]
- Gallo, Giampiero M., and Edoardo Otranto. 2007. Volatility Transmission Across Markets: A Multi-Chain Markov Switching Model. Applied Financial Economics 17: 659–70. [Google Scholar] [CrossRef]
- Garner, Alan. 1988. Has Stock Market Crash Reduced Customer Spending? Economic Review, Federal Reserve Bank of Kanas City 3: 16. [Google Scholar]
- Gertler, Mark, and R. Glenn Hubbard. 1988. Financial factors in business fluctuations. In Proceedings—Economic Policy Symposium—Jackson Hole. Kanas City: Federal Reserve Bank of Kanas City, pp. 33–78. [Google Scholar]
- Gherghina, Ștefan Cristian, Daniel Ștefan Armeanu, and Camelia Cătălina Joldeș. 2020. Stock market reactions to Covid-19 pandemic outbreak: Quantitative evidence from ARDL bounds tests and Granger causality analysis. International Journal of Environmental Research and Public Health 17: 6729. [Google Scholar] [CrossRef] [PubMed]
- He, Pinglin, Yulong Sun, Ying Zhang, and Tao Li. 2020. COVID–19′s Impact on Stock Prices Across Different Sectors—An Event Study Based on the Chinese Stock Market. Emerging Markets Finance and Trade 56: 2198–212. [Google Scholar] [CrossRef]
- Hoque, Hafiz Al Asad Bin. 2007. Co-movement of Bangladesh stock market with other markets: Cointegration and error correction approach. Managerial Finance 33: 810–20. [Google Scholar] [CrossRef]
- Jebran, Khalil, and Amjad Iqbal. 2016. Examining volatility spillover between Asian countries’ stock markets. China Finance and Economic Review 4: 1–13. [Google Scholar] [CrossRef] [Green Version]
- King, Mervyn A., and Sushil Wadhwani. 1990. Transmission of volatility between stock markets. Review of Financial Studies 3: 5–33. [Google Scholar] [CrossRef]
- Kumar, Manish. 2013. Returns and Volatility spillover between stock prices and exchange rates. International Journal of Emerging Markets 8: 108–28. [Google Scholar] [CrossRef]
- Li, Hong. 2007. International linkages of the Chinese stock exchanges: A multivariate GARCH analysis. Applied Financial Economics 17: 285–97. [Google Scholar] [CrossRef]
- Mishra, Alok Kumar, Niranjan Swain, and Davinder K. Malhotra. 2007. Volatility Spillover between Stock and Foreign Exchange Markets: Indian Evidence. International Journal of Business 12: 343–58. [Google Scholar]
- Nelson, Daniel B. 1991. Conditional Heteroscedasticity in Asset Returns: A New Approach. Econometrica 59: 347–700. [Google Scholar] [CrossRef]
- Ozili, Peterson K., and Thankom Arun. 2020. Spillover of COVID-19: Impact on the Global Economy. Available online: https://ssrn.com/abstract=3562570 (accessed on 22 March 2022).
- Paramati, Sudharshan Reddy, Eduardo Roca, and Rakesh Gupta. 2016. Economic integration and stock market dynamic linkages: Evidence in the context of Australia and Asia. Applied Economics 48: 4210–26. [Google Scholar] [CrossRef]
- Sabri, Nidal Rashid. 2004. Stock Return Volatility and Market Crisis in Emerging Economies. Review of Accounting and Finance 3: 59–78. [Google Scholar] [CrossRef]
- Shah, Syed Asim, Hassan Raza, and Aijaz Mustafa Hashmi. 2022. Downside risk-return volatilities during COVID 19 outbreak: A comparison across developed and emerging markets. Environmental Science and Pollution Research 29: 1–13. [Google Scholar] [CrossRef] [PubMed]
- Sharif, Arshian, Chaker Aloui, and Larisa Yarovaya. 2020. COVID-19 pandemic, oil prices, stock market, geopolitical risk and policy uncertainty nexus in the US economy: Fresh evidence from the wavelet-based approach. International Review of Financial Analysis 70: 101496. [Google Scholar] [CrossRef]
- Singh, Priyanka, Brajesh Kumar, and Ajay Pandey. 2010. Price and volatility spillovers across North American, European and Asian stock markets. International Review of Financial Analysis 19: 55–64. [Google Scholar] [CrossRef]
- Thakur, Shreeram. 2020. Effect of COVID 19 on Capital Market with Reference to S&P 500. International Journal of Advanced Research 8: 1180–88. [Google Scholar] [CrossRef]
- Worthington, Andrew, and Helen Higgs. 2004. Transmission of equity returns and volatility in Asian developed and emerging markets: A multivariate GARCH analysis. International Journal of Finance and Economics 9: 71–80. [Google Scholar] [CrossRef]
- Yan, Binxin, Logan Stuart, Andy Tu, and Tony Zhang. 2020. Analysis of the effect of COVID-19 on the Stock Market and Investing Strategies. Available online: https://ssrn.com/abstract=3563380 (accessed on 23 April 2022).
- Yepes-Rios, Beatriz, Kelly Gonzalez-Tapia, and Maria Alejandra Gonzalez-Perez. 2015. The integration of stock exchanges: The case of the Latin American Integrated Market (MILA) and its impact on ownership and internationalization status in Colombian brokerage firms. Journal of Economics, Finance and Administrative Science 20: 84–93. [Google Scholar] [CrossRef]
- Yong, Hue Hwa Au, and Elaine Laing. 2020. Stock market reaction to COVID-19: Evidence from US Firms’ International exposure. International Review of Financial Analysis 76: 101656. [Google Scholar] [CrossRef]
- Zhang, Dayong, Min Hu, and Qiang Ji. 2020. Financial markets under the global pandemic of COVID-19. Finance Research Letters 36: 101528. [Google Scholar] [CrossRef]

Publisher’s Note: MDPI stays neutral with regard to jurisdictional claims in published maps and institutional affiliations. |
© 2022 by the authors. Licensee MDPI, Basel, Switzerland. This article is an open access article distributed under the terms and conditions of the Creative Commons Attribution (CC BY) license (https://creativecommons.org/licenses/by/4.0/).