Abstract
In this study, we explore the inter-dynamics among holding periods, return multiples, fund types, and exit routes of different VC and PE investments in the emerging economy context of India. We employ data spanning from January 2004 to March 2021, and our results indicate that there is a negative association between the holding period and return. The results also indicate that the average holding periods for India-dedicated and foreign funds are not significantly different. Furthermore, the results show that India-dedicated funds outperform foreign funds significantly in generating returns. Finally, the findings suggest that all exit routes can potentially yield similar results, contrary to the prevailing belief that certain exit routes guarantee superior returns. These findings provide useful insights for a spectrum of stakeholders, including entrepreneurs, practitioners, investors, financial analysts, and policymakers.
1. Introduction
In recent times, India has risen as a prominent and sought-after destination for venture capital (VC) and private equity (PE) investments on a global scale, owing to its rapidly expanding startup ecosystem and favorable regulatory framework. Notably, the year 2021 marked the sixth consecutive year in which global private equity funds successfully raised over USD 500 billion. Even amidst the challenges posed by the global pandemic, approximately 2500 funds worldwide managed to secure a total of USD 872 billion, representing a remarkable 20 percent increase from the previous year. These figures were particularly striking, given the prevailing economic uncertainty and the novel landscape of remote fundraising. Investors in the VC and PE sectors have been enticed by India’s substantial and burgeoning market and its abundant pool of skilled and talented technology professionals. Additionally, the country’s favorable demographic trends have contributed to its attractiveness as an investment destination (Dominic 2021). Notably, the Indian startup ecosystem has witnessed several notable successful exits in recent years, with numerous unicorns emerging in key sectors such as e-commerce, fintech, and ed-tech. The year 2021 stands out as a remarkable period for India’s PE and VC markets, as it experienced a strong resurgence following the pandemic-induced slowdown. The sector demonstrated resilience and a swift recovery, further affirming India’s position as a vibrant and thriving hub for VC and PE investments.
According to the data (compiled by the authors) presented in Figure 1, the year 2021 witnessed a notable surge in the PE–VC market in India, with the total deal value reaching USD 69.8 billion through 1269 deals. This significant increase in investment, reaching close to USD 70 billion, indicates a highly active and dynamic market accompanied by a complementary acceleration in exit activities. In light of these developments, the present study aims to investigate the dynamics of VC and PE investments in India, focusing on the inter-dynamics between factors such as holding period, return multiple, fund types, and exit routes. By analyzing these interlinkages, this research seeks to understand the prevailing investment trends and patterns in the Indian market during this period.
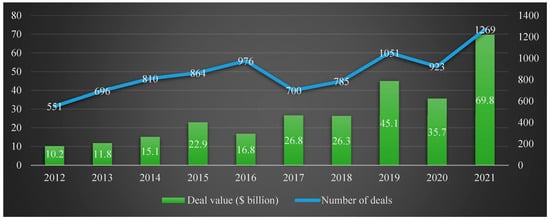
Figure 1.
Total VC/PE investments in India from 2012 to 2021.
The extant literature has extensively documented the capacity of private equity to deliver substantial returns within relatively short time frames. Academic consensus also affirms that private equity consistently outperforms public markets in terms of financial returns, as evidenced by various studies (Kaplan and Schoar 2005; Higson and Stucke 2012; Harris et al. 2014). Consequently, the duration of investment holdings significantly impacts return patterns, with extended holding periods leading to a negative effect on returns. This notion finds support in the works of Acharya et al. (2013) and Cumming and Walz (2010), who establish a noteworthy negative correlation between holding periods and returns. Additionally, prolonged holding periods have been observed to adversely impact future fundraising endeavors (Cumming et al. 2005; Hammer et al. 2017; Loos and Schwetzler 2017; Dominic and Gopalaswamy 2022), as they can impede the generation of satisfactory returns, tie up committed capital, and hinder the ability to raise subsequent funds (Valkama et al. 2013; Jenkinson and Sousa 2015; Loos and Schwetzler 2017). Consequently, private equity investors generally prefer shorter holding periods to mitigate these challenges. However, studies investigating the relationship between holding periods and returns in the context of emerging markets are scarce. Given the distinct social, cultural, political, legal, and economic backgrounds of emerging markets compared to developed countries, it becomes imperative to comprehend the interplay and dynamics between the aforementioned variables. Therefore, the present study seeks to examine the underlying dynamics between holding periods and returns specifically within an emerging market context, i.e., India. By examining this relationship, our study tries to contribute valuable insights to the field of private equity investments in emerging market contexts.
In recent times, the landscape of venture capital (VC) investments has witnessed a notable upswing in cross-border activities. One of the key contributing factors to this surge is the significant rise in international VC investments in emerging economies. Simultaneously, local VC industries have also experienced substantial growth in both developed and emerging countries worldwide. Foreign venture capitalists, in particular, encounter higher costs in evaluating potential investee firms and monitoring their post-investment performance due to geographical distance and contextual disparities between their home country and the entrepreneurial firm’s host country (Guler and Guillén 2010; Li et al. 2014). Conversely, local venture capitalists enjoy inherent advantages in their domestic markets, with better access to information regarding local market conditions and investment prospects (Mäkelä and Maula 2008). Prior research has delved into how cultural, legal, and institutional distances between the VC’s home country and the entrepreneurial firm’s country influence investment strategies, success rates, and syndication approaches (Li et al. 2014; Dai et al. 2012; Guler and Guillén 2010). Specifically, Dai et al. (2012) and Cumming et al. (2016) have explored the value-added by international and local venture capitalists to entrepreneurial firms. Nonetheless, the existing literature is scant in terms of studies comparing the performance of domestic and foreign funds, particularly within the context of emerging markets. In this paper, we aim to address this gap by scrutinizing the average return multiple and holding periods of both domestic and foreign funds, with the objective of analyzing the efficacy of international versus domestic venture capital investments. By exploring the comparative performance of these funds, we seek to contribute valuable insights to the understanding of cross-border VC dynamics in the context of emerging markets.
We conduct our study in the Indian context for several reasons. Over the past few years, India has emerged as an increasingly attractive destination for venture capital (VC) and private equity (PE) investments. These investments have played a crucial role in driving innovation and fostering growth within India’s economy, and they are expected to continue being pivotal in the country’s development in the foreseeable future. As of 2023, India is projected to become the world’s most populous country, positioning it as the largest contributor to the global workforce for several decades ahead. Additionally, India has achieved significant economic momentum, ranking as the fifth-largest economy globally. This growth has been largely attributed to the country’s policies of economic liberalization, which have fostered a more market-oriented approach, promoted increased participation of private capital, and enhanced global competitiveness. The Indian economy is projected to experience substantial growth in the coming decades, making it one of the most promising large economies. Recent years have witnessed several noteworthy trends in India’s VC and PE landscape. Notably, there has been a growing interest in early-stage startups, with investors seeking to capitalize on the untapped potential of India’s flourishing startup ecosystem. Additionally, certain sectors such as fintech, ed-tech, healthcare, and e-commerce have garnered considerable attention due to their significant growth and innovative advancements.
Moreover, there has been a shift towards larger investments in well-established companies, leading to the emergence of several unicorns in the market. The COVID-19 pandemic has catalyzed digital adoption, resulting in increased investments in tech-enabled solutions. Another prominent trend has been the rise of impact investing, with investors showing a keen interest in companies that can generate social and environmental impact alongside financial returns. These trends collectively demonstrate the maturing state of India’s VC and PE ecosystem, with investors keenly eyeing the country’s robust economic growth and favorable demographic prospects. Furthermore, the Indian government has taken proactive steps to support startups and foster entrepreneurship, exemplified by initiatives like the Startup India program and the Atal Innovation Mission. These initiatives have further contributed to India’s appeal as an investment destination, alongside its vast and expanding market, abundant pool of talented tech workers, and favorable demographic trends.
The present study uses the data on exit transactions of venture capital investors across diverse investee organizations in India, spanning from January 2004 to March 2021. The data is obtained from the database, Venture Intelligence, and after applying suitable filters, a total of 221 exit transactions were selected for analysis. These transactions were specifically chosen due to their complete data regarding the industry affiliation of the firm, the type of venture capital fund involved, return multiple, holding period, and the exit routes employed. We employ four non-parametric tests like Kendall’s tau-b, Mann–Whitney U, Kruskal–Wallis H, and Tukey post hoc tests to understand the dynamics among holding period, return multiple, fund types, and exit routes. Our results indicate that there is a negative monotonic association between the holding period and the Compound Annual Growth Rate (CAGR). Also, the analysis implies that, even if the return multiples generally increase with the time period of investments, the investment loses its value when held over a longer period of time. Hence, the investors need to find out the optimal time to exit to avoid the destruction of investment value. In addition, the findings indicate notable variations in average holding periods across different exit routes. Moreover, the results indicate that the average holding periods for India-dedicated and foreign funds are not significantly different. Furthermore, the results show that India-dedicated funds outperform foreign funds significantly in generating returns when measured by CAGR. Notably, while the return multiples differed significantly across the exit routes, the CAGR, which is a more standardized and popular measure of return on investment, did not show significant differences. This suggests that investors tend to liquidate their investments once they perceive a lack of growth potential and aim to secure a required return on their investment. Overall, the findings suggest that all exit routes can potentially yield similar results, contrary to the prevailing belief that certain exit routes guarantee superior returns.
This study adds to the existing literature in financial economics and private equity in several ways. First, using a unique dataset of 221 India-based exit transactions, the findings improve understanding of the extant literature, and thereby add to the debate on the short- versus long-term nature of private equity and the role of exit-route strategies (Jenkinson and Sousa 2015; Hammer et al. 2017). Thus, this study contributes to our understanding of the critical relationship between holding period and return, an issue central to the strategic management of entrepreneurial efforts. Second, the results provide entrepreneurs with some bases for evaluating the required return or the attractiveness of the venture and the selection strategy. Third, our findings suggest that funds should design and develop unique post-investment monitoring and value-adding strategies systematically related to the required return targets. Fourth, apart from contributing to the general literature on entrepreneurship, this study provides useful insights into venture capital financing in the emerging economy context, especially on investor behavior and decision-making processes within different exit strategies, facilitating informed investment choices in the future. Fifth, besides its academic contribution, the findings have relevant insights for practitioners, investors, financial analysts, and policymakers in making well-informed decisions regarding investment strategies and market expectations.
This study makes a significant contribution to the existing body of knowledge in the field of financial economics and private equity through multiple avenues. Firstly, leveraging a distinct and comprehensive dataset comprising 221 exit transactions based in India, the outcomes of this investigation enrich the comprehension of the current literature. This enrichment, in turn, contributes to the ongoing discourse surrounding the dichotomy between short-term and long-term dynamics within the domain of private equity, as well as the intricate interplay of exit-route strategies, as previously discussed by scholars like Jenkinson and Sousa (2015), and Hammer et al. (2017). Thus, this study extends our insights into the vital correlation between the duration of holding investments and the ensuing returns—an issue that holds pivotal importance in the realm of strategic management within entrepreneurial pursuits. Secondly, the findings presented herein furnish entrepreneurs with a foundational framework for the evaluation of essential aspects such as requisite returns and the allure of specific ventures, alongside the selection strategies they entail. Thirdly, our empirical observations recommend that investment funds should systematically devise and implement distinctive post-investment monitoring mechanisms and value-enhancement strategies that align with predefined return objectives. This recommendation stems from our comprehensive analysis of the exit transactions and is poised to offer valuable guidance to investment practitioners in their pursuit of optimizing portfolio outcomes. Fourthly, beyond its implications for the broader entrepreneurship literature, this study significantly augments our understanding of venture capital financing within the context of emerging economies. These insights play a pivotal role in facilitating well-informed investment decisions within similar contexts, thus enhancing the efficacy of investment choices in the future. Fifthly, transcending its academic contributions, the discoveries of this research hold tangible implications for a spectrum of stakeholders, including practitioners, investors, financial analysts, and policymakers. The insights presented herein serve as a valuable resource for informed decision-making processes related to investment strategies and the management of market expectations. By providing a more holistic view of the intricate landscape of exit transactions and their associated dynamics, this study directly aids stakeholders in navigating the complexities of investment landscapes.
While the study makes significant contributions to the field of financial economics and private equity, it is important to acknowledge some limitations. The findings of this study are based on a specific dataset of 221 exit transactions in India. This limited geographic scope may restrict the generalizability of the results to other regions with different economic, regulatory, and market conditions. The sample size is relatively small when compared to larger financial and private equity studies. This could affect the statistical power and robustness of the conclusions. The study is limited by the data’s temporal scope, which may not account for more recent developments and changes in the private-equity landscape. Private equity strategies and dynamics can evolve over time, and this study’s findings may not fully capture these changes. Given the reliance on historical data, there is a possibility of survivorship bias, where only successful exit transactions are included in the dataset. This bias could overstate the attractiveness of certain venture capital investments. Acknowledging these limitations, future research can explore these areas in greater depth and with a broader scope, to provide a more comprehensive understanding of the dynamics of private equity and venture capital investments.
The rest of the paper is organized as follows. Section 2 provides the theoretical background and develops hypotheses. Section 3 describes the data and research methodology. Section 4 presents the results and discussions. Finally, Section 5 concludes by discussing the results from both a theoretical and a practical perspective.
2. Related Literature and Theoretical Framework
In this section, we review the extant literature to identify the inter-dynamics among the holding period, return, exit routes, and type of funds of VC and PE. At the end of this segment, we identify the potential gap in the literature and formulate the hypotheses to examine the inter-dynamics among the above-mentioned variables.
The concept of the holding period in private equity refers to the duration between the initial investment and the eventual sale of the invested company. Existing research indicates that private equity has demonstrated the capacity to yield significant returns over relatively short periods, and there is a widespread agreement within academic circles that private equity consistently outperforms public markets in terms of financial returns, as highlighted by various studies (Kaplan and Schoar 2005; Higson and Stucke 2012; Harris et al. 2014). As a result, private equity has emerged as an appealing asset class for investors. Nevertheless, certain traditional methods of value creation in private equity have faced challenges in recent times. The surge in the number of buyout funds and active mergers and acquisitions (M&A) markets has intensified competition for investment opportunities, thereby presenting new hurdles for private equity firms in their pursuit of generating excess returns (Axelson et al. 2009).
In the realm of private equity investments, the traditional holding period, which denotes the duration between the initial investment and its eventual exit, has conventionally ranged from four to five years (Strömberg 2008; Jenkinson and Sousa 2015; Degeorge et al. 2016; Bansraj et al. 2019). Nonetheless, Hammer (2017) proposes that holding periods have experienced a notable increase since 2004. According to Joenväärä et al. (2022), the average holding period was 4.7 years before the financial crisis (2007–2008), which then rose to 5.8 years post-crisis. Hammer’s (2017) research also supports this trend, showing that holding periods expanded by 60 percent, from an average of 3.3 years in 2003 to 5.3 years in 2012. Hammer et al. (2017) further contend that holding periods exceeding four years are perceived to impact private equity fund returns negatively.
The duration for which an investment is held can have a notable impact on the patterns of returns. When holding periods are extended, it tends to have a negative effect on returns measured by the internal rate of return (IRR). This observation is supported by the research of Acharya et al. (2013) and Cumming and Walz (2010), who both highlight a significant negative correlation between the holding period and IRR. Additionally, statistical tests conducted by Cochrane (2005) confirm that returns are indeed influenced by the length of the holding period. As the IRR is a time-sensitive metric for measuring returns, it follows that shorter investments should generally yield higher performance. Nikoskelainen and Wright (2007) assert that their own significant findings can be attributed to the fact that investors tend to favor quicker exits when presented with a window of opportunity, even if the full potential for enhancement has not yet been fully realized.
Extended holding periods pose challenges in generating satisfactory financial returns, and can also tie up committed capital, which is a concern for both Limited Partners (LP) and General Partners (GP) involved in private equity. General Partners, being incentivized to earn carried interest over the hurdle rate expressed in the fund’s internal rate of return (IRR), find that a quicker exit from investments enhances returns and ensures the realization of those returns (Hammer et al. 2017; Jenkinson and Sousa 2015). Valkama et al. (2013) find a negative correlation between longer holding periods and equity IRR. Moreover, prolonged holding periods have been observed to adversely impact future fundraising efforts (Cumming et al. 2005; Hammer et al. 2017; Loos and Schwetzler 2017). As fundraising relies significantly on reputational capital and track record, private equity firms typically seek to raise new funds every three to five years (Kaplan and Schoar 2005; Axelson et al. 2009; Phalippou 2008). Prospective Limited Partners considering new funds not only assess past performance but also focus on the investment track record of recent funds. Therefore, unrealized investments or disappointing returns could potentially have a negative impact on future fundraising endeavors.
The reinvestment issue poses a unique challenge for venture capitalists (VCs) that does not exist in perfect financial markets. Unlike perfect market investors who can instantly buy and sell, VCs face the difficulty of not being able to reinvest their proceeds into profitable business opportunities immediately. This can result in periods of idle cash, especially when the expected investment horizon of VC investments is shorter, increasing the risk of not having suitable investment options available. Consequently, VC managers may require a higher return to compensate for the potential idle cash situation when their expected holding period is shorter (Stevenson et al. 1987). However, it is essential to consider investment-stage preferences as they may play a significant role in addressing this challenge.
In response to heightened competition and the commoditization of traditional value-creation methods, numerous private equity firms have adopted hybrid strategies such as the buy-and-build approach. This strategy often involves creating value through financial engineering, exploiting multiple arbitrages, and leveraging synergies between the platform and add-on acquisitions, such as economies of scale and scope, tax gains, and resource allocation between firms. Hammer et al. (2017) have noted that the rise of buy-and-build strategies has contributed to a 20-percent increase in holding periods over time. These strategies entail acquiring multiple add-on companies, which introduces additional monitoring and integration costs, diverts focus from organic growth, and adds size and complexity to the portfolio firm (Cumming and Johan 2013; Hammer et al. 2017). Consequently, these factors tend to result in longer holding periods for private equity investments. However, longer holding periods can complicate the ability to generate satisfactory returns, tie up committed capital, and hinder the ability to raise subsequent funds (Valkama et al. 2013; Jenkinson and Sousa 2015; Hammer et al. 2017; Loos and Schwetzler 2017). Therefore, private equity investors generally prefer shorter holding periods to address these challenges. Based on the extant literature presented above, we formulate the following hypotheses as follows:
Ha1:
The average return multiple is negatively associated with the investment holding period.
Ha2:
The average return multiple differs for India-dedicated funds vis-à-vis foreign funds.
Ha3:
The average holding period differs for India-dedicated funds vis-à-vis foreign funds.
Various factors can influence holding periods in private equity investments. One key determinant is the presence of market opportunities at a given time. Ljungqvist et al. (2020) highlight that access to inexpensive debt can lead to intensified competition among private equity firms, thereby increasing the attractiveness of potential exits. Additionally, Gompers et al. (2015) find that the level of activity in M&A and IPO markets plays a significant role in determining the choice of exit, alongside fundamental factors like operational performance. Consequently, these factors enhance the ability of private equity firms to exit their investments at a favorable timing and price. Private equity investors, typically institutional in nature, approach acquisitions differently than strategic investors, as their primary aim is not to take over businesses but to invest as financial backers. Returns are realized through exits from investments over a typical period of 3–6 years rather than regular dividends. Giot et al. (2014) establish a link between holding periods and the experience of private equity firms. Their research suggests that less experienced firms may have longer holding periods due to challenges in deploying capital quickly and effectively during the investment phase. Inexperienced firms might face obstacles in deal sourcing and value creation throughout the holding period. Furthermore, the nature and focus of a private equity firm can also influence holding periods. Arcot et al. (2015) propose that some private equity firms, especially those affiliated with institutions like pension funds and banks, prioritize longer time horizons in their investment strategies. These firms might have a more patient approach to realizing returns and may be less constrained by short-term pressures. In summary, holding periods in private equity are shaped by market opportunities, exit options, the experience of the firm, and the nature of the private equity entity itself.
Previous research has consistently identified initial public offerings (IPOs) as the most preferred exit route for private equity firms in terms of financial returns (Cao and Lerner 2009; Nikoskelainen and Wright 2007; Gompers and Lerner 2004). IPOs not only offer attractive returns but also serve as effective marketing tools for younger private equity firms seeking to raise subsequent funds (Jenkinson and Sousa 2015). However, IPOs have experienced a decline in popularity, and a majority of private equity exits now take the form of trade or secondary exits. Kaplan and Schoar (2005) examined 17,781 leveraged buyout transactions worldwide, revealing that the most common exit route was through strategic sales, accounting for 38 percent of exits. Strategic sales involve various strategic or industrial investors, such as competitors, suppliers, or customers, and are particularly attractive when there is significant synergetic potential for the acquirer. While, traditionally, strategic sales may not offer the most appealing exit channel in terms of returns compared to IPOs, Peterman and Lai (2009) argue that a strategic sale might be the preferred option when an IPO is not viable, especially during a financial crisis when investor confidence is low. Under challenging economic conditions, the proceeds from a strategic sale could potentially be higher compared to a public listing. Moreover, strategic investors often include revenue or cost synergies in their valuations, allowing for premiums to be incorporated into their investments. Another advantage of the strategic sale over IPOs is the ability to sell 100 percent of the investment immediately, which may not be possible with an IPO exit due to lock-up periods (Pindur 2007). In summary, while IPOs have historically been the top choice for private equity exits, strategic sales have gained traction, particularly when IPOs are not feasible or when strategic potential and immediate divestment are prioritized over short-term returns.
In the context of secondary buyouts, private equity firms opt to sell their portfolios to other private equity firms rather than pursuing public offerings or selling to strategic parties. Over time, this exit route has experienced significant growth in popularity. Kaplan and Schoar (2005) found that secondary buyouts accounted for 24 percent of exits during the period from 1970 to 2007. Jenkinson and Sousa (2015) further observed that financial buyouts constituted 43 percent of exits, underscoring the increasing appeal of secondary buyouts. Within Europe, secondary buyouts have emerged as the most common exit route over the years. This increased preference for financial buyouts can be attributed to several factors, including the proliferation of funds and the growing diversity in terms of specialization, size, and investment stages. As portfolio companies evolve and mature, they may venture into different industries and subsequently be acquired by larger private equity firms specializing in particular sectors (Jenkinson and Sousa 2015). This trend has contributed to the recent surge in secondary buyouts, offering new avenues for private equity firms to manage their investments and capitalize on evolving market opportunities.
The choice of exit routes for private equity firms is heavily influenced by prevailing market conditions. While these firms strive to achieve the best possible exit, the availability of opportunities is shaped by the state of capital and credit markets. The conditions in the equity market play a significant role in determining the window of opportunities for exit. IPO markets often experience waves characterized by fluctuations in the number of initial public offerings. During periods of hot IPO markets, when public market valuations are high, attractive exit opportunities arise (Jenkinson and Sousa 2015). Conversely, periods characterized by low public market valuations, known as cold IPO markets, coupled with favorable debt conditions and limited covenants, stimulate the market for secondary buyouts (Shivdasani and Wang 2011). Jenkinson and Sousa (2015) present evidence supporting the notion that public listings serve as early exit routes. Exiting through an IPO in the initial years of the fund can serve as an effective marketing strategy for future fundraising efforts. However, if IPOs cannot be executed within a short timeframe, it becomes more likely that the company will be sold to either a financial or strategic buyer as an alternative exit route. Adaptability to prevailing market conditions is crucial for private equity firms to make informed exit decisions that align with their overall investment objectives.
As the fund approaches the end of its lifecycle with unrealized investments, General Partners (GPs) experience exit pressure and are motivated to expedite the realization of their investments. This pressure can create a distinct window of opportunity for exits. Cumming and MacIntosh (2003) have highlighted that, when the fund’s maturity is near and GPs face exit pressure, portfolio companies may not yet be prepared for an IPO or trade sale. Despite being traditionally perceived as a less attractive exit route, secondary buyouts offer appealing characteristics for the selling party. The process of selling the company is often organized through auctions, which can drive up prices with multiple potential bidders. In a secondary buyout, the final purchaser pays the full price at the exit, providing certainty to the selling party regarding the returns achieved compared to an IPO. Additionally, selling to another private equity firm often expedites the selling process, which is particularly advantageous when GPs are under exit pressure and seeking to realize their investments swiftly. According to Jenkinson and Sousa (2015), private equity firms are highly motivated to sell portfolio firms with high returns, minimal risk, and minimal delays in receiving proceeds from the sale, and secondary buyouts are likely to fulfill these objectives.
Furthermore, the selection of an appropriate exit route is heavily contingent on the characteristics of the individual portfolio company, with some being better suited to specific strategies. Pagano et al. (1998) demonstrate that larger companies are more likely to opt for an IPO as their exit route. Sudarsanam (2005) supports this finding, suggesting that firms should attain a certain threshold size to exit publicly. Larger firms are better equipped to handle fixed costs and are more visible to public investors. On the other hand, highly profitable companies requiring less monitoring are more inclined to choose a public listing as their exit route. In contrast, larger but less profitable companies are more prone to be sold to strategic buyers. Consequently, Sudarsanam (2005) posits that smaller portfolio firms with relatively lower margins and higher monitoring needs are more likely to utilize a strategic sale as their exit strategy. Jenkinson and Sousa (2015) discovered that smaller companies exhibiting robust growth are more inclined to opt for a strategic buyer as their exit route. Moreover, the attractiveness of a secondary-buyout route increases for companies with healthier margins. Given the highly leveraged structure of private equity-owned companies, such firms must generate sufficient cash flows and maintain robust margins to manage the debt and interest obligations associated with a subsequent leveraged buyout (Jenkinson and Sousa 2015).
The selection of an exit route in private equity is influenced by both market characteristics and the potential exit pressure faced by the firms. Despite this, most private equity investments are supported by a predetermined operation plan and a clear exit strategy (Gompers et al. 2015; Klier et al. 2009). Private equity firms devise a predetermined operational plan for each portfolio company, which may involve decisions related to organic or inorganic growth strategies. The unique characteristics of individual portfolio companies and their operational plans can significantly impact the chosen exit route. For instance, it has been argued that larger firms are better equipped to handle the higher fixed costs associated with an IPO and are more visible to investors (Pagano et al. 1998). Nikoskelainen and Wright (2007) support this notion, finding that larger portfolio companies are more likely to pursue a public listing as their exit route. Additionally, as buy-and-build strategies gain momentum through the execution of add-on acquisitions, they are more likely to increase the likelihood of an IPO (Hammer et al. 2017). Conversely, Bienz and Leite (2008) propose that the monitoring needs of the portfolio company influence the choice of exit. IPOs are associated with fewer monitoring requirements due to their dispersed ownership structure. Firms with higher monitoring needs benefit from large shareholders, which facilitates decision-making processes. Given the potential ongoing integration processes and the value of add-ons not immediately reflected in terms of profitability, buy-and-build strategies may require additional monitoring. Consequently, these additional monitoring needs could decrease the likelihood of an IPO being chosen as the exit route for buy-and-build strategies. In summary, the route of exit in private equity is influenced by various factors, including the company’s size, operational plan, and monitoring needs, all of which must be considered when devising an appropriate exit strategy. Based on the above discussion, we formulate the following hypotheses:
Ha4:
The average holding period differs across different exit routes adopted by VC funds.
Ha5:
The average return multiple differs across different exit routes adopted by VC funds.
Furthermore, the proliferation of buyout funds in the market has driven private equity firms to develop distinct capabilities and specialize in specific sizes and industries. As highlighted by Jenkinson and Sousa (2015), increased heterogeneity among potential financial buyers raises the likelihood of a financial buyout. Particularly, when a platform experiences growth in size or expands into different industries through follow-on acquisitions, this enhances the attractiveness of a financial buyout. Hammer et al. (2017) also establish a correlation between financial buyouts and add-on acquisitions, providing two hypotheses to explain this relationship. Firstly, they propose the complementary skill hypothesis, where add-on acquisitions increase the probability of a financial buyout once the buy-and-build strategy is completed, allowing the subsequent owner to focus on other value-creation measures. Secondly, Hammer et al. (2017) present the continuation hypothesis, suggesting that the subsequent private equity owner can exploit the remaining potential for acquisitions and continue the buy-and-build strategy. These factors contribute to the evolving landscape of private equity firms, with specialization and strategic differentiation becoming key factors in successful financial buyouts.
3. Data and Methodology
3.1. Data
The variables utilized in the analysis to examine the proposed hypotheses were acquired from the database, Venture Intelligence. The database encompasses exit transactions conducted by many venture capital investors across diverse investee organizations in India, spanning from January 2004 to March 2021.
Between the time period of January 2004 and March 2021, a cumulative sum of 632 transactions was recorded, with a total value of USD 8842 million. Despite the presence of extensive transaction data, numerous transactions were found to have missing fields. After applying suitable filters, a total of 221 exit transactions were selected for analysis. These transactions were specifically chosen due to their complete data regarding the industry affiliation of the firm, the type of venture capital fund involved, return multiple, holding period, and the exit routes employed.
A total of 221 exit transactions were observed, involving 201 distinct entities, with a cumulative value of USD 3883 million. Out of the total of 221 transactions, 51 transactions were conducted in the stock market involving 48 different companies. The cumulative value of these transactions amounted to USD 1245 million, encompassing exits made through initial public offerings (IPOs) as well as transactions carried out in the open market. A total of 164 exit transactions were conducted through the off-market route, involving 153 entities and resulting in a cumulative value of USD 2638 million. The aforementioned transactions were related to strategic sales, secondary sales, and buybacks. The subsequent sections provide descriptive data for each variable.
3.2. Methodology
The present study employs four non-parametric tests like Kendall’s tau-b, Mann–Whitney U, Kruskal–Wallis H, and Tukey post hoc tests to examine the dynamics among holding period, return multiple, fund types, and exit routes. The non-normal distribution of key variables, such as holding periods, return multiples, and CAGR, as indicated by their skewed distribution, necessitated the utilization of non-parametric statistical tests in our analysis. Hence, the Mann–Whitney U test and the Kruskal–Wallis Test are employed for comparative assessments. Despite the relatively small sample size, it remained sufficient for conducting comparative analyses using the chosen statistical methods. Non-parametric tests were preferred in this context, as they do not rely on distribution assumptions, making them more appropriate for skewed data samples like VC-exit-returns data, even though they may be considered less efficient compared to their parametric counterparts.
3.2.1. Kendall’s Tau-B Test
We employ Kendall’s tau-b (τb) to measure the strength and direction of association that exists between the holding period and return multiples. Kendall’s tau-b stands as an ordinal association metric, founded on the evaluation of concordant and discordant pairs. It evaluates the extent of a monotonic relationship and proves advantageous in instances of data containing ties. Its nonparametric nature becomes apt when data violate normality assumptions. This was pertinent in the context of the dataset, where the correlation between holding period and return multiples exhibited a non-linear pattern, accompanied by skewed distribution. Essentially, Kendall’s Tau computes the disparity between concordant and discordant pairs, normalized by the total pair count. The conventional expression of Kendall’s Tau is manifested in the Tau-B statistic, which appropriately considers instances where observed pairs possess identical values in either x or y as being neither concordant nor discordant.
- , where is the data size
- number of concordant pairs
- number of discordant pairs
- , where = number of x values tied at value
- , where = number of y values tied at value
In order to avoid the quadratic complexity, the above equation can be rearranged in the (n)log(n) formulation.
- defined as above
- , where = number of (x, y) values tied at both values
- number of swaps to re-sort x-sorted pairs by y.
3.2.2. Mann–Whitney U Test
As the next level of investigation, the nonparametric Mann–Whitney U test, a statistical examination that refrains from imposing distributional assumptions, was chosen to scrutinize the variations in the distribution of holding periods, return multiples, and CAGR between India-dedicated and foreign funds. Due to the non-normal distribution characteristics exhibited by the holding periods, return multiples, and CAGR, the adoption of the Mann–Whitney U test was a judicious choice to evaluate the associated hypotheses. The Mann–Whitney test uses a normal approximation method to determine the p-value of the test.
The alternative hypotheses are as follows:
where,
- w = Mann–Whitney test statistics
- ∂ = size of sample 1
- ω = size of sample 2
- η1 = median of sample 1
- η2 = median of sample 1
- k = min (w, − w)
3.2.3. Kruskal-Wallis H and Tukey Post Hoc Test
The Kruskal–Wallis H test, operating on ranks and devoid of parametric constraints, offers a means to discern potential statistically significant distinctions among multiple groups of an independent variable concerning a continuous or ordinal dependent variable. This test, akin to an extension of the Mann–Whitney U test accommodating more than two independent groups, stands as a nonparametric counterpart to the one-way ANOVA. It furnishes insights into the global influence of the independent variable on the dependent variable, while the determination of pairwise differences among groups remains beyond its scope. Employing the Kruskal–Wallis H test facilitates the identification of potential disparities in return multiples across various exit strategies, enabling the scrutiny of potential differences in return multiples across diverse exit routes.
The test statistic is given by:
where,
- N = total number of observations across all groups
- g = is the number of groups
- = is the number of observations in group i
- = is the rank (among all observations) of observation j from group i
- = is the average rank of all observations in group i
- = is the average of all the .
Given the necessity to explore all feasible pairwise contrasts, the application of the Tukey post hoc test was deemed appropriate. The fundamental principle underlying the Tukey HSD (Honestly Significant Difference) test centers on the largest divergence between the means of two distinct groups. This test’s utility extends beyond statistical significance evaluations, incorporating confidence intervals for mean disparities in each comparison. Tukey’s test facilitates the comparison of treatment means across all groups and stands as the preferred methodology when unequal sample sizes or the inclusion of confidence intervals are essential considerations. The pertinent statistical parameter (q) is defined as follows:
where Ømax and Ømin are the larger and smaller means of the two groups being compared, SE (standard error) = , and n = the size of each of the group samples. The statistic q has a distribution called the studentized range q, and the critical values for this distribution are presented in the Studentized Range q Table based on the values of α, k (the number of groups).
4. Results and Discussions
4.1. Holding Period and Return Multiple
It is usually assumed that, as the time period increases, the return from investments is also likely to increase. Our study purports to analyze the relationship between the holding period, which is calculated as the time period in years between the date of investment and exit, and the return multiple received at the exit. To test this relationship, Kendall’s tau-b test is conducted as the relationship between the holding period and return multiples is not linear. Table 1 shows that there exists a positive monotonic association between the holding period and return multiples, and thus we reject the null hypothesis. As the holding period increases, the return multiple also increases. Kendall’s tau-b correlation coefficient (τb = 0.226) suggests a medium association. However, the analysis does not imply that, even if the return multiples generally increase with the time period of investments, the investment is able to keep on increasing its value or losing value. To empirically test this, we formulate the null hypothesis that there is no association between the holding period and the CAGR of the investment. CAGR is a more refined and widely used statistic to calculate the return on investment than the return multiple. For the next level of analysis also, we use Kendall’s tau-b test, as the relationship between the holding period and CAGR is not linear. The results from Table 1 indicate that there is a negative monotonic association between the holding period and CAGR. Kendall’s tau-b correlation coefficient (τb = −0.179) suggests a medium association indicates that as the holding period increases, the CAGR decreases. Therefore, we reject the null hypothesis, and the analysis implies that, even if the return multiples generally increase with the time period of investments, the investment loses its value when invested over a longer period of time. Hence, the investors need to find out the optimal time to exit to avoid the destruction of investment value.

Table 1.
Kendall’s tau-b test. This table reports the correlation analysis results between the holding period and return multiple. Kendall’s tau-b test 2 is conducted to examine whether the investment loses its value when invested over a longer period of time.
This result points to the earlier VC studies, which discuss the liquidity of the VC market. Most of the exits occur within 2–3 years of investment, and once it crosses 5–6 years, the probability of staying invested is almost 70% in the Indian VC market (Dominic and Gopalaswamy 2019). The study pointed out that, if the exit did not happen within the initial few years, there was almost a 70% probability that it would not happen in the near future, indicating that the investment was becoming illiquid. Many of the investments that are un-exited stay invested not because the investee firms are ‘peaches’, but because of the lack of exit opportunities, and the value of those investments in these ‘lemons’ slowly deteriorates in time, which explains the negative relationship between the investment duration and holding period return (Dominic and Gopalaswamy 2022).
4.2. Holding Period and Exit Routes
In this segment, we examine the average holding periods for various exit routes and investigate whether these holding periods differ significantly. The holding period for an investment is a crucial indicator of investor behavior and the investment market dynamics. The primary objective is to determine whether these exit routes exhibit significant differences in holding periods. The study explores the average holding periods across five common exit routes: strategic sale, secondary sale, buyback, IPO, and open market transactions (please see Table 2).
Table 2.
This table shows the average holding periods across five common exit routes: strategic sale, secondary sale, buyback, IPO, and open market transactions.
The average holding period for each investment was calculated by measuring the time elapsed between the investment entry and exit. The dataset was then divided into groups based on the exit routes. The findings in Table 2 indicates notable variations in average holding periods across different exit routes. The average holding periods (in years) for each exit route are as follows: strategic sale (3.7 years), secondary sale (4.9 years), buyback (3.8 years), IPO (4.2 years), and open market transaction (6.5 years). Statistical analysis revealed that the average holding periods were significantly different among the exit routes (p < 0.05).
The observed discrepancies in holding periods across various exit routes suggest that different factors may be influencing investor decisions. One possible explanation is the level of investor confidence in a particular investment. Investments with longer holding periods may indicate higher investor confidence, while shorter holding periods may imply less confidence or a desire to promptly capitalize on favorable market conditions. Another contributing factor could be the abundance of exit opportunities within a specific exit route. Exit routes offering more exit opportunities may lead to shorter holding periods as investors can capitalize on favorable market conditions or strategic sale opportunities. Additionally, legal restrictions, changing market conditions, or fluctuations in company valuations could also play a role in determining holding periods. Investments facing obstacles in exiting profitably may result in longer holding periods as investors wait for favorable conditions. A comprehensive understanding of the factors influencing holding periods can enhance investment decision-making and contribute to more informed and successful investment strategies.
Further, the normality of the holding period across different exit route categories was tested using the Shapiro–Wilk test and analyzing the histograms. Additionally, four outlier data points were identified through box plots, warranting further investigation. A one-way ANOVA test was conducted initially, excluding the outliers, and then repeated with their inclusion. Surprisingly, the test results remained unaffected in both cases. Consequently, the results from the one-way ANOVA, considering all the data points, were utilized for hypothesis-testing. The primary objective of the one-way ANOVA was to ascertain whether the total period stayed invested varied significantly for different exit routes. The exits were classified into five distinct groups: strategic sale (n = 65), secondary sale (n = 72), buyback (n = 27), IPO (n = 8), and open market transactions (n = 43). Prior to conducting the ANOVA, the data distribution for each group was assessed using the Shapiro–Wilk test, and the assumption of normality was satisfied, as indicated by p-values greater than 0.05. Moreover, the assumption of homogeneity of variances was validated using Levene’s test of homogeneity of variances, resulting in a non-significant p-value of 0.324. This confirmed that the variances across the exit route categories were approximately equal. The one-way ANOVA results from Table 3 reveal statistically significant differences between the exit routes concerning the average holding period, as denoted by F (4, 216) = 8.627, with a p-value less than 0.0005. This suggests that at least one of the exit routes significantly differs from the others in terms of the average holding period before exit.
Table 3.
This table depicts the result of the one-way ANOVA test conducted to determine whether the total holding period was different for exits through different exit routes or not.
Based on the results obtained from the one-way ANOVA, Table 3, the null hypothesis that the average holding period before exit is the same across different exit routes is rejected. Consequently, the alternative hypothesis is accepted, indicating that the average holding periods significantly differ among the various exit routes. These findings provide valuable insights into investor behavior and decision-making processes within different exit strategies, facilitating informed investment choices in the future. However, it is essential to acknowledge that other unexplored variables may also contribute to the observed differences in holding periods, warranting further investigation.
Further, we employ post hoc tests like Tukey’s honestly significant difference (HSD) test to identify specific pairwise differences between the exit routes, offering deeper insights into the observed differences in the invested period across various exit routes. The results of the Tukey test in Table 4 reveal significant disparities in the invested period for open market transactions when compared to all other off-market methods of exits. Specifically, the invested period in open market transactions was found to be significantly higher than that of strategic sale, with a mean difference of 2.7005 and a 95% confidence interval (CI), yielding a p-value of less than 0.0005. Similarly, when compared to secondary sale, the invested period in open market transactions displayed a significantly higher mean difference of 1.4878 (95% CI) and a p-value of less than 0.015. Furthermore, the invested period in open market transactions also surpassed that of buybacks, with a mean difference of 2.3257 (95% CI) and a p-value of less than 0.001. Moreover, the analysis indicated that the invested period in secondary sale was significantly longer than in strategic sale, with a mean difference of 1.2127 (95% CI) and a p-value of less than 0.015. It is important to note that no other group differences were found to be statistically significant, implying that the remaining exit routes did not display substantial variations in the invested period.
Table 4.
This table shows the results of the post hoc tests, Tukey’s honestly significant difference (HSD) test, to identify specific pairwise differences between the exit routes like strategic sale, secondary sale, buyback, IPO, and open market transactions.
These findings shed light on the distinct nature of open market transactions, highlighting that investments exiting through this route tend to have significantly longer holding periods compared to all other off-market exit methods. This may suggest that investors opting for open market transactions exhibit a more patient and long-term investment approach, possibly driven by confidence in the asset’s growth potential or a strategic investment plan. Additionally, the observed longer invested period in secondary sales compared to strategic sales could be indicative of the complexity involved in executing secondary sales or the need for more time to identify suitable buyers. Overall, the post hoc analysis results provide valuable insights into the differences in holding periods among different exit routes. Understanding these variations can inform investors, financial analysts, and policymakers in making well-informed decisions regarding investment strategies and market expectations. However, further research would be beneficial to explore the underlying factors influencing the distinct invested periods in open market transactions and secondary sales compared to other exit routes.
4.3. Holding Period and Type of Funds
In this segment, we test the hypothesis that the average investment period is the same for different types of funds; we first categorized the funds into India-dedicated and foreign funds. Further, we estimated the median holding period for both categories of funds. Median investment periods for India-dedicated and foreign funds are calculated as 4.6 years and 5 years, respectively. The main objective here is to determine whether India-dedicated funds exhibit faster exits than foreign funds. As the distribution of investment periods across the funds was found to be non-normally distributed, to test the above hypothesis, we opted to employ the non-parametric Mann–Whitney U test. Upon visual inspection of Figure 2, the distributions of investment periods appeared to be similar across the different types of funds. Furthermore, the statistical analysis confirmed that there was no statistically significant difference between the median investment period of India-dedicated funds (4.6 years) and foreign funds (4.5 years), with a Mann-–Whitney U value of 5115.5 and a p-value of 0.832.

Figure 2.
Holding period and type of funds. Result of the Mann–Whitney U test to investigate the difference in the distribution of holding periods of India-dedicated vis-à-vis foreign funds. The test was conducted at a significance level of 0.05.
As a result, we failed to reject the null hypothesis, indicating that the average investment periods for India-dedicated and foreign funds are not significantly different. This finding contradicts the common belief that India-dedicated funds tend to have shorter investment periods as part of reputation building, as suggested by the Grandstanding theory. To better understand these results and to strengthen our interpretation, further research is necessary. Specifically, incorporating data on the general partners of the funds and their reputation scores may shed more light on the underlying factors influencing the investment strategies and exit behaviors of India-dedicated and foreign funds. Such additional information could provide valuable insights into the decision-making processes and potential motivations driving the investment periods in India-dedicated and foreign funds.
4.4. Return Multiple and Type of Funds
In the next stage of our analysis, we investigate whether there exist differences in return multiples between India-dedicated and foreign funds. Our study aims to uncover potential disparities in return multiples achieved by India-dedicated and foreign funds. To accomplish this objective, we initially categorized the funds into these two distinct types. The median return multiple for India-dedicated funds was found to be 2.81, while foreign funds exhibited a median return multiple of 2.34. Further, to assess the statistical significance of the difference in return multiples between these two categories of funds, we conduct a Mann–Whitney U test. Visual inspection of the distributions of return multiples for India-dedicated and foreign funds from Figure 3 revealed similarities. The statistical analysis indicated that the median return multiples for India-dedicated funds (2.81) and foreign funds (2.345) were not statistically significantly different, with a Mann–Whitney U value of 4213 and a p-value of 0.06.
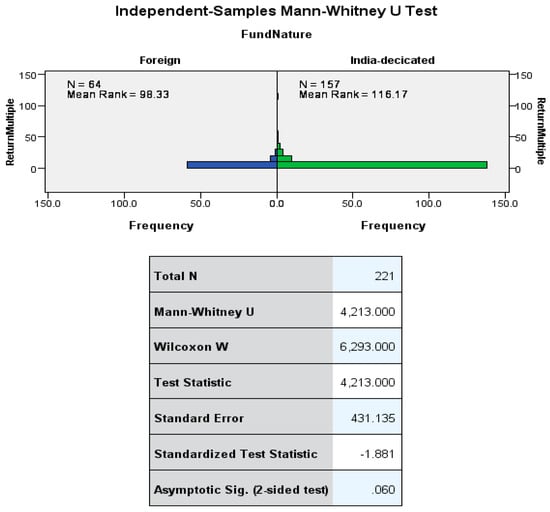
Figure 3.
Return multiple and type of funds. Result of the Mann–Whitney U test to investigate the difference in the distribution of return multiples of India-dedicated vis-à-vis foreign funds. The test was conducted at a significance level of 0.05.
As a result, we failed to reject the null hypothesis, leading us to conclude that there is no significant difference in return multiples between foreign funds and India-dedicated funds. This suggests that both types of funds perform similarly in terms of generating returns when considering return multiples.
Since CAGR is a widely used and recognized method for calculating investment returns, we further examined this measure to ensure the robustness of our findings. The median CAGR for investments in India-dedicated funds was calculated as 24.845%, while for foreign funds, it was 19.826%. Similarly, a Mann–Whitney U test was conducted to compare the CAGR between India-dedicated and foreign funds at a significance level of p = 0.05. The visual inspection of CAGR distributions for both types of funds from Figure 4 suggested similarities. However, the statistical analysis indicated a statistically significant difference in the median CAGR for India-dedicated funds (24.845%) and foreign funds (19.826%), with a Mann–Whitney U value of 4077 and a p-value of 0.028.

Figure 4.
CAGR and type of funds. Result of the Mann–Whitney U test to investigate the difference in the distribution of CAGR of India-dedicated vis-à-vis foreign funds. The test was conducted at a significance level of 0.05.
As a consequence, we rejected the null hypothesis and accepted the alternate hypothesis, which indicates that India-dedicated funds outperform foreign funds significantly in generating returns when measured by CAGR. This may be attributed to their focused approach to establishing country-dedicated funds and their better knowledge of the local market. However, further research is warranted to delve into the underlying reasons for the competitive edge of India-dedicated funds. Additional studies could provide valuable insights into the factors contributing to their superior performance in the realm of investment returns. Exploring factors such as their specific investment strategies, local market expertise, and any other distinctive characteristics may shed light on the underlying drivers of their superior performance.
4.5. Return Multiple and Different Exit Routes
In the final phase of our research, we investigate potential differences in return multiples among various exit routes used by the funds. The primary objective is to uncover any disparities in the return multiples achieved through different exit strategies. To achieve this, we initially categorized the funds based on their exit routes, including strategic sale, secondary sale, buyback, IPO, and open market transactions. To begin, we calculated the median return multiples for each exit route and aimed to determine whether these return multiples differed significantly across the various exit routes. Table 5 reveals that median return multiples were highest for investments exiting through open market transactions (4), followed by secondary sales (3.2). Conversely, the lowest return multiples were observed for exits through buybacks (1.6).
Table 5.
This table shows the results of the different exit routes and median return measured in terms of return multiple and CAGR.
To assess the significance of the differences in return multiples among the five exit routes, a Kruskal–Wallis test was conducted. Visual inspection of a box plot in Figure 5 indicated that the distributions of return multiples were similar for all exit routes. The Kruskal– Wallis test results revealed a statistically significant difference in median return multiples between the various exit routes (χ2(4) = 26.352, p < 0.0005).
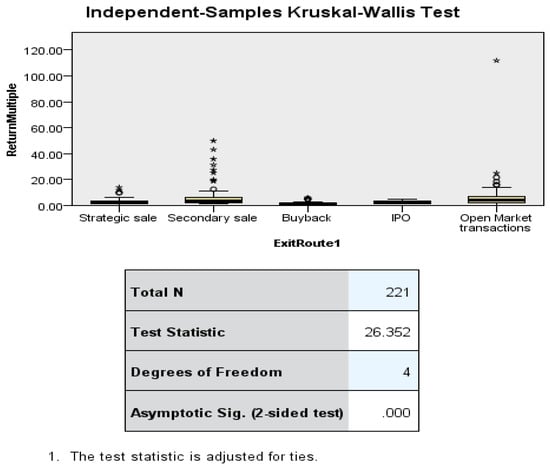
Figure 5.
Return multiple and different exit routes. Result of the Kruskal–Wallis test to investigate the difference in the differences in return multiples among the five exit routes. The test was conducted at a significance level of 0.05. Circle denotes outlier, and the asterisk denotes extreme outlier.
As a robustness check, we calculated the median CAGR for each exit route and explored whether there were any variations in CAGR across different exit routes. Additionally, we aimed to identify which exit route achieved the highest average CAGR and which scored the lowest. Our analysis indicates that the median CAGR was highest for secondary sales (29%), followed by open market transactions (23%), with both scoring equally. The lowest CAGR was observed for exits through buybacks (18.9%). A Kruskal–Wallis test was then performed to determine whether there were differences in CAGR between the five exit routes. Similar to the analysis of return multiples, visual inspection of a box plot in Figure 6 showed that the distributions of CAGR were similar for all exit routes. However, the Kruskal–Wallis test results indicated that the median CAGR was not statistically significantly different across the various exit routes (χ2(4) = 9.307, p < 0.054).
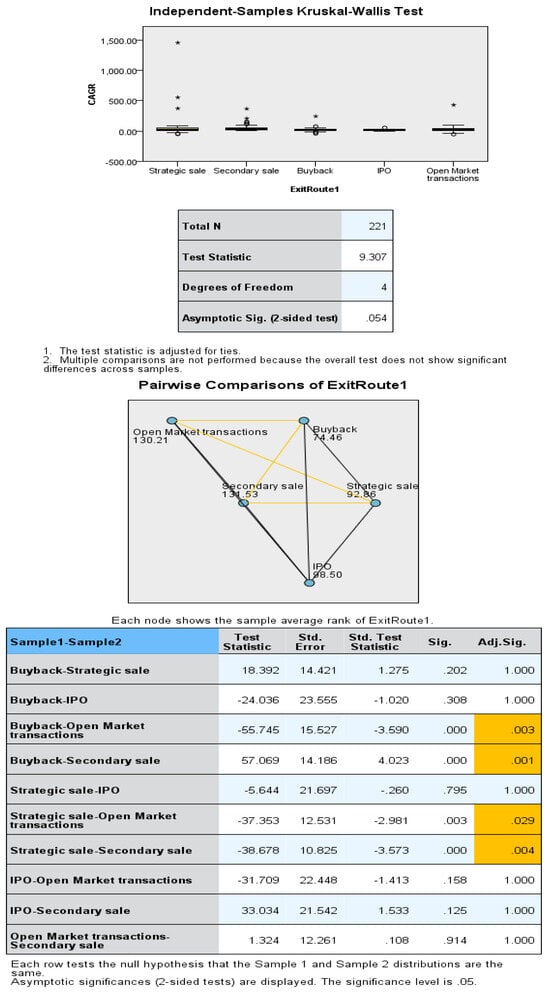
Figure 6.
CAGR and different exit routes. Result of the Kruskal–Wallis test to investigate the difference in the differences in CAGR among the five exit routes. The test was conducted at a significance level of 0.05.
This finding contrasts with the results obtained from the analysis of return multiples. While the return multiples differed significantly across the exit routes, the CAGR, which is a more standardized and popular measure of return on investment, did not show significant differences. This suggests that investors tend to liquidate their investments once they perceive a lack of growth potential and aim to secure a required return on their investment. Furthermore, the findings suggest that all exit routes can potentially yield similar results, contrary to the prevailing belief that certain exit routes guarantee superior returns. Ultimately, the availability of sufficient exit opportunities appears to play a more decisive role in achieving favorable returns than the specific exit route chosen.
5. Conclusions
In this study, we examine the dynamics of VC and PE investments in India, focusing on the inter-dynamics between factors such as holding period, return multiple, fund types, and exit routes. For this purpose, we use an extensive dataset encompassing exit transactions executed by venture capital investors across a diverse array of investee organizations in India. The data spanned from January 2004 to March 2021 and was meticulously sourced from the Venture Intelligence database. After subjecting the data to rigorous filters, a total of 221 exit transactions emerged as the focal points for analysis. These transactions were deliberately selected based on their comprehensive data coverage, encompassing crucial parameters such as industry affiliations of the firms, venture capital fund categorizations, return multiples, holding periods, and the specific exit strategies employed. The analytical approach adopted in this study entailed the utilization of four non-parametric tests, namely Kendall’s tau-b, Mann–Whitney U, Kruskal–Wallis H, and Tukey post hoc tests. These tests were employed to unravel the intricate relationships among variables such as holding periods, return multiples, fund typologies, and the various exit routes undertaken. The results gleaned from our comprehensive analysis offer valuable insights into the dynamics of these variables. Notably, our findings underscore a negative monotonic correlation between holding periods and CAGR. This suggests that, while return multiples might generally experience an upward trajectory as the investment duration extends, the prolonged holding of investments could lead to the diminishment of investment value. This underscores the imperative for investors to ascertain an optimal exit timeframe to preserve the value of their investments.
Moreover, our analysis uncovers noteworthy disparities in average holding periods across distinct exit routes. The study also reveals that the average holding periods between India-dedicated and foreign funds exhibit no statistically significant differences. However, in terms of generating returns as measured by CAGR, India-dedicated funds notably outperform foreign funds significantly. It is pertinent to highlight that, while return multiples exhibit substantial disparities across varying exit routes, the CAGR—a standardized and widely recognized metric for gauging return on investment—does not reveal significant differences. This implies that investors are inclined to divest from their investments when growth potential appears limited, with a primary objective of achieving their stipulated return targets. In summary, the outcomes of this research challenge the prevailing notion that specific exit routes assure superior returns. Instead, our findings suggest that various exit strategies hold the potential to yield comparable outcomes. This research significantly contributes to the understanding of exit dynamics in venture capital investments, providing valuable insights for investors, practitioners, and policymakers alike. The knowledge gleaned from this study can guide investment decisions and strategic planning by shedding light on the multifaceted interplay of factors impacting investment success within the context of exit transactions.
Even though our study uncovers the inter-dynamics between factors such as holding period, return multiple, fund types, and exit routes of different exit transactions, a comprehensive understanding of the factors influencing holding periods can enhance investment decision-making and contribute to more informed and successful investment strategies. Moreover, in light of the finding that the average investment periods for India-dedicated and foreign funds are not significantly different, further research is necessary to strengthen our interpretation. Specifically, incorporating data on the general partners of the funds and their reputation scores may shed more light on the underlying factors influencing the investment strategies and exit behaviors of India-dedicated and foreign funds. Such additional information could provide valuable insights into the decision-making processes and potential motivations driving the investment periods in India-dedicated and foreign funds. Furthermore, to substantiate the finding that India-dedicated funds outperform foreign funds significantly in generating returns when measured by CAGR, further research is warranted to delve into the underlying reasons for the competitive edge of India-dedicated funds. Additional studies could provide valuable insights into the factors contributing to their superior performance in the realm of investment returns. Exploring factors such as their specific investment strategies, local market expertise, and any other distinctive characteristics may shed light on the underlying drivers of their superior performance.
Author Contributions
Conceptualization, J.D.; methodology, J.D.; validation, A.J.; formal analysis, J.D.; writing—original draft preparation, A.J.; writing—review and editing, A.J. All authors have read and agreed to the published version of the manuscript.
Funding
This research received no external funding.
Data Availability Statement
The data are sourced from a paid database and are not publicly available.
Conflicts of Interest
The authors declare no conflict of interest.
References
- Acharya, Viral V., Oliver F. Gottschalg, Moritz Hahn, and Conor Kehoe. 2013. Corporate governance and value creation: Evidence from private equity. The Review of Financial Studies 26: 368–402. [Google Scholar] [CrossRef]
- Arcot, Sridhar, Zsuzsanna Fluck, José-Miguel Gaspar, and Ulrich Hege. 2015. Fund managers under pressure: Rationale and determinants of secondary buyouts. Journal of Financial Economics 115: 102–35. [Google Scholar] [CrossRef]
- Axelson, Ulf, Per Strömberg, and Michael S. Weisbach. 2009. Why are buyouts levered? The financial structure of private equity funds. The Journal of Finance 64: 1549–82. [Google Scholar] [CrossRef]
- Bansraj, Dyaran S., Han T. Smit, and Vadym Volosovych. 2019. Can Private Equity Act as Strategic Buyers? Evidence from Serial (Buy-and-Build) Strategies. In FMA European Conference. Amsterdam: Tinbergen Institute, pp. 12–14. [Google Scholar]
- Bienz, Carsten, and Tore E. Leite. 2008. A Pecking Order of Venture Capital Exits. Available online: https://papers.ssrn.com/sol3/papers.cfm?abstract_id=916742 (accessed on 6 June 2023).
- Cao, Jerry, and Josh Lerner. 2009. The performance of reverse leveraged buyouts. Journal of Financial Economics 91: 139–57. [Google Scholar]
- Cochrane, John H. 2005. The risk and return of venture capital. Journal of Financial Economics 75: 3–52. [Google Scholar] [CrossRef]
- Cumming, Douglas J., and Jeffrey G. MacIntosh. 2003. A cross-country comparison of full and partial venture capital exits. Journal of Banking and Finance 27: 511–48. [Google Scholar] [CrossRef]
- Cumming, Douglas J., and Sofia A. Johan. 2013. Venture Capital and Private Equity Contracting: An International Perspective. New York: Academic Press. [Google Scholar]
- Cumming, Douglas, and Uwe Walz. 2010. Private equity returns and disclosure around the world. Journal of International Business Studies 41: 727–54. [Google Scholar] [CrossRef]
- Cumming, Douglas, April Knill, and Kelsey Syvrud. 2016. Do international investors enhance private firm value? Evidence from venture capital. Journal of International Business Studies 47: 347–73. [Google Scholar] [CrossRef]
- Cumming, Douglas, Grant Fleming, and Jo-Ann Suchard. 2005. Venture capitalist value-added activities, fundraising and drawdowns. Journal of Banking and Finance 29: 295–331. [Google Scholar] [CrossRef]
- Dai, Na, Hoje Jo, and Sul Kassicieh. 2012. Cross-border venture capital investments in Asia: Selection and exit performance. Journal of Business Venturing 27: 666–84. [Google Scholar] [CrossRef]
- Degeorge, Francois, Jens Martin, and Ludovic Phalippou. 2016. On secondary buyouts. Journal of Financial Economics 120: 124–45. [Google Scholar] [CrossRef]
- Dominic, James. 2021. Is it Always Necessary to Time the Exit? Insights from Indian Venture Capital Market. IUP Journal of Accounting Research and Audit Practices 20: 1–14. [Google Scholar]
- Dominic, James, and Arun K. Gopalaswamy. 2019. Is the venture capital market liquid? Evidence from India. Global Finance Journal 41: 146–57. [Google Scholar] [CrossRef]
- Dominic, James, and Arun K. Gopalaswamy. 2022. Decoding VC exit returns: The Indian experience. Journal of Indian Business Research 14: 49–64. [Google Scholar] [CrossRef]
- Giot, Pierre, Ulrich Hege, and Armin Schwienbacher. 2014. Are novice private equity funds risk-takers? Evidence from a comparison with established funds. Journal of Corporate Finance 27: 55–71. [Google Scholar] [CrossRef]
- Gompers, Paul A., and Joshua Lerner. 2004. The Venture Capital Cycle. Cambridge, MA: MIT Press. [Google Scholar]
- Gompers, Paul, Steven N. Kaplan, and Vladimir Mukharlyamov. 2015. What Do Private Equity Firms Say They Do? No. w21133. Cambridge, MA: National Bureau of Economic Research. [Google Scholar]
- Guler, Isin, and Mauro F. Guillén. 2010. Institutions and the internationalization of US venture capital firms. Journal of International Business Studies 41: 185–205. [Google Scholar] [CrossRef]
- Hammer, Andreas. 2017. Three Essays on Buy and Build Strategies and Default Probabilities in the Private Equity Industry. Doctoral dissertation, HHL Leipzig Graduate School of Management, Leipzig. [Google Scholar]
- Hammer, Benjamin, Alexander Knauer, Magnus Pflücke, and Bernhard Schwetzler. 2017. Inorganic growth strategies and the evolution of the private equity business model. Journal of Corporate Finance 45: 31–63. [Google Scholar] [CrossRef]
- Harris, Robert S., Tim Jenkinson, and Steven N. Kaplan. 2014. Private equity performance: What do we know? The Journal of Finance 69: 1851–82. [Google Scholar] [CrossRef]
- Higson, Chris, and Rüdiger Stucke. 2012. The Performance of Private Equity. Available online: https://papers.ssrn.com/sol3/papers.cfm?abstract_id=2009067 (accessed on 6 June 2023).
- Jenkinson, Tim, and Miguel Sousa. 2015. What determines the exit decision for leveraged buyouts? Journal of Banking and Finance 59: 399–408. [Google Scholar] [CrossRef]
- Joenväärä, Juha, Juho Mäkiaho, and Sami Torstila. 2022. Prolonged private equity holding periods: Six years is the new normal. The Journal of Alternative Investments 25: 65–93. [Google Scholar] [CrossRef]
- Kaplan, Steven N., and Antoinette Schoar. 2005. Private equity performance: Returns, persistence, and capital flows. The Journal of Finance 60: 1791–823. [Google Scholar] [CrossRef]
- Klier, Daniel O., Martin K. Welge, and Kathryn R. Harrigan. 2009. The changing face of private equity: How modern private equity firms manage investment portfolios. The Journal of Private Equity 12: 7–13. [Google Scholar] [CrossRef]
- Li, Yong, Ilan B. Vertinsky, and Jing Li. 2014. National distances, international experience, and venture capital investment performance. Journal of Business Venturing 29: 471–89. [Google Scholar] [CrossRef]
- Ljungqvist, Alexander, Matthew Richardson, and Daniel Wolfenzon. 2020. The investment behavior of buyout funds: Theory and evidence. Financial Management 49: 3–32. [Google Scholar] [CrossRef]
- Loos, Robert, and Bernhard Schwetzler. 2017. Fueling the buyout machine: Fundraising in private equity. Financial Markets and Portfolio Management 31: 397–443. [Google Scholar] [CrossRef]
- Mäkelä, Markus M., and Markku V. Maula. 2008. Attracting cross-border venture capital: The role of a local investor. Entrepreneurship and Regional Development 20: 237–57. [Google Scholar] [CrossRef]
- Nikoskelainen, Erkki, and Mike Wright. 2007. The impact of corporate governance mechanisms on value increase in leveraged buyouts. Journal of Corporate Finance 13: 511–37. [Google Scholar] [CrossRef]
- Pagano, Marco, Fabio Panetta, and Luigi Zingales. 1998. Why do companies go public? An empirical analysis. The Journal of Finance 53: 27–64. [Google Scholar] [CrossRef]
- Peterman, Scott D., and Doris Lai. 2009. From the Ashes Risen: Private Equity Secondary Funds Take Flight. The Journal of Private Equity 12: 29–34. [Google Scholar] [CrossRef]
- Phalippou, Ludovic. 2008. The Hazards of Using IRR to Measure Performance: The Case of Private Equity. Available online: https://papers.ssrn.com/sol3/papers.cfm?abstract_id=1111796 (accessed on 15 May 2023).
- Pindur, Daniel. 2007. Value Creation Analysis in the Context of the LBO Transaction Model. In Value Creation in Successful LBOs. New York: Springer, pp. 67–124. [Google Scholar]
- Shivdasani, Anil, and Yihui Wang. 2011. Did structured credit fuel the LBO boom? The Journal of Finance 66: 1291–328. [Google Scholar] [CrossRef]
- Stevenson, Howard H., Daniel F. Muzyka, and Jeffry A. Timmons. 1987. Venture capital in transition: A Monte-Carlo simulation of changes in investment patterns. Journal of Business Venturing 2: 103–21. [Google Scholar] [CrossRef]
- Strömberg, Per. 2008. The new demography of private equity. The Global Impact of Private Equity Report 1: 3–26. [Google Scholar]
- Sudarsanam, Puliyur. 2005. Exit Strategy for UK Leveraged Buyouts: Empirical Evidence on Determinants. Available online: https://papers.ssrn.com/sol3/papers.cfm?abstract_id=676849 (accessed on 28 May 2023).
- Valkama, Petri, Markku Maula, Erkki Nikoskelainen, and Mike Wright. 2013. Drivers of holding period firm-level returns in private equity-backed buyouts. Journal of Banking and Finance 37: 2378–91. [Google Scholar] [CrossRef]
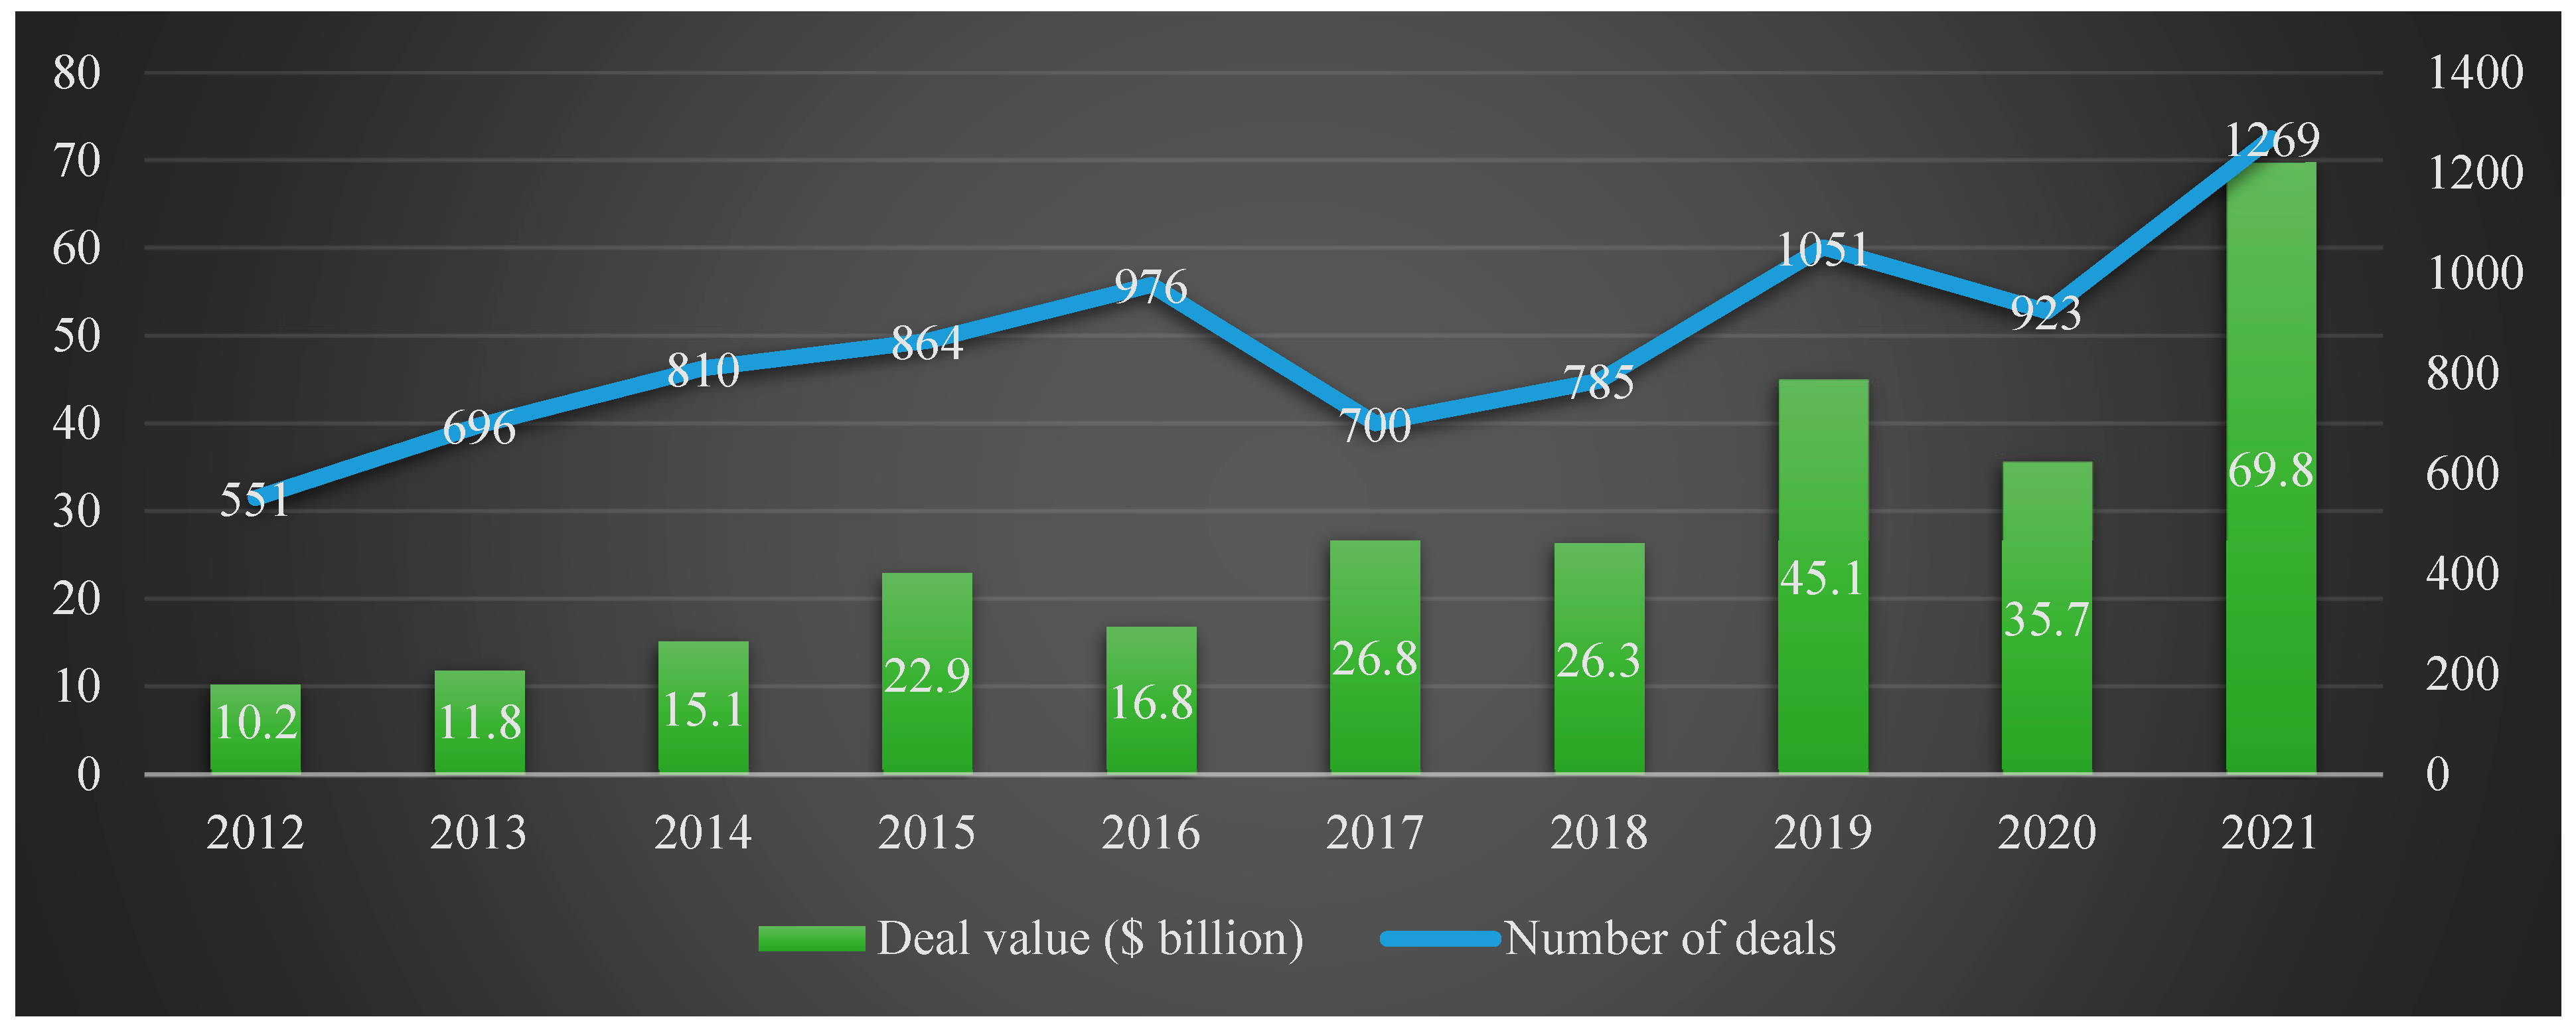
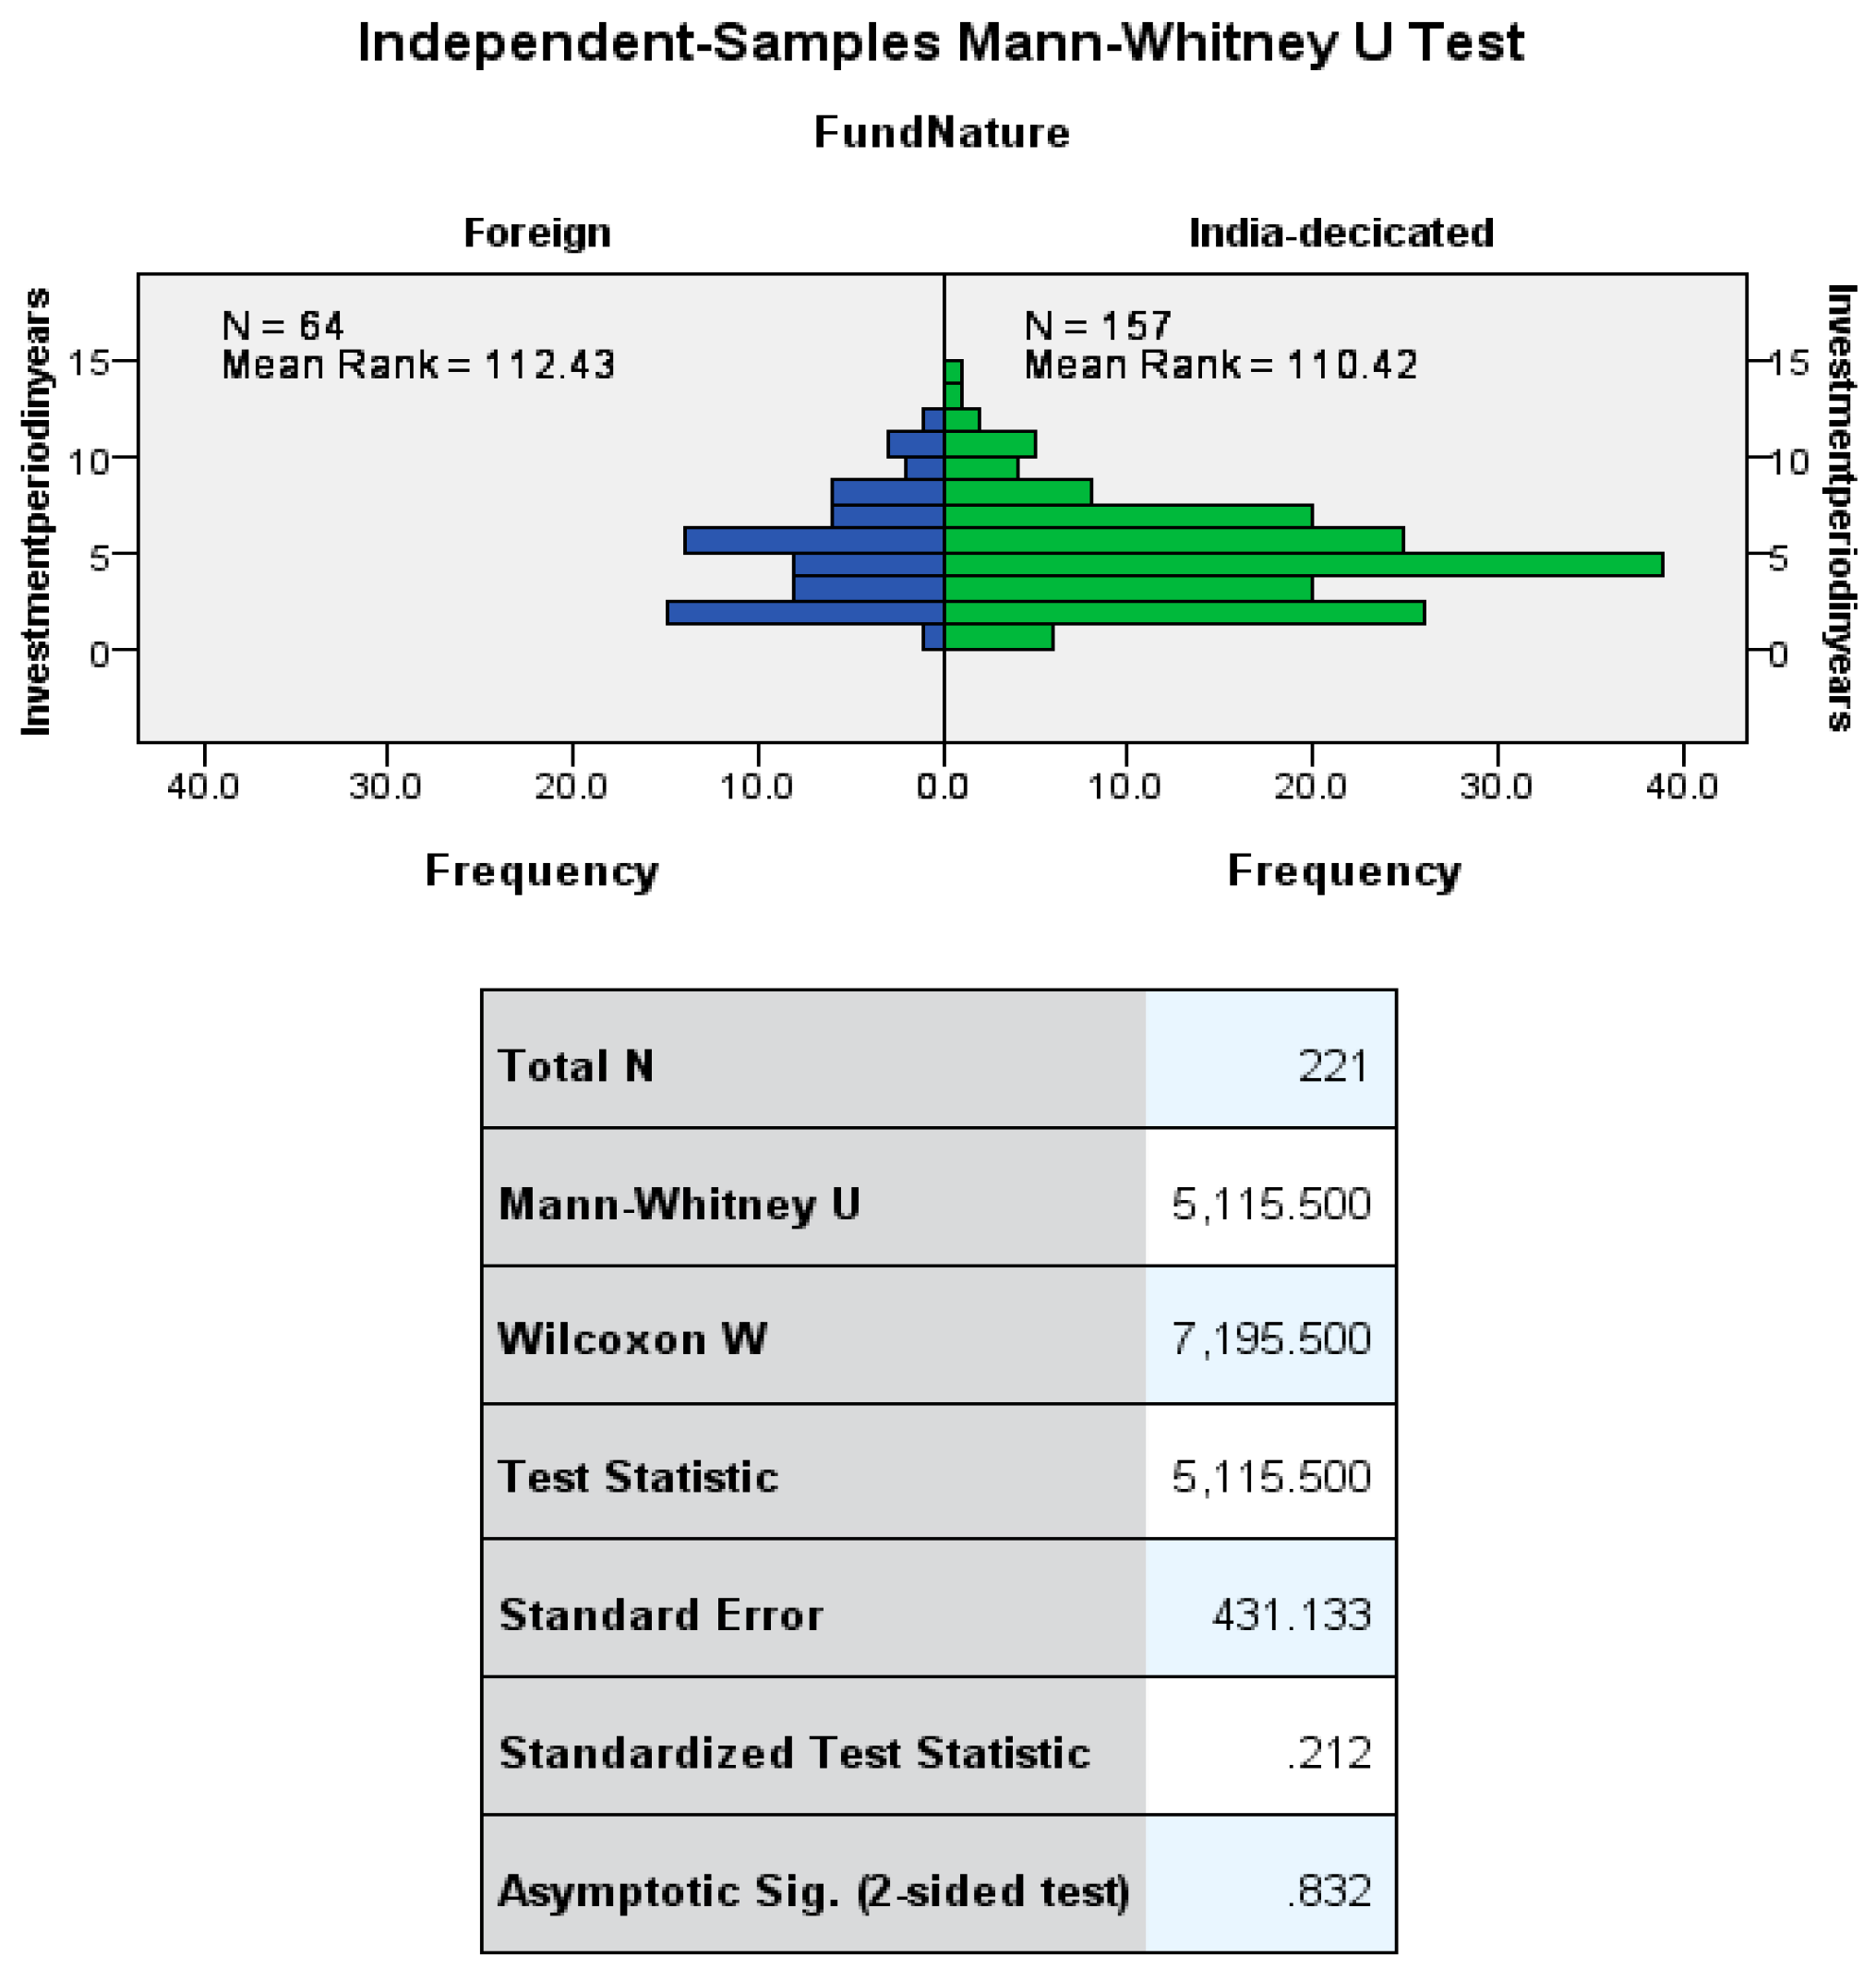
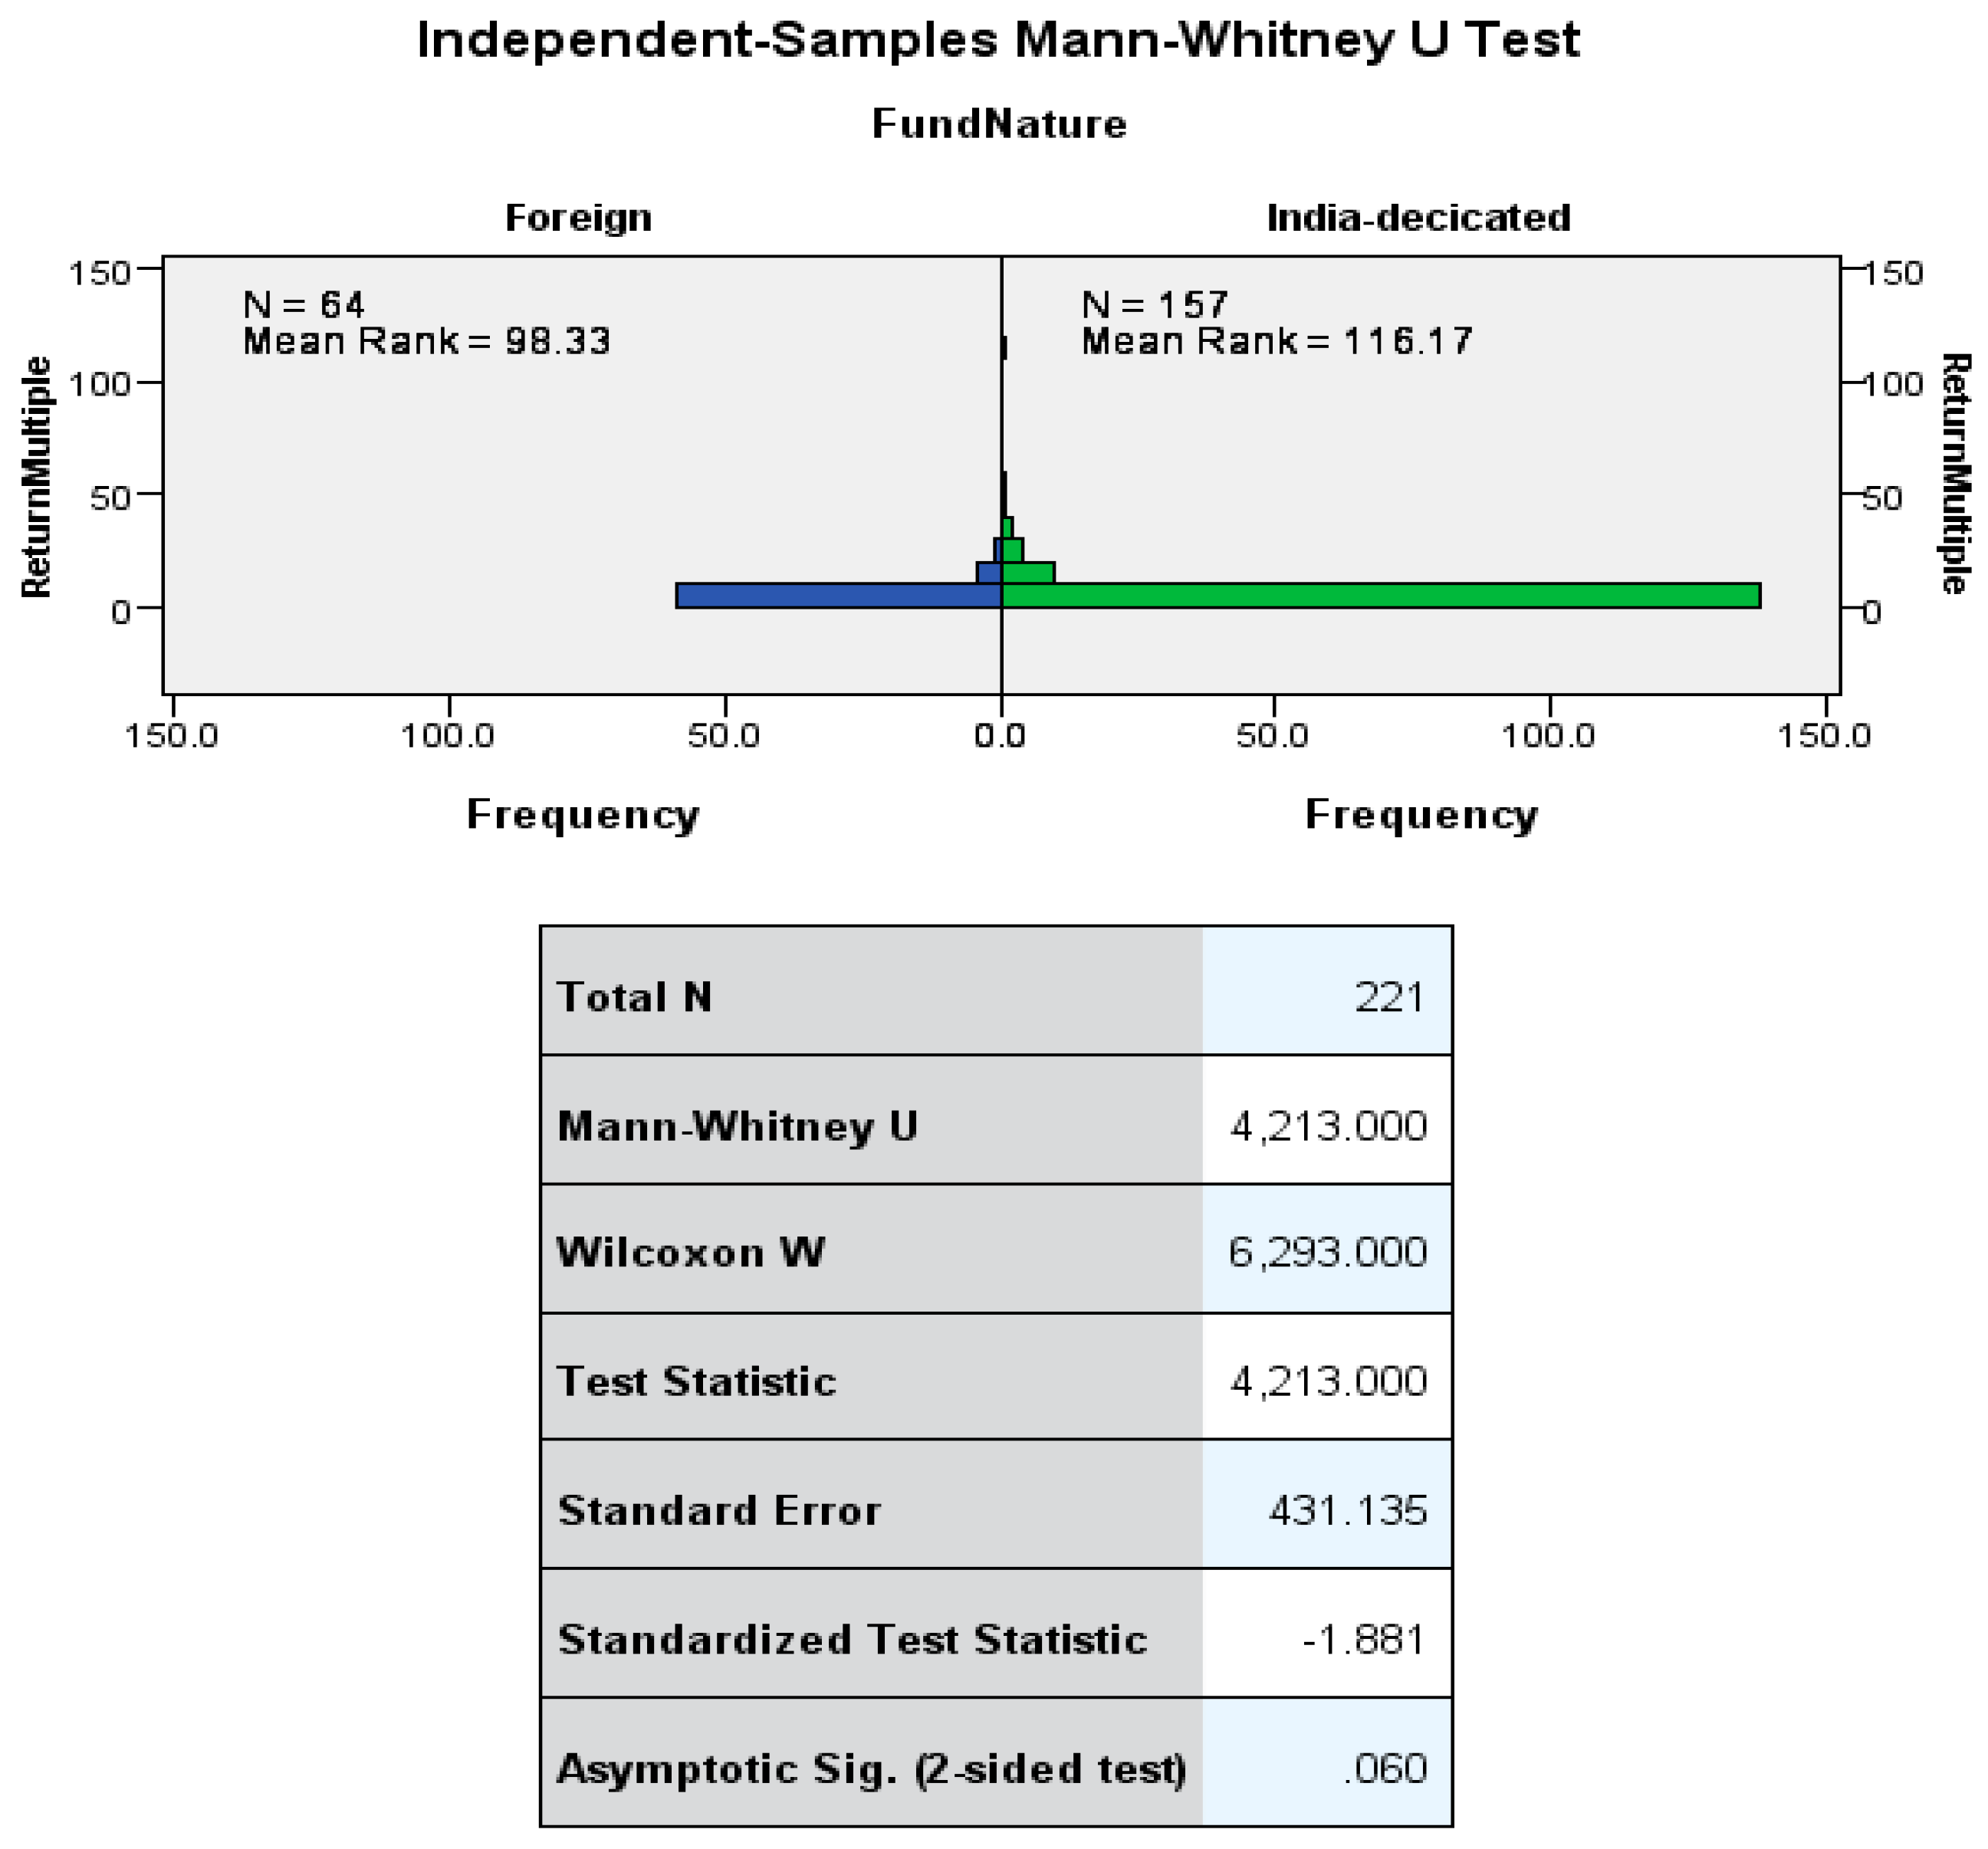
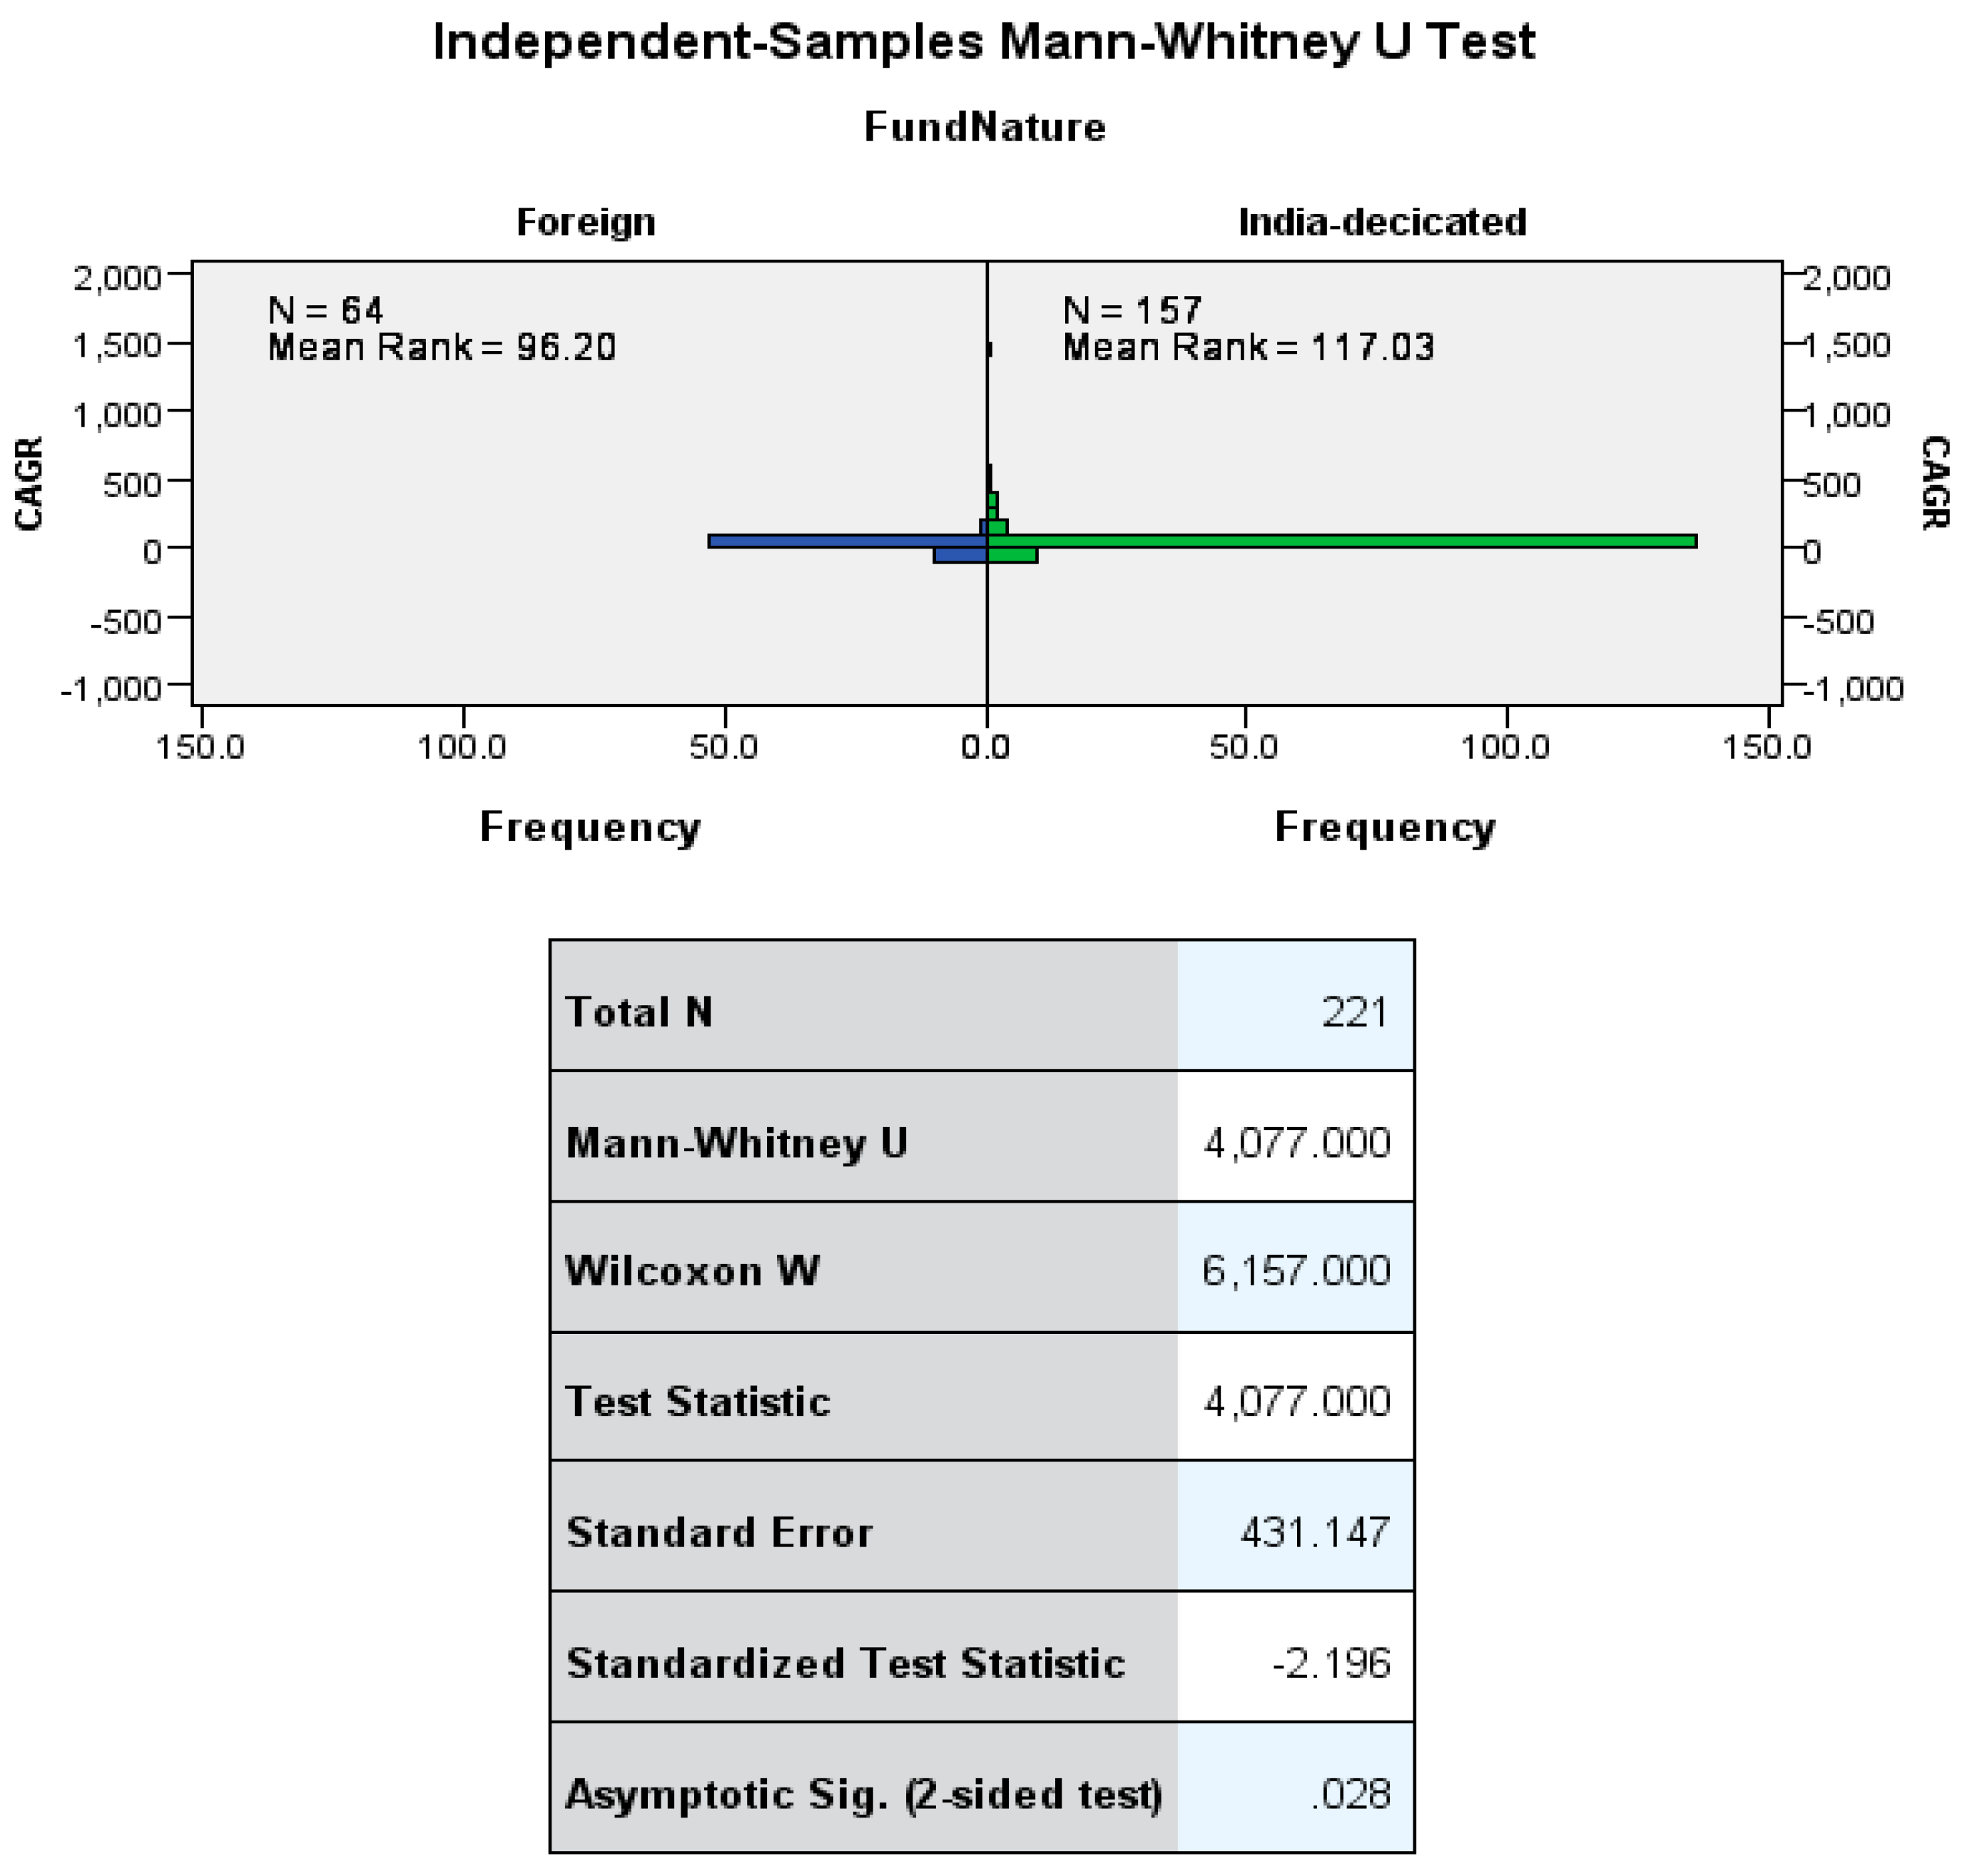
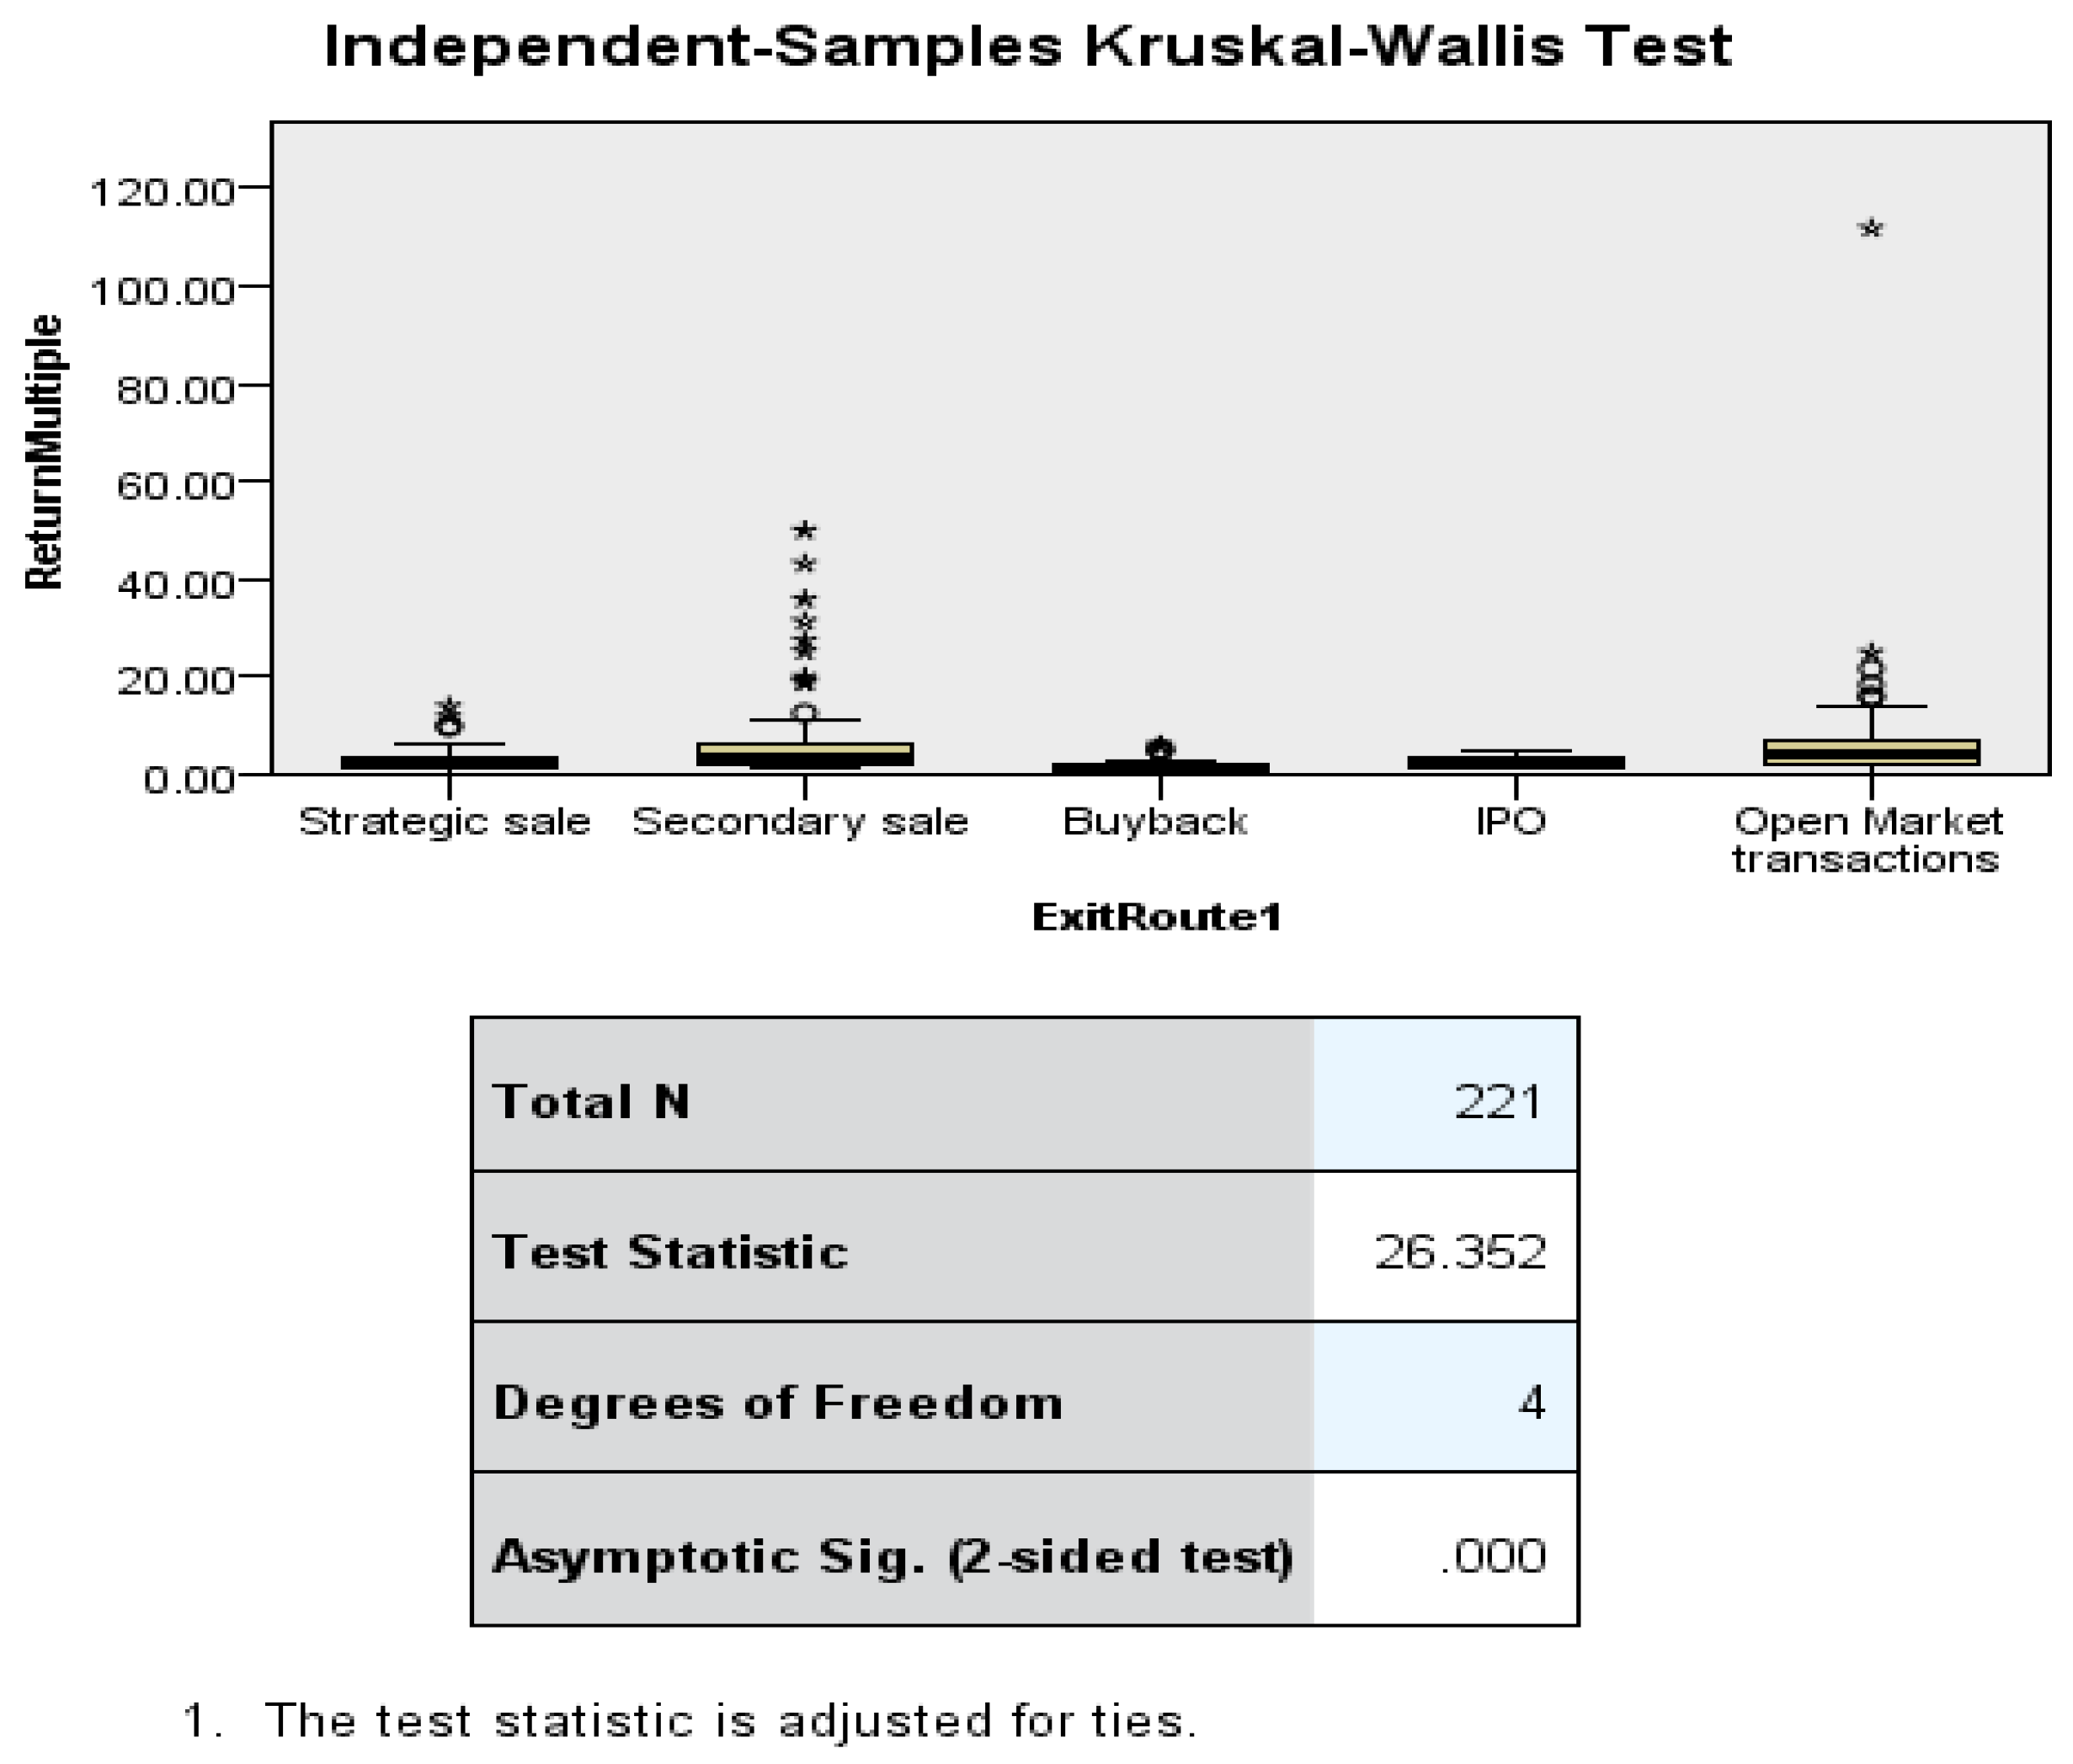

Disclaimer/Publisher’s Note: The statements, opinions and data contained in all publications are solely those of the individual author(s) and contributor(s) and not of MDPI and/or the editor(s). MDPI and/or the editor(s) disclaim responsibility for any injury to people or property resulting from any ideas, methods, instructions or products referred to in the content. |
© 2023 by the authors. Licensee MDPI, Basel, Switzerland. This article is an open access article distributed under the terms and conditions of the Creative Commons Attribution (CC BY) license (https://creativecommons.org/licenses/by/4.0/).