Article

Risk Aversion and Perception of Farmers about Endogenous Risks: An Empirical Study for Maize Producers in Awi Zone, Amhara Region of Ethiopia

1
Department of Agricultural Economics, Injibara University, Injibara P.O. Box 40, Ethiopia
2
Research and Community Service Director, Wolaita Sodo University, Wolaita Sodo P.O. Box 138, Ethiopia
3
School of Graduate Studies, Ethiopian Civil Service University, Addis Ababa P.O. Box 5648, Ethiopia
*
Author to whom correspondence should be addressed.
J. Risk Financial Manag. 2023, 16(2), 87; https://doi.org/10.3390/jrfm16020087
Submission received: 7 October 2022 / Revised: 20 December 2022 / Accepted: 21 December 2022 / Published: 1 February 2023
(This article belongs to the Section Risk)

Abstract

:
Agriculture is a risky business that is subject to endogenous risks. Endogenous risks caused by input utilization, input affordability and input availability may prove detrimental to the production potential of farmers. The study was aimed at examining the risk perception, risk aversion and risk management strategies of maize producers in Awi zone, which is found in the northwest part of Ethiopia. The study involved 343 respondents who produced maize under risk. Descriptive statistics, a seven-point Likert scale, the observed economic behaviour method, factor analysis and a seemingly unrelated regression model were used to process the data. The results showed that farmers have different perceptions of the endogenous risk associated with input availability and input affordability which has a different probability of occurrence and severity of damage. The observed economic behaviour method showed that farmers in the area also have different risk aversion behaviours: about 7.29% of the respondents in the study area have high risk aversion attitudes, while about 30.61% have medium risk aversion attitudes and 62.10% of them have low risk aversion attitudes. The seemingly unrelated regression model output showed that farmers’ economic, social, demographic and institutional factors, as well as their risk behaviour, determine the risk management strategies that they employ. Maize farmers in the area applied human risk management strategies, production risk management strategies, diversification, financial risk management strategies and marketing risk management strategies to tackle the endogenous risks in the area. It was deduced that maize farmers have a risk averse behaviour even if their risk aversion levels differ based on the scope of the management strategies that they employ to combat risk. Following the finding of the study, a holistic approach to risk management that encompasses all actors, such as farmers, researchers, extension services and financial institutions should be involved to make the appropriate interventions.

1. Introduction

Agricultural production is vulnerable to various types of risks that emanate from the natural, economic and socio-political environment (Onumah 2018). Most agricultural production risks are significantly more important for the farmers since they can cause large-scale production losses (Kislingerova and Spicka 2022). Inadequate institutional support (access to credit, research and extension), inappropriate production systems and inadequate infrastructures and post-harvest management technology are the main contributors to the production risk for the farmers (Yiadom-Boakye et al. 2013). However, most farmers in the least developed countries do not utilize the appropriate risk management instruments due to lack of awareness among the farming community and a lack of the scientifically recommended skills for managing risk (Antonaci et al. 2014).
Risk considerations are necessary in the analysis of the agricultural sector as there exist a number of possible cases where an intelligent policy formulation should consider not only the marginal contribution of input use to the mean of output, but also the marginal reduction in the variance of output (Koundouri et al. 2006). The stochastic nature of agricultural production is a major indicator of risk. Thus, variability in yield is not only explained by factors outside of the control of the farmer, such as climate change, but also by endogenously controllable factors such as varying levels of inputs (Just and Pope 1979). Risk caused by such endogenous factors is called endogenous risk. An endogenous factor is associated with the use of the factors of production. Over and under use of input relative to the recommended rate leads to yield variability among farmers. Inputs have two effects in the production process: the first is an effect on production; the second is an effect on production risk. Inputs that increased the mean production did not necessarily have a risk reducing effect (Ogundari and Akinbogun 2010). Improving farmers’ production skills and capacities by providing frequent access to training and institutions has been shown to be advantageous in reducing the level of the endogenous risk encountered by the farmers (Chavas et al. 2019).
Among agricultural products, maize is the most in-demand product and plays a role in ensuring the food security of consumers. It is the second most widely grown crop, next to wheat, in the world. Maize contains about 72% starch, 10% protein, and 4% fat, supplying an energy density of 365 Kcal/100 g, as compared to rice and wheat, but has a lower protein content (Nuss and Tanumihardjo 2010). Maize is useful for food, livestock feed and industrial processes in different countries globally. Different types of maize are grown throughout the world, with one important difference being its colour, which ranges from white to yellow to red to black (Ranum et al. 2014).
Ethiopia is one of the major maize producing countries. About 88% of the maize produced in Ethiopia is used as food. The country has attained self-sufficiency in maize production and even exports some to Sudan, Djibouti and Kenya. Important causes of the improvement in yield include the increased availability and use of modern inputs, the availability of better extension services and an increasing demand (Abate et al. 2015). Despite this progress in the production and marketing of maize, there is still variation in the yield levels and returns of maize in Ethiopia (Van Ittersum et al. 2016). The variation in yield is caused by a technological gap, market imperfections, economic constraints, allocative inefficiency and poor crop management practices. Tackling such factors will require an improved extension service, good road infrastructure, liberalization of the input and output markets and also good technological policies (Van Dijk et al. 2020). Production variation, on the other hand, causes welfare loss and brings social unrest (Bellemare 2015), and this in turn bring about rural to urban migration (Lee 2016).
Farmers’ perceptions about endogenous risk sources and risk management strategies are different based on the context existing in the area. They are shaped based on information obtained from various sources (Belaineh 2003). Risk perception is a prerequisite for determining an effective coping strategy (OECD 2011). Farmers who have no awareness of the risk could not implement an effective management strategy (Akcaoz et al. 2009). An individual’s risk perception is influenced by three broad factors, namely, individual characteristics, risk attributes (frequency and severity) and trust in the communicating institutions (Siegrist and Hartmann 2020). Individual characteristics make paramount contribution to the determination of individuals’ risk perception. For example, gender, age, education and wealth, as well as other innate attributes, create the lens through which a person assesses various risks and their attributes.
In addition to risk perception, the risk aversion behaviour of farmers contributes to their state of mind with regard to uncertain activities (Hillson and Murray-Webster 2005). Risk aversion behaviour involves the propensity to assess a risk situation in a positive or adverse manner and to act accordingly (Guan and Dragon 2018). Individuals’ risk aversion behaviours are divided into three categories: low risk averse, medium risk averse and high risk averse. Those with a low risk averse attitude incline towards uncertain activities; a medium risk averse attitude is indifferent towards risk and a high risk averse attitude gravitates towards certain rather than uncertain events (Mitra and Sharmin 2019). The factors that induce farmers to hold certain risk attitudes are their experience as farmers, self-enhancement, pleasure from being at risk, physical enjoyment, prestige-seeking, social pressure, financial gain, lack of time or means and under-estimation of a hazard (Rohrmann 2008).
Farmers’ perceptions and attitudes about risk determine the types of risk management strategies they employ in response to the risks they encounter (Crane et al. 2013). Risk is an unstoppable phenomenon; however, it is possible to reduce any potential loss using risk management tools (Fitch 2007). Risk management strategies involve different steps such as risk identification, measurement, treatment and implementation. Risk identification involves defining the potential risks. Risk measurement encompasses the quantification of the identified risk. Risk treatment includes risk avoidance, risk reduction, risk acceptance and risk transfer. Finally, risk implementation involves applying risk management strategies. At the end, each risk management strategy should be evaluated. Implementation uses people, statistical models and IT infrastructure to measure the underlying risk of current and future investments. This step refers to checking whether or not the final risk-taking is in line with the chosen strategy and applies it correctly (Wolke 2007).
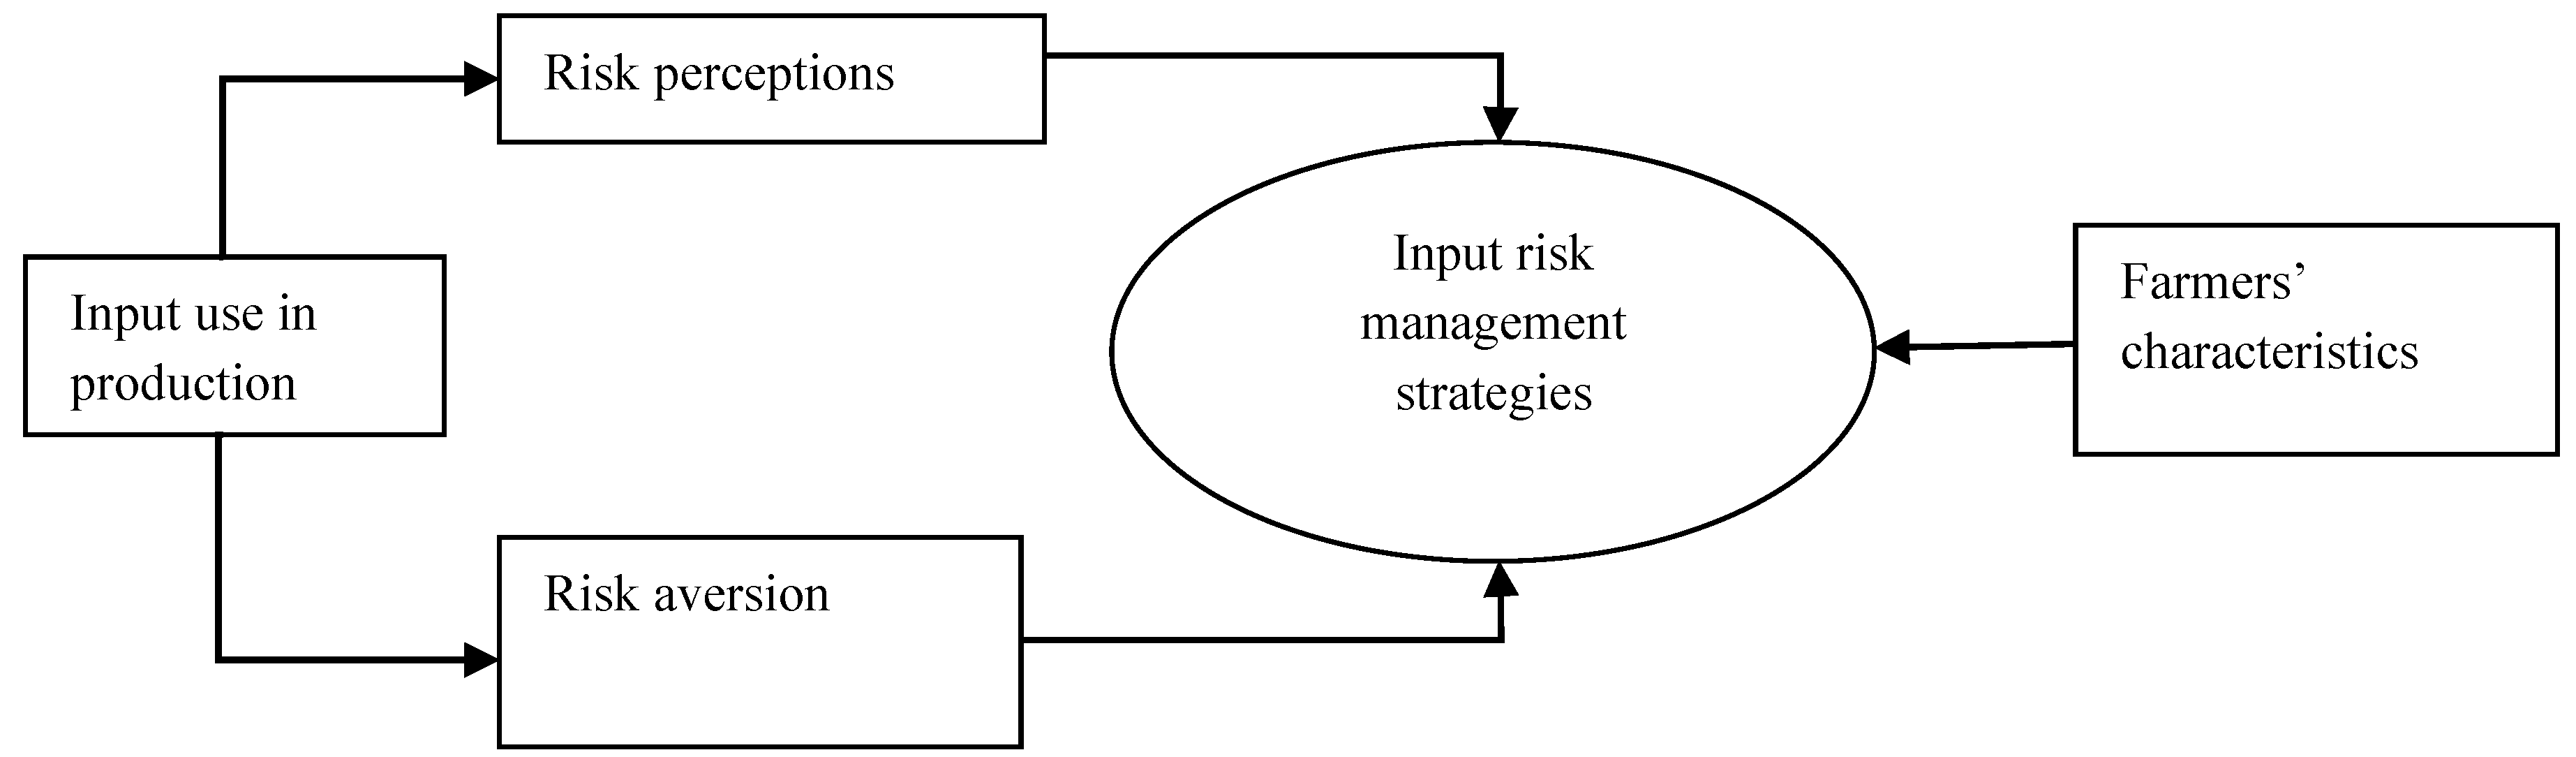
From the theoretical point of view, in advanced agricultural science, the dominant approach has been the stochastic production approach (Sarker et al. 2022).In this production function, farm inputs are assumed to change the level of output variance in addition to the level of output produced. Input use, such as the utilization of fertilizers, land and labour, can change output levels and output variations or volatility. Therefore, producers can adjust the level of input use to manage the production risks in agricultural production processes (Guan and Dragon 2018). Just and Pope (1979) stated that the production variation caused by input use, also known as endogenous risk, is the core issue in the agricultural production process. Farmers’ endogenous risk is caused by (1) uncertainty in the quality of one or more inputs, (2) uncertainty in the quantity of one or more inputs, (3) uncertainty in the timing of one or more inputs and (4) uncertainty in the prices of one or more inputs.
Farmers in Ethiopia have experience in identifying risk sources, and they are able to develop risk management strategies through experiential learning. However, such strategies are less effective and have no long-term ability to reduce or avoid risk, as the severity and frequency of risk persistence (Belaineh 2003). In Ethiopia, the existence of weak institutions such as the financial, market information and extension advisory services have made farmers’ risk management strategies less effective (Wondim et al. 2020). Smallholder farmers do not receive pertinent information about their production and marketing activities. Such a lack of reliable information deters farmers from making well-informed decisions that could reduce the agricultural risks encountered in their agricultural activities (Kahan 2008).
Some prior studies have been conducted in Ethiopia concerning farmers’ perceptions about risk sources and about the management strategies they implement on their farms; however, these studies focused on exogenous risk sources. This study fills a knowledge gap by being geared towards endogenous risk sources in particular. Therefore, this study was aimed at discovering the perceptions about endogenous risks, the risk aversion behaviour and the risk management strategies of maize producers in Awi zone, Ethiopia.
The following research questions were designed to address the knowledge gap:
  • Question 1: How do endogenous risks occur?
  • Question 2: How do maize producers perceive the endogenous risk sources? What are the probability of occurrence and the consequences of the perceived production risks?
  • Question 3: What is the effect of production inputs on the production of maize?
  • Question 4: What is the risk aversion behaviour of farmers? What determines the risk aversion behaviour of the farmers?
  • Question 5: What is the effect of the farmers’ risk perceptions, their risk aversion behaviours and other factors on the input risk management practices of maize producers?
This study makes a paramount contribution to the knowledge available to the farmers, government and non-government institutions and researchers that could create awareness about endogenous risk sources and the strategies for coping with them.
The remainder of this paper is structured as follows. In Section 2, a theoretical framework is developed in which the theories that support this study are reviewed. In Section 3, our research method is explained, including the data gathering strategy used. Our major statistical analyses are presented in Section 4, which includes an analysis of the relevant variables. Finally, in Section 5, our findings are discussed, and, in Section 6, the conclusions of our research are drawn.

2. Theoretical Framework

In this study, two core concepts were included, namely, risk perception and risk aversion behaviour. Therefore, two theories were included: protective motivation theory and Roy’s safety first criterion. Protection motivation theory is applied to assess farmers’ perceptions related to input risks and their risk management strategies. Moreover, Roy’s safety first criterion is applied to assess the risk aversion behaviour of the maize farmers. Each theory is discussed in detail in the following section.

2.1. Theory of Risk Perceptions

Protection motivation theory (PMT) was originally developed by Rogers (1975). PMT is crucial in describing how individuals are motivated to react towards perceived physical threats. The objective of PMT is to recognise and assess the danger, and then counter this assessment with effective and efficacious mitigation options.
Rogers listed four key elements of PMT:
  • The perceived severity of the hazard
  • The likelihood of the hazard occurring
  • The mitigation measures available
  • The individual’s ability to successfully enact those measures
According to PMT, individuals are more likely to protect themselves when they anticipate negative consequences, have the desire to avoid them and are able to take preventive measures. Thus, the motivation for risk management increases not only when there is cause for concern but also when an individual has the tools and skills to take preventive measures (Rogers 1983). In PMT, fear is appraised to predict and encourage protective behaviours and explain the cognitive processes involved in threat and coping appraisals (Rogers 1975). Two types of appraisals are conducted in PMT theory, namely, threat appraisal and coping appraisal, which can lead to the adoption of the best response strategies.
Threat appraisal depends on the following factors: (1) one’s belief in the severity of the problem (perceived severity); (2) one’s estimation of the chance of being affected by the disease (perceived vulnerability); and (3) one’s belief in the positive aspects of unhealthy behaviours (perceived rewards). If the perceived severity and vulnerability are high, and the perceived rewards are low, there is a stronger motivation for engagement in health-promoting behaviours.
Coping appraisal involves: (1) one’s evaluation of the efficacy of the protective behaviour in coping with the threat (response efficacy); (2) one’s belief in one’s own capability to manage protective behaviours (self-efficacy); and (3) one’s estimation of the costs (including money, time and energy) and effort involved in performing protective behaviours (perceived response cost). Overall, response efficacy and self-efficacy are expected to reinforce the coping appraisal, while the response cost is expected to reduce it.

2.2. Theory of Risk Aversion Behaviour

The theoretical framework for studying the risk aversion behaviour of farmers was the safety first criterion. The safety first criterion is an indirect approach which focuses on minimizing the chances of possible unfavourable outcomes (Hardaker et al. 2004). This set of rules was first proposed by Roy (1952) and further developed by his contemporaries (Pyle and Turnovsky 1970). Following Kataoka, maximize d subject to Pr(r <= d) <= a, where d is the subsistence or disaster net income level, r is the random net income and a is the accepted probability of disaster (presumably low). This last variable is postulated to depend on a vector S of variables that represent the socio-economic characteristics of the peasant household: a = a(S). Assuming the mean µ and standard deviation δ of r to be known, a certainty equivalent to the above model can be derived by maximizing the upper bound of the disaster level (Pyle and Turnovsky 1970).
The model then becomes max V(µ, δ) = µ − K δ for K = K(S), where K is the marginal rate of substitution between the expected net income and the risk, i.e., the measure of risk aversion suggested by Magnusson (1969). Like a, K is a function of the peasant household characteristics Moscardi and de Janvry (1977) stated that the risk aversion behaviour of maize producers could be determined by using the safety first approach based on the conditions of the factor demand and output supply.

3. Material and Methods

3.1. Conceptual Framework

Endogenous risk is the core issue in determining the production potential of maize producers. Endogenous risk is caused by problems in the utilization of inputs. Farmers have two types of perceptions regarding endogenous risk: input availability and input affordability risks are the two types of risks perceived by the farmers. High input availability and high input affordability risks lower the production potential of maize producers and boost the production risk in the area. Furthermore, farmers’ risk aversion behaviour emanates from their knowledge of production function. Knowledge of farmers’ risk aversion behaviour is crucial in knowing the types of technologies they could adopt and also in making interventions that encourage the wise use of farm inputs in the production process. Farmers used DAP, UREA, seed, land, oxen and labour in the production of maize. Farmers’ perceptions about these inputs have an effect on the risk management strategies of maize producers at large. The farmers applied different strategies to prevent endogenous risks. Such risk management strategies were determined by the risk perceptions, risk aversion behaviours and other characteristics of the farmers. The conceptual framework of the study is shown in Figure 1 below.

3.2. Study Area

The study was conducted in Awi zone of Ethiopia. Its agro-climatic conditions include highland (72%), mid-land (17%) and lowland (11%). The topographic area of Awi zone is relatively flat and productive, and its elevations vary from 1800 to 3100 m above sea level, with an average altitude of about 2300 m. Moreover, the minimum and maximum annual temperatures range between 5 °C and 25 °C. The daily temperature is very high from March to May. The mean annual rainfall for the area is about 1700 mm. The soils in the area are predominantly Nitosol and some are of Vertic properties (ANRS-BoFED 2006).
Awi zone is characterized by mixed farming practices. The production of crops covers around 90% of the cultivated area. Livestock production is also an integral part of the production system of the area. The production of cattle, sheep, horses, mules and poultry is a common practice. Furthermore, Awi zone is well known for its maize, finger millet, faba bean, barley, wheat, fruits, pulse, oil seeds and vegetables production potential (IFPRI 2010). Awi zone produced a total of 2,530,945 qt of cereals in 2019/2020 production year, and the production of maize in particular covered a land area of 64,189 ha, with a productivity rate of 2.94 qt/ha (AZAO 2022).

3.3. Sampling Technique and Sample Size

A three-stage sampling technique was employed to select sample respondents for interviews. In the first stage, from the available nine rural woredas in Awi Zone, four woredas, namely, Dangela, Ankesha, Guagusa and Fagta Locoma woredas were selected purposively based on their risk situations, agro-ecological conditions and production potentials. In the second stage, two Kebeles from each woreda fora total of eight Kebeles were selected randomly. In the third stage, simple random sampling (lottery method) was employed to select respondents for interviews. The study involved farmers who produced maize during the 2021/2022 production season. The representative farmers were selected with the help of the agricultural extension officers and development agents of each woreda and sample kebele. Both probability and non-probability sampling methods were employed to choose sample respondents for the study. Under probability sampling, the simple random sampling method was employed to select 343 maize farmers in Awi zone, while non-probabilistic sampling was used to select key informants.
A total of 343 maize producers were selected from eight target kebeles, which included Dubi, Gumderi, Tulta, Denkusha, Wenjela, Shenkurta, Ashew Fenzit and Figla Bable Dawna. Cochran’s (1963) formula for a finite population correction factor was used to determine the sample size for the study. It was specified as
n 0 = ( z ) 2 ( p ) ( q ) e 2
n = n 0 1 + n 0 1 N
where
n 0 = the sample size
N = population size
Z2 = the abscissa of the normal curve that cuts off an area α at the tails
e = the acceptable sampling error (5%)
p = the estimated proportion of an attribute that is present in the population (0.5), and
q = 1 − p.

3.4. Data Collection Methods

A semi-structured interview questionnaire was employed to collect data regarding farmers’ input utilization and their perceptions related to input risk and its management strategies. The questionnaire to measure the farmers’ input risk perception and management strategies included self-assessment questions that were evaluated using a Likert scale. A seven point Likert scale was applied to evaluate the farmers’ risk perceptions and the risk management strategies of maize producers (Likert 1932). The seven point Likert scale was chosen because it provides high reliability and high validity, is easy to use and reflects respondents’ true subjective evaluations of a phenomenon as compared to other, smaller rating scales (Taherdoost 2019). According to this study, a score above 3.5 showed a high severity and occurrence of risk, and a score below 3.5 was designed to indicate a low severity and occurrence of risk.
Farm inputs such as DAP, UREA, seed, land, labour and oxen were the most important inputs for maize production. Risks associated with the affordability and availability of these inputs deterred maize producers in the study area. The decision maker in the household ranked the occurrence and the impact of the two types of risk in the area. Risks associated with inputs’ availability and affordability were evaluated under a seven point Likert scale, separately, so as to summarize the farmers’ input risk perceptions. The seven point Likert scale to assess the occurrence and severity of input risk was designed as (1) _“very rarely” (2) _“rarely” (3) _“occasionally” (4) _“Neutral” (5) _“less frequently” (6) _“frequently” (7) _ “very frequent”.
While the perception of risks is individual, the management of risks is largely executed at the farm level. Decision making processes in large households are complex, and all household members have some influence (Michalscheck 2019). However, the majority of decisions are made, or at least supported, by the decision maker (household head or head of labour). Therefore, farm risk management strategies were assessed by interviewing a single decision maker. Farmers in the study area utilized nineteen input risk management strategies, which were evaluated by the decision makers, and farmers provided a score based on the significance of each risk management strategy in the field. Farmers’ perceptions in relation to the application of each risk management strategy were assessed under a seven point Likert scale as (1) _“strongly disagree” (2) _“disagree” (3) _“somewhat disagree” (4) _“neither agree nor disagree” (5) _“somewhat agree” (6) _“strongly agree” (7) _“very strongly agree”.
In addition to this, key informant interviews are qualitative in-depth interviews with people who know what is going in the community (Kumar 1987). For the purpose of key informant interviews, four social leaders, five agricultural officers, sixteen experienced farmers and eight development agents have chosen. A total of thirty-three key informants were selected purposively for this study and were interviewed using a well prepared checklist.

4. Statistical Analysis

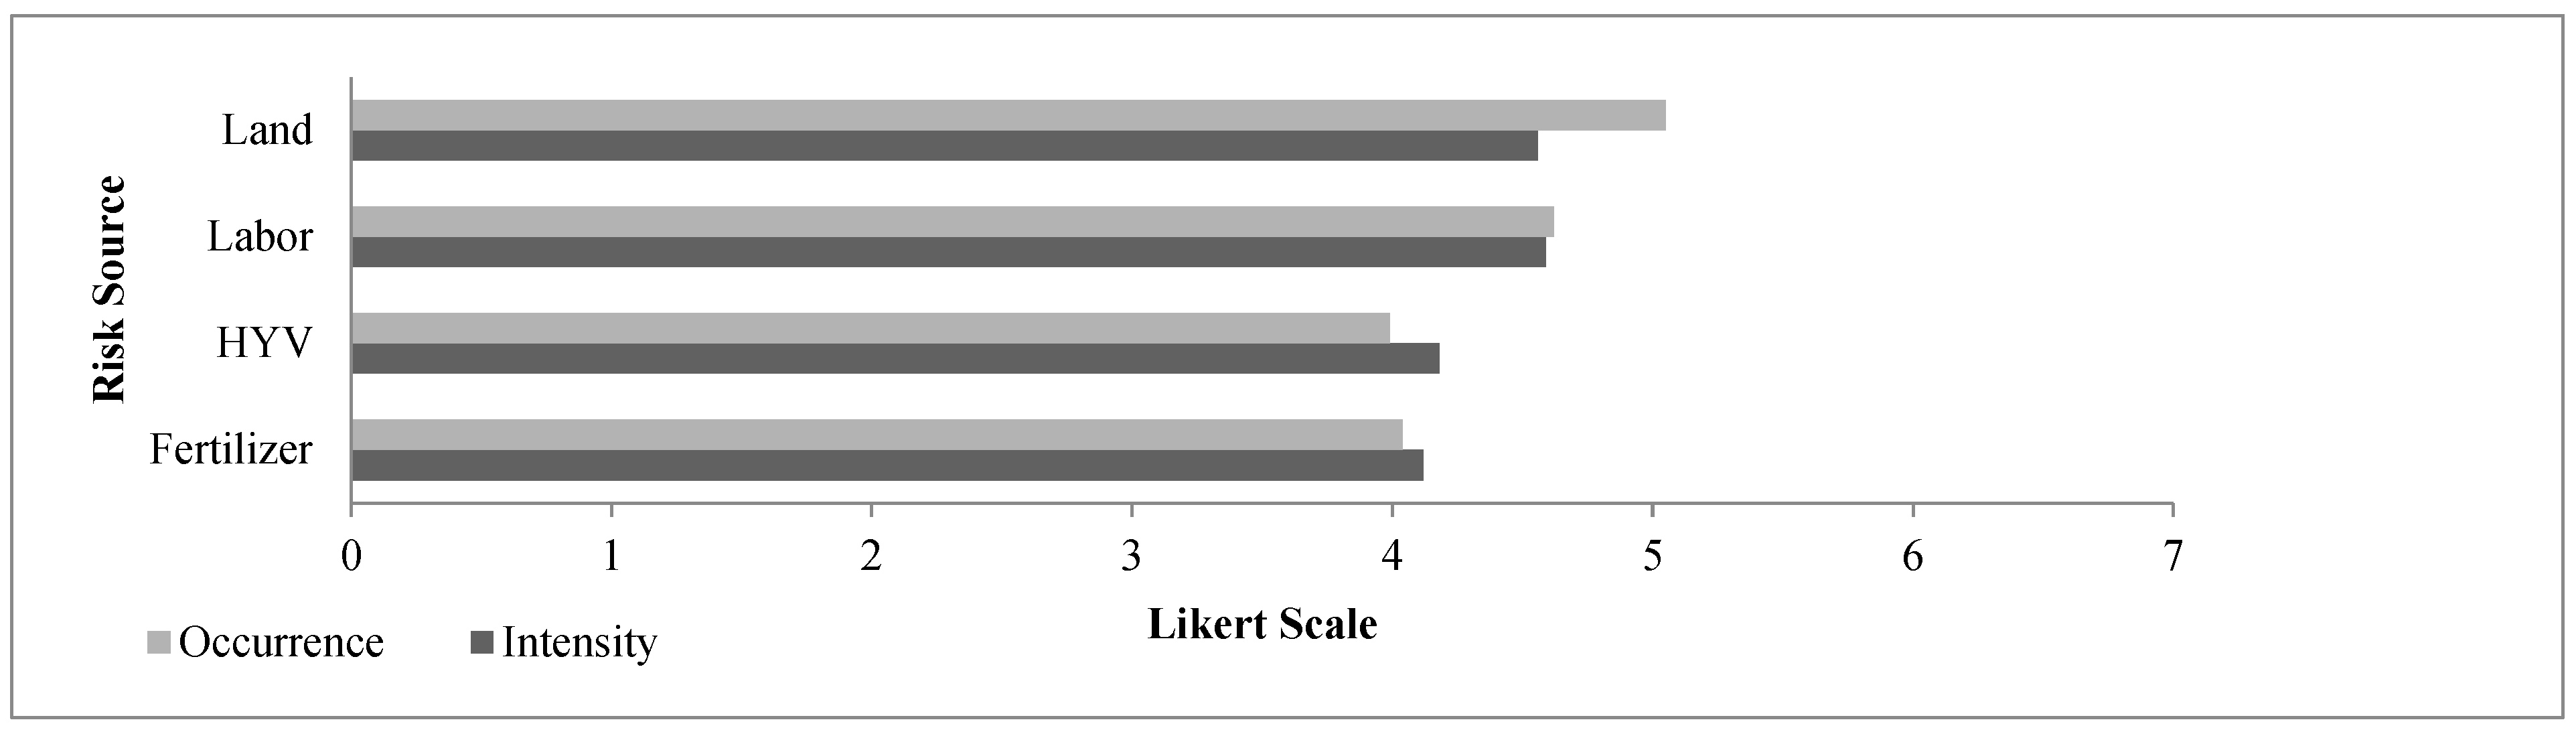
4.1. Overall Input Risk Perception of Farmers

Maize producers were interviewed about their perceptions on a seven point Liker-scale. The most serious risk was given seven points, and the least risk was given one point. For each risk, the points given by every respondent were summed, and a percentage out of the maximum score (i.e., seven points times 343 respondents) was calculated. Based on the Likert scale result, the farmers’ risk perception behaviours were classified as low and high risk. The Likert type scores for the farmers’ concerns were analysed as ordinal data to assess their perceptions of the risk related to each input risk. The input risks of maize producers were divided into two sections; one is associated with input availability risks and the other with input affordability risks. All statistical tests were conducted using STATA version 14 software after the data were collected, entered, edited and well prepared.

4.2. Risk Aversion Behaviour of Farmers

In this study, the risk aversion behaviour of maize producers was determined using the safety first model and applying the observed economic behaviour (OEB) elicitation method. The OEB approach develops the risk aversion measure based on the conditions of the factor demand and output supply (Moscardi and de Janvry 1977). The risk aversion parameter is derived from knowledge of the production function. The OEB method is an indirect method which makes inferences about the risk attitudes of the farmers based on the behaviour predicted by an empirically predicted model. The advantages of OEB include its ability to generate quantitative measures of risk aversion, its objectivity, and the facts that it allows the analyst to handle a large amount of sample data, is less costly and avoids measuring the risk attitude from hypothetical gaming situations (Robinson et al. 1984). To determine the risk aversion behaviour of the farmers using OEB, estimating the production function is crucial. In this study, a two-step procedure was used to determine the risk aversion behaviour of maize producers.
  • Step 1: Estimation of the production function
The translog, Cobb- Douglas, generalized Leontief and constant elasticity of substitution production functions were equally likely candidates for use in this study; however, for the ease of use in the subsequent section, it is better to differentiate the models. Model functional form tests such as the log likelihood, akiake information criteria (AIC), goodness of fit test and residual sum of square (RSS) value were undertaken to select the appropriate functional forms for the study. Following these tests, the translog functional form with non-linear regression model (NLS) was used in the study due to the high fitness of the model with the data.
The translog production functional form was specified as
Ln   Q = α 0 + α i i = 1 6 Lnx i + 1 2 α ii i = 1 6 Lnx i 2 + α ij i = 1 6 Lnx i j = 1 6 Lnx j + μ i
where
Q = Maize output; X1 = Seed; X2 = DAP; X3 = UREA; X4 = Land; X5 = Oxen; X6 = Labor; α0 = Constant term; αI coefficients for inputs; αii coefficients for the square of inputs; αij coefficients for the interaction effect of inputs; μi = error term.
This production function was estimated using the NLS method. The NLS model was chosen owing to the presence of a curvy-linear relationship between the dependent and independent variables. Before commencing the NLS regression model, a test for multicollinearity was undertaken so as to protect the perfect collinearity between independent variables and hence to produce unbiased estimates. The delta method was employed to estimate the elasticity. Elasticity was used to show the percentage change effect of each input on maize production.
  • Step 2: Identification of the most influential inputs
Following this, production estimates for the most influential inputs were selected and used to determine the risk aversion behaviour of farmers. Following Moscardi and de Janvry (1977), the risk aversion behaviour of farmers was formulated as
k s = 1 θ [ 1 P i X i P y β i μ y ]   in   which   the   coefficient   of   variation   of   yield ,   θ   is   computed   as   θ   = σ y μ y
where
k s is the risk index of farmers
P i is the price ofmost influential input (UREA)
P y is the price of maize
X i is the quantity of most influential input (UREA)
β i is the elasticity coefficient of output with respect to the chosen input
μ y is the mean of maize product
σ y is standard deviation of maize product
The hypothetical values for the risk parameter ( k s ) were specified as follows:
k s   < 0.4 = low risk aversion
0.4 <   k s   < 1.2 = moderate risk aversion
1.2 <   k s   < 2 = high risk aversion

4.3. Risk Management Strategies of Maize Producers

Nineteen risk management strategies were applied by the farmers to cope with endogenous risk in the study area. Farmers were interviewed about the importance of each risk management strategy as rated on a seven point Likert scale. The data collected using the Likert scale underwent factor analysis so as to reduce the risk management items into smaller number of variables.
Explanatory factor analysis was applied for this study to create a summary latent variable (factor) fora large number of variables associated with input risk management strategies. Factor analysis operates by reducing dimensionality. These un-observable factors are not directly measured but are essentially hypothetical constructs that are used to represent variables (Bartholomew et al. 2011).
Tabachnick and Fidell (2007) specified the factor analysis model as
Xj = αj1F1 + αj2F2 + …αjmFm + εj
where j = 1, 2, 3, 4 … p indicates number of variables.
Xj represents j-th variable.
αjm denotes factor loading of j-th variable on m-th factor.
Fm represents factor m.
εj indicates unique factor.
In conducting factor analysis, two methods are mostly commonly used, namely, principal axis factoring and principal component analysis. In this study, principal axis factoring with varimax rotation was employed. The justification for this was that principal axis factoring does not assume that all of the variables (items) included in the study account for 100% of the variance. Therefore, principal axis factoring categorizes the total variance into common variance, unique variance and error variance; however, principal component analysis assumes that there is no error variance, which means that the total variance of the variable is accounted for by its components (Rietveld and Van Hout 1993).
In connection to this, factor loading indicates the contribution of the variable to each factor. A factor loading of 0.30 or greater is considered statistically meaningful (Tabachnick and Fidell 2007). The larger the factor loading, the more the variable has contributed to that factor (Harman 1976). Finally, Factors with Eigen values greater than 1, Bartlett’s Test of Sphericity (p < 0.05) and the Kaiser-Meyer-Olkin Measure (KMO) of Sampling Adequacy (cut-off of above 0.50) were taken into consideration. If this requirement is not met, distinct and reliable factors cannot be produced. However, if this problem occurs, it can be solved by increasing the sample size (Yong and Pearce 2013).
The factor analysis produced factor score. A factor score, also known as a factor loading, is a measurement that correlates a particular variable to a given factor. When a factor score is high, this suggests that there is a notably strong connection between a certain factor and a common variance in the observed data. The magnitude of the factor score (loading) determines the number of factors to retain. The extracted number of factors represented the input risk management strategies employed by the farmers. Therefore, based on the above criteria, the main risk management strategies were identified and used for further analysis.
The seemingly unrelated regression model (SUR) was selected to identify the determinants of input risk management strategies since more than one risk management strategy was continuous. The SUR model allowed correlations among the residuals of each dependent variable. The SUR model is an extension of the multiple linear regression models and is used to estimate several continuous dependent variables jointly (Gujarathi 2004).
According to Zellner (1962), the SUR model is specified as
Y im = B 0 + B m X im + ε im  
where Y im (m = 1, 2, 3…k) represents the dependent variables which indicate the factor score for each risk management strategy chosen by the i-th farmer,
B 0 represents the constant term,
B m represents coefficients of explanatory variables,
X im represents explanatory variables and
ε im represents the error terms.
The above equation can be interpreted for each risk management strategies (m) as
Y*i1 = γ + B1Xi1 + εi1
Y*i2 = δ + B2Xi2 + εi2
Y*im = ϕ + BmXim + εim
In this study, the factor scores obtained from the factor analysis output were used as the dependent variables in SUR model. The SUR model is estimated by the usual ordinary least square method (Cappellari and Jenkins 2003), and the model allows correlation between residuals (Belderbos et al. 2004). The test for correlation between residuals was carried out using the Breusch–Pagan test of independence.
Before commencing the SUR model, a test for multicollinearity was undertaken to protect the perfect collinearity between independent variables and hence to produce unbiased estimates. To test multicollinearity, the variance inflation factor (VIF) was employed.

5. Results and Discussion

5.1. Risk Perception of Farmers

In this study, two risk sources were identified, namely, risks associated with the affordability of input and risks associated with input availability. Therefore, based on their intensity and probability of occurrence, the sources of risks that affect maize production were identified as follows:
Risks that have a high frequency of occurrence and high intensity, and
Risks that have a high frequency of occurrence and low intensity.

5.1.1. Input Affordability Risk Perception

In connection to the input affordability risk perception, as shown in Figure 2 below, farmers have different perceptions about the production inputs they use in the production of maize. Land resources were crucial for the farming community in the study area. Land affordability risk has a high frequency of occurrence (mean = 4.15) and a low expected damage (mean = 2.77) in the area. The farmers were smallholders who have an average land size of 0.69 ha, and farm land was not readily available for hire for maize production purposes. Moreover, the non-affordability of labour has a high frequency of occurrence and a high intensity of damage in the area. Maize farmers encountered labour shortages; however, most farmers lack the financial power to hire labour on their farm. The expensiveness of labour prohibited farmers from hiring the required number of labourers.
The non-affordability of high yielding varieties (HYV) has a high frequency of occurrence (mean = 4.21) and a high intensity (mean = 3.81) in the study area. High yielding varieties were crucial to improving the production of maize producers. Most farmers used local breeds; however, local breeds do not have high production potential and are not disease resistant. The farmers in the study area have financial problems and were unable to purchase and use high yielding varieties; therefore, they opted to use their own local crop varieties. The non-affordability of fertilizers was the other crucial problem that affected the production potential of maize producers in the study area. The farm land in the study area is fertilizer dependent, and the production potential of the soil will be reduced if there is no fertilizer. Since the prices associated with DAP and UREA were high for the farmers in the production season, the farmers were unable to afford to purchase the required amount of fertilizer. This in turn negatively affected the production and market potential of the farmers.

5.1.2. Input Availability Risk Perceptions

The availability of input has a great role in the production of maize. Figure 3 below depicts that input availability risk perception which has a high probability of occurrence and a high intensity of damage in the area. Figure 3 shows that the non-availability of adequate land for maize production has a high probability of occurrence (mean = 4.56) and a high severity of damage (mean = 5.05). Since mechanization was not available in the area, the production potential of the farmers was constrained by land size. Some farmers in the area hired land from other fellow farmers to produce a greater amount of maize.
Furthermore, labour shortage has a high probability of occurrence and a high intensity of damage. In the area, farmers used family labour; however, family members did not contribute adequate time for the production of maize. The available labour of the family members was often deployed in other off-farm activities so as to earn income to meet the family’s expenses. Moreover, the supply of labour in the market was not adequately available.
HYV has a high probability of occurrence (mean = 3.99) and a high intensity (mean = 4.18). Most farmers used local seeds since the HYV was not supplied regularly by the zonal agricultural offices in the area. Fertilizer availability risk has a high probability of occurrence and a high intensity in the study area. The availability of DAP and UREA in the area was not adequate, and they were not supplied in a timely manner. An inadequate supply of fertilizer from the cooperatives in the study area served as a detriment to the production potential of farmers.

5.2. Risk Aversion Behaviour of Maize Producers

5.2.1. Estimation of the Production Function

Table 1 below shows the comparison of different production functional forms using the results from different criteria. Based on the test results, the translog functional form was shown to be preferable for maize production analysis. The choice of the translog functional form was based on the fact that it had the highest R2 value, a small RSS value, the best log likelihood value and a good AIC value compared to the other three functional forms.
Moreover, the model specification test was conducted using the Ramsey RESET test and linktest as shown in the Appendix A. The Ramsey RESET test showed that the model has no omitted variable, and the linktest showed that the prediction squared does not have explanatory power, so our specification is good.
Following the selection of the production functional form, the parameters of maize production were estimated using the non-linear least square (NLS) model. NLS is preferred because there is a curvy-linear relationship between the explanatory variables and dependent variable, as shown below in Figure 4. In the presence of non-linearity, the NLS estimation method resulted in an unbiased and consistent parameter estimate.
The NLS regression estimates in Table 2 below show a goodness of fit test result of 69%, which implies that the amount of variation was explained by the explanatory variable included in the model. Moreover, the regression estimates show that UREA, land size, oxen, human labour and human Labour Square have a significant effect on maize production. Moreover, there interaction effects such as UREA and oxen, UREA and labour, and land size and labour have a significant effect on the production of maize. The model result showed that UREA was a very important input in the production of maize as compared to the other factors. It had a positive effect and was significant at a 1% probability level. The elasticity result portrayed that a 1% increase in the amount of UREA increases maize output by 34.115%, ceteris paribus. The justification was that, in the study area, the soil has a low fertility status, and this forced farmers to use UREA fertilizer. In the area, UREA gives a paramount advantage by boosting maize production, and the application of UREA at the recommended rate is crucial in increasing the maize yield. This finding was in line with the study of Abdulai (2013); Weldegebriel (2014); Wana and Lemessa (2019).
The high elasticity of UREA as compared to the other inputs implied the proneness of the farmers to utilize UREA to boost maize production and reduce yield variability. Therefore, the risk aversion behaviour of maize producers was determined based on the input UREA.

5.2.2. Determining the Risk Aversion Behaviour of Farmers Using the Most Influential Inputs

As shown in Table 2 above, the relationship between inputs and output was estimated using the NLS method, and the input UREA was the most influential input among the other inputs.
Following Moscardi and de Janvry’s (1977) risk aversion classification method, the risk aversion behaviour of maize producers was shown on the horizontal bar graph as shown in Figure 5 below. It was shown that, in the study area, all farmers have a risk averse attitude even if they have different risk aversion levels, which was portrayed in their response strategy for the risk sources. Based on the farmers’ response levels, they were classified into three distinct risk aversion categories. The results, as shown in Figure 5 below, revealed that, of the total respondents, about 7.29% have high risk aversion attitudes, about 30.61% have medium risk aversion attitudes and 62.10%have low risk aversion attitudes in the study area. Based on that result, the majority of the respondents have low risk aversion behaviours. This is inconsistent with the findings of Dadzie and Acquah (2012), Akinniran et al. (2017), Senapati (2020) and Sadiq et al. (2018), which portrayed farmers as having risk averse behaviour. However, their responsiveness to risk is not strong enough to avoid the risk encountered in their agricultural business.

5.3. Risk Management Strategies of Maize Producers

Table 3 below portrays the exploratory factor analysis results for maize producers’ risk management strategies. The risk management strategies encompassed 19 items, but, after the factor analysis was completed, these items were reduced to 5 factors.
Based on Kaiser’s criterion, the 19 risk management items were reduced to 5 factors. The sample adequacy test result showed a Kaiser-Meyer-Olkin (KMO) value of 0.808 and a Bartlett’s test value (χ2 = 1773.594, p < 0.000), which implied that sufficient and reliable factors were produced.
The number from the varimax rotation result showed the factor loading. Factor loading depicts the strengths of the relationships between the items and the factors. The magnitude of the loading determines the number of factors to retain. In addition to this, the mean associated with each item indicates the relative importance of the risk management strategies in the study area. Five of the risk management strategies were named as human risk management strategies, production risk management strategies, diversification, financial risk management strategies and market risk management strategies, and the naming of each factor was conducted based on the characteristics of the items included within that factor.

5.3.1. Determinants of Risk Management Strategies

The result from the varimax rotation method yields five factors. These five factors were regressed against the socio-economic, demographic and risk behavioural factors. To do so, the SUR model was applied, since it contains five simultaneously regressed equations which have correlated residuals.
The SUR model results in Table 4 revealed that the independent variables explain the total variance of 34%, 23%, 16%, 20% and 20% for the human risk management strategy, production risk management strategy, diversification, financial risk management strategy and marketing risk management strategy, respectively. In addition to the R2 value, the χ2 statistics are significant for each dependent variable at a one percent probability level, which shows the overall fitness of the model with the data used in the analysis process. The test for the correlation between the residuals resulted in a significant χ2 value (χ2(10) = 61.529, p < 0.001), which implies that there is a significant relationship between residuals; therefore, the SUR model best fit with the data.

Human Risk Management Strategy Determinants

Human risk management strategy was significantly affected by marital status, education level, extension contact, farm size, market information access, non-farm income, amount credited, distance, input affordability perception and risk aversion. The SUR model results showed that marital status has a positive effect and a significant effect at a 1% probability level. It implied that marriage increases the willingness of the farmers to use human risk management strategies. The result from key informants’ interview showed that married respondents have highly needed training and could collaborate with fellow farmers in the production process. Alexander et al. (2018) stated that procuring high production is mandatory for married farmers to feed their family members, and that, to do so, the farmers are always in need of training related to input use and other production related technologies.
Education level has a positive and a significant effect at a 5% probability level. Educated farmers have good knowledge, understanding and skill and better apply human risk management strategies so as to improve the efficiency and productivity of the labour force in the area. The findings of Basrowi (2012) showed that utilization of information related to risk management is easier for farmers with higher educational attainments. Moreover, education is related to knowledge, which is an intellectual ability, and to memory in applying concepts to solve problems in the field.
The frequency of extension contact has a positive effect and was significant at a 1% probability level. The information obtained through the key informants interviews depicted that extension services provide training through the farmers’ training centres (FTCs) for the farmers. Increasing contact with extension professionals could improve the production skills, performance and risk management capabilities of the farmers in the study area. In the area, farmers’ labour use management on the farm mostly improved through advice obtained from the extension agents. This finding was congruent with the studies of Kuru (2010) and Temesgen et al. (2015), who found that farmers with frequent extension contact had access to agricultural information, knowledge and risk reducing training program.
Farm size has a positive effect and was significant at a 10% probability level for the human risk management strategies of the farmers. As the size of the farm increases, the human risk management strategies of the farmers improved. A plausible explanation for this is that maize production in the area was labour intensive and the farmers with large farms always need labour to deploy on their farm. Large farm holders in the area cooperate in the production process, hire labour and obtain training about production process from extension agents. This finding was in line with the study of Nahraeni (2012). Moreover, Kislingerova and Spicka (2022) found that large farm size provides a greater management capacity and greater economies of scale for the farmers and could lead them to apply different risk management practices.
Non-farm income has a negative effect and was significant at a 5% probability level for human risk management strategies. The result from the key informants interviews depicted that the income obtained from non-farm activity was mostly used for daily consumption, such as the purchase of food items and clothes. The role played by non-farm activity was not strong enough to improve the human risk management strategies of farmers in the area at large. Furthermore, the amount credited has a positive effect and was significant at a 10% probability level for human risk management strategy. Credit was the alternative source of income by which the farmers could finance their maize production process. In the study area, farmers obtained credit from institutions and from their fellow farmers for labour cost and other inputs. Van-Vugt et al. (2018) and Ngeno (2018) showed that credit is crucial to improving the welfare of farmers since it enables farmers to purchase inputs such as labour.
The SUR model results showed that input affordability risk perception has a positive effect and was significant at a 1% probability level. High perception of the input affordability risk encourages the farmers to employ human risk management strategies in the study area. The justification was that high price of inputs enforced farmers to manage the available production inputs efficiently. Such a problem increases the farmers’ need to search for skilled labour that can operate with minimum cost of production.
Risk aversion behaviour of farmers has a negative effect and was significant at a 1% probability level. The SUR model results showed that medium risk aversion and high risk aversion have a negative effect on the human risk management strategies of maize producers. The justification for this was that, in the study area, farmers have low competency skill, which means that they underestimated the risky situation and could not properly take action to protect themselves against the situation. Furthermore, the societal culture of anticipating and managing risk was poor, which prohibited farmers from enacting sufficient human risk responses, such as collaborative activity, training and labour hiring on their farm.

Production Risk Management Strategy Determinants

Production risk management strategy was significantly affected by education level, experience, extension contact, farm size, farm income, TLU, social group membership, input affordability perception and input availability perception. The model result showed that, as compared to illiterate farmers, attaining primary and secondary education levels has a positive and a significant effect at 10% and 5% probability levels, respectively, on the production risk management strategies of maize producers. This is congruent with the finding of Chandio and Yuansheng (2018), who stated that an educated farmer can understand, identifies the risk sources and hence applies effective risk management strategies on their farm. Vihi et al. (2018) found that education leads individuals to have better, more privileged and more useful information on how to mitigate and manage any potential risks.
Experience has a positive effect and was significant at a 5% probability level for the production risk management strategy of maize producers. Farmers are intelligent on their farms due to the practical experience that they develop. The findings from the key informants’ interviews portrayed that, in the study area, most farmers did not gain frequent training from development agents in relation to production risk management techniques; therefore, it is through experience the farmers mitigate the risk. This was in line with the findings of Adimassu and Kessler (2016) and Chikezie et al. (2019).
Furthermore, extension contact has a positive and a significant effect on the production risk management strategies of maize producers. Extension services provided training and advice to help the farmers to improve their production systems and mitigate the risks encountered in their farm areas. Farmers who have frequent extension contact have know-how about the proper utilization and management of inputs, which in turn is crucial to applying the strategies in an efficient and effective manner. The result from KIIs supported this finding, which stated that, since the extension approach is more production oriented, it provides adequate information on the use of production inputs as risk management strategies. Similar finding was procured from studies by Christoplos (2010) and Chikezie et al. (2019).
Farm size has a negative and a significant effect at a 1% probability level for the production risk management strategies. The justification is that farmers in the study area are poor in terms of human capital and finance, and thus they have no capacity to manage the risk encountered on their large sized farms. Moreover, Sulewski and Kłoczko-Gajewska (2014) implied that farmers with large farms have low risk aversion behaviour and are not eager to use risk management strategies since they have a high economic of size. On the contrary, Vihi et al. (2018), Kislingerova and Spicka (2022) showed that large-scale farmers are usually high capital base farmers and have the ability to use alternative strategies; moreover, large-scale farmers can purchase and use improved inputs and practices more easily than small-scale farmers.
Farm income was the other crucial resource for the farmers that supports the livelihood of the maize producers. Farm income has a positive and a significant effect at a 5% probability level on the dependent variable. Farmers got income from the selling of crops and livestock, and the income obtained from farm activities was crucial to implementing production risk management strategies such as purchasing fertilizer and high yielding varieties and hiring labour. Hunnes (2015) and Ellis (2017) stated that wealthier households are better able to act quickly to cope with production variability.
Total livestock unit have a positive and a significant effect at a 1% probability level for the production risk management strategies of farmers. Farmers sold their livestock when they encounter financial problems. The finding from the key informants’ interviews showed that livestock are the liquid assets for the farmers, and that farmers sold their livestock to purchase fertilizer, pesticides and high yielding varieties. Adimassu and Kessler (2016) found that farmers with high number of livestock are risk averse because their livestock could be used as insurance.
Membership in a social group has a positive and a significant effect at a 1% probability level on the dependent variable. The result from the key informants interviews implied that the farming activity in the area was conducted though cooperation with other farmers found in the locality. Farmers cooperate with one another during land preparation, sowing, weeding and post-harvest activities. James and Yunxian (2021) also found that social group membership provided collective interventions to ensure good risk protection management and optimization strategies. Bowles and Gintis (2002) found that households with better social and cultural capitals invested more in land improvement activities.
Risk perception is important in determining the production risk management strategies of maize producers. Farmers’ perceptions of the affordability and availability of inputs came from the society they lived in and from the farmers’ specific situations. The regression results implied that input affordability perception has a negative and a significant effect at a 5% probability level on the dependent variable. The justification for this was that farmers are reluctant to purchase expensive inputs due to financial problems. The expensiveness of inputs prohibited farmers from implementing production risk management strategies, and hence this forced them to take risks.
Furthermore, input availability risk perception has a positive and a significant effect at a 1% probability level. The unavailability of production inputs forced farmers to use other alternative strategies such as changing to cost efficient production techniques, using organic fertilizer and increasing their contact with the extension personnel so as to obtain advice and training regarding production methods. Scarcity/unavailability of production inputs made farmers look into other alternative strategies to sustain their livelihood. This finding was congruent with the studies of Birkholz et al. (2014) and Sulewski and Kłoczko-Gajewska (2014) who stated that a high risk perception induces farmers to take measures to secure themselves against loss.

Diversification Strategy Determinants

The diversification strategies of maize producers were affected by family size, education level, experience, farm size, off-farm income and input affordability perception significantly. The SUR model results showed that family size has a positive effect and was significant at a 5% probability level. Family members within the household were a source of labour for the farming community that enabled them to diversify sales across time and to engage in off-farm activities. Osondu et al. (2013) found out that increase in household size leads to an increase in the use of risk management because there is a division of labour within the household which make the use of risk management practices easier and less time consuming for the farmers.
Secondary education level has a positive effect and was significant at a 10% probability level. The justification was that educated households better know and understand the benefits of diversifying activities in reducing the risk associated with farming activities. Educated farmers could select the type of input sellers and the time to purchase inputs and deploy different income diversification activities. Through these activities, the farmers alleviate financial problems and manage input risks at large. This is congruent with the findings of Ullah et al. (2015). However, it contradicts with finding of Mesfin et al. (2011), who found that more schooling discourages farmers from adopting diversification measures such as off-farm income to manage farm income variability.
The experience of farmers in production of maize has a positive effect and was significant at a 1% probability level for the diversification strategies of maize producers. The justification was that most farmers in the area were illiterate; therefore, they implemented risk management strategies based on the experience they had rather than applying systematic risk management strategies. Experienced farmers have better know-how to avoid production problems by participating on different activities. Akhtar et al. (2019) depicted that experienced farmers have good awareness about the risk and have good societal contact.
Furthermore, farm size has a negative effect and was significant at a 5% probability level on the diversification strategy. A large farm size means wealth for the farmers. Large farm holders did little to diversify their income since wealth by itself is a disincentive to consider risk. Farmers with large farm holdings did not worry about the time to purchase their farm input and did not involve themselves in off-farm activities since they had a sufficient financial capacity. This finding is in line with the studies of Mesfin et al. (2011), Ullah et al. (2015) and Kislingerova and Spicka (2022), in which large-scale farmers have a high capacity to bear risk and less need for risk management tools. Dabkiene (2020) signified that agricultural production on small farms was not sufficient to support the families; therefore, they were involved in diversification activities.
Off-farm income has a positive effect and was significant at a 1% probability level for the diversification strategies of maize producers. An off-farm activity such as casual labour is a source of income for the farmers in the area, allowing the farmers to withstand the high cost of inputs such as UREA and to hire labour on their farm. The results from the key informants interviews strengthen this finding, stating that off-farm income enables farmers to purchase farm inputs such as UREA and high yielding varieties and to hire labour and oxen.
Input risk perceptions have a significant effect on the dependent variable. The SUR model result showed that input affordability risk has a positive effect and was significant at a 1% probability level. A high input price incentivized farmers to engage in diversified activities to boost their financial capability. The result from the key informants interviews portrayed that, due to the non-affordability of input prices, farmers in the study area were inclined to engage in other activities such as diversifying the purchase of inputs across time and across traders.

Financial Risk Management Strategy Determinants

The financial risk management strategy of the maize producers was significantly determined by their family size, education level, experience, off-farm income, non-farm income, amount of credit, TLU, distance and input affordability risk perception. The model result showed that family size has a negative effect and was significant at a 1% probability level. The justification was that large family means high consumption, which decreased the financial capacity of farmers. On the contrary, Asravor (2018) found that family members can supply more labour both on and off-farm in order to supplement the income from the farm.
Furthermore, the secondary education level has a positive effect and was significant at a 5% probability level for the financial risk management strategies of maize producers. The results from the key informants interviews implied that educated farmers have knowledge and awareness in managing the farm business and in administering the cost and revenue on the farm. Moreover, educated farmers in the area employed strategies such as saving and the borrowing and selling of assets when they encountered financial difficulties. This finding was in line with the study of Saqib et al. (2016) and James and Yunxian (2021).
The experience of farmers, on the other hand, has a positive effect and was significant at a 5% probability level for financial risk management strategies. Experience plays a great role in managing the farms in the area. Farmers sold crops and livestock to purchase fertilizer, borrowed seeds and money from their fellow farmers and also saved seeds for the next production season using their own experiential learning from the farm. Ellis (2017) portrayed past experience as being helpful in choosing the best risk management strategies. On the contrary, Akaakohol and Aye (2014) found that more experienced farmers have less ability to participate in financial response strategies such as off-farm activities since they spend more time on their own farm.
Off-farm income has a positive effect and was significant at a 1% probability level for the financial risk management strategies. Off-farm income was a supplementary income source for the farmers. In the area, farmers were involved in the marketing of agricultural commodities and in casual labour to solve their financial problems. In connection to this, non-farm income has a positive effect and was significant at a 10% probability level for the financial risk management strategies of farmers. Petty trade, charcoal production and handcrafts were the main non-farm activities in the study area. Therefore, alternative income sources were essential to support the livelihood of farmers and helped them to purchase production inputs easily. El-Osta and Morehart (2008) and Akinrinde et al. (2018) showed that off-farm activity is crucial to stabilizing farm income and safeguarding farmers from production risks.
The amount credited has a positive effect and was significant at a 5% probability level for the financial risk management strategies of farmers. Farmers in the study area borrowed from formal and informal institutions to purchase farm inputs as well as for family consumption. The key informants interview results showed that credit strengthens the financial capacity of maize producers and improves the purchasing power of farmers even if there are collateral problems in obtaining financing from formal institutions. Solano and Rooks (2018) and Adjognon et al. (2017) showed that credit enables farmers to have access to inputs such as improved seeds, fertilizers and chemicals and to hire labour when needed.
The total livestock holding has a positive effect and was significant at a 10% probability level for the financial risk management strategy. The justification for this was that livestock were a source of income for the farmers and farmers got income from the sale of their livestock. Income obtained from sale of livestock was dedicated to the purchase of farm inputs and goods for household consumption. Asravor (2018) and Adimassu and Kessler (2016) stated that households with larger livestock holdings could easily convert their livestock to cash and could withstand production variability.
Distance from the road has a negative effect and was significant at a 1% probability level on the dependent variable. Distance from the road imposed additional costs for the farmers to reach to institutions, such as markets and financial institutions. Moreover, farmers in distant locations were far from pertinent information and did not gain much formal training. Therefore, they have low awareness and knowledge and few opportunities to implement solutions when they encountered risks. Therefore, they were weak in applying strong financial response strategies. Adimassu and Kessler (2016) also showed that farmers near to the paved roads and markets have better access to the credit and could engage in off/non-farm activities.
Input affordability risk perception has a negative and a significant effect at a 1% probability level for the financial risk management strategies of maize producers. As inputs became non-affordable, farmers’ purchasing power diminishes. In the study area, farmers were poor, had few valuable assets to sell and had little capacity to save or borrow from banks during risky situations. The expensiveness of inputs weakens maize producers’ abilities to follow financial risk management strategies since they cannot withstand the price increase. Ping et al. (2016) stated that, due to the high price of inputs, farmers do nothing, forcing them to tolerate the risk. In contrast, Zulfiqar et al. (2016) and Saqib et al. (2016) found that farmers with high risk perception used credit and off-farm activities as risk management tools.

Market Risk Management Strategy Determinants

Market risk management strategies were significantly determined by education level, experience, information access, TLU, input risk perceptions and risk aversion behaviour. The model result showed that reading and writing have a negative and significant effect at a 1% probability level. The justification for this was that farmers with less education have less know-how to use market risk management strategies. Farmers who were far from formal education could not understand well the benefit of market information access, did not used cooperatives and were unable to create market linkages. Ahaneku et al. (2019) and Velandia et al. (2009) stated that less education is related to weak adoption rates for market risk management strategies. Mishra and El-Osta (2002) also stated that more educated farmers have high risk aversion behaviour and are more prone to use market risk management practices.
Experience has a positive and a significant effect at a 1% probability level on the dependent variable. Experienced farmers have the skill to use alternative market risk management strategies. Farmers employed marketing risk responses such as storage and creating linkage with the input dealers by considering the status of risk situation in the area. Ellis (2017) and Osondu et al. (2013) found that more experienced farmers were more likely to opt for different marketing strategies, since with more experience they are better able to be aware of marketing channels and agents in the community.
Access to market information has a positive effect and was significant at a 5% probability level for the market risk management strategies of maize producers. The key informants’ interview results showed that pertinent market information is crucial for the farmers to make well-informed decisions. Based on this information, farmers select an input purchasing season, choose among input sellers and output buyers, store input or output for the next production season, make forward contracts with the traders and use different profitable production technologies. James and Yunxian (2021); Mishra and El-Osta (2002) stated that household marketing decisions are based on price, supply and demand information. Poorly informed farmers may not be able to adopt risk protection mechanisms, leading to inefficient marketing decisions.
Total livestock holding has a positive effect and was significant at a 5% probability level on the market risk management strategies of maize producers. Livestock served as a liquid asset for the farmers since they could sell the livestock when production risk occurred in the area. Farmers having more livestock at their farms are more likely to adopt market responses such as storage as a risk management tool. This finding was in line with the study of Akhtar et al. (2019).
Input affordability risk perception has a positive effect and was significant at a 1% probability level. Expensiveness of inputs forced farmers to make a choice such as to make contract with traders. Moreover, farmers in the area made share cropping with other farmers so as to produce maize on their own farms and share the products equally. In doing so, farmers got a labour force and maize product at the same time. During the presence of high input prices, farmers found a win-win strategy for sharing the risk with the other actors.
Input availability risk perception has a positive effect and was significant at a 5% probability level on the dependent variable. The key informants’ interview results showed that farmers made purchases of inputs such as seed and fertilizer when inputs were available widely. The farmers store the inputs to be used in the production of maize when the price of inputs increased. Therefore, the availability of inputs allowed the farmers to easily access and utilize the inputs and hence it was helpful to apply market risk management strategies. The same find was obtained by Kisaka-Lwayo and Obi (2012).
Risk aversion behaviour has a positive and a significant effect on the market risk management strategies of maize producers in the study area. The model result showed that medium risk aversion behaviour has a positive effect and was significant at 1% probability level on the dependent variable. Moreover, higher risk aversion behaviour has a positive effect and was significant at a 10% probability level. The justification for this was that risk averse farmers were reluctant to take risks and hence apply risk management strategies. Kouamé (2010) and Saqib et al. (2016) found out that risk averse farmers were eager to use market information and apply different marketing strategies to mitigate the adverse effect of risk.

6. Conclusions and Recommendations

The agricultural sector is susceptible to various types of risk in Ethiopia. Such risks in agriculture are interconnected and sometimes offset each other. Endogenous risk which was caused by factors of production was the dominant risk affecting the production performance of farmers. Farmers strived to cope with these risks; however, the effort they made was not strong enough to control the risk. Risk is the potential deviation between expected and real outcomes. While this deviation may be positive or negative, a negative outcome has greater importance from a practical point of view and is usually the focus of decision makers.
This study was aimed at examining farmers’ endogenous risk perception, risk aversion behaviour and coping strategies in managing the risk. Regarding the production input use, farmers in the study area did not use the recommended amount of seed, DAP, UREA, labour and oxen per a given hectare of land. Such unscientific use of inputs was the cause for maize production variability in the study area. Endogenous risk was perceived by the farmers in two ways; the first was connected with input availability risk and the second with input affordability risk. Input availability risk perception has high probability of occurrence and high intensity of damage among maize farmers in the area. Moreover, with regard to input affordability risk, farmers have different perceptions about the production inputs they used in the production of maize. High perception of endogenous risk signified the presence of severe risk which could harm farmers’ production potential at large. Farmers’ perception of risk sources and risk management strategies were determined by different farm specific and systematic issues in the area. Risk perception is a prerequisite for determining effective coping strategies (OECD 2011). Farmers could encounter high input risk if they did not provide appropriate management strategies. In the study area, human risk management, production risk management, diversification, financial and market risk management strategies were mechanisms that farmers followed to protect against endogenous risk. The input risk management strategies of maize producers were determined by various factors, such as risk perception, demographic factors, socio-economic and risk aversion behaviour of farmers.
One of the crucial factors that determine risk management strategies was the risk perception of the farmers. Risk perception is a mental interpretation of an individual produced by external stimuli (Wachinger et al. 2013). An individual’s risk perception is influenced by three broad factors, namely, individual characteristics, risk attributes (frequency and severity) and trust in the communicating institutions (Siegrist and Hartmann 2020). High risk perception among farmers regarding input affordability and input availability enforced the farmers to use different risk management strategies. Input affordability risk perception had a negative impact on the financial capacity of farmers, and farmers did not have the willingness to use production risk management strategies. In response to occurrences of input affordability risks, farmers in the area were more prone to use other management activities, such as human management strategies, diversification of income and marketing strategies. In addition to this, when the occurrence and severity of input unavailability is high, farmers engage in risk reduction behaviours, such as changing to cost efficient production techniques, using organic fertilizer and increasing contact with the extension personnel so as to receive advice and training about production methods.
Farmers who have no awareness about the risk could not bring effective management strategy. The awareness of farmers could be improved through education, experience, extension contact and information access from different sources. Mishra and El-Osta (2002) strengthened this idea, finding that farmers with higher levels of education and more experience have ahigh inclination to use risk management strategies. Most farmers have low education attainment; therefore, they developed risk management strategies through experiential learning. Moreover, farmers got information from development agent, formal and informal information sources which were crucial to improve the cognizance of the farmers about agricultural risk prevailed on the farm.
The economic characteristics of the farmers, such as farm size, off-farm income, on-farm income, farm income, livestock holdings and amount credited make significant contributions the financial power of farmers and to their application of efficient management strategies on the farm. Farmers with large farms were less prone to apply production and diversification risk management strategies. Large farm size brought a high economic of scale for the farmers, and they were not willing to use risk management strategies. Palinkas and Székely (2008) found out that, with smaller farm sizes, the incentives to use production risk management strategy and to participate in diversification activities decreases. Moreover, a large farm size increased application of human risk management strategies such as training requirements and collaborative activity at large. Sherrick et al. (2004); Kislingerova and Spicka (2022) depicted that large farm size provided greater power for applying various types of risk management strategies. Participation in alternative income source activities and availability of livestock were also crucial for the application of risk management practices by the farmers. Livestock and cash income are liquid assets and hence they are helpful in managing risk effectively. Mishra and El-Osta (2002) stated that farmers who participate off the farm, use credit, and sell their commodities across time are more likely to participate in risk management strategies.
The risk aversion behaviour of farmers signified the behavioural tendency of farmers directed to the risk in the area. UREA was determined to be the most important input in the production of maize. Using the amount of UREA as a basis, it was shown that farmers in the area do have risk aversion behaviours; however, the levels of risk aversion behaviour differ among the farmers. The majority of farmers in the area has a low risk aversion attitude, which implies that farmers have a low tendency to counteract the risk. Determining the risk aversion behaviour of farmers has implications for the government and other agents who wish to make important interventions among the farmers. The farmers’ risk aversion behaviour is an indicator of farmers’ tendency or willingness to take risk. Risk averse farmers with high level of competency and risk anticipation skill have better know-how to manage risk.
The following recommendations are put forward by the researchers:
The zonal agricultural office should develop plans to link farmers with the market. To do so, contract farming schemes should be developed well in the area to farmers to protect themselves from production risks and from price instability. Through contract farming schemes, farmers have reliable access to input and output markets. Therefore, farmer-to-industries and farmers-with-traders linkages should be strengthened to reduce the risk of maize producers. Moreover, extension workers should better understand the risks that farmers face in the study area. Based on this information, they should provide capacity building training for farmers and assist farmers in developing risk management strategies. Extension workers should educate farmers about production risks and link farmers with research information so as to reduce risk through farmers’ training centres (FTCs) in each rural kebeles in the zone.
Farmers should engage in farm planning, which means the farmers should better understand exactly what and how much input is needed at various times during the production season. To develop farmers’ planning skills, it is essential to strengthen farmers-to-extensions and also farmers-to-research-centres linkages. This helps the farmers to follow scientifically recommended practices
Strengthening traditional social bonds is also crucial for the farmers, so that they have mutual assistance. Farmers should understand well the benefits of working together to reduce the risks encountered in the area. Through social bonds, the farmers could communicate information about production practices, purchasing prices of inputs, selling prices of outputs, types of buyers and the locations of marketplaces where they can purchase/sell their input/output. Social bonds also provide security for the farmers and are helpful in supporting the most vulnerable groups in the society.
With regard to governmental institutions, financial institutions make a significant contribution toward reducing both production and market risks in the study area. Financial institutions should design mechanisms to provide loans without collateral for the farmers. Moreover, financial institutions should provide awareness about cash utilization for the farmers and should improve farmers’ ability to raise cash to use during unfavourable times. Farmers should develop assets that could be easily convert to cash since the risks associated with input affordability could be reduced by selling liquid assets.
The majority of farmers were illiterate and have no scientific know-how about maize production, and they carry out their farming activities based on experience. The provision of adult education for illiterate farmers offers them the advantage of improved awareness and powers of information analysis. Continual training for farmers is also crucial in order to improve the labour productivity and risk management ability of farmers. In addition to this, establishment of agricultural information centre is mandatory in the area since it enables farmers to receive timely and accurate information with regard to production and marketing. Therefore the risk associated with input and output risk would be reduced at large.
Rural infrastructure development should be widely expanded in the area. Infrastructures such as roads, telecom and electricity are crucial so that the farmers have easy access to different institutions, such as market and financial institutions. Good infrastructure has the potential to lessen transaction costs for maize producers, such as transportation costs, information searching costs, bargaining costs and enforcement costs. Furthermore, cooperatives should be strengthened in the zone since they provide the opportunity for maize producers to benefit from an increased volume of sales, bulk purchases of inputs and supplies and the mobilization of credit. Cooperatives are instrumental for the farmers to reduce the transaction costs associated with search for a market.
Diversification should be used to minimize the financial risks for farmers. Involvement in off-farm and non-farm activities is crucial to make farmers financially strong. Income obtained from alternative income generating activities is important for purchasing farm inputs and enables farmers to follow mechanized agriculture. Mechanized production is essential for improving the maize yield and reducing production risks for farmers.
The limitation of the study is that this study focused only on endogenous risk. In this study, farmers’ risk aversion behaviours, perceptions and management strategies were designed in relation to input utilization. Therefore, future research should focus farmers’ risk behaviour in relation to financial and marketing phenomena. Moreover, the impact of exogenous risk on production risk should be studied in future research.

Author Contributions

Conceptualization, Y.G., B.K. and A.B.; Methodology, Y.G.; Validation, B.K. and A.B.; Formal analysis, Y.G.; Investigation, Y.G.; Data curation, B.K. and A.B.; Writing—original draft, Y.G.; Writing—review & editing, Y.G.; Visualization, B.K. and A.B.; Supervision, B.K. and A.B. All authors have read and agreed to the published version of the manuscript.

Funding

This research received no external funding.

Data Availability Statement

The data presented in this study are available from the author upon request.

Acknowledgments

I have a great gratitude for the ALMIGHT GOD. I am fully indebted to my major advisor Berhanu Kuma and co-advisor Amsalu Bedemo for their guide and constructive comments. I also pleased the farming community, agricultural officers and data collectors found in Awi zone that played a role in accomplishing this study.

Conflicts of Interest

The authors declare no conflict of interest.

Appendix A

Table A1. Ramsey RESET test using powers of the fitted values of lne.
Ho:Model has no omitted variables
F(3, 312) =1.15
Prob > F =0.3307
Source: Author computation based on survey data.
Table A2. Linktest result.
LneCoef.Std.Err.Tp > t[95%Conf.Interval]
_hat0.6480.3112.0900.0380.0371.259
_hatsq−0.0380.032−1.1700.243−0.1010.026
_cons−0.7440.760−0.9800.328−2.2390.751
Source: Author computation based on survey data.

References

  1. Abate, Tsedeke, Bekele Shiferaw, Abebe Menkir, Dagne Wegary, Yilma Kebede, Kindie Tesfaye, Menale Kassie, Gezahegn Bogale, Berhanu Tadesse, and Tolera Keno. 2015. Factors that Transformed Maize Productivity in Ethiopia. Food Security 7: 965–81. [Google Scholar] [CrossRef]
  2. Abdulai, Shamsudeen P. 2013. Technical Efficiency of Maize Production in Northern Ghana. African Journal of Agricultural Resource 8: 5251–59. [Google Scholar]
  3. Adimassu, Zenebe, and Aad Kessler. 2016. Factors Affecting Farmers’ Coping and Adaptation Strategies to Perceived Trends of Declining Rainfall and Crop Productivity in the Central Rift Valley of Ethiopia. Environmental Systems Research 5: 1–16. [Google Scholar] [CrossRef]
  4. Adjognon, Serge G., Lenis Saweda O. Liverpool-Tasie, and Thomas A. Reardon. 2017. Agricultural Input Credit in Sub-Saharan Africa: Telling Myth from Facts. Food Policy 67: 93–105. [Google Scholar] [CrossRef] [PubMed]
  5. Ahaneku, C. E., S. U. O. Onyeagocha, C. C. Eze, N. M. Chidiebere-Mark, G. O. Ellah, and G. I. Isaiah. 2019. Risks and Determinants of Risk Management Strategies among Rural Cassava-Based Farmers in Imo State. Journal of Agriculture and Food Sciences 17: 100–15. [Google Scholar] [CrossRef]
  6. Akaakohol, Msoo A., and Goodness C. Aye. 2014. Diversification and Farm Household Welfare in Makurdi, Benue State, Nigeria. Development Studies Research 1: 168–75. [Google Scholar] [CrossRef]
  7. Akcaoz, Handan, Hatice Kizilay, and Orhan Ozcatalbas. 2009. Risk Management in Dairy Farming: A Case Study in Turkey. Journal of Animal and Veterinary Advances 8: 949–58. [Google Scholar]
  8. Akhtar, Shoaib, Gu-cheng Li, Adnan Nazir, Amar Razzaq, Raza Ullah, Muhammad Faisal, Muhammad Asad Ur Rehman Naseer, and Muhammad Haseeb Raza. 2019. Maize Production under Risk: The Simultaneous Adoption of Off-Farm Income Diversification and Agricultural Credit to Manage Risk. Journal of Integrative Agriculture 18: 460–70. [Google Scholar] [CrossRef]
  9. Akinniran, T. N., M. O. Raufu, and Abiodun Isola. 2017. Effect of Risk Attitude on Rural Household Poverty of Food Crops Farmers in Surulere Local Government Areaof Ogbomoso, Oyo State, Nigeria. International Journal of Agriculture, Environment and Bioresearch 2: 39–52. [Google Scholar]
  10. Akinrinde, Adeniyi Felix, Kemi Funmilayo Omotesho, and Israel Ogulande. 2018. The Issue of Income Diversification among Rural Farming Households: Empirical Evidence from Kwara State, Nigeria. Journal of Agribusiness and Rural Development 3: 231–38. [Google Scholar] [CrossRef]
  11. Alexander, Ighoro, Fasina Oluwatosin Oluwasegun, and Alfred Simeon Dada. 2018. Socioeconomic Determinants of Training Needs of Cassava Farmers in the Niger Delta Region of Nigeria. International Journal of Development and Sustainability 7: 724–33. [Google Scholar]
  12. ANRS-BoFED (Amhara National Regional State-Bureau of Food and Economic Development). 2006. Geographic Related Data of Amhara National Regional State, Ethiopia. Bahir Dar: ANRS-BoFED. [Google Scholar]
  13. Antonaci, Lavinia, Mulat Demeke, and Antonio Vezzani. 2014. The Challenges of Managing Agricultural Price and Production Risks in Sub-Saharan Africa. ESA Working Paper No. 14-09. Paris: ESA. [Google Scholar]
  14. Asravor, Richard. 2018. Smallholder Farmers’ Risk Perceptions and Risk Management Responses: Evidence from the Semi-Arid Region of Ghana. African Journal of Economic and Management 9: 367–87. [Google Scholar] [CrossRef]
  15. AZAO (Awi Zone Agricultural Office). 2022. Secondary Data Provision Maize Producers’ Socio-Economic Data of 2021 Production Year. Injibara: AZAO (Awi Zone Agricultural Office). [Google Scholar]
  16. Bartholomew, David, Martin Knott, and Irini Moustaki. 2011. Latent Variable Models and Factor Analysis: A Unified Approach. John Wiley and Sons: vol. 904. [Google Scholar]
  17. Basrowi, D. 2012. Study Evaluation Based on Performance. Bandung: Karya Putra Darwati. [Google Scholar]
  18. Belaineh, Legesse. 2003. Risk Management Strategies of Smallholder Farmers in the Eastern Highlands of Ethiopia. Ph.D. dissertation, Graduate School of Swedish University, Uppsala, Sweden; 173p. [Google Scholar]
  19. Belderbos, Rene, Martin Carree, and Boris Lokshin. 2004. Complementarities in Research and Development Strategies. Review of Industrial Organization 28: 401–26. [Google Scholar] [CrossRef]
  20. Bellemare, Marc F. 2015. Rising Food Prices, Food Price Volatility, and Social Unrest. American Journal of Agricultural Economics 97: 1–21. [Google Scholar] [CrossRef] [Green Version]
  21. Birkholz, Sharon, Melanie Muro, Paul Jeffrey, and Heather M. Smith. 2014. Rethinking the Relationship between Flood Risk Perception and Flood Management. Science of the Total Environment 478: 12–20. [Google Scholar] [CrossRef]
  22. Bowles, Samuel, and Herbert Gintis. 2002. Social Capital and Community Governance. The Economic Journal 112: 419–36. [Google Scholar] [CrossRef]
  23. Cappellari, Lorenzo, and Stephen Jenkins. 2003. Multivariate Probit Regression using Simulated Maximum Likelihood. Stata Journal 3: 278–94. [Google Scholar] [CrossRef]
  24. Chandio, Abbas Ali, and J. I. A. N. G. Yuansheng. 2018. Determinants of Adoption of Improved Rice Varieties in Northern Sindh, Pakistan. Rice Science 25: 103–10. [Google Scholar] [CrossRef]
  25. Chavas, Jean-Paul, Joseph Cooper, and Steven Wallander. 2019. The Impact of Input and Output Decisions on Agricultural Production Risk. Journal of Agricultural and Resource Economics 44: 513–35. [Google Scholar]
  26. Chikezie, C., N. M. Chidiebere-Mark, I. A. Maduike, O. B. Ibeagwa, and E. U. Onyekachi. 2019. Determinants of Risk Management Strategies among Rice Farmers in Ebonyi State, Nigeria. The International Journal of Agriculture, Management and Technology 3: 84–88. [Google Scholar]
  27. Christoplos, Ian. 2010. Mobilizing the Potential of Agricultural Advisory Services. Rome: FAO. [Google Scholar]
  28. Cochran, W. G. 1963. Sampling Technique, 2nd ed. New York: John Wiley and Sons Inc. [Google Scholar]
  29. Crane, Laurence, Gene Gantz, and Steve Isaacs Isaacs. 2013. Introduction to Risk Management, 2nd ed. USA Department of Agriculture. [Google Scholar]
  30. Dabkiene, Vida. 2020. Off-Farm Role in Stabilizing Disposable Farm Income: A Lithuanian Case Study. Agricultural Economics (Zemědělská Ekonomika) 66: 325–34. [Google Scholar] [CrossRef]
  31. Dadzie, Samuel Kwesi Ndzebah, and Henry de-Graft Acquah. 2012. Attitudes toward Risk and Coping Responses: The Case of Food Crop Farmers at Agona Duakwa in Agona East District of Ghana. International Journal of Agriculture and Forestry 2: 29–37. [Google Scholar] [CrossRef]
  32. Ellis, E. 2017. Factors affecting Risk Management Strategies to Climate Change Effects in Ghana. International Journal of Food and Agricultural Economics 5: 1–17. [Google Scholar]
  33. El-Osta, Hisham S., and Mitchell J. Morehart. 2008. Determinants of Poverty among U.S. Farm Households. Journal of Agricultural and Applied Economics 40: 1–20. [Google Scholar] [CrossRef]
  34. Fitch, Kimberley. 2007. Managing Risks on the Small Farm. A Plain Language Guide from the New Entry Sustainable Farming Project. Washington, DC: United States Development of Agriculture. [Google Scholar]
  35. Guan, Yanling, and Tang Dragon. 2018. Employees’ Risk Attitude and Corporate Risk Taking: Evidence from Pension Asset Allocations. Journal of Corporate Finance 48: 261–74. [Google Scholar] [CrossRef]
  36. Gujarathi, Damodar M. 2004. Basic Econometrics, 4th ed. New York: Mcgraw-Hill, Companies. [Google Scholar]
  37. Hardaker, B. J., R. B. M. Huirne, J. R. Anderson, and G. Lien. 2004. Coping with Risk in Agriculture, 2nd ed. Wallingford: Cabi Publishing. [Google Scholar]
  38. Harman, Harry H. 1976. Modern Factor Analysis, 3rd ed. Chicago: The University of Chicago Press. [Google Scholar]
  39. Hillson, David, and Ruth Murray-Webster. 2005. Understanding and Managing Risk Attitude. London: Routledge. 11p. [Google Scholar]
  40. Hunnes, Dana Ellis. 2015. The Effects of Weather, Household Assets, and Safety-Net Programs on Household Food Security in Ethiopia Using Rural Household Panel Data. Regional Environmental Change 15: 1095–104. [Google Scholar] [CrossRef]
  41. IFPRI (International Food Policy Research Institute). 2010. Maize Value Chain Potential in Ethiopia, Constraints and Opportunities for Enhancing System. Working Paper. Washington, DC: IFPRI (International Food Policy Research Institute). [Google Scholar]
  42. James, Yohana, and Yan Yunxian. 2021. Price Risk Perceptions and Adoption of Management Strategies by Smallholder Rice Farmers in Mbeya region, Tanzania. Cogent Food and Agriculture 7: 1–16. [Google Scholar]
  43. Just, Richard E., and Rulon D. Pope. 1979. Production Function Estimation and Related Risk Considerations. American Journal of Agricultural Economics 61: 276–84. [Google Scholar] [CrossRef]
  44. Kahan, David. 2008. Managing Risk in Farming. Rome: Food and Agricultural Organization of the United Nations. 120p. [Google Scholar]
  45. Kisaka-Lwayo, Maggie, and Ajuruchu kwu Obi. 2012. Risk Perceptions and Management Strategies by Smallholder Farmers in KwaZulu-Natal Province, South Africa. International Journal of Agricultural Management 1: 28–39. [Google Scholar]
  46. Kislingerova, Sofia, and Jindřich Spicka. 2022. Factors Influencing the Take-Up of Agricultural Insurance and the Entry into the Mutual Fund: A Case Study of the Czech Republic. Journal of Risk and Financial Management 15: 366. [Google Scholar] [CrossRef]
  47. Kouamé, Euphrasie Ben-Houassa. 2010. Risk, risk Aversion and Choice of Risk Management. Strategies by Cocoa Farmers in Western Côte d’Ivoire. Paper presented at the CSAE Conference 2010: Economic Development in Africa, St Catherine’s College, Oxford, UK, March 21–23. [Google Scholar]
  48. Koundouri, Phoebe, Céline Nauges, and Vangelis Tzouvelekas. 2006. Technology Adoption under Production Risk: Theory and Application to Irrigation Technology. American Journal of AgriculturalEconomics 88: 657–70. [Google Scholar] [CrossRef]
  49. Kumar, Krishna. 1987. Conducting Group Interviews in Developing Countries. A.I.D. Program Design and Evaluation Methodology Report No. 8. Washington, DC: Agency for International Development. [Google Scholar]
  50. Kuru, Jemal. 2010. Access and Utilization of Agricultural Knowledge and Information by Women Dairy Farmers: The Case of Ada’a District, Oromia Regional State. Master’s thesis, The School of Graduate Studies of Haramaya University, Dire Dawa, Ethiopia; 134p. [Google Scholar]
  51. Lee, Yu Na. 2016. Price Risk and Migration: Evidence from Rural Ethiopia. Paper presented at the 2016 Annual Meeting, Washington, DC, USA, March 31–April 2. [Google Scholar]
  52. Likert, Rensis. 1932. A Technique for the Measurement of Attitudes. Archives of Psychology 22: 1–55. [Google Scholar]
  53. Magnusson, Guđmundur. 1969. Production under Risk: A Theoretical Study. Uppsala: Almqvist and Wiksells. [Google Scholar]
  54. Mesfin, Wondimagegn, Bekabil Fufa, and Jema Haji. 2011. Pattern, Trend and Determinants of Crop Diversification: Empirical Evidence From Smallholdersin Eastern Ethiopia. Journal of Economics and Sustainable Development 2: 78–89. [Google Scholar]
  55. Michalscheck, Mirja. 2019. Exploring Smallholder Farm Decisions through Typologies and Serious Gaming. Paper presented at the Tropentag: Filling Gaps and Removing Traps for Sustainable Resource Management, University of Kassel, Kassel, Germany, September 18–20; Wageningen: Wageningen University. [Google Scholar]
  56. Mishra, Ashok K., and Hisham S. El-Osta. 2002. Managing Risk in Agriculture through Hedging and Crop Insurance: What Does a National Survey Reveal? Agricultural Finance Review 62: 135–48. [Google Scholar] [CrossRef]
  57. Mitra, Sandip, and Sajia Sharmin. 2019. Risk attitudes and Financial Profitability of Tomato Farmers—A Study in Bangladesh. The Journal of Agricultural Sciences—Sri Lanka 14: 207–17. [Google Scholar] [CrossRef]
  58. Moscardi, Edgardo, and Alain de Janvry. 1977. Attitude toward Risk among Peasants: An Econometric Application Approach. American Journal of Agricultural Economics 59: 710–21. [Google Scholar] [CrossRef]
  59. Nahraeni, W. 2012. Efficiency and Sustainable Value of Horticulture Farming in High Landof West Java. Ph.D. dissertation, Bogor Agriculture University, Bogor, Indonesia; 100p. [Google Scholar]
  60. Ngeno, Vincent. 2018. Impact of Dairy Hubs on Smallholder Welfare: Empirical Evidence from Kenya. Agricultural and Food Economics 6: 1–9. [Google Scholar] [CrossRef]
  61. Nuss, Emily T., and Sherry A. Tanumihardjo. 2010. Maize: A Paramount Staple Crop in the Context of Global Nutrition. Comprehensive Reviews in Food Science and Food Safety 9: 417–36. [Google Scholar] [CrossRef]
  62. OECD (Organization for Economic Co-operation and Development). 2011. Managing Risk in Agriculture: Policy Assessment and Design. Paris: OECD. [Google Scholar]
  63. Ogundari, Kolawole, and Olajide O. Akinbogun. 2010. Modeling Technical Efficiency with Production Risk: A Study of Fish Farms in Nigeria. Marine Resource Economics 25: 295–308. [Google Scholar] [CrossRef]
  64. Onumah, Gideon. 2018. Platform for Agricultural Risk Management. Managing Risks to Improve Farmers’ Livelihoods in Ethiopia. Greenwich University. Available online: https://p4arm.org/ (accessed on 20 December 2022).
  65. Osondu, C. K., C. O. Anyiro, J. C. Ijioma, and K. Obike. 2013. Analysis of Risk Management Strategy by Arable Crop Farmers in Abia State, Nigeria. World Research Journal of Agronomy 2: 26–29. [Google Scholar]
  66. Palinkas, Peter, and Csaba Székely. 2008. Farmers’ Perceptions on Risk and Crisis Risk Management. In Income Stabilisation in European Agriculture: Design and Economic Impact of Risk Management Tools. Edited by Miranda P. M. Meuwissen, Marcel A. P. M. Van Asseldonk and Ruud B. M. Huirne. Wageningen: Wageningen Academic Publishers, pp. 97–122. [Google Scholar]
  67. Ping, Qing, Muhammad Amjed, Muhammad Abid, Umar Ijaz, Adnan Nazir, and Azka Rehman. 2016. Adoption of off-farm diversification income sources in managing agricultural risks among cotton farmers in Punjab Pakistan. Journal of Applied Environmental and Biological Sciences 6: 47–53. [Google Scholar]
  68. Pyle, David H., and Stephen J. Turnovsky. 1970. Safety-First and Expected Utility Maximization in Mean-Standard Deviation Portfolio Analysis. The Review of Economics and Statistics 52: 75–81. [Google Scholar] [CrossRef]
  69. Ranum, Peter, Juan Pablo Peña-Rosas, and Maria Nieves Garcia-Casal. 2014. Global maize Production, Utilization and Consumption. Annals of the New York Academy of Sciences 1312: 105–12. [Google Scholar] [CrossRef] [PubMed]
  70. Rietveld, Toni, and Roeland Van Hout. 1993. Statistical Techniques for the Study of Language and Language Behaviour. Berlin: Mouton de Gruyte. [Google Scholar]
  71. Robinson, Lindon J., P. J. Barry, J. B. Kliebestein, and G. F. Patrick. 1984. Risk attitudes: Concepts and Measurement Approaches. In Risk Management in Agriculture. Edited by P. J. Barry. Ames: Iowa State University. [Google Scholar]
  72. Rogers, Ronald W. 1975. A Protection Motivation Theory of Fear Appeals and Attitude Change. The Journal of Psychology 91: 93–114. [Google Scholar] [CrossRef]
  73. Rogers, Ronald W. 1983. Cognitive and psychological processes in fear appeals and attitude change: A revised theory of protection motivation. In Social Psychophysiology: A Sourcebook. New York: Guilford Press, pp. 153–176. [Google Scholar]
  74. Rohrmann, Bernd. 2008. Risk Perception, Risk Attitude, Risk Communication, Risk Management: A Conceptual Appraisal. Paper presented at the 15th Internaional Emergency Management Society (TIEMS) Annual Conference, Prague, Czech Republic, June 17–19. [Google Scholar]
  75. Roy, Andrew. 1952. Safety First and the Holding of Assets. Econometrica 20: 431–49. [Google Scholar] [CrossRef]
  76. Sadiq, Sanusi M., I. P. Singh, M. Lawal, M. M. Ahmad, and O. C. Eije. 2018. Application of Safety-First Approach to Measure Risk Behaviourof Yam Farmers In Benue State, Nigeria. Journal of Scientific Agriculture 2: 52–61. [Google Scholar]
  77. Saqib, Shahab E., Mokbul Morshed Ahmad, Sanaullah Panezai, and Irfan Ahmad Rana. 2016. An Empirical Assessment of Farmers’ Risk Attitudes in Flood-Prone Areas of Pakistan. International Journal of Disaster Risk Reduction 18: 107–14. [Google Scholar] [CrossRef]
  78. Sarker, Aba R., John Rolfe, and Jayanath Ananda. 2022. Analysis of Technical Efficiency of Dry Season Rice Production in Saline and Non-Saline Areas of Bangladesh. Journal of Environmental Management 316: 1–15. [Google Scholar] [CrossRef]
  79. Senapati, Asis Kumar. 2020. Evaluation of Risk Preferences and Coping Strategies to Manage With Various Agricultural Risks: Evidence from India. Heliyon 6: e03503. [Google Scholar] [CrossRef]
  80. Sherrick, Bruce J., Peter J. Barry, Paul N. Ellinger, and Gary D. Schnitkey. 2004. Factors Influencing Farmers’ Crop Insurance Decisions. American Journal of Agricultural Economics 86: 103–14. [Google Scholar] [CrossRef]
  81. Siegrist, Michael, and Christina Hartmann. 2020. Consumer Acceptance of Novel Food Technologies. Nature Food 1: 343–50. [Google Scholar] [CrossRef]
  82. Solano, Giacomo, and Gerrit Rooks. 2018. Social Capital of Entrepreneurs in Developing Country: The Effects of Gender on Access to and Requests for Resources. Social Networks 54: 279–90. [Google Scholar] [CrossRef]
  83. Sulewski, Piotr, and Anna Kłoczko-Gajewska. 2014. Farmers’ Risk Perception, Risk Aversion and Strategies to Cope With Production Risk: An Empirical Study from Poland. Studies in Agricultural Economics 116: 140–47. [Google Scholar] [CrossRef]
  84. Tabachnick, Barbara, and Linda Fidell. 2007. Using Multivariate Statistics, 5th ed. New York: Allyn and Bacon. [Google Scholar]
  85. Taherdoost, Hamed. 2019. What Is the Best Response Scale for Survey and Questionnaire Design; Review of Different Lengths of Rating Scale/Attitude Scale/Likert Scale. International Journal of Academic Research in Management 8: 1–10. [Google Scholar]
  86. Temesgen, Daniel, Umer Hinde, and Jamal Yusuf. 2015. Determinants of Farm Women Participation in Agricultural Extension Training Programs: A Case from Selected District of Oromia Region of Ethiopia. International Journal of Agricultural Science Research 4: 67–77. [Google Scholar]
  87. Ullah, Raza, Damien Jourdain, Ganesh P. Shivakoti, and Shobhakar Dhakal. 2015. Managing Catastrophic Risks in Agriculture: Simultaneous Adoption of Diversification and Precautionary Savings. International Journal of Disaster Risk Reduction 12: 268–77. [Google Scholar] [CrossRef]
  88. Van Dijk, Michiel, Tomas Morley, Marloes van Loon, Pytrik Reidsma, Kindie Tesfaye, and Martin K. van Ittersum. 2020. Reducing the Maize Yield Gap in Ethiopia: Decomposition and Policy Simulation. Agricultural Systems 183: 1–11. [Google Scholar] [CrossRef]
  89. Van Ittersum, Martin K., Lenny G. J. Van Bussel, Joost Wolf, Patricio Grassini, Justin Van Wart, Nicolas Guilpart, Lieven Claessens, Hugo de Groot, Keith Wiebe, Daniel Mason-D’Croz, and et al. 2016. Can Sub-Saharan Africa feed itself? Proceedings of the National Academy of Sciences USA 113: 14964–69. [Google Scholar] [CrossRef]
  90. Van-Vugt, Daniel, A. C. Franke, and K. E. Giller. 2018. Understanding variability in the Benefits of N2-Fixation in Soybean-Maize Rotations on Smallholder Farmers’ Fields in Malawi. Agriculture, Ecosystems & Environment 261: 241–50. [Google Scholar]
  91. Velandia, Margarita, Roderick M. Rejesus, Thomas O. Knight, and Bruce J. Sherrick. 2009. Factors affecting Farmers’ Utilization of Agricultural Risk Management Tools: The Case of Crop Insurance, Forward Contracting, and Spreading Sales. Journal of Agricultural and Applied Economics 41: 107–23. [Google Scholar] [CrossRef]
  92. Vihi, S. K., B. Jesse, A. A. Dalla, and Y. Sadiku. 2018. Analysis of Farm Risk and Coping Strategies among Maize Farmers in Lere Local Government Area of Kaduna State, Nigeria. Asian Journal of Research in Agriculture and Forestry 1: 1–10. [Google Scholar] [CrossRef]
  93. Wachinger, Gisela, Ortwin Renn, Chloe Begg, and Christian Kuhlicke. 2013. The Risk Perception Paradox-Implications for Governance and Communication of Natural Hazards. Risk Analysis 33: 1049–65. [Google Scholar] [CrossRef] [PubMed]
  94. Wana, Hika, and Afsaw Lemessa. 2019. Analysis of Productivity and Efficiency of Maize Production in Gardega-Jarte District of Ethiopia. World Journal of Agricultural Sciences 15: 180–93. [Google Scholar]
  95. Weldegebriel, Hagos. 2014. The Determinants of Technical Efficiency of Farmers in Teff, Maize and Sorghum Production: Empirical Evidence from Central Zone of Tigray Region, Ethiopia. Journal Economics 13: 1–36. [Google Scholar]
  96. Wolke, Thomas. 2007. Risk Management. Munichen: De Gruyter Oldenburg. [Google Scholar]
  97. Wondim, Desalegn, Tewodros Tefera, and Yitna Tesfaye. 2020. Determinants of Maize Market Supply, Production and Marketing Constraints: The Case of Dembecha District, West Gojjam Zone, Ethiopia. International Journal of Economy, Energy and Environment 5: 83–89. [Google Scholar] [CrossRef]
  98. Yiadom-Boakye, Ebenezer, Ebenezer Owusu-Sekyere, Paul Kwame Nkegbe, and Kwasi Ohene-Yankyera. 2013. Gender, Resource Use and Technical Efficiency among Rice Farmers in the Ashanti Region, Ghana. Academe Research Journals 2: 102–10. [Google Scholar]
  99. Yong, Gia, and Sean Pearce. 2013. A Beginner’s Guide to Factor Analysis: Focusing on Exploratory Factor Analysis. Tutorials in Quantitative Methods for Psychology 9: 79–94. [Google Scholar] [CrossRef]
  100. Zellner, Arnold. 1962. An Efficient Method of Estimating Seemingly Unrelated Regression Equations and Test for Aggregation Bias. Journal of American Statistical Association 57: 348–68. [Google Scholar] [CrossRef]
  101. Zulfiqar, Farhad, Raza Ullah, Muhammad Abid, and Abid Hussain. 2016. Cotton Production under Risk: A Simultaneous Adoption of Risk Coping Tools. Natural Hazards 84: 959–74. [Google Scholar] [CrossRef]
Figure 1. Conceptual framework of the study.
Jrfm 16 00087 g001
Figure 2. Input affordability risk perceptions.
Jrfm 16 00087 g002
Figure 3. Input availability risk perception.
Jrfm 16 00087 g003
Figure 4. Curvy-linear relationship between inputs and output.
Jrfm 16 00087 g004
Figure 5. Risk aversion behaviour of maize producers.
Jrfm 16 00087 g005
Table 1. Comparison of functional forms.
Functional FormsSignificant Variables NoLog Likelihood ValuesAIC ValueBIC ValueR2RSS
Cobb–Douglas5−69.03269152.0654178.929559%30.03
Translog8−21.4207598.8415206.297969%22.75
Generalized Leontief7−25.3776594.7553179.185468%23.28
CES2−97.18825208.3765235.240651%35.39
Source: Author’s Computation based on 2022 data. Note: RSS denoted residual sum of square.
Table 2. NLS estimate of the translog model.
NLS EstimatesDelta Method
LnmaizeCoef.St.Err.t-Valueey/exSt.Err.z-Value
Constant−18.5632.632−7.05 ***
lnseed1.1320.9451.2011.7939.8531.200
lnDAP0.330.9370.353.57910.1580.350
LnUREA3.2210.7754.16 ***34.1158.3274.100 ***
Lnlandsize−1.0290.429−2.40 **1.7520.7342.390 **
lnoxenday1.5390.8881.73 *19.02411.0061.730 *
lnmanday1.8350.5613.27 ***26.8378.2763.240 **
lnseedsq−0.0760.168−0.45−1.4683.241−0.450
lnDAPsq0.1840.2530.733.8455.2790.730
lnUREAsq−0.1510.208−0.72−3.0234.180−0.720
lnlandsizesq−0.0660.086−0.77−0.0640.083−0.770
lnoxendaysq0.1940.1931.015.2795.2391.010
lnmandaysq−0.2120.106−1.99 **−8.0184.034−1.990 **
lnseedDAP−0.1840.129−1.43−7.3355.148−1.420
lnseedUREA0.0690.1030.672.6974.0370.670
lnseedLANDSIZE0.0450.0790.57−0.2800.491−0.570
lnseed.OXENDAY−0.0470.104−0.45−2.1384.742−0.450
LnseedMANDAY−0.0180.108−0.16−0.9385.748−0.160
lndapUREA0.0250.1420.170.9985.7790.170
lndapLANDSIZE−0.0830.094−0.880.5290.6020.880
lndapOXENDAY−0.1040.138−0.75−4.9246.548−0.750
lndapMANDAY0.0220.1130.191.2156.3120.190
lnureaLANDSIZE−0.0150.084−0.170.0910.5260.170
LnureaOXENDAY−0.3960.096−4.12 ***−18.3914.527−4.060 ***
LnureaMANDAY−0.20.082−2.44 **−10.8624.468−2.430 **
lnlandsizeOXENDAY0.0870.0781.12−0.6350.568−1.120
lnlandsizeMANDAY0.1620.0523.10***−1.4100.458−3.080 ***
lnoxendayMANDAY0.0260.0830.311.6415.2430.310
Mean dependent var.0.351SD dependent var.0.463
R-squared0.690Number of obs.343.000
Akaike crit. (AIC)98.8415Bayesian crit. (BIC)206.2979
*** p < 0.01, ** p < 0.05, * p < 0.1. Source: Author computation based on 2022 survey data.
Table 3. Factor analysis output for input risk management strategies.
Risk Management Strategies Factors
MeanS.D.12345
Uses high yielding varieties 3.3152.172−0.1290.542−0.028−0.177−0.232
Use market information3.1921.9800.238−0.0870.043−0.0380.430
Weeding 3.2622.010−0.1310.3930.0180.0430.363
Discusses with extension experts3.8572.119−0.1600.4170.082−0.0040.140
Storage6.2191.4410.053−0.038−0.0260.0670.428
Saving money6.0401.7090.149−0.1180.145−0.4300.181
Create linkage with input dealers5.2302.1490.0090.121−0.0370.0300.466
Fertilizer application3.6122.184−0.0890.389−0.0050.021−0.246
Collaborates with farmers 3.9122.1240.401−0.2230.032−0.009−0.065
Labour hiring3.3672.0550.454−0.2420.050−0.0650.232
Training3.4142.2520.558−0.227−0.067−0.015−0.166
Spreading purchase across sellers2.9331.607−0.1370.1770.571−0.237−0.258
Irrigation3.0001.9040.053−0.0190.175−0.0650.031
Planting involvement3.5251.985−0.0090.0240.107−0.020−0.107
Spread purchase across time3.1311.8800.033−0.0140.356−0.0530.073
Purchase of farm inputs on credit3.1491.822−0.075−0.0250.0600.420−0.120
Borrowing money2.7321.657−0.0640.025−0.1180.5100.234
Off-farm activity involvement2.8801.732−0.031−0.0590.3480.0740.067
Selling of assets2.9791.786−0.004−0.142−0.0080.6150.063
Eigenvalues 4.3232.3681.6791.4221.149
Total variance explained 22.75112.4648.8397.4826.049
Cumulative percent of variance explained 22.75135.21444.05351.53657.58
Kaiser-Meyer-Olkin Measure of Sampling Adequacy 0.808
Chi-square 1773.594
Df. 171
Sig. p< 0.000
Note: Factor 1indicates human risk management strategies, Factor 2 indicate production risk management strategies, Factor 3 indicates diversification, Factor 4 indicates financial risk management strategies and Factor 5 indicates market risk management strategies. Moreover, the numbers in bold represents items with high factor loading.
Table 4. SUR model result for predictors of input risk management strategies.
Explanatory VariablesRisk Management Strategies
Human Risk ManagementProduction Risk ManagementDiversificationFinancial Risk ManagementMarket Risk Management
Gender−0.1020.034−0.0210.038−0.128
(0.111)(0.126)(0.127)(0.137)(0.137)
Family size0.0050.0640.101 **−0.156 ***−0.008
(0.035)(0.039)(0.040)(0.044)(0.044)
Marital status0.414***0.152−0.1430.1160.015
(0.124)(0.140)(0.142)(0.153)(0.153)
Education level
0.365 **−0.0510.2160.190−0.474 **
Read and write(0.154)(0.174)(0.176)(0.191)(0.191)
0.323 **0.305 *0.2270.188−0.167
Primary education(0.147)(0.167)(0.169)(0.183)(0.183)
0.305 **0.337 **0.271 *0.347 **0.212
Secondary education(0.141)(0.160)(0.162)(0.175)(0.175)
Experience0.0040.047 **0.055 ***0.044 **0.062 ***
(0.017)(0.019)(0.020)(0.022)(0.022)
Extension contact0.043 ***0.024 *0.020−0.0120.003
(0.013)(0.014)(0.014)(0.016)(0.016)
Farm size0.259 *−0.512 ***−0.393 **0.0890.218
(0.138)(0.156)(0.158)(0.171)(0.171)
Information access0.164−0.1030.0080.1600.278**
(0.106)(0.120)(0.122)(0.132)(0.132)
Farm income−0.0020.003 **0.000−0.0020.002
(0.001)(0.002)(0.002)(0.002)(0.002)
Off-farm income−0.004−0.0020.009 ***0.009 ***−0.001
(0.003)(0.003)(0.003)(0.003)(0.003)
Non-farm income−0.009 **−0.0030.0020.009 *−0.006
(0.004)(0.005)(0.005)(0.006)(0.006)
Amount Credited0.063 *0.035−0.0330.091 **−0.042
(0.035)(0.039)(0.039)(0.043)(0.043)
TLU0.0060.021 *−0.0150.021 *0.025**
(0.010)(0.012)(0.012)(0.013)(0.013)
Social group membership−0.0170.357 ***−0.0840.126−0.008
(0.106)(0.120)(0.122)(0.132)(0.132)
Distance−0.020 **−0.009−0.000−0.034 ***0.016
(0.009)(0.010)(0.010)(0.011)(0.011)
Land ownership0.1140.121−0.1080.087−0.106
(0.126)(0.143)(0.144)(0.156)(0.156)
Input affordability perception0.092 ***−0.068 **0.075 ***−0.126 ***0.084 ***
(0.025)(0.029)(0.029)(0.031)(0.031)
Input availability perception−0.0010.122 ***−0.052−0.0130.071 **
(0.029)(0.032)(0.033)(0.035)(0.035)
Risk aversion
−0.676 ***−0.100−0.0390.0890.665 ***
Medium risk averse(0.118)(0.133)(0.135)(0.146)(0.146)
−0.740 ***0.0840.322−0.0490.501*
High risk averse(0.211)(0.239)(0.242)(0.262)(0.262)
R20.34260.22970.16070.20570.2031
Chi2-value178.78 ***102.31 ***65.66 ***88.82 ***87.41 ***
*** p < 0.01, ** p < 0.05, * p < 0.1. Source: Author computation based on 2022 survey data.
Disclaimer/Publisher’s Note: The statements, opinions and data contained in all publications are solely those of the individual author(s) and contributor(s) and not of MDPI and/or the editor(s). MDPI and/or the editor(s) disclaim responsibility for any injury to people or property resulting from any ideas, methods, instructions or products referred to in the content.

