Dynamic Relationship between Volatility Risk Premia of Stock and Oil Returns
Abstract
:1. Introduction
2. Volatility Risk Premium (VRP)
3. Data
4. Model Selection
4.1. Unit Root Tests
4.2. VAR Model
4.3. Choice of Lag Length
5. Empirical Results
5.1. Results for the Whole Period
5.2. Results for the Sub-Periods
6. Robustness Analysis
7. Summary and Concluding Remarks
Author Contributions
Funding
Data Availability Statement
Acknowledgments
Conflicts of Interest
Appendix A. Estimation of Realized Volatility by a Stochastic Volatility Model
| Parameter | Period 1 | Period 2 | Period 3 | Period 4 | Period 5 |
|---|---|---|---|---|---|
| 0.305 (0.192, 0.415) | −0.336 (−0.496, −0.178) | −0.017 (−0.03, −0.01) | 0.007 (0.003, 0.010) | −0.194 (−0270, −0.122) | |
| 0.041 (−0.039, 0.123) | 0.068 (−0.017, 0.151) | 0.032 (−0.044, 0.109) | 0.028 (−0.046, 0.101) | 0.085 (0.004, 0.164) | |
| 1.232 (0.936, 1.530) | 2.472 (2.084, 2.820) | 1.278 (1.134, 1.428) | 0.292 (0.095, 0.509) | 1.675 (1.413, 1.939) | |
| 0.849 (0.774, 0.915) | 0.891 (0.835, 0.940) | 0.809 (0.733, 0.873) | 0.846 (0.771, 0.903) | 0.914 (0.876, 0.946) | |
| 0.380 (0.336, 0.431) | 0.369 (0.325, 0.417) | 0.363 (0.325, 0.406) | 0.368 (0.328, 0.413) | 0.349 (0.311, 0.391) | |
| −0.488 (−0.630, −0.335) | −0.4649 (−0.608, −0.310) | −0.467 (−0.587, −0.331) | −0.457 (−0.595, −0.308) | −0.413 (−0.550, −0.269) | |
| 8.047 (6.455, 9.753) | 8.083 (6.520, 9.757) | 8.455 (6.972, 10.116) | 8.014 (6.476, 9.664) | 8.534 (6.994, 10.210) |
| 1 | Results by extant researches about the effects of oil volatility-related variables on stock returns and volatility are mixed. For example, Ornelas and Mauad (2019) find little predictability of oil VRP on S&P 500 returns, Bams et al. (2017) find that difference of oil VRP is priced only on returns of oil-related stocks, and Christoffersen and Pan (2018) find predictability of oil implied volatility on stock returns and implied volatility. |
| 2 | Volatility swap and variance swap, where variance is the square of volatility, are traded in over-the-counter derivative markets. |
| 3 | Ornelas and Mauad (2019) explain what kind of realized volatility is used in the literature to approximate the expected future volatility. |
| 4 | https://www.cboe.com/us/indices/dashboard/VIX/ (3 March 2022). |
| 5 | http://realized.oxford-man.ox.ac.uk/ (3 March 2023). |
| 6 | https://www.cboe.com/us/indices/dashboard/OVX/ (3 March 2023). |
| 7 | Appendix A explains how we estimate the realized volatility of oil. |
| 8 | For Augmented Dickey–Fuller (ADF), Dickey–Fuller–GLS (DF–GLS), and Phillips–Perron (PP) tests, see Dickey and Fuller (1979); Elliott et al. (1996); and Phillips and Perron (1988), respectively. |
| 9 | Analyses with different lag length provide results quite similar to those in this paper. |
| 10 | We obtain the similar result if we reverse the order of and . We select this ordering since the results of Granger causality tests show more persistent Granger causality from oil to stock than from stock to oil for most of the sub-periods. For more detail, see next subsection. |
References
- Bams, Dennis, Gildas Blanchard, Iman Honarvar, and Thorsten Lehnert. 2017. Does oil and gold price uncertainty matter for the stock market? Journal of Empirical Finance 44: 270–85. [Google Scholar] [CrossRef]
- Bollerslev, Tim, George Tauchen, and Hao Zhou. 2009a. Expected Stock Returns and Variance Risk Premia. Review of Financial Studies 22: 4463–92. [Google Scholar] [CrossRef]
- Bollerslev, Tim, James Marrone, Lai Xu, and Hao Zhou. 2009b. Stock Return Predictability and Variance Risk Premia: Statistical Inference and International Evidence. Journal of Financial and Quantitative Analysis 60: 633–61. [Google Scholar] [CrossRef] [Green Version]
- Bouri, Elie, Brian Luceyb, and David Roubaudca. 2020. Dynamic and determinants of spillovers across the option-implied volatilities of US equities. Quarterly Review of Economics and Finance 75: 257–64. [Google Scholar] [CrossRef]
- Bouri, Elie, Xiaojie Lei, Yahua Xu, and Hongwei Zhang. 2023. Connectedness in implied higher-order moments of precious metals and energy markets. Energy 263: 125588. [Google Scholar] [CrossRef]
- Christoffersen, Peter, and Xuhui (Nick) Pan. 2018. Oil volatility risk and expected stock returns. Journal of Banking and Finance 95: 5–26. [Google Scholar] [CrossRef] [Green Version]
- Della Corte, Pasquale, Tarun Ramadorai, and Lucio Sarno. 2016. Volatility risk premia and exchange rate predictability. Journal of Financial Economics 120: 21–40. [Google Scholar] [CrossRef]
- Dickey, David A., and Wayne A. Fuller. 1979. Distribution of the Estimators for Autoregressive Time Series with a Unit Root. Journal of the American Statistical Association 74: 427–31. [Google Scholar] [CrossRef]
- Diebold, Francis X., and Kamil Yilmaz. 2014. On the network topology of variance decomppositions: Measuring the connectedness of financial firms. Journal of Econometricss 182: 119–34. [Google Scholar] [CrossRef] [Green Version]
- Dutta, Anupam, Elie Bourib, and David Roubaud. 2019. Nonlinear relationships amongst the implied volatilities of crude oil and precious metals. Resources Policy 61: 473–78. [Google Scholar] [CrossRef]
- Elliott, Graham, James H. Stock, and Thomas J. Rotenberg. 1996. Efficient Tests for an Autoregressive Unit Root. Econometrica 64: 813–36. [Google Scholar] [CrossRef] [Green Version]
- Gagnon, Marie-Helene, Gabriel J. Power, and Dominique Toupin. 2015. Dynamics between crude oil and equity markets under the risk-neutral measure. Applied Economics Letters 22: 370–77. [Google Scholar] [CrossRef]
- Hattori, Masazumi, Ilhoyock Shim, and Yoshihiko Sugihara. 2021. Cross-stock market spillovers through variance risk premiums and equity flows. Journal of International Money and Finance 119: 102480. [Google Scholar] [CrossRef]
- Iqbal, Najaf, Elie Bouri, Guangrui Liu, and Ashish Kumar. 2022. Volatility spillovers during normal and high volatility states and their driving factors: A cross-country and cross-asset analysis. International Journal of Finance and Economics, 1–21. [Google Scholar] [CrossRef]
- Liu, Ming-Lei, Qiang Ji, and Ying Fan. 2013. How does all market uncertainty interact with other markets? An empirical analysis of implied volatility index. Energy 55: 860–68. [Google Scholar] [CrossRef]
- Londono, Juan, and Hao Zhou. 2016. Variance Risk Premiums and the Forward Premium Puzzle. Journal of Financial Economics 124: 415–40. [Google Scholar] [CrossRef] [Green Version]
- Ohashi, Kazuhiko, and Tatsuyoshi Okimoto. 2016. Increasing Trends in the Excess Comovement of Commodity Prices. Journal of Commodity Markets 1: 48–64. [Google Scholar] [CrossRef] [Green Version]
- Ornelas, Jose Renato Haas, and Roberto Baltieri Mauad. 2019. Volatility risk premia and futures commodities returns. Journal of International Money and Finance 96: 341–60. [Google Scholar] [CrossRef]
- Phillips, Peter C. B., and Pierre Perron. 1988. Testing for a Unit Root in Time Series Regression. Biometrika 75: 335–46. [Google Scholar] [CrossRef]
- Robe, Michel A., and Jonathan Wallen. 2016. Fundamentals, Derivatives Market Information and Oil Price Volatility. Journal of Futures Markets 36: 317–44. [Google Scholar] [CrossRef]
- Silvennoinen, Annastiina, and Susan Thorp. 2013. Financialization, Crisis and Commodity Correlation Dynamics. Journal of International Financial Markets Institutions & Money 24: 42–65. [Google Scholar] [CrossRef] [Green Version]
- Tang, Ke, and Wei Xiong. 2012. Index Investment and the Financialization of Commodities. Financial Analysts Journal 68: 54–74. [Google Scholar] [CrossRef]
- Zhang, Xinxin, Elie Bouri, Yahua Xu, and Gongqiu Zhang. 2022. The asymmetric relationship between returns and option-implied higher moments: Evidence from the crude oil market. Energy Economics 109: 105950. [Google Scholar] [CrossRef]
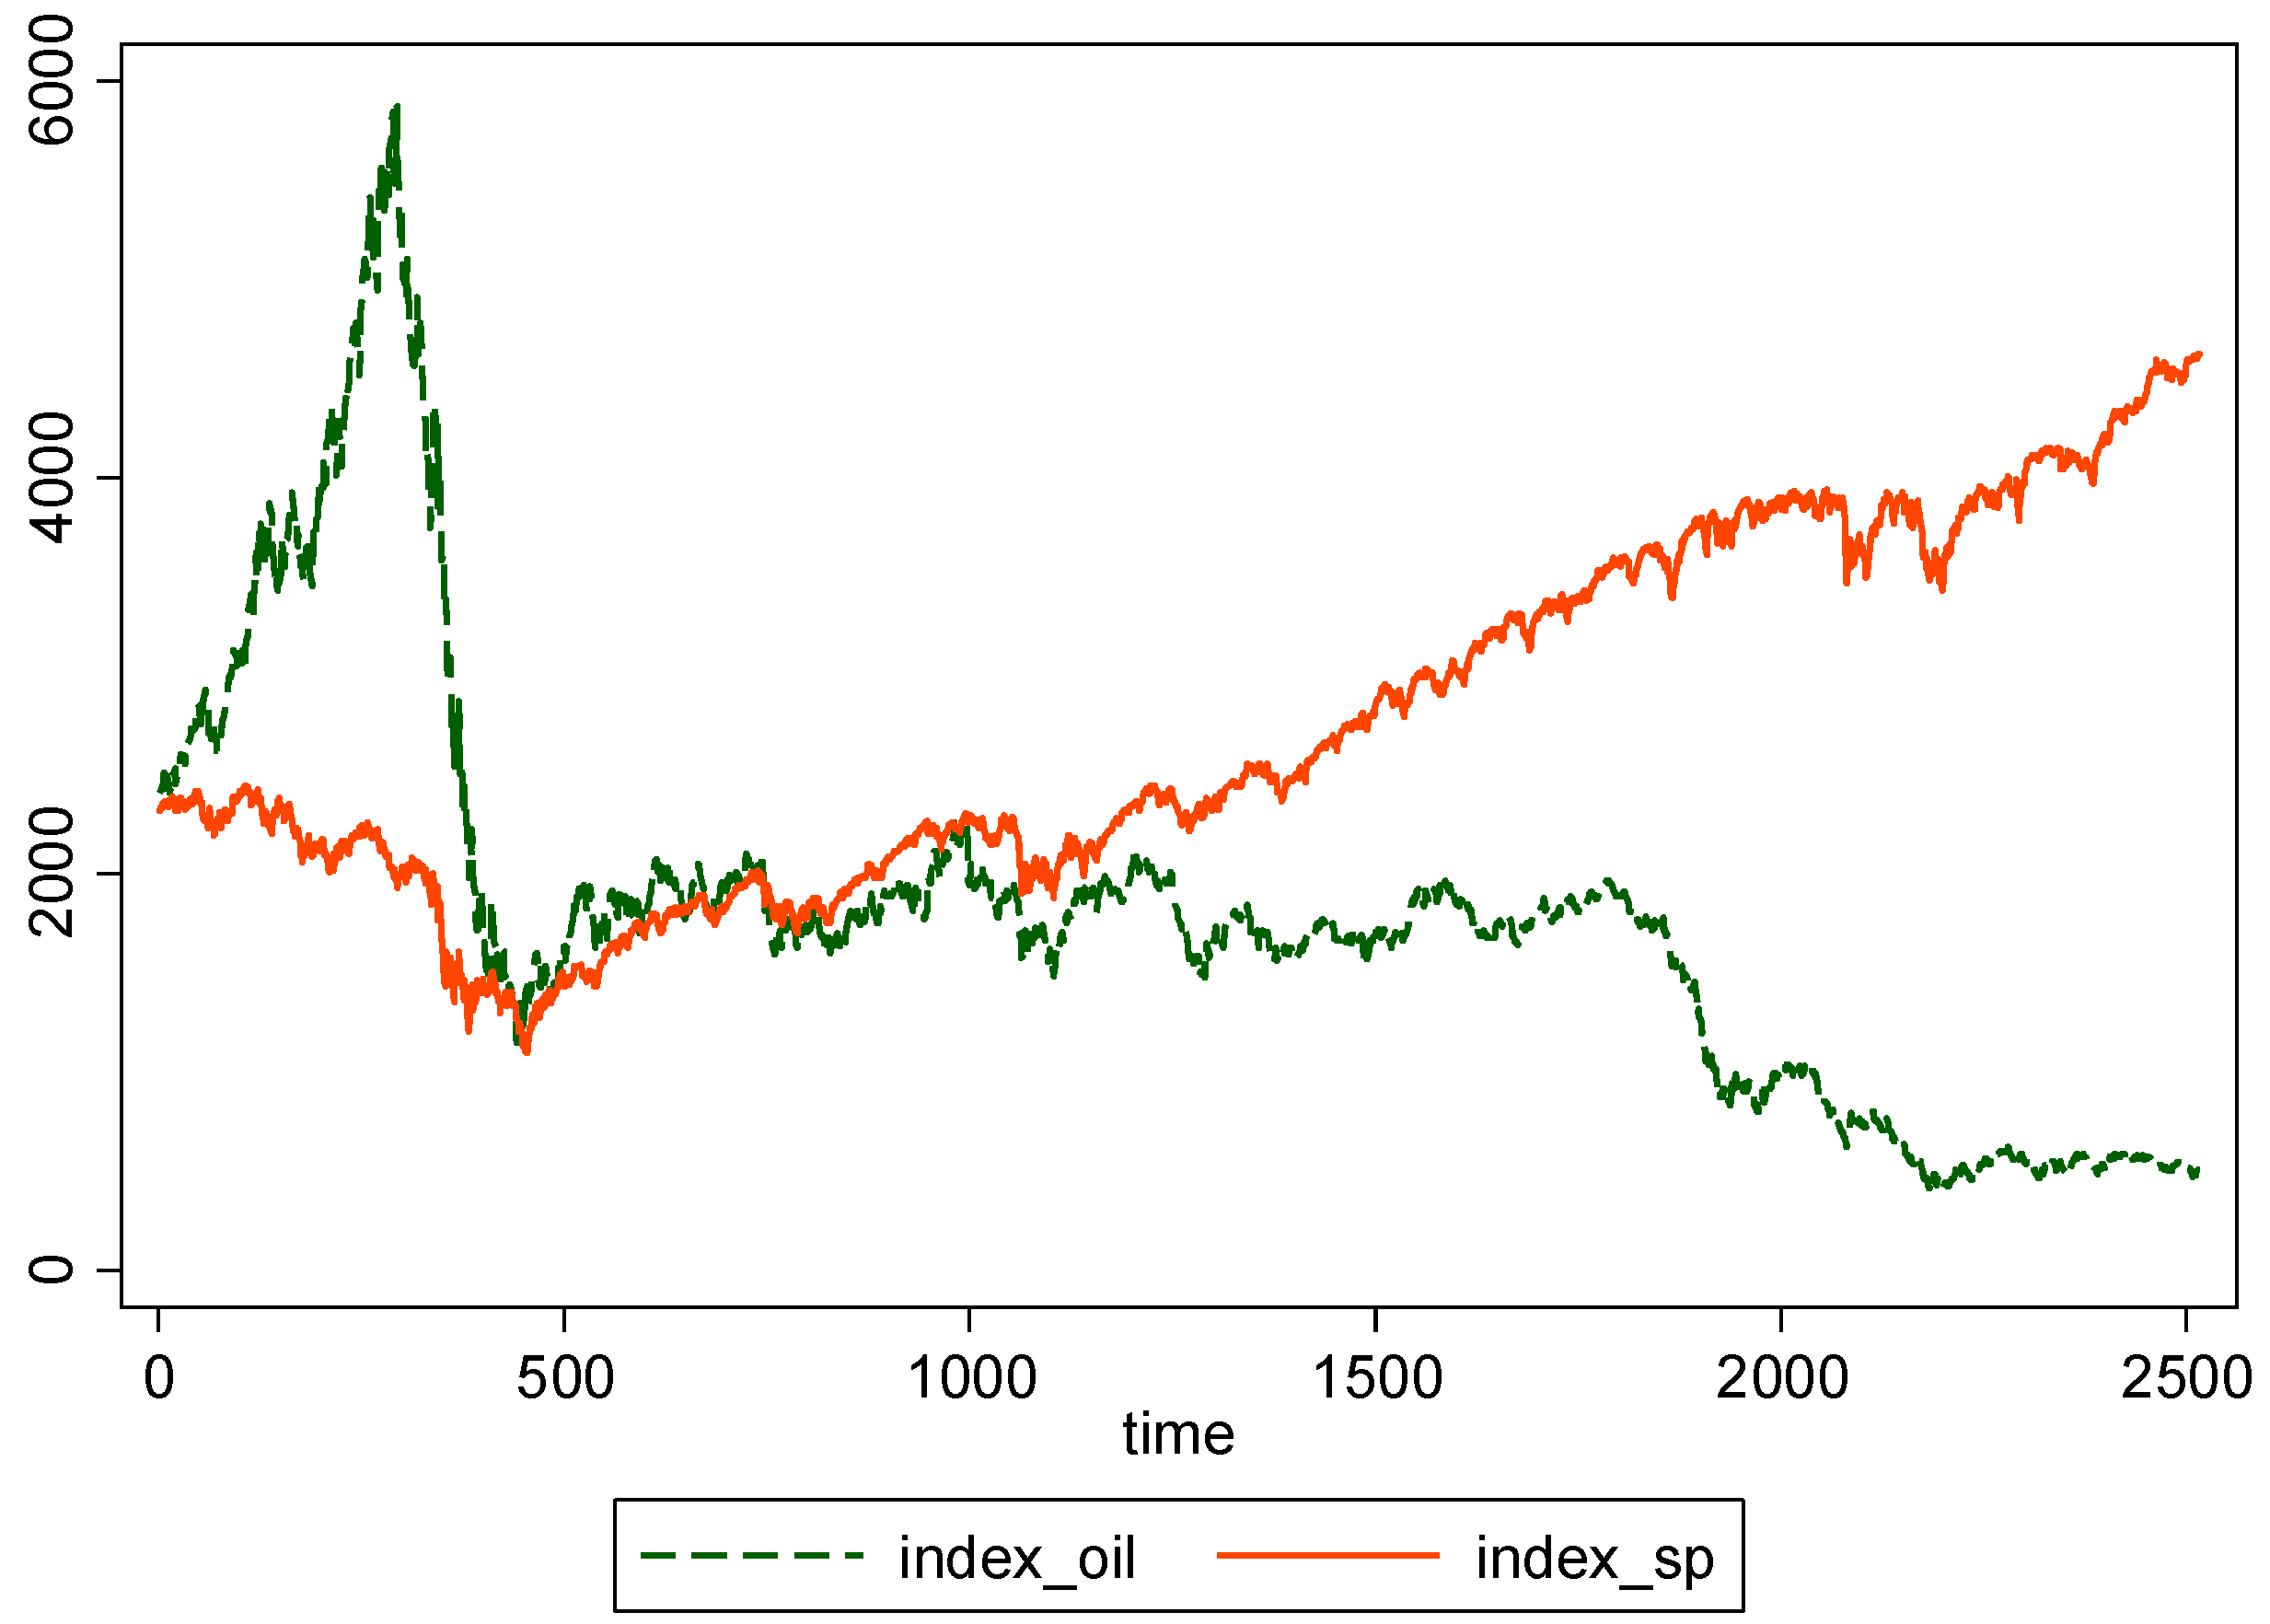
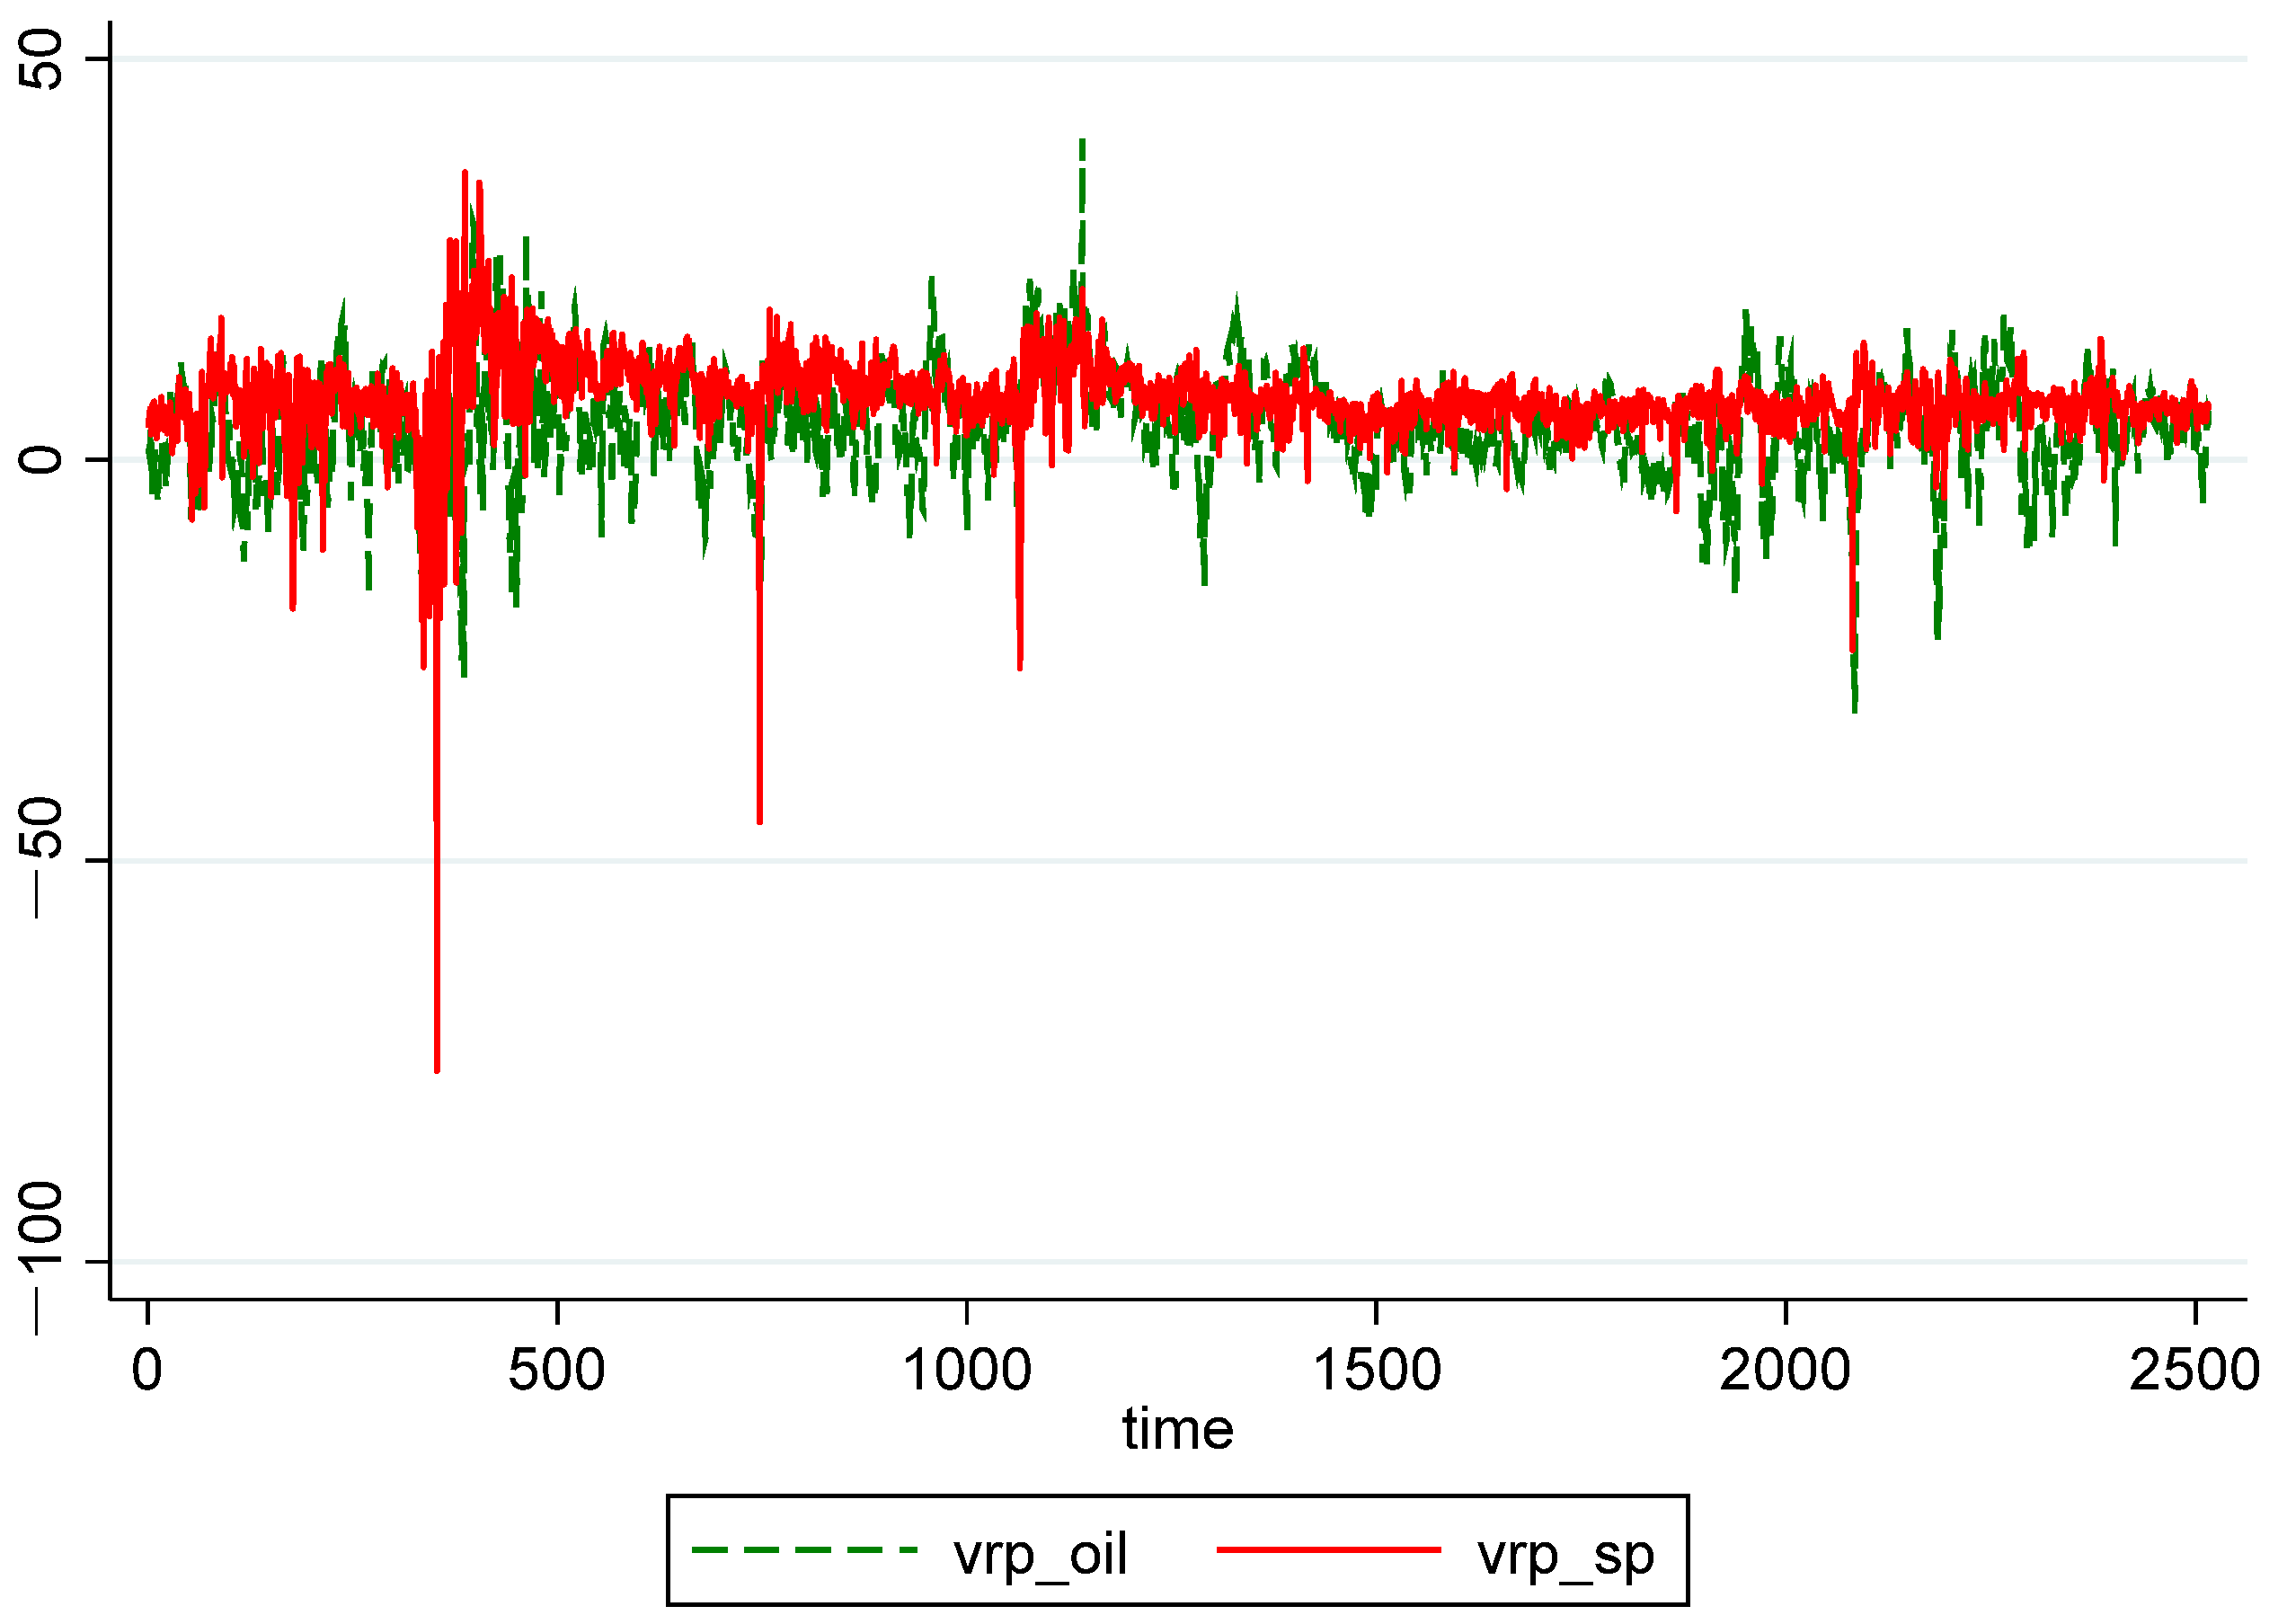
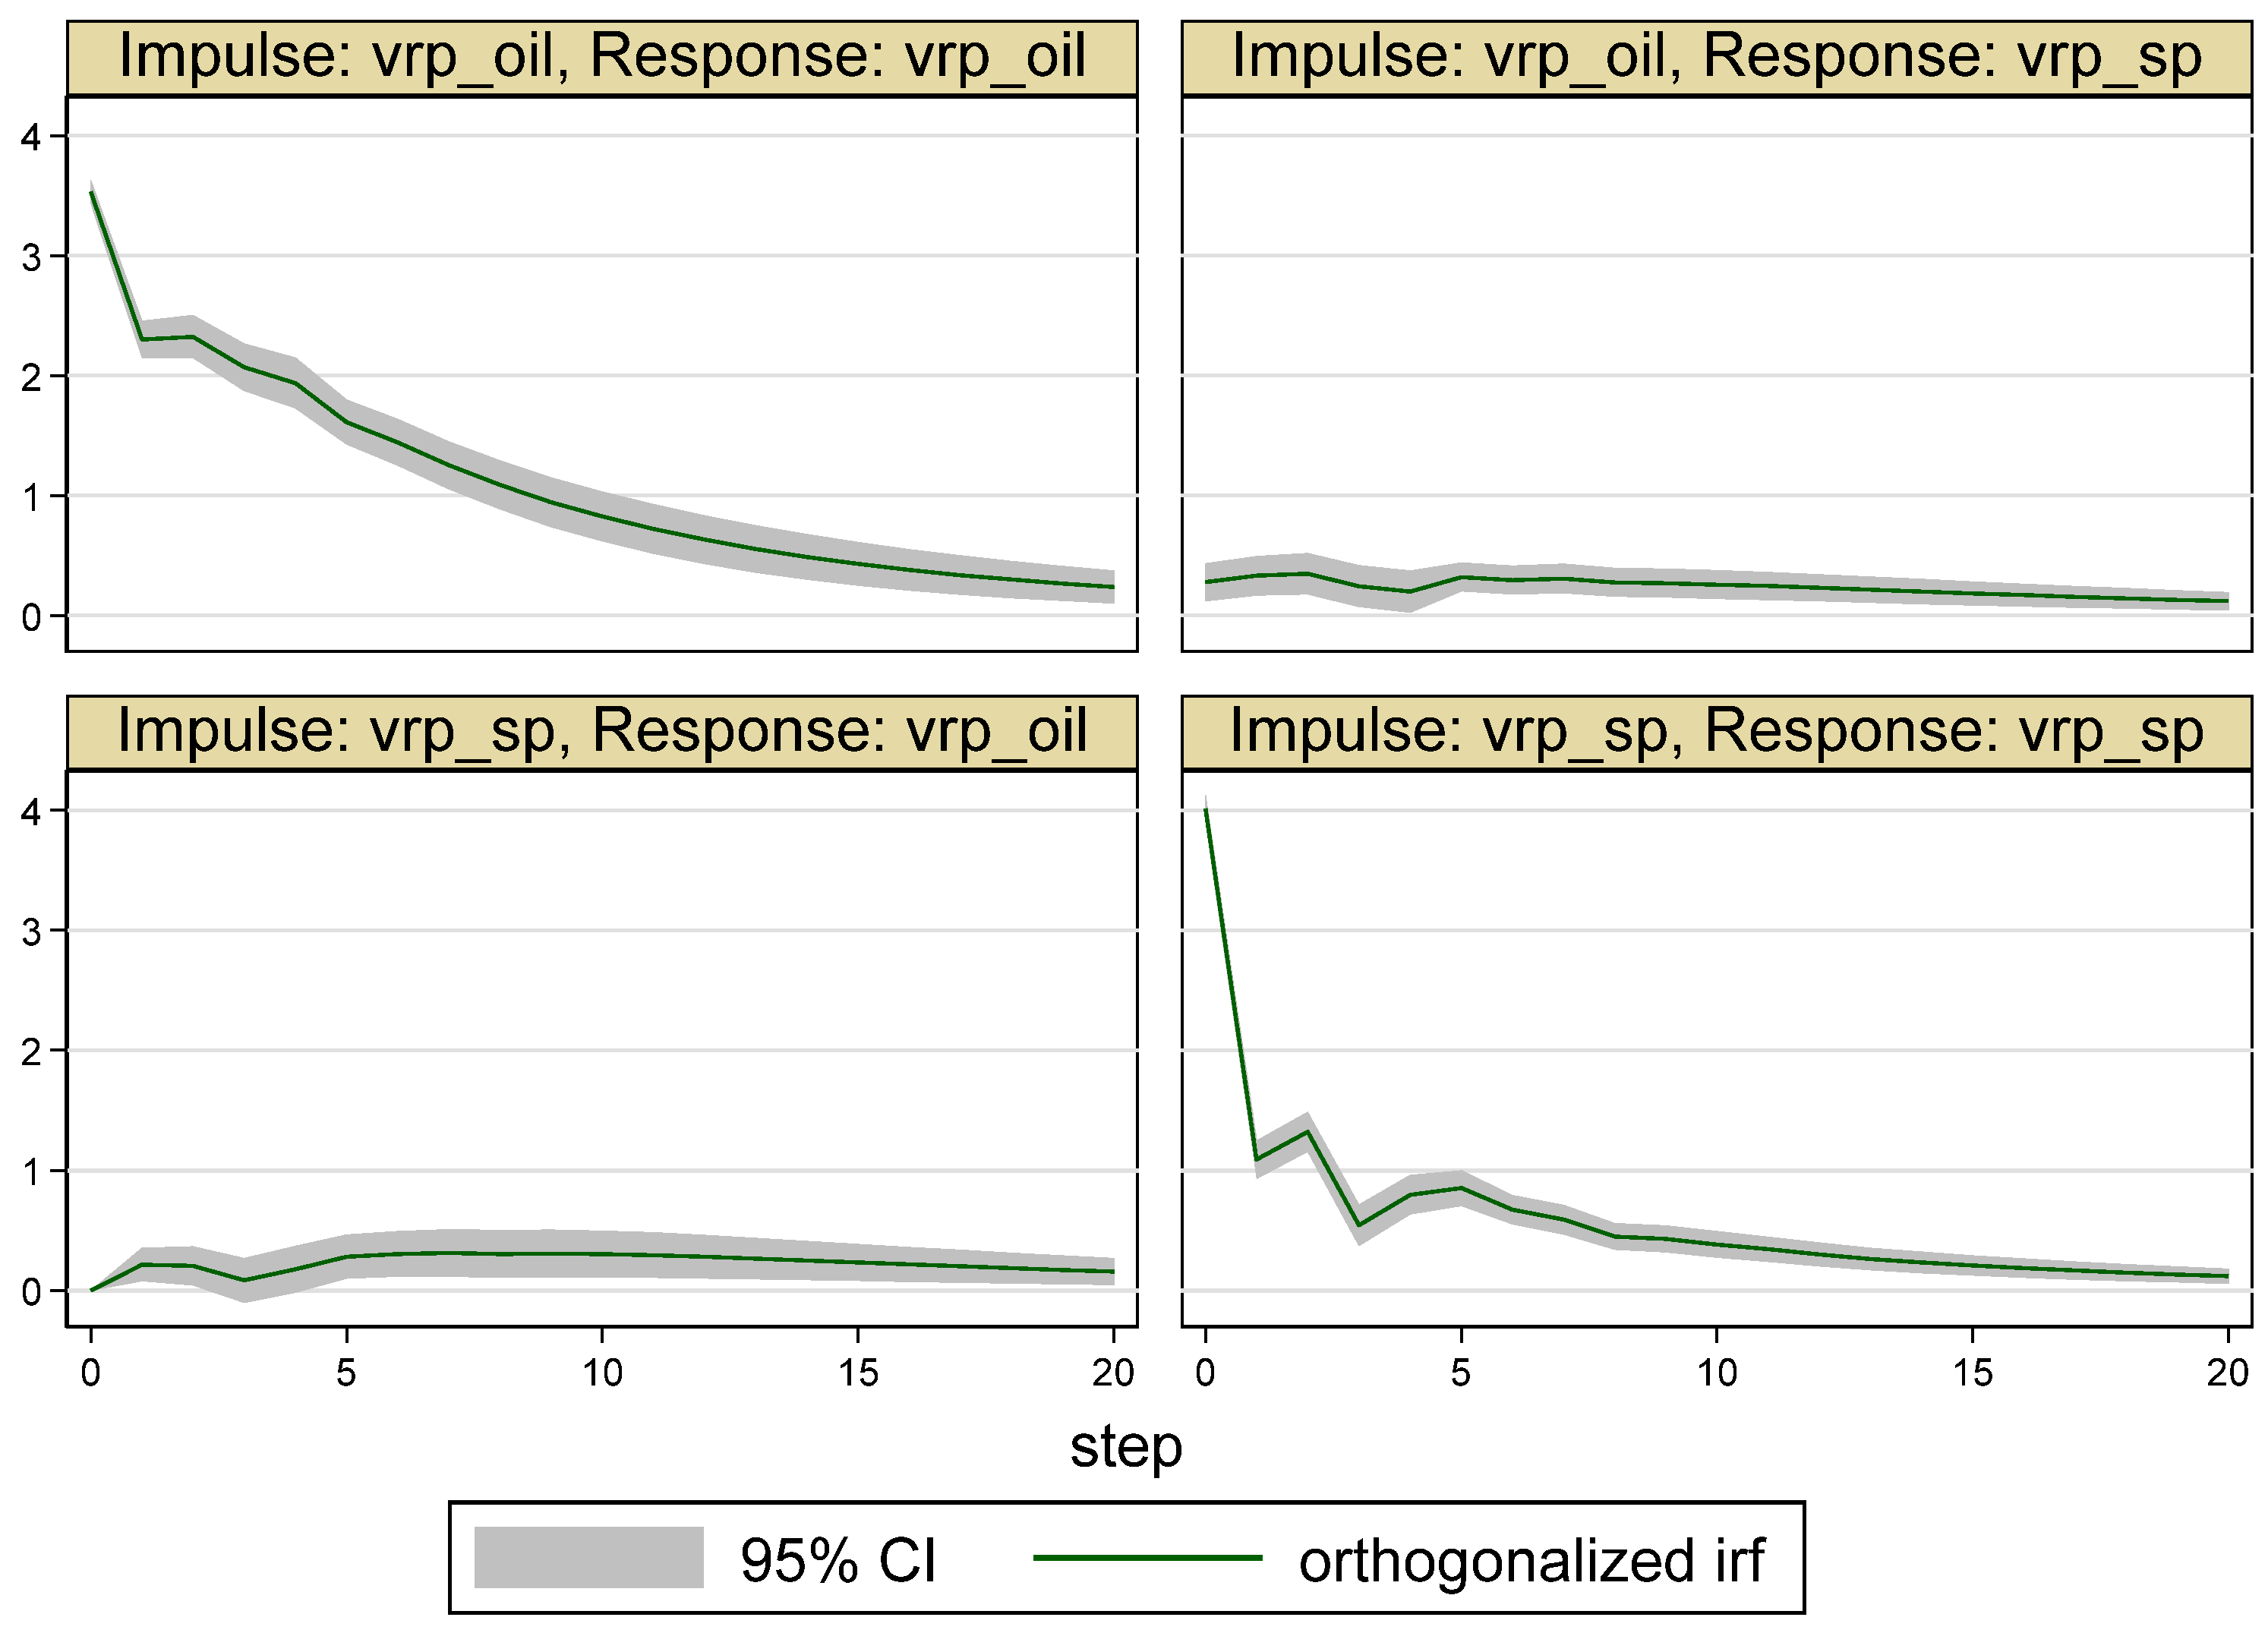
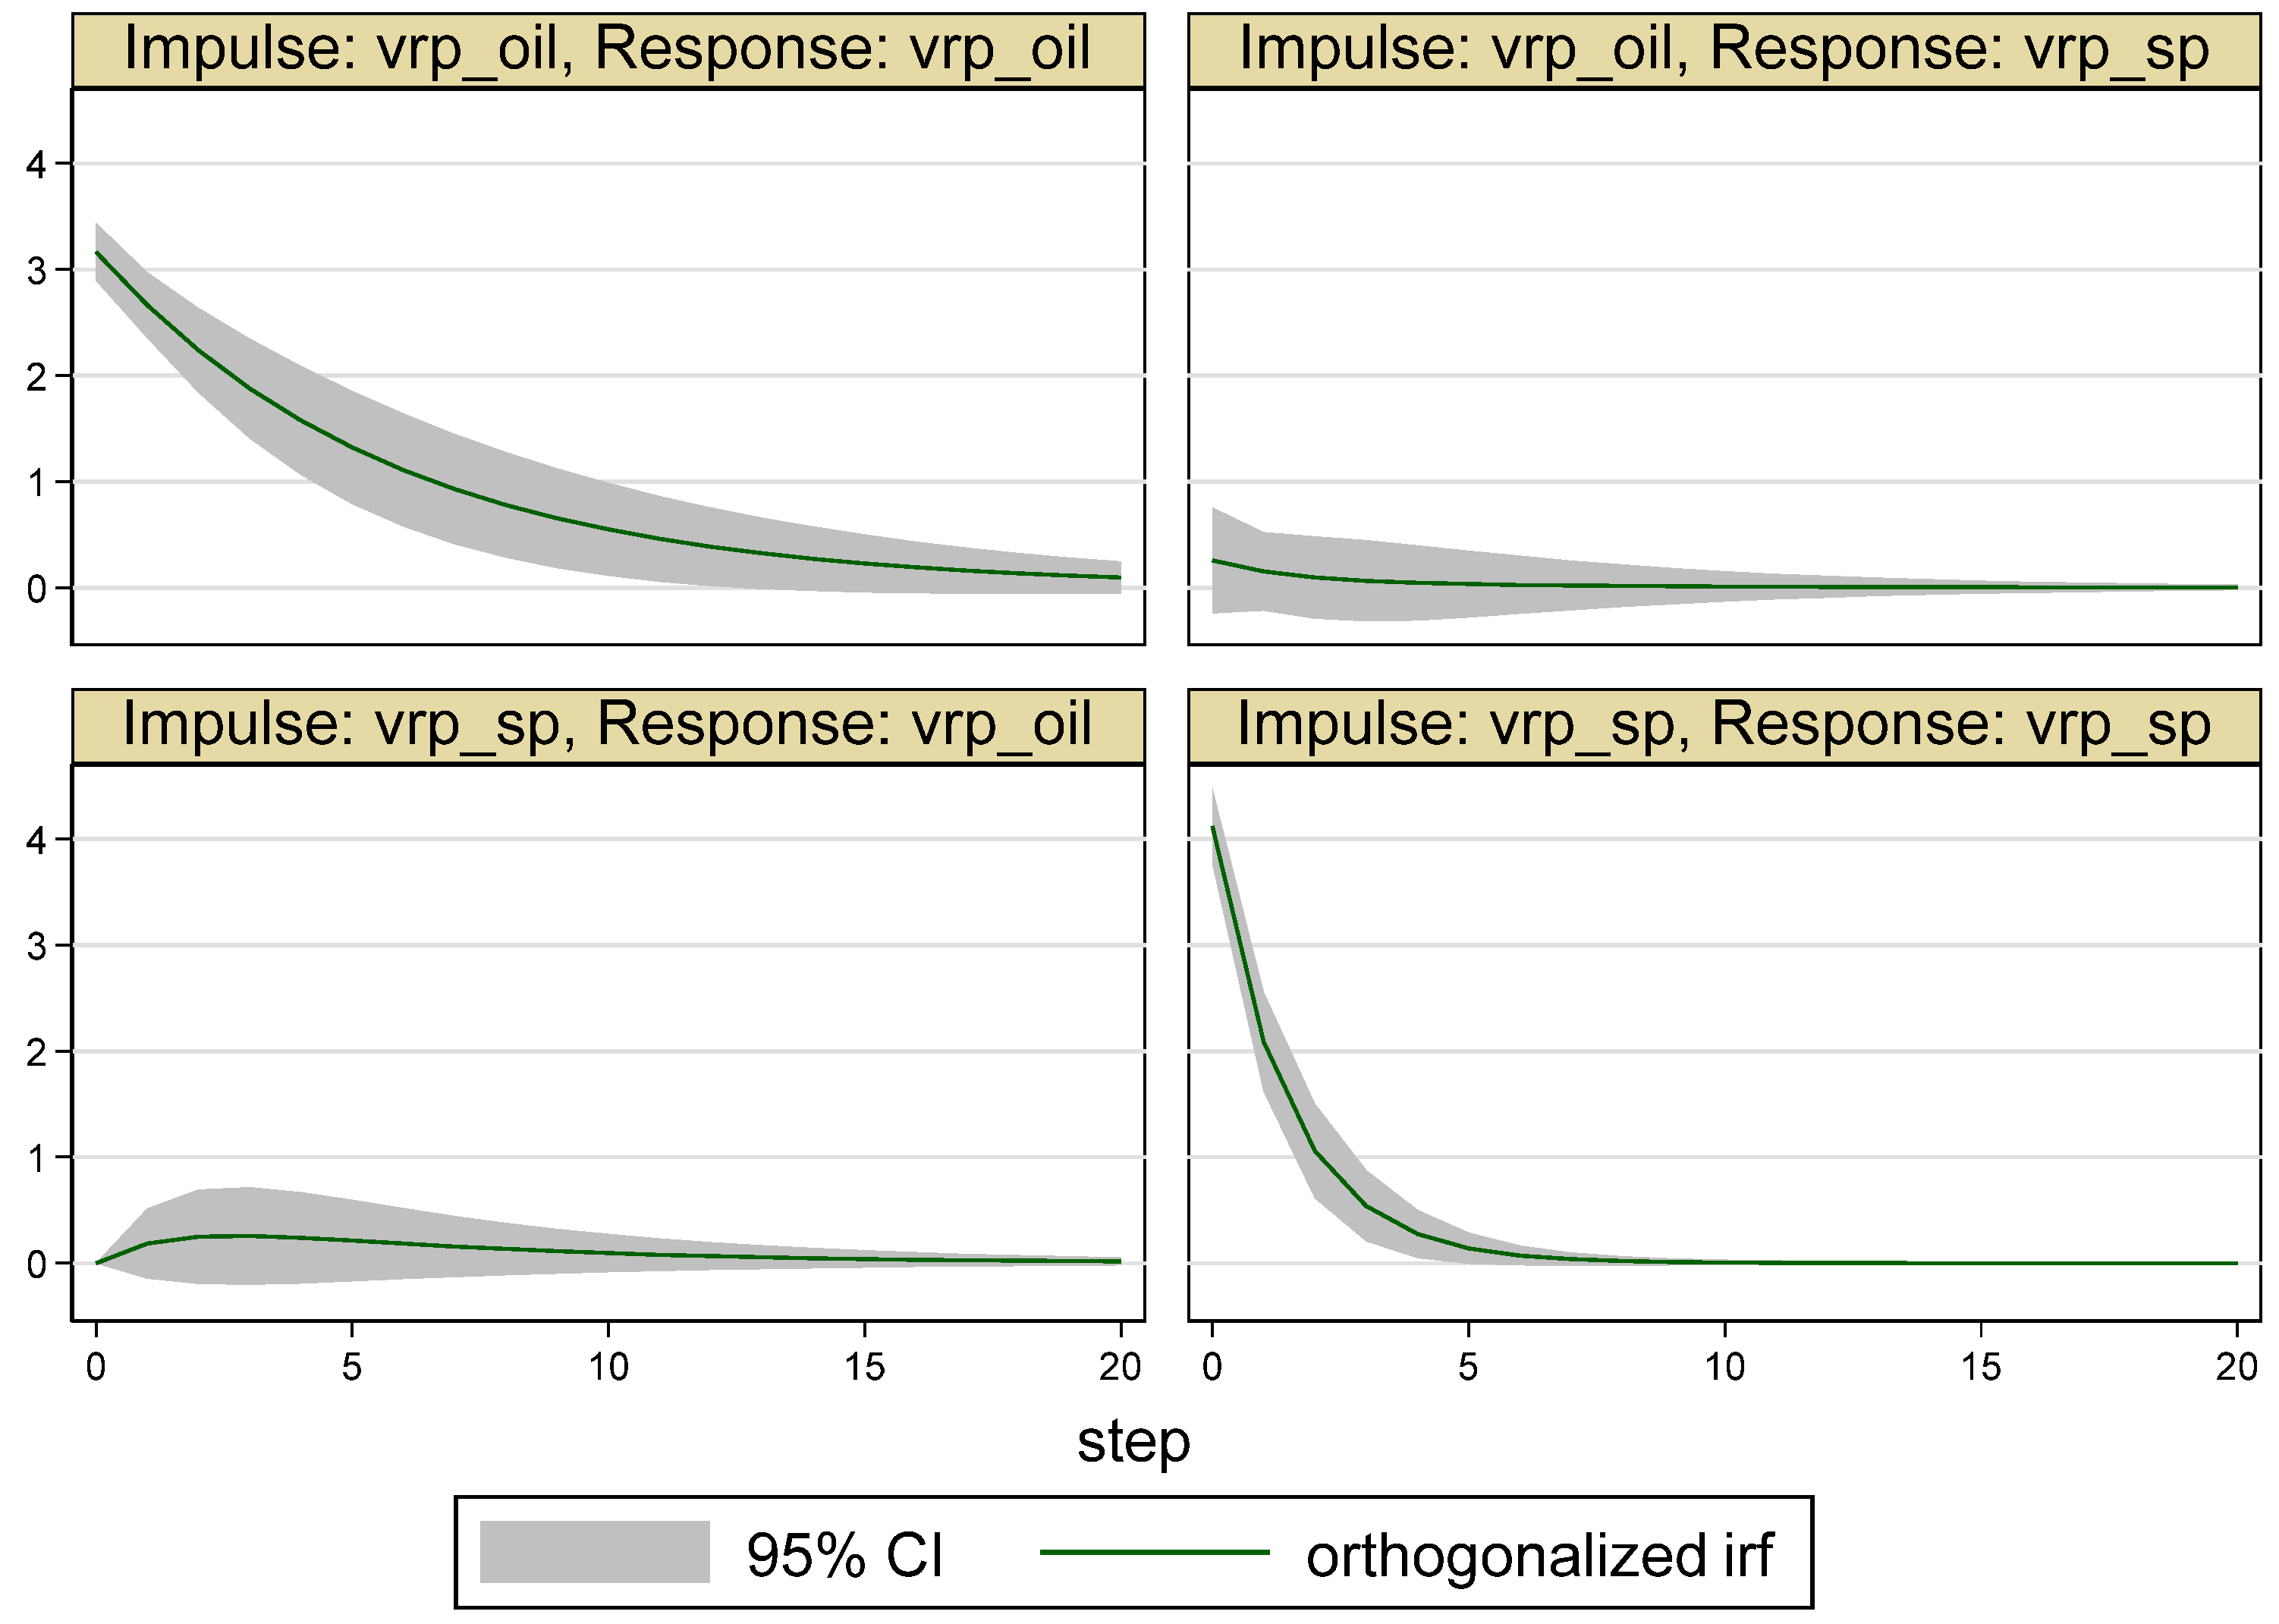
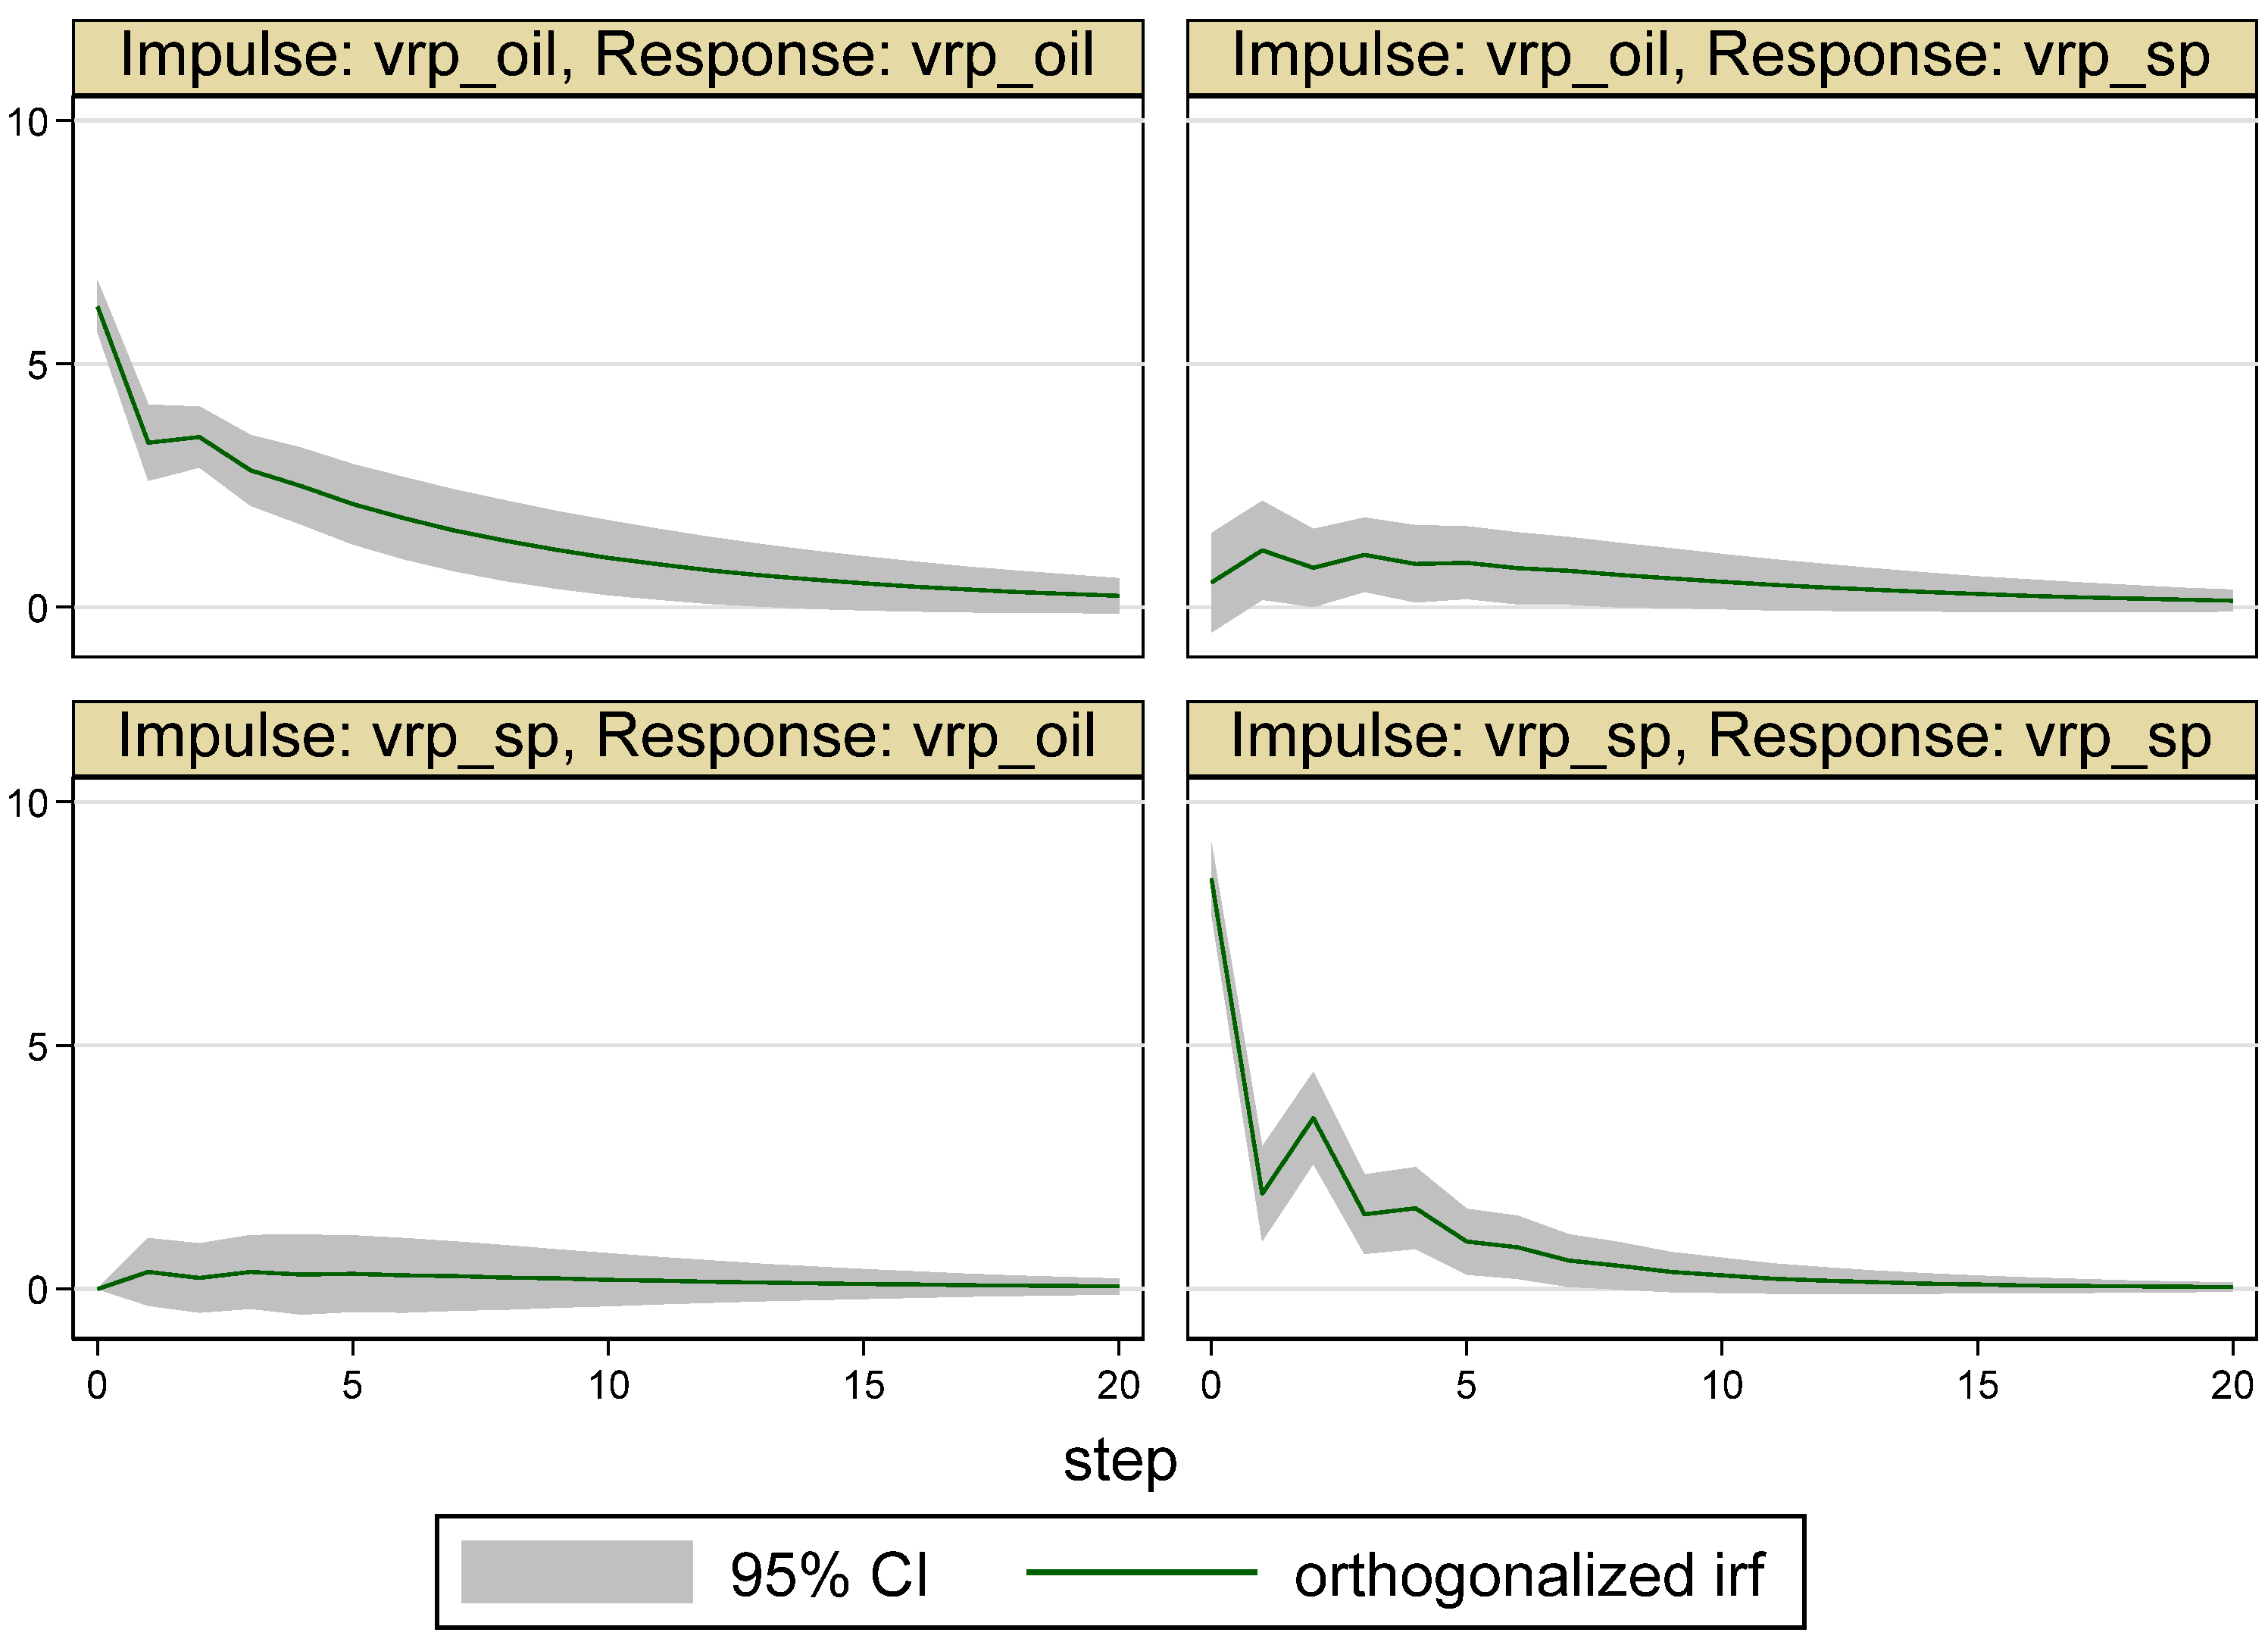
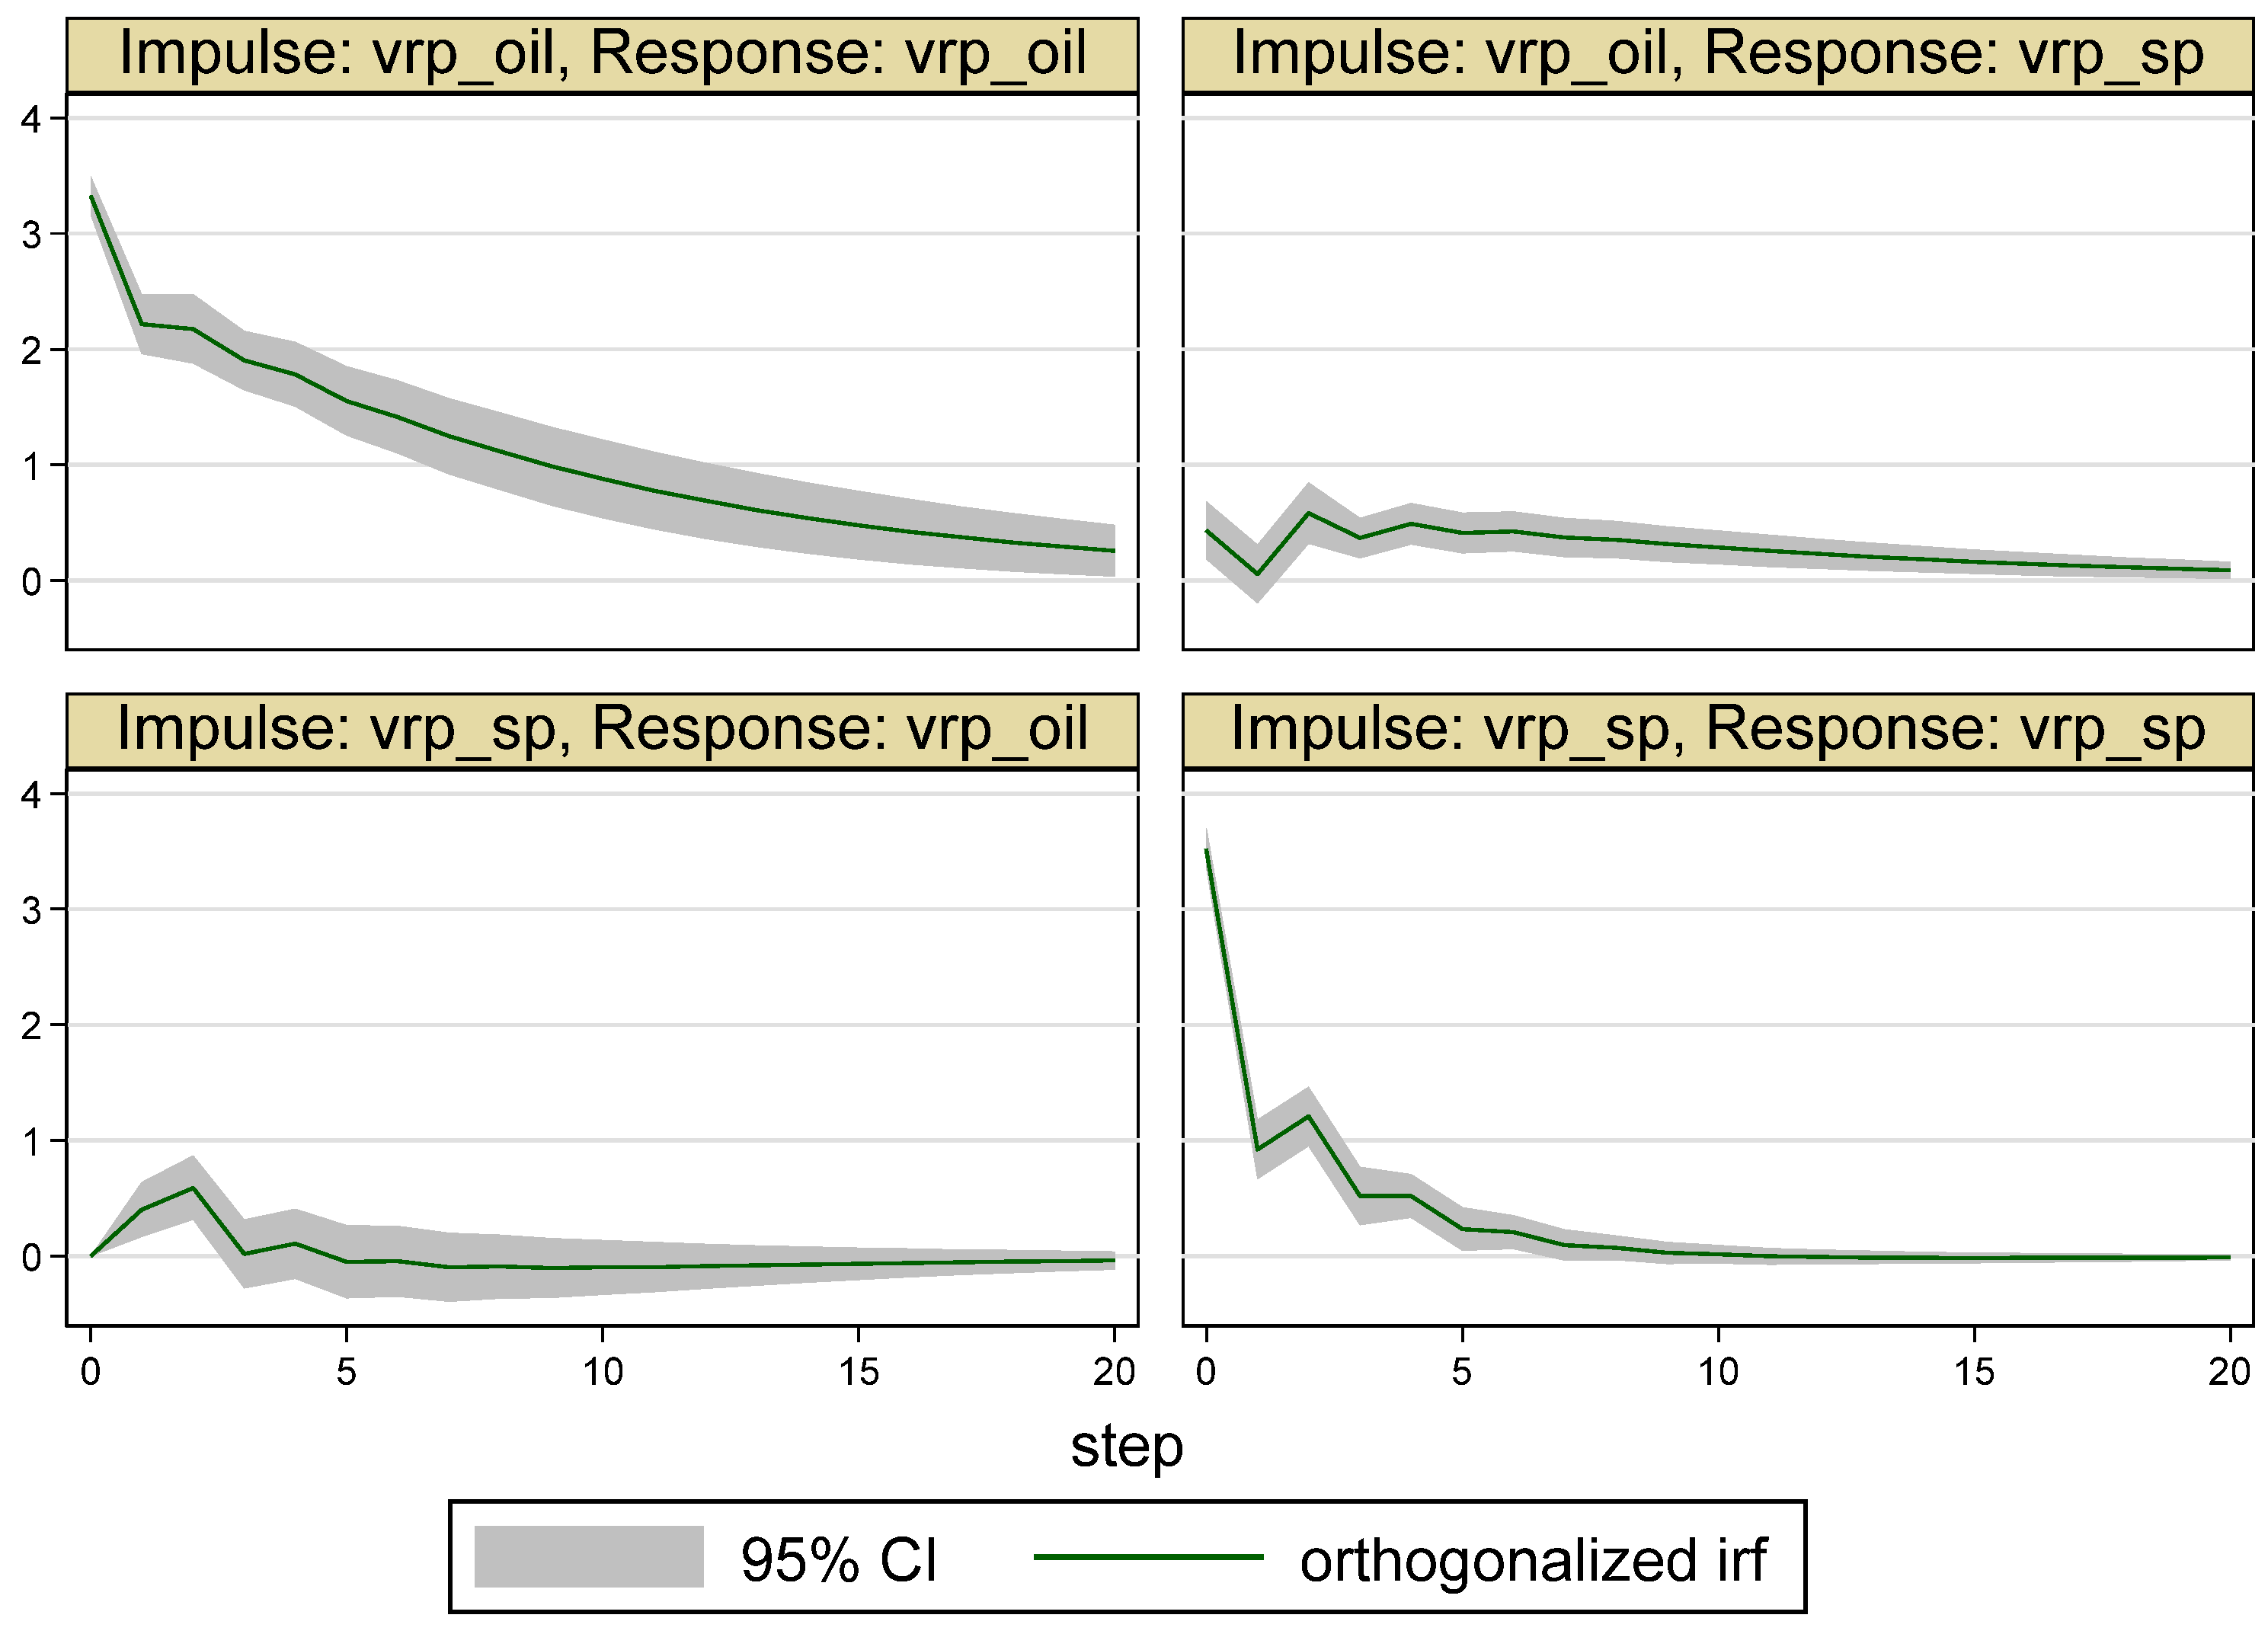
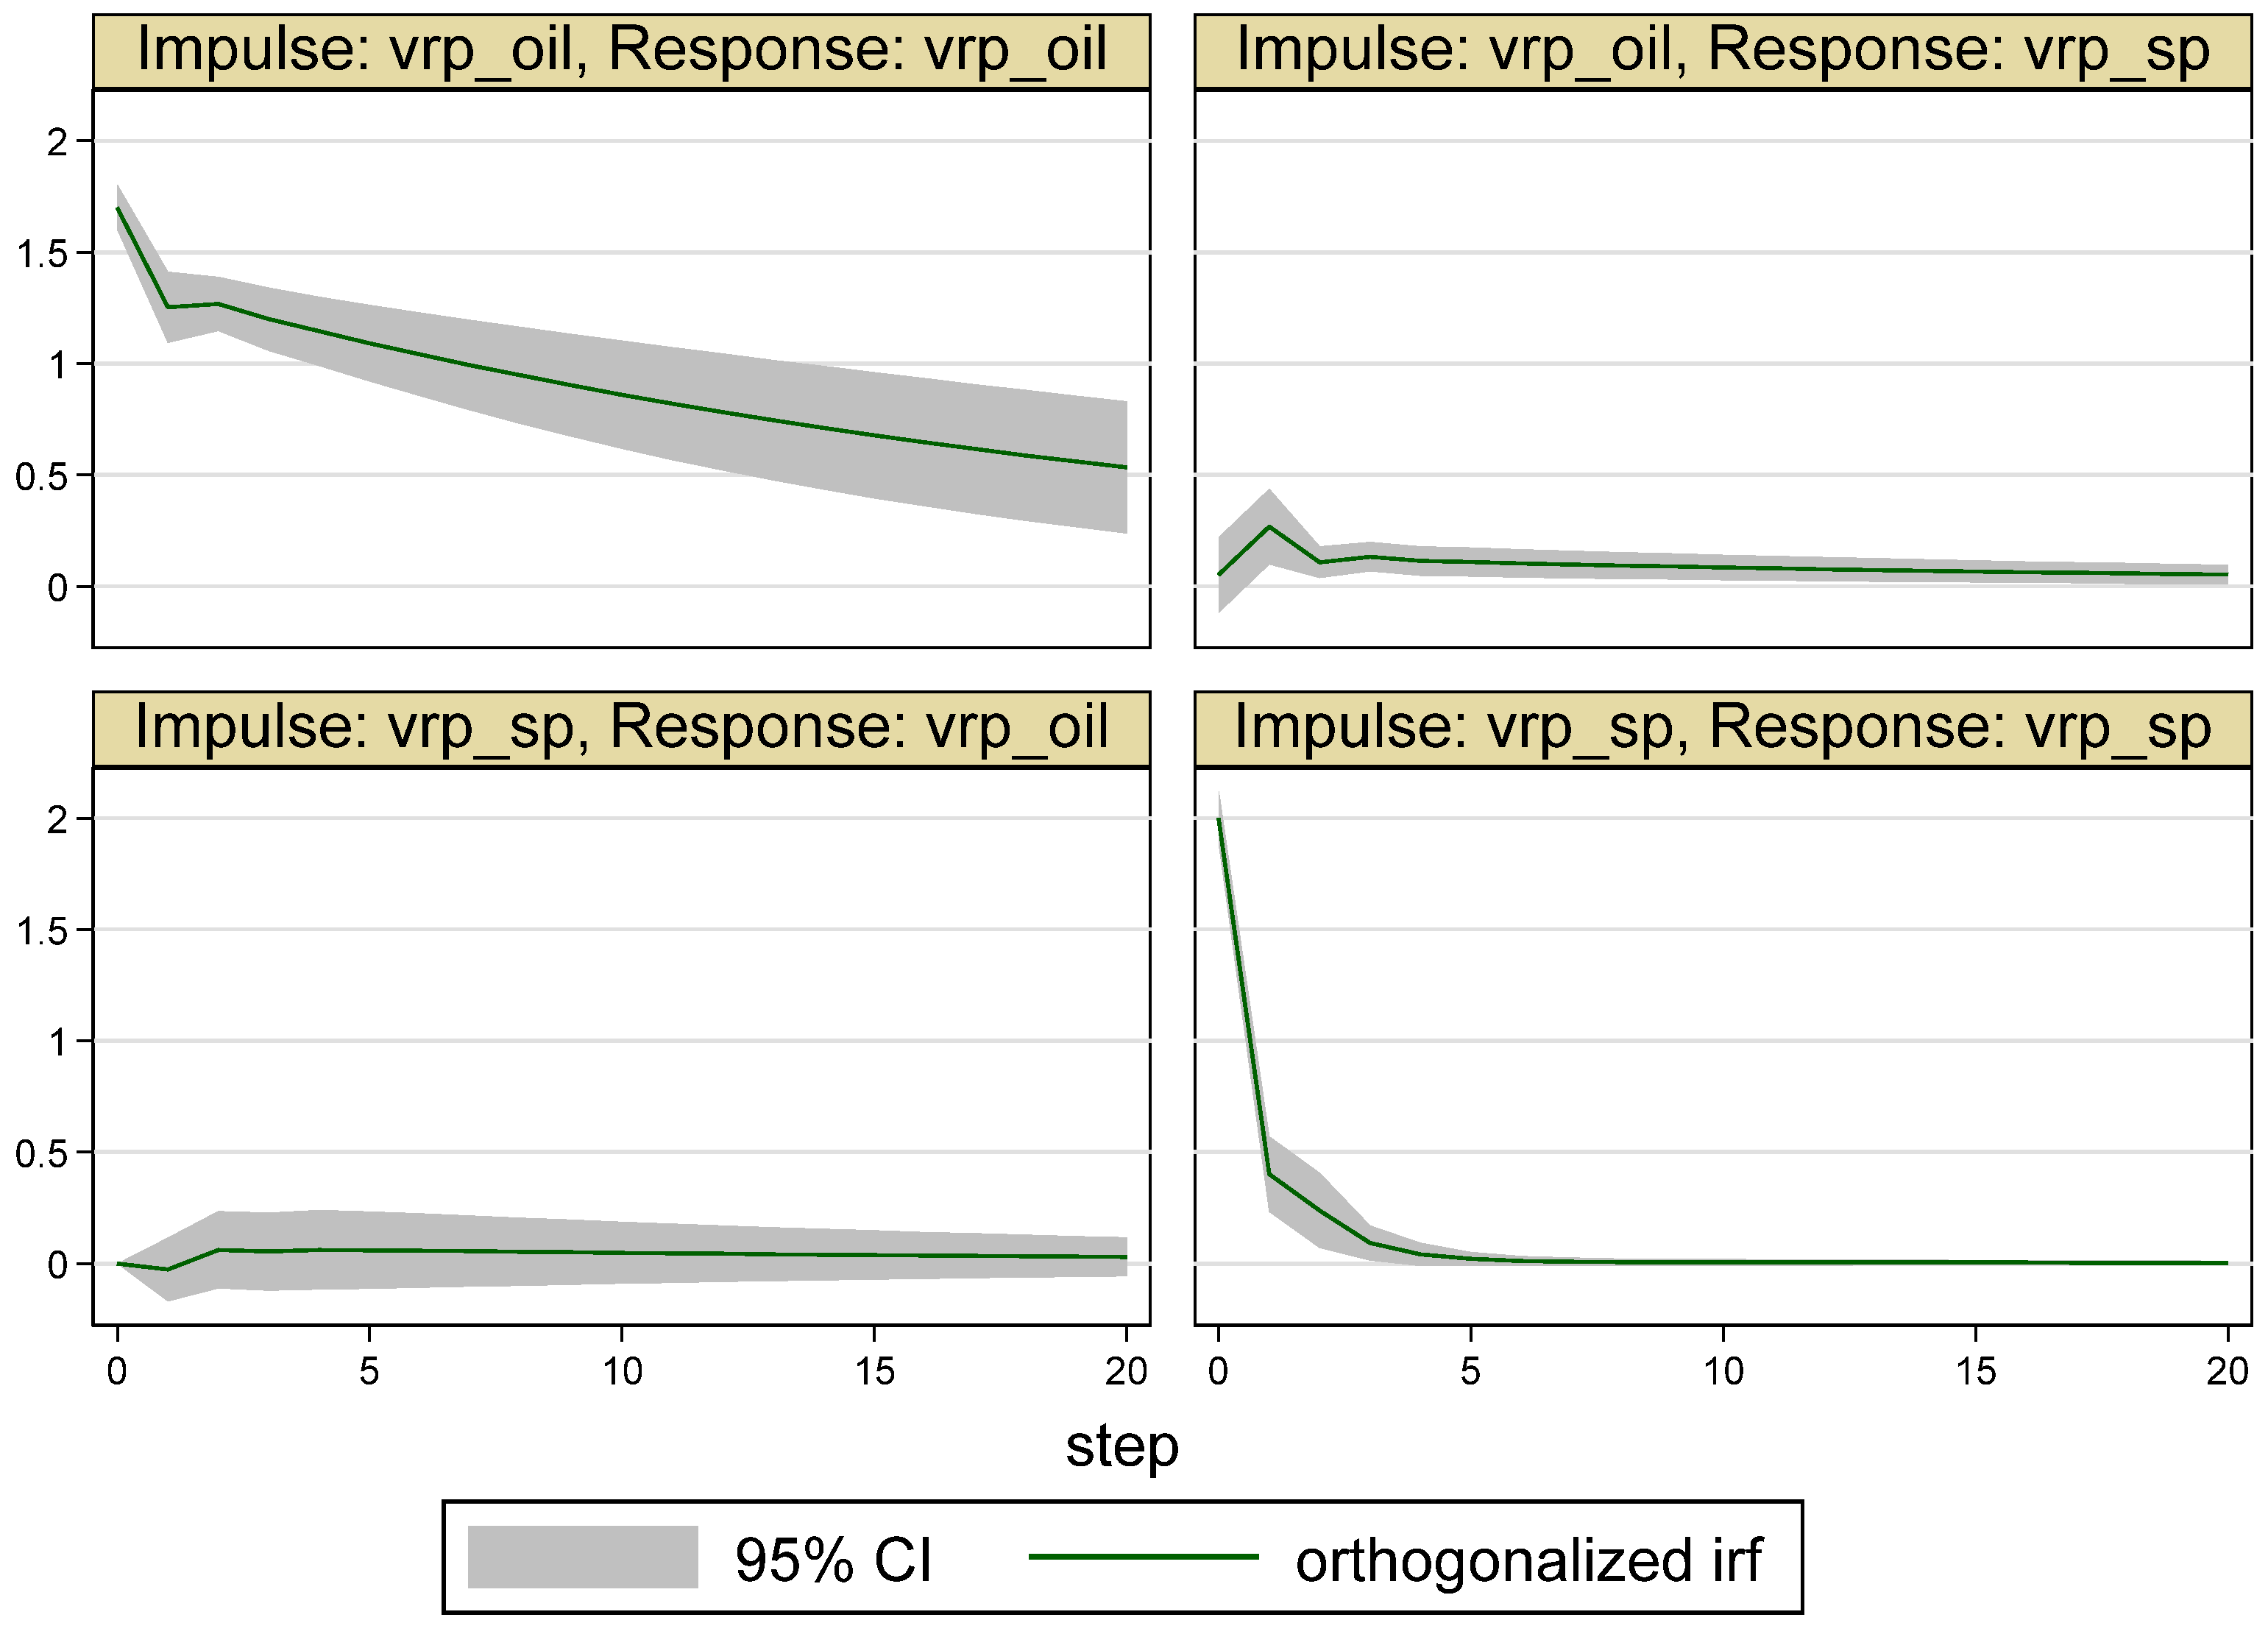
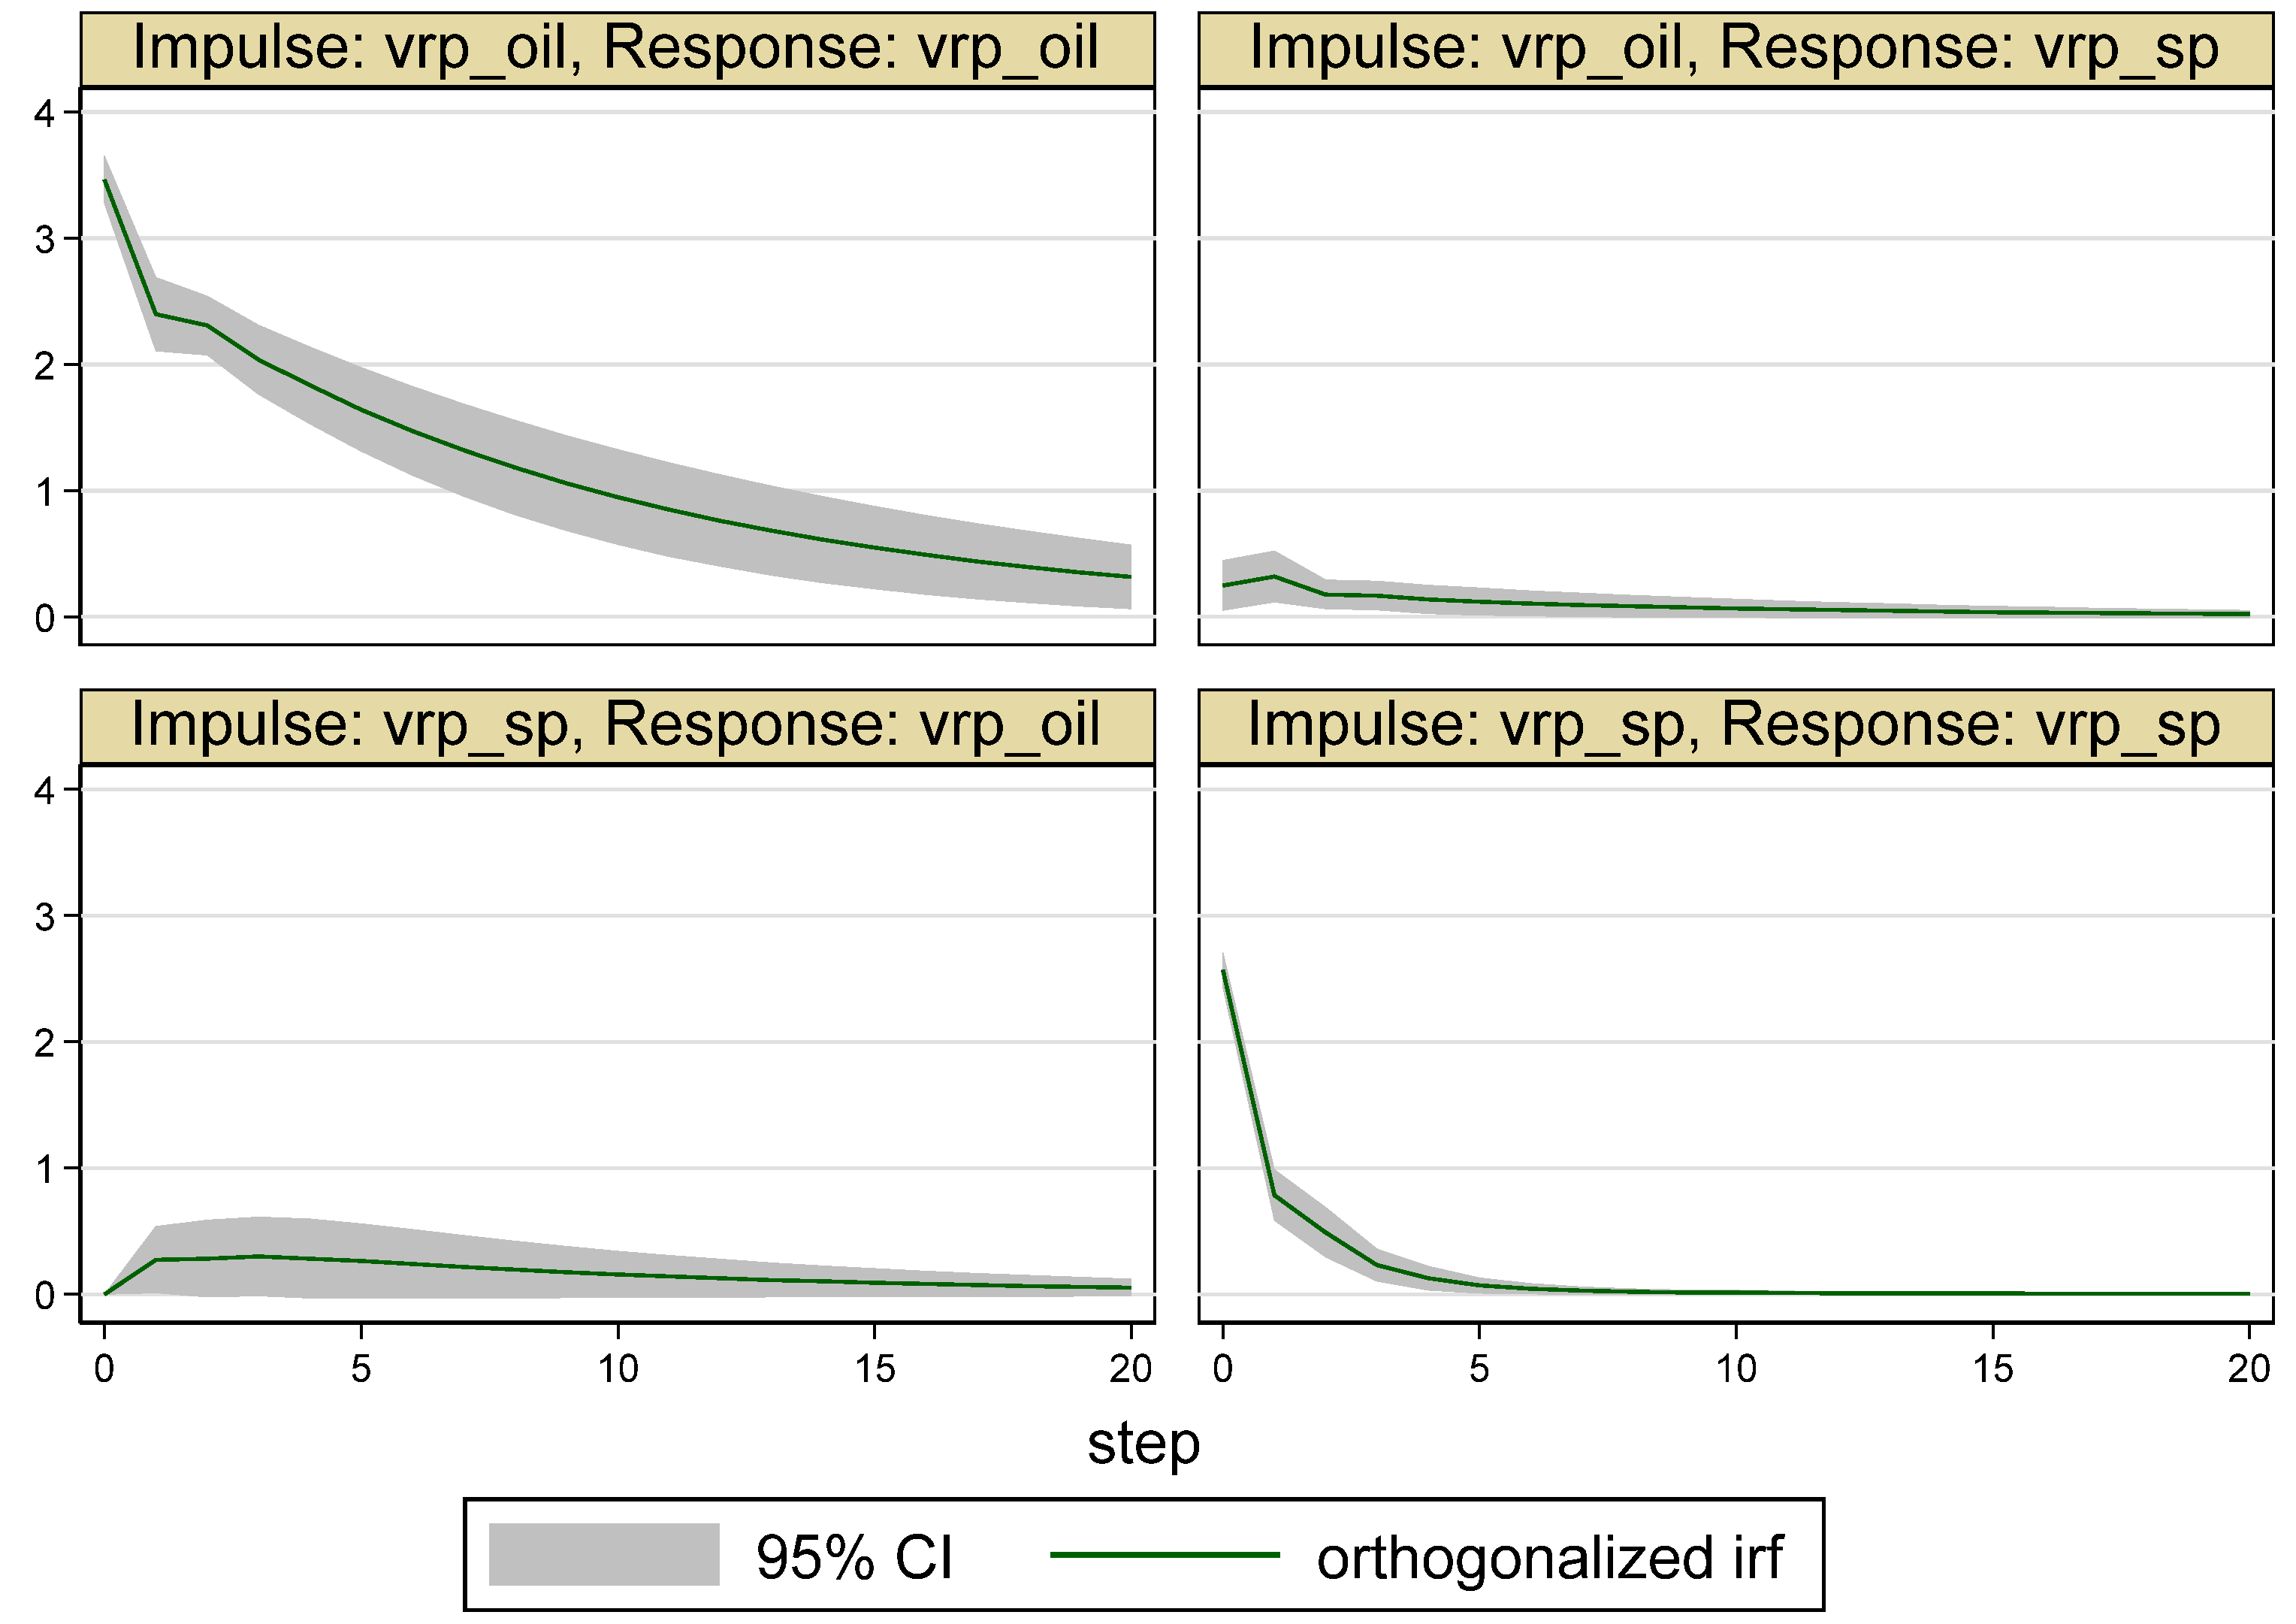
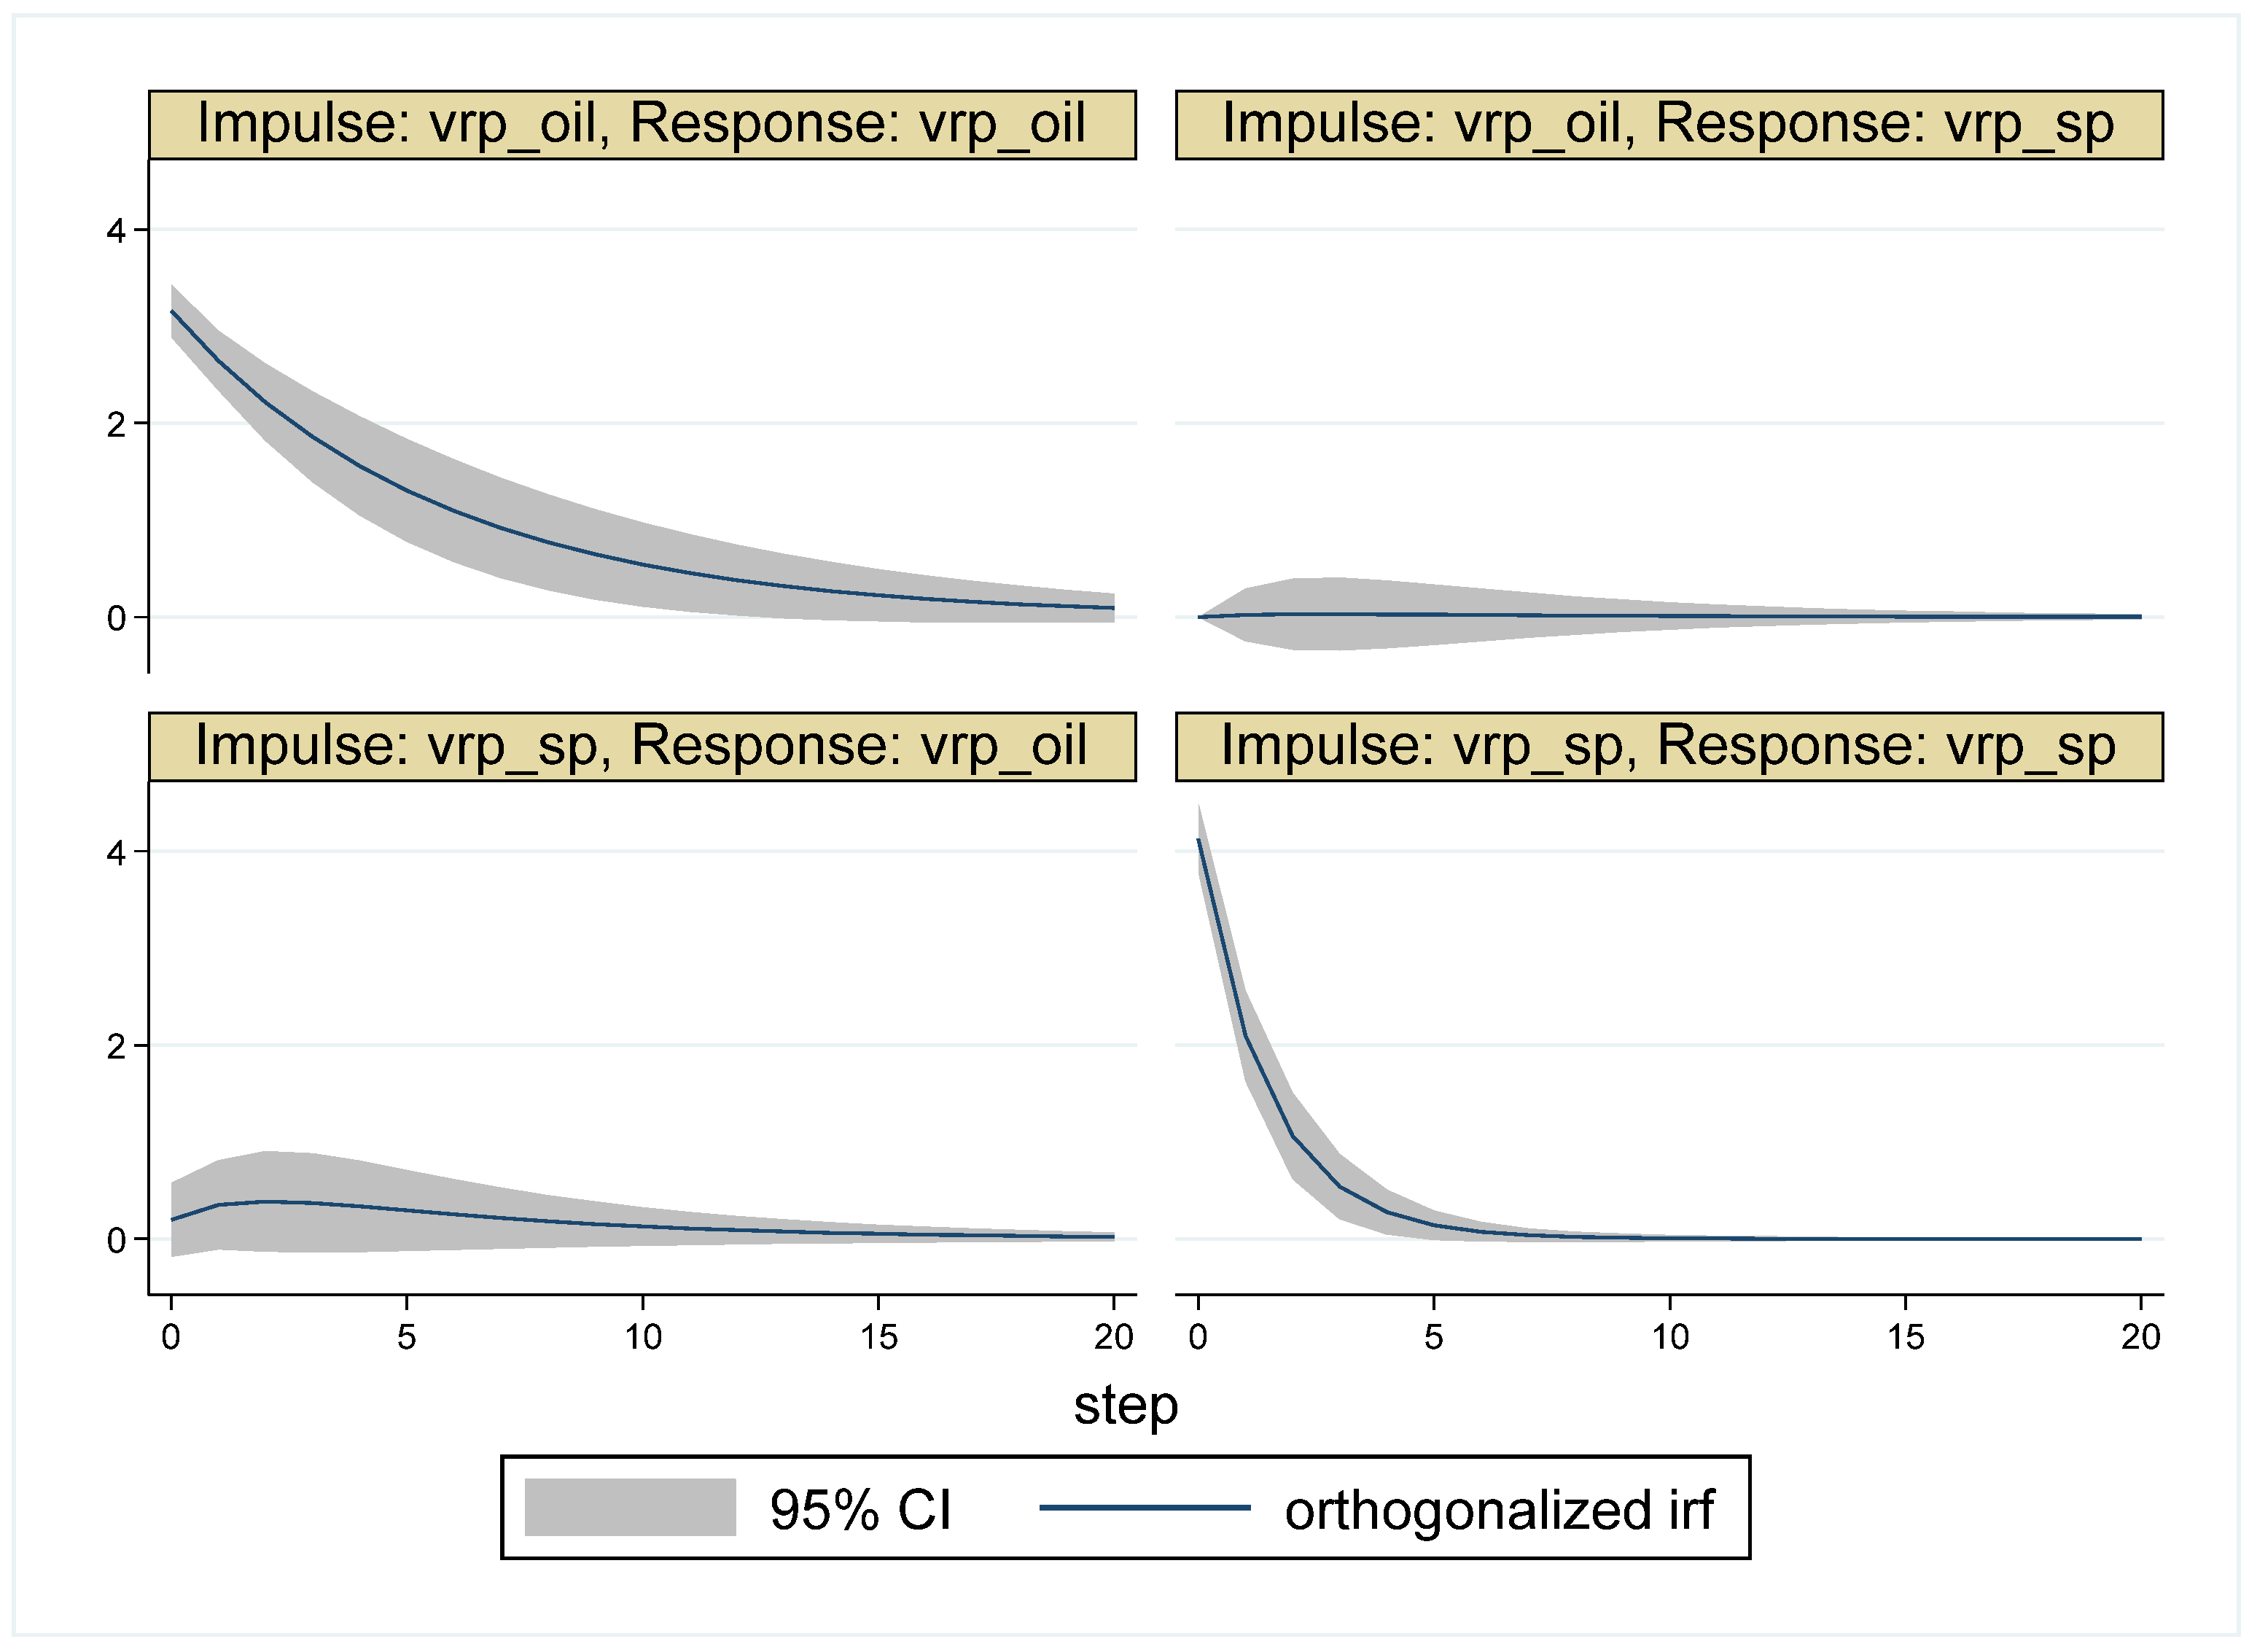

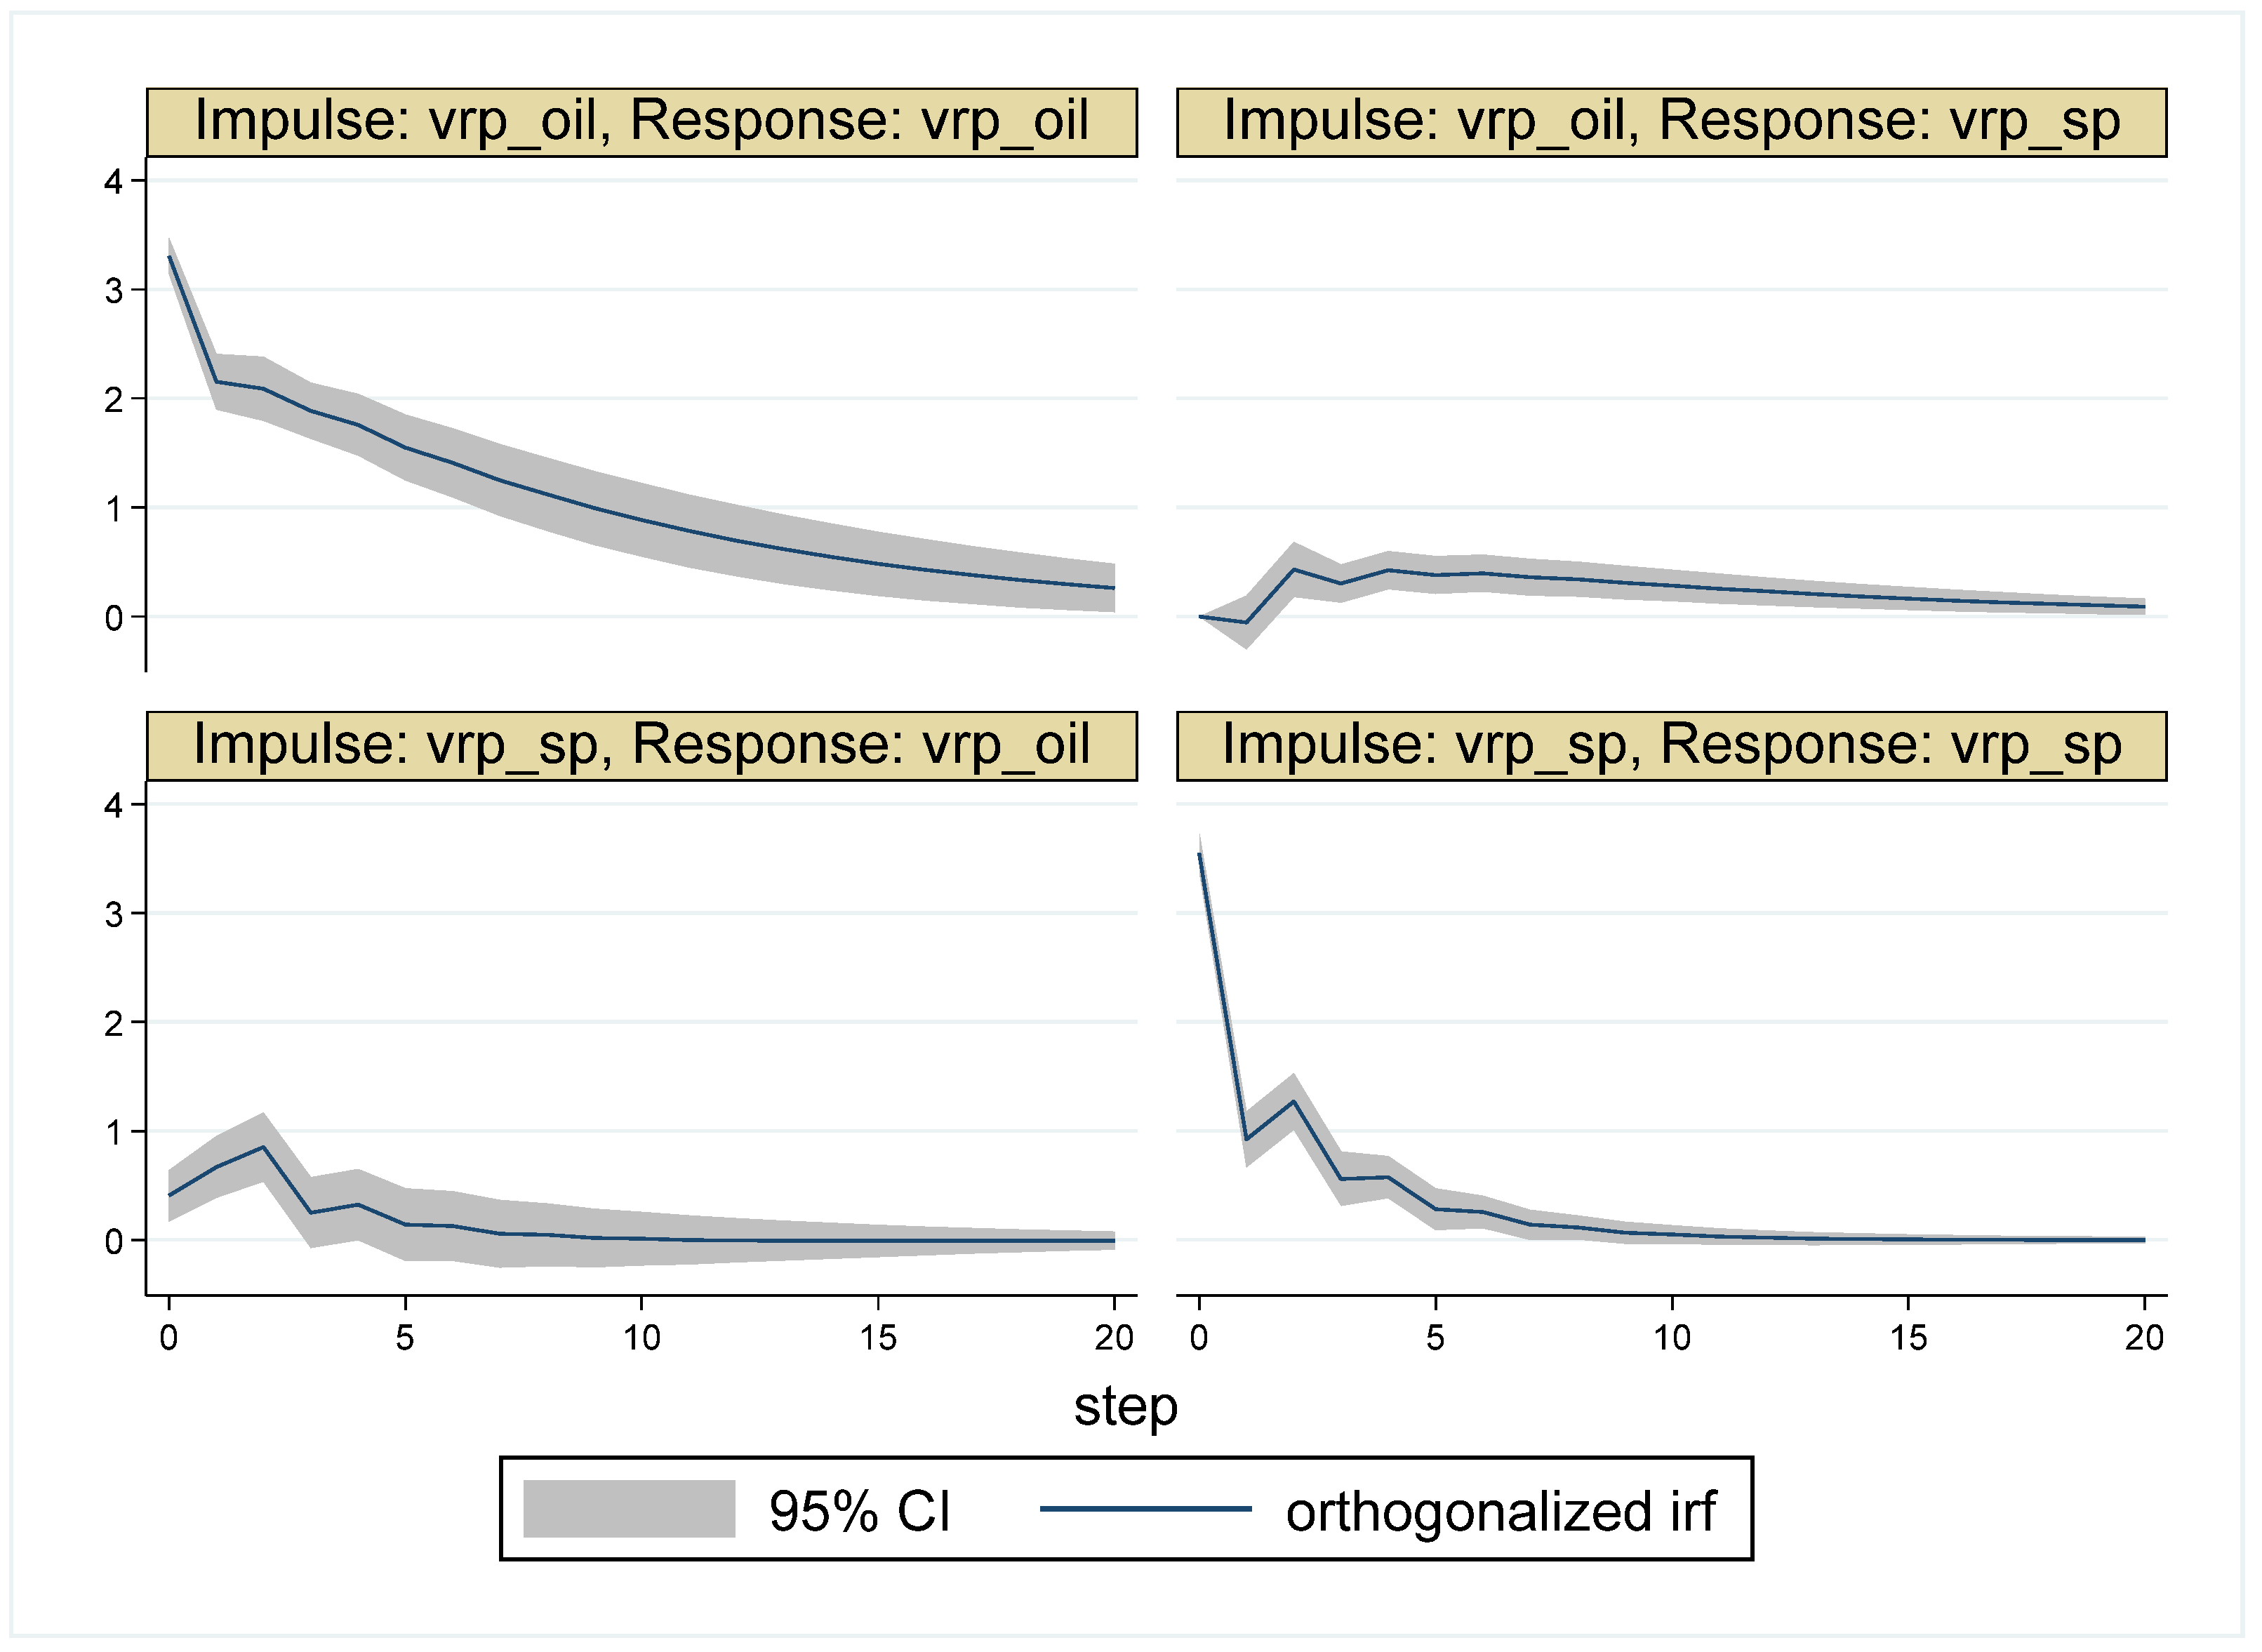
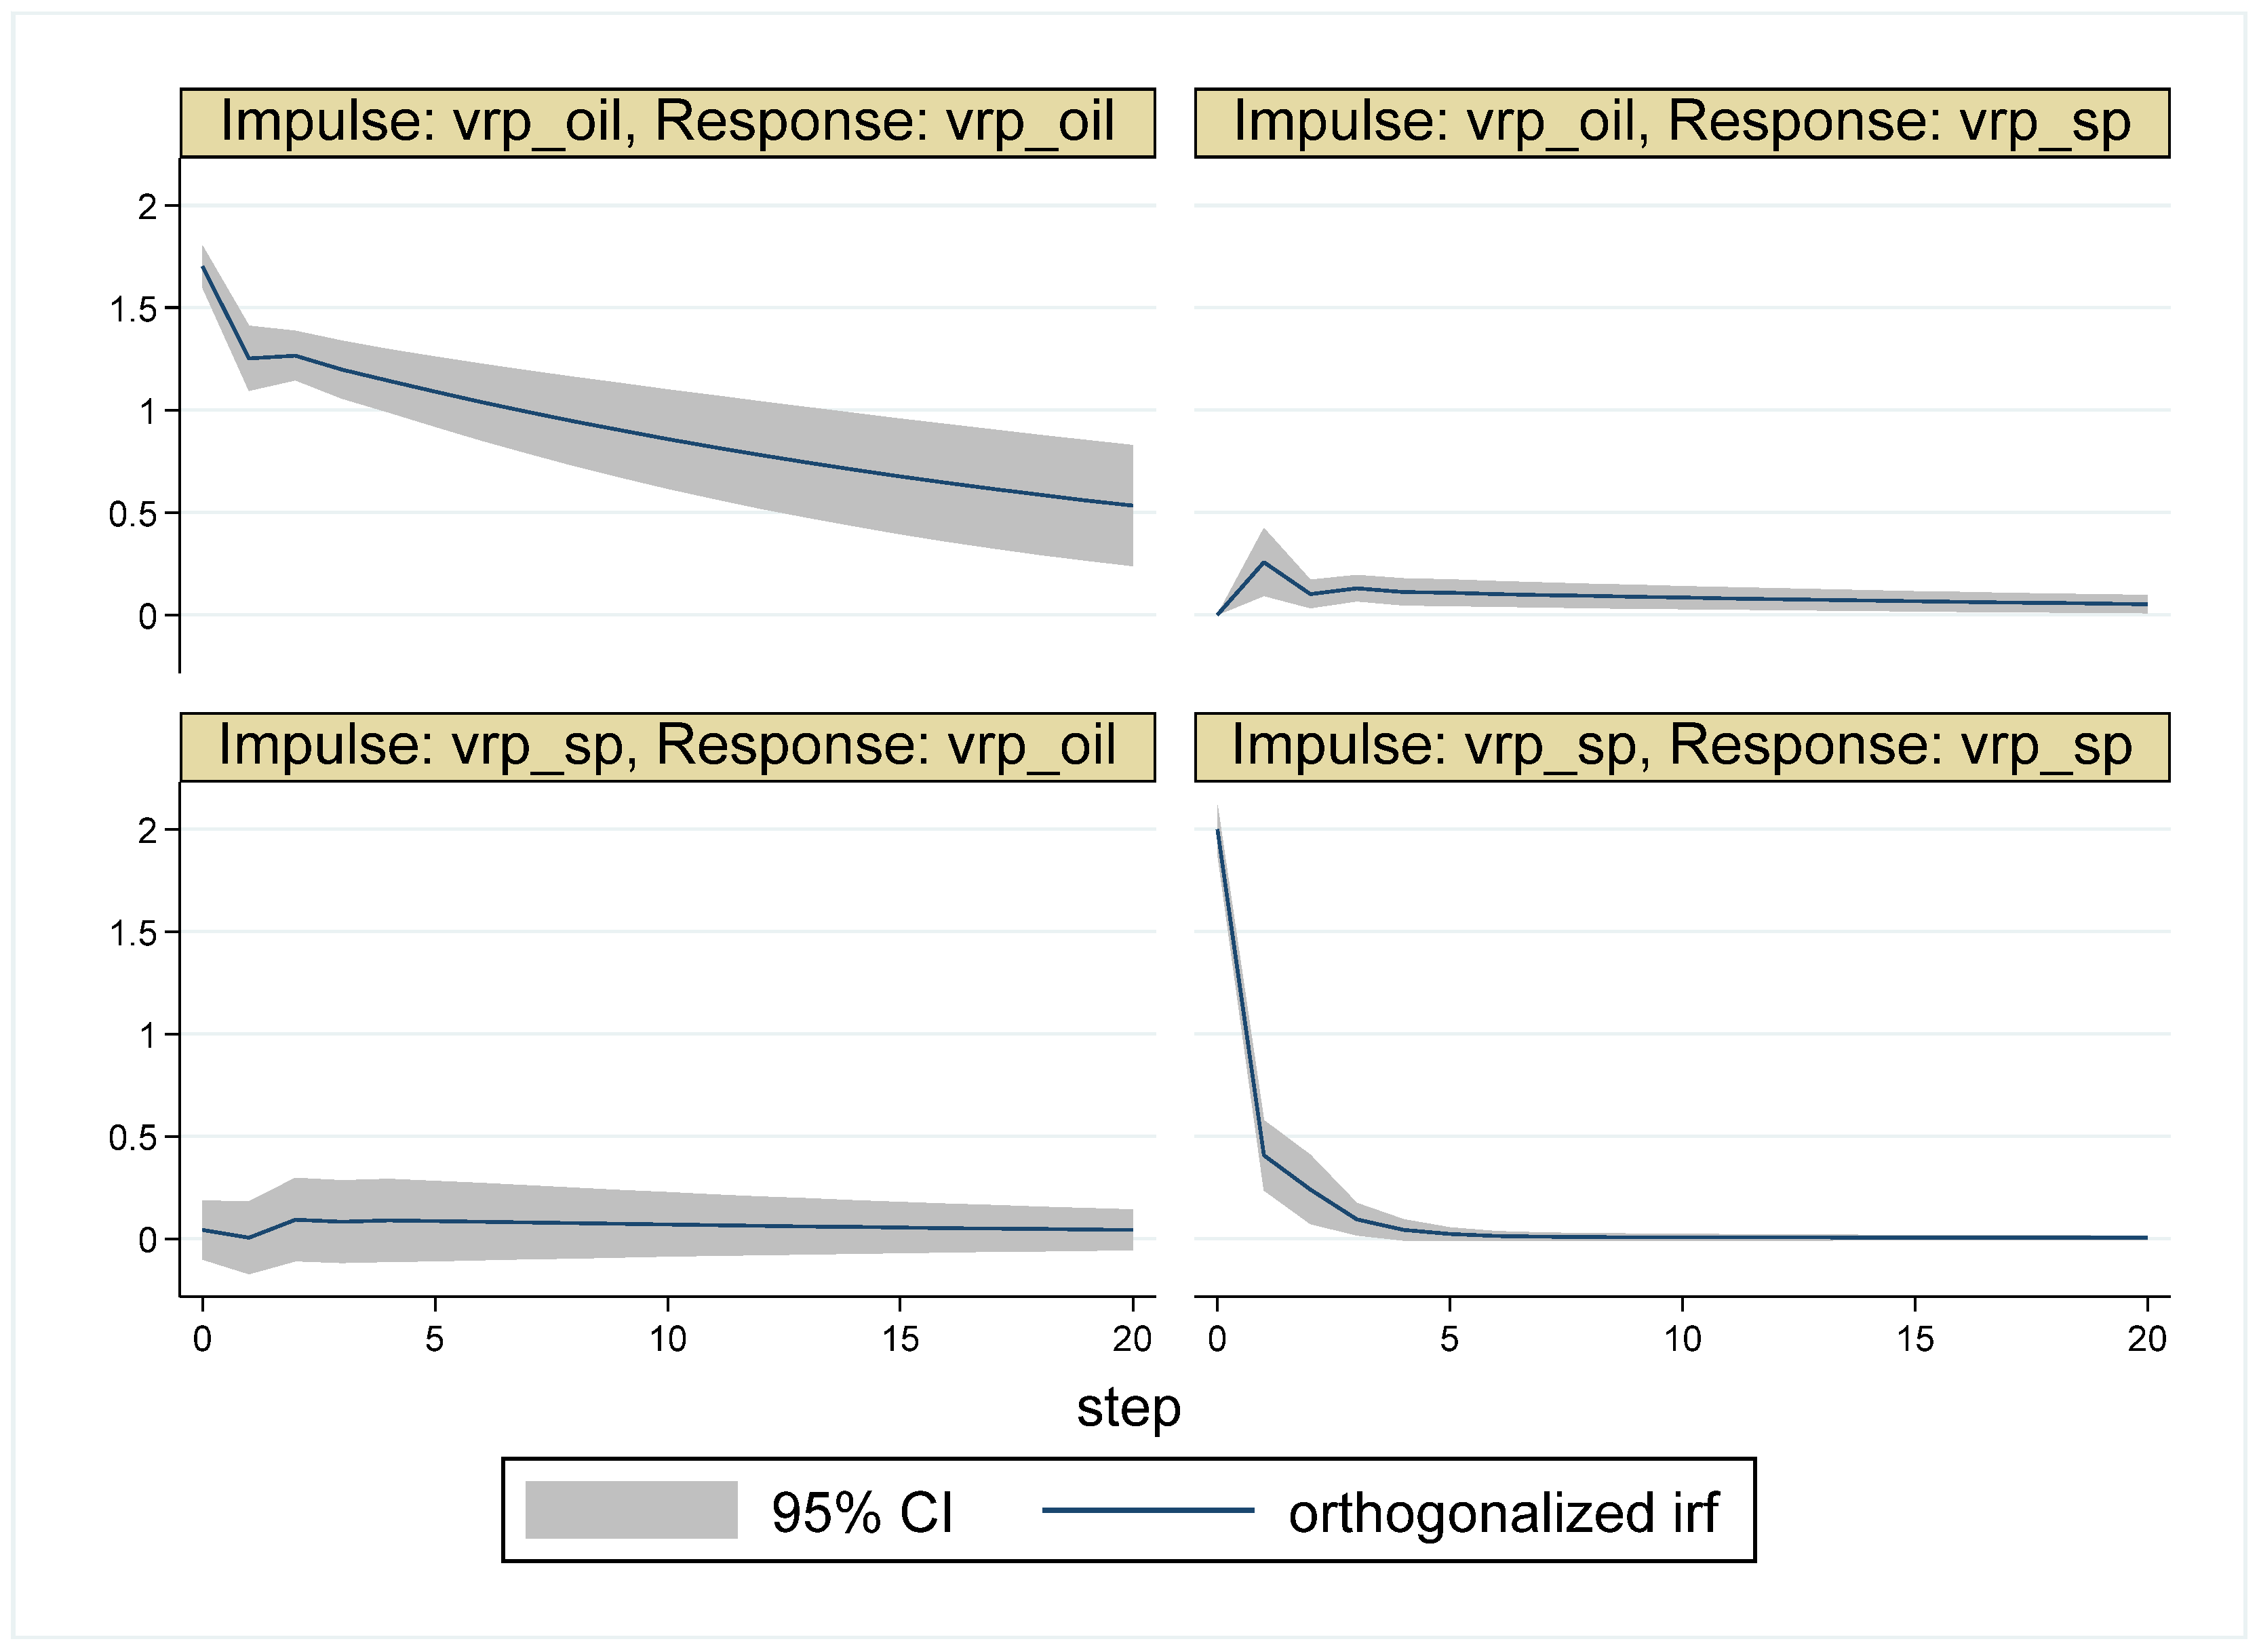
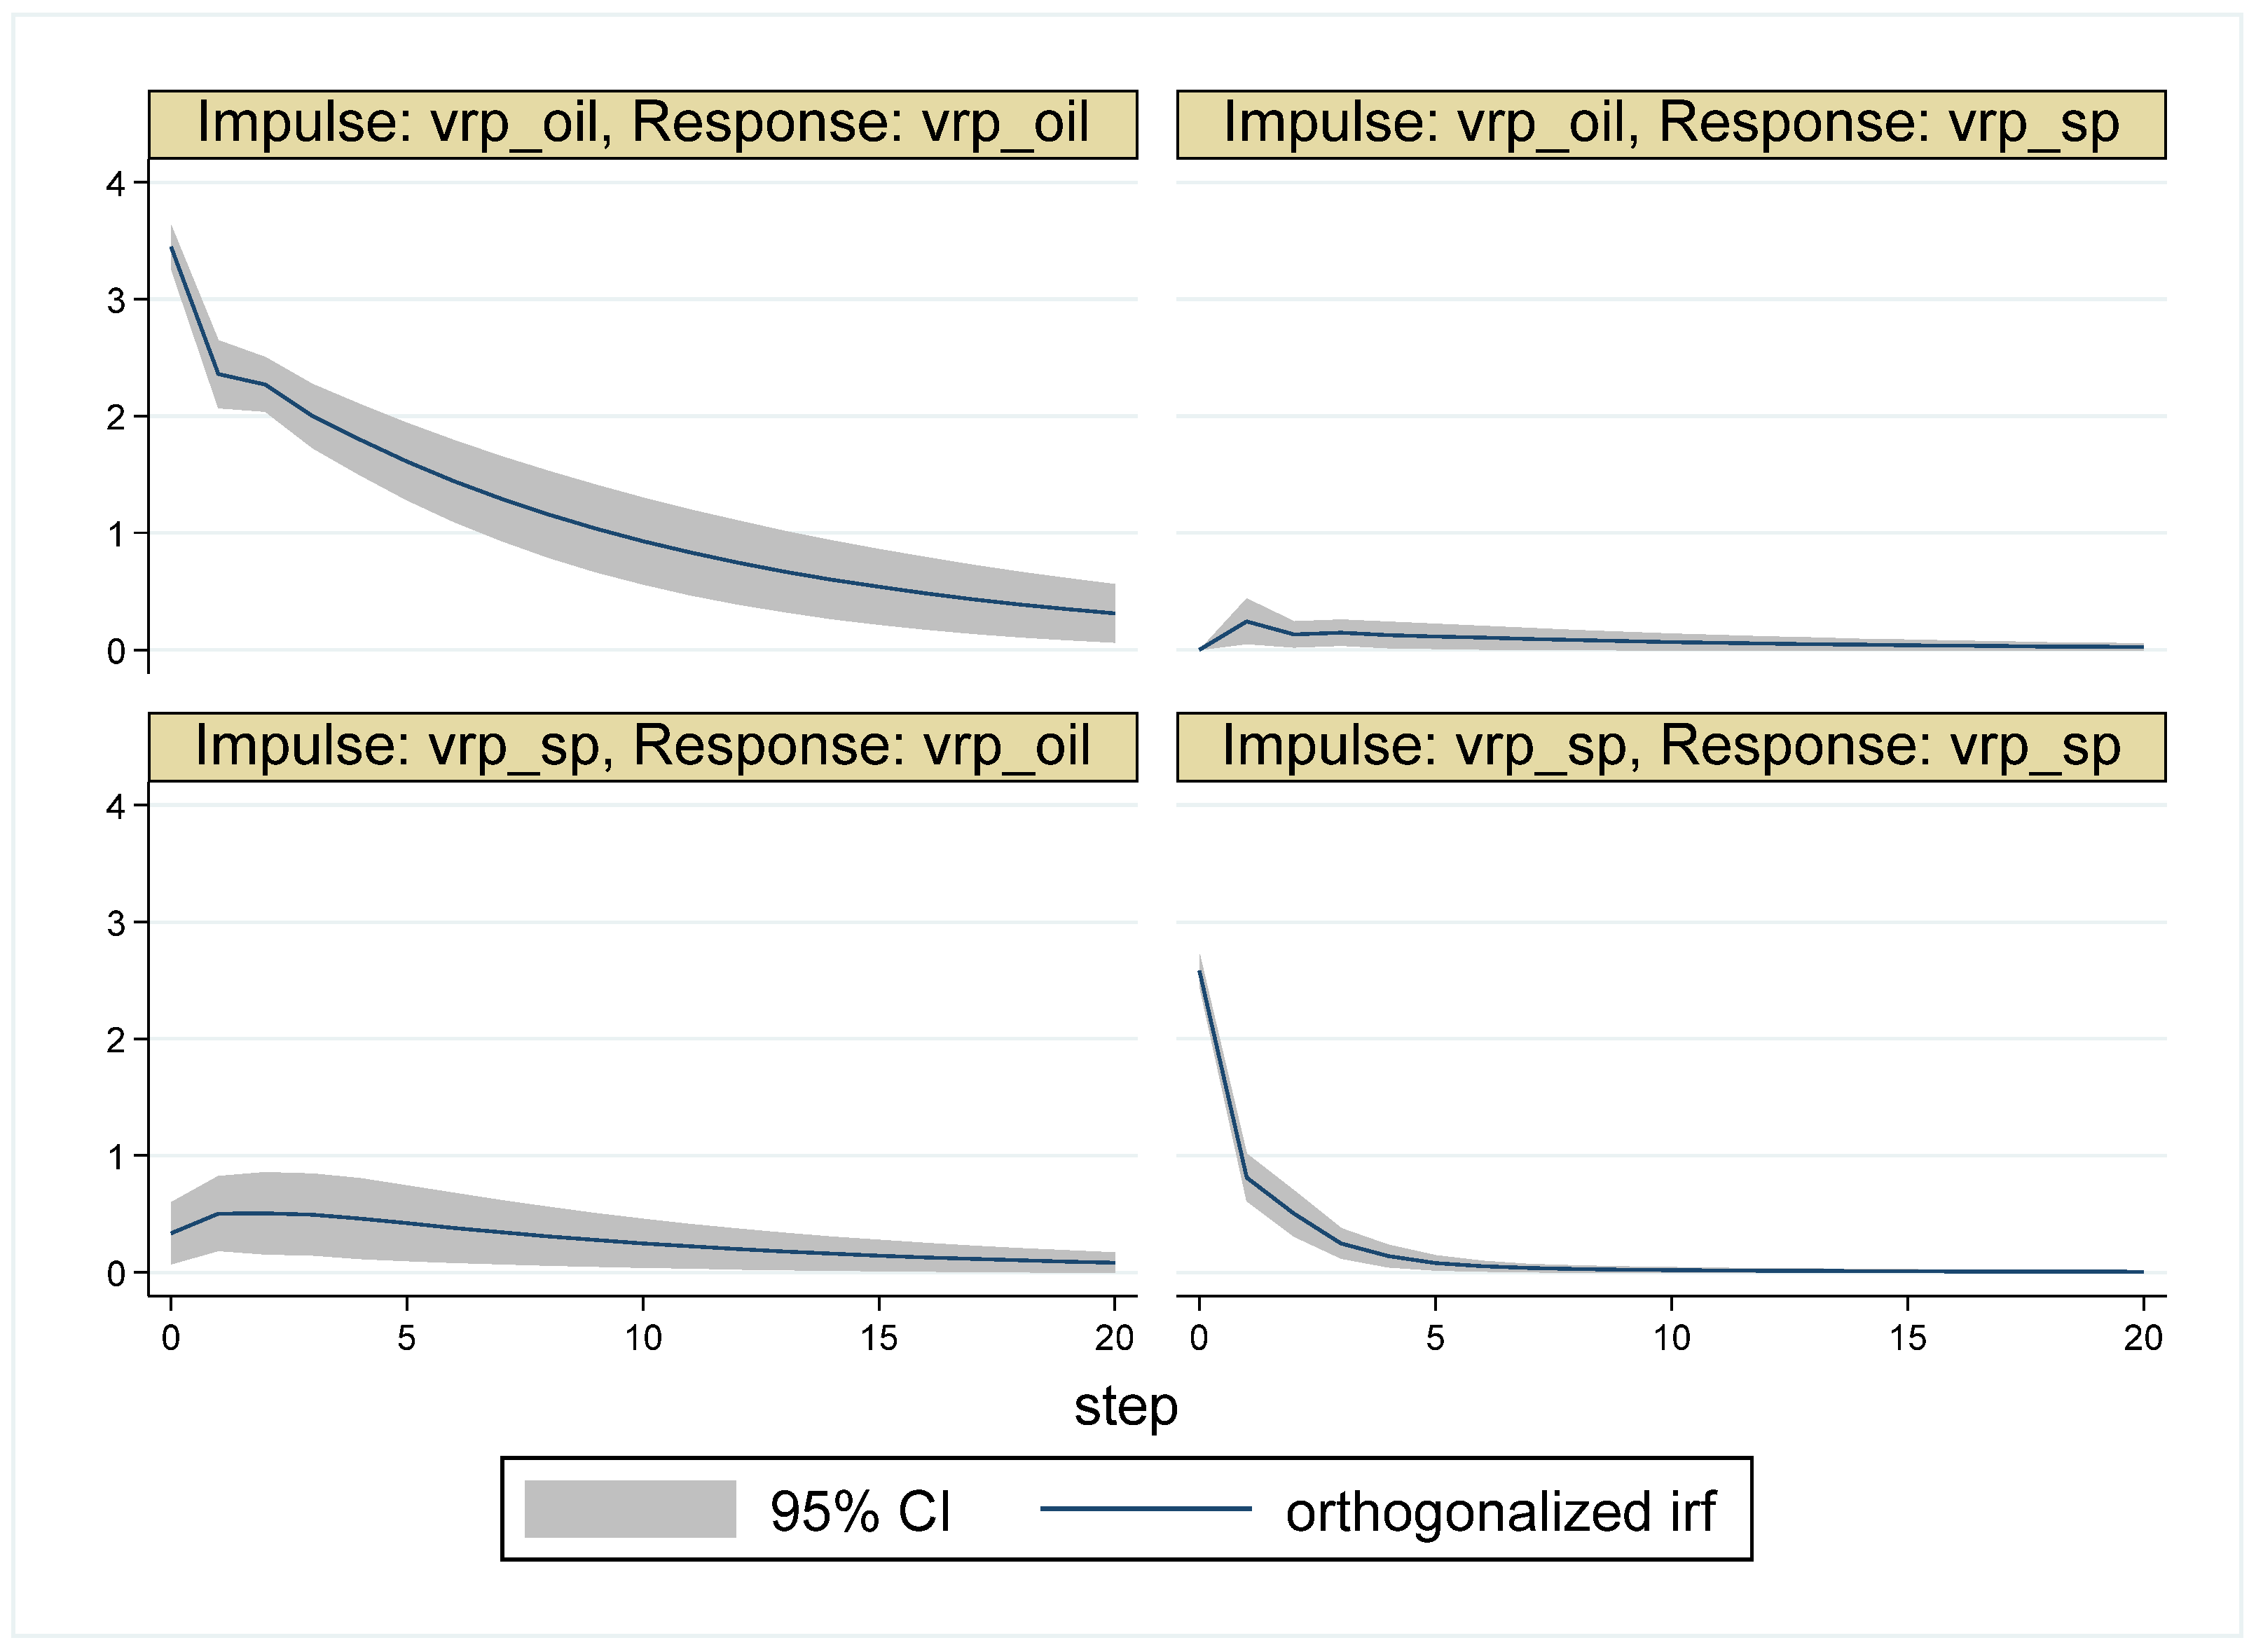
| Whole Period | 10 May 2007–16 May 2017 (Time = 1–2516) |
|---|---|
| Period 1 (Pre-crisis period) | 10 May 2007–31 May 2008 (time = 1–266) |
| Period 2 (Crisis outbreak period) | 1 June 2008–30 June 2009 (time = 267–533) |
| Period 3 (Post-crisis recovery period I) | 1 July 2009–31 July 2012 (time = 534–1311) |
| Period 4 (Post-crisis recovery period II) | 1 August 2012–30 September 2014 (time = 1312–1855) |
| Period 5 (Plunging oil price period) | 1 October 2014–16 May 2017 (time = 1856–2516) |
| Mean | St. Dev. | Skew. | Kurt. | Corr. | #Obs. | |
|---|---|---|---|---|---|---|
| (Whole) | 7.785 | 4.891 | −3.141 | 49.116 | 0.273 | 2516 |
| (Period 1) | 6.509 | 4.794 | −1.502 | 7.724 | 0.097 | 266 |
| (Period 2) | 9.583 | 10.148 | −2.778 | 22.344 | 0.278 | 267 |
| (Period 3) | 9.536 | 4.168 | −4.291 | 49.595 | 0.344 | 778 |
| (Period 4) | 6.441 | 2.115 | −0.722 | 5.156 | 0.212 | 544 |
| (Period 5) | 6.616 | 2.801 | −2.395 | 24.814 | 0.222 | 661 |
| (Whole) | 4.202 | 6.627 | −0.230 | 5.047 | 0.273 | 2516 |
| (Period 1) | 2.529 | 5.842 | 0.161 | 2.596 | 0.097 | 266 |
| (Period 2) | 3.623 | 9.754 | −0.061 | 3.518 | 0.278 | 267 |
| (Period 3) | 5.846 | 6.317 | 0.135 | 4.315 | 0.344 | 778 |
| (Period 4) | 4.231 | 4.619 | 0.491 | 3.134 | 0.212 | 544 |
| (Period 5) | 3.151 | 6.724 | −0.929 | 5.407 | 0.222 | 661 |
| ADF | DF-GLS | PP | |
|---|---|---|---|
| (Whole) | −11.991 *** | −9.888 *** | −1485.051 *** |
| (Period 1) | −4.928 *** | −4.815 *** | −130.293 *** |
| (Period 2) | −3.623 *** | −3.938 *** | −180.399 *** |
| (Period 3) | −8.022 *** | −7.041 *** | −517.148 *** |
| (Period 4) | −7.744 *** | −7.827 *** | −443.083 *** |
| (Period 5) | −8.864 *** | −8.651 *** | −450.466 *** |
| (Whole) | −11.445 *** | −11.071 *** | −370.718 *** |
| (Period 1) | −4.447 *** | −4.450 *** | −43.848 *** |
| (Period 2) | −4.476 *** | −4.656 *** | −62.622 *** |
| (Period 3) | −5.895 *** | −5.917 *** | −111.345 *** |
| (Period 4) | −3.628 *** | −3.864 *** | −32.445 *** |
| (Period 5) | −5.982 *** | −5.598 *** | −92.555 *** |
| AIC | HQIC | SBIC | Selected Length | |
|---|---|---|---|---|
| Whole Period | 18 | 5 | 2 | 5 |
| Period 1 | 1 | 1 | 1 | 1 |
| Period 2 | 2 | 2 | 2 | 2 |
| Period 3 | 3 | 3 | 3 | 3 |
| Period 4 | 2 | 2 | 2 | 2 |
| Period 5 | 7 | 2 | 2 | 2 |
| Null Hypothesis | Period | Chi 2 | # of Lags |
|---|---|---|---|
| does not GC | Whole | 21.174 *** | 5 |
| does not GC | Whole | 26.076 *** | 5 |
| Impulse | ||||
|---|---|---|---|---|
| Response | ||||
| 1 | 1 | 0 | 0.005 | 0.995 |
| 5 | 0.996 | 0.004 | 0.020 | 0.980 |
| 10 | 0.986 | 0.014 | 0.037 | 0.963 |
| 15 | 0.977 | 0.023 | 0.048 | 0.952 |
| 20 | 0.973 | 0.027 | 0.052 | 0.948 |
| Null Hypothesis | Period | Chi 2 | # of Lags |
|---|---|---|---|
| does not GC | Period 1 | 1.214 | 1 |
| Period 2 | 1.011 | 2 | |
| Period 3 | 35.073 *** | 3 | |
| Period 4 | 1.439 | 2 | |
| Period 5 | 4.786 * | 2 | |
| does not GC | Period 1 | 0.024 | 1 |
| Period 2 | 6.861 ** | 2 | |
| Period 3 | 27.029 *** | 3 | |
| Period 4 | 18.452 *** | 2 | |
| Period 5 | 9.066 ** | 2 |
| Impulse | ||||
|---|---|---|---|---|
| Response | ||||
| Period 1 | ||||
| 1 | 1 | 0 | 0.004 | 0.996 |
| 5 | 0.992 | 0.008 | 0.005 | 0.995 |
| 10 | 0.989 | 0.011 | 0.005 | 0.995 |
| 15 | 0.989 | 0.011 | 0.005 | 0.995 |
| 20 | 0.989 | 0.011 | 0.005 | 0.995 |
| Period 2 | ||||
| 1 | 1 | 0 | 0.004 | 0.996 |
| 5 | 0.995 | 0.005 | 0.044 | 0.956 |
| 10 | 0.992 | 0.008 | 0.070 | 0.930 |
| 15 | 0.991 | 0.009 | 0.078 | 0.922 |
| 20 | 0.991 | 0.009 | 0.080 | 0.920 |
| Period 3 | ||||
| 1 | 1 | 0 | 0.015 | 0.985113 |
| 5 | 0.981 | 0.019 | 0.056 | 0.944 |
| 10 | 0.985 | 0.015 | 0.095 | 0.905 |
| 15 | 0.985 | 0.015 | 0.110 | 0.890 |
| 20 | 0.985 | 0.015 | 0.114 | 0.886 |
| Period 4 | ||||
| 1 | 1 | 0 | 0.001 | 0.999 |
| 5 | 0.999 | 0.001 | 0.027 | 0.973 |
| 10 | 0.998 | 0.002 | 0.037 | 0.963 |
| 15 | 0.998 | 0.002 | 0.044 | 0.956 |
| 20 | 0.998 | 0.002 | 0.048 | 0.952 |
| Period 5 | ||||
| 1 | 1 | 0 | 0.009 | 0.991 |
| 5 | 0.990 | 0.010 | 0.032 | 0.968 |
| 10 | 0.986 | 0.014 | 0.037 | 0.963 |
| 15 | 0.985 | 0.015 | 0.039 | 0.961 |
| 20 | 0.985 | 0.015 | 0.040 | 0.960 |
| Impulse | ||||
|---|---|---|---|---|
| Response | ||||
| Period 1 | ||||
| 20 | 0.975 | 0.025 | 0 | 1 |
| Period 2 | ||||
| 20 | 0.979 | 0.021 | 0.065 | 0.935 |
| Period 3 | ||||
| 20 | 0.961 | 0.039 | 0.084 | 0.916 |
| Period 4 | ||||
| 20 | 0.995 | 0.005 | 0.045 | 0.955 |
| Period 5 | ||||
| 20 | 0.956 | 0.044 | 0.023 | 0.977 |
Disclaimer/Publisher’s Note: The statements, opinions and data contained in all publications are solely those of the individual author(s) and contributor(s) and not of MDPI and/or the editor(s). MDPI and/or the editor(s) disclaim responsibility for any injury to people or property resulting from any ideas, methods, instructions or products referred to in the content. |
© 2023 by the authors. Licensee MDPI, Basel, Switzerland. This article is an open access article distributed under the terms and conditions of the Creative Commons Attribution (CC BY) license (https://creativecommons.org/licenses/by/4.0/).
Share and Cite
Nakamura, N.; Ohashi, K.; Yokouchi, D. Dynamic Relationship between Volatility Risk Premia of Stock and Oil Returns. J. Risk Financial Manag. 2023, 16, 173. https://doi.org/10.3390/jrfm16030173
Nakamura N, Ohashi K, Yokouchi D. Dynamic Relationship between Volatility Risk Premia of Stock and Oil Returns. Journal of Risk and Financial Management. 2023; 16(3):173. https://doi.org/10.3390/jrfm16030173
Chicago/Turabian StyleNakamura, Nobuhiro, Kazuhiko Ohashi, and Daisuke Yokouchi. 2023. "Dynamic Relationship between Volatility Risk Premia of Stock and Oil Returns" Journal of Risk and Financial Management 16, no. 3: 173. https://doi.org/10.3390/jrfm16030173
APA StyleNakamura, N., Ohashi, K., & Yokouchi, D. (2023). Dynamic Relationship between Volatility Risk Premia of Stock and Oil Returns. Journal of Risk and Financial Management, 16(3), 173. https://doi.org/10.3390/jrfm16030173


