1. Introduction
Early evidence indicated that international equity markets were characterized by low correlations resulting in benefits from international diversification (
Solnik 1974). However, over time these diversification benefits were said to have declined due to greater correlations between markets. The increase in correlations was found to be most acute during market crises, which is exactly when investors need diversification the most (
Bertero and Mayer 1990;
King et al. 1994; and
Longin and Solnik 1995). These increased correlations led many to question the benefit of international equity diversification, including
Sinquefield (
1996) who found little to no benefits from it.
The increasing correlations among global equity markets has led researchers to consider alternative investments such as real estate as possibly providing greater diversification benefits.
Hoesli et al. (
2022) found that the addition of real estate benefitted a multi-asset Japanese portfolio. On the other hand,
Malhotra (
2024) reports that the correlation of US real estate funds with global equity indices increased during the COVID-19 crisis and that US real estate funds underperformed global equities in terms of both absolute and risk-adjusted returns.
However, there may be opportunities to improve portfolio performance by using foreign real estate if these assets are influenced primarily by local market conditions and less by the larger global economy. In other words, foreign real estate may be more segmented and provide greater diversification benefits than more integrated global equity markets. Earlier analyses documenting the benefits that can be gained from international real estate diversification include
Sweeney (
1989),
Giliberto (
1990),
Liu and Mei (
1998), and
Conover et al. (
2002).
In more recent research,
de Wit (
2010) segregated international real estate by property type and region and found that geography has a greater influence on volatility than property type. These results indicate that real estate returns are driven more by regional than by global economic conditions, possibly insulating them from global economic shocks.
Shen et al. (
2012) showed that international real estate funds performed better and were less risky than US real estate funds before June 2007, providing evidence for diversification benefits. However, after the sub-prime financial crisis occurred, these benefits diminished.
Liow and Angela (
2017) examined the correlations surrounding the global financial crisis between the US, UK, Japan, Hong Kong, and Singapore real estate. Although all the real estate markets were impacted by the crisis, the Asian markets did not experience the same impact as the US and UK markets, indicating that there is some segregation between these regions. However, the authors do show that correlations increased in the later years of the crisis, indicating the presence of contagion effects.
Coën and Lecomte (
2019) also documented increased global real estate market integration.
Jadevicius (
2020) found that there were diversification benefits from adding globally diversified real estate funds to portfolios. Interestingly, the weighting across these real estate funds from the US, Asia–Pacific, and Europe is nearly equally balanced. Other research indicating diversification benefits from global real estate include
Qayyum and Khan (
2021) who use international residential real estate and
Liow and Song (
2022) who utilize European and US markets during both crisis and booming markets. On the other hand, while
Umar and Olson (
2022) report that global real estate has portfolio benefits over the short term, the authors find no benefits over the long term.
In sum, the benefits of diversifying globally using equity appear to have diminished over time due to increased correlations. Adding global real estate may improve portfolio performance because of its potentially more segmented nature. However, previous research differs on the exact diversification benefits that can be gained from adding global real estate.
Our paper makes several contributions to the existing literature. First, whereas previous research used a limited number of years when examining the diversification benefits from foreign real estate, we utilize a 40-year period. Our monthly data from 1984 through to 2023 allow for a long-term evaluation of real estate’s diversification benefits to a US equity investor. Our sample encompasses several financial market crises during which the comovements in markets typically increased.
Second, although previous research studying the benefit of adding foreign equity or real estate was often limited to using global indices or a handful of individual countries, we use a sample of 13 individual countries from regions around the world. The individual-country equity and real estate indices in our sample are value-weighted, reflecting the actual liquidity to investors.
Third, we examine risk, return, and correlations for our sample. This allows for a comparison of the performance of foreign real estate markets with that of US stocks, US real estate, and foreign stocks. We also calculate rolling correlations that are updated through time to evaluate changes in potential diversification benefits over the 40 years of our sample.
Fourth, we utilize mean-variance efficient frontier analysis for the entire sample, as well as two subperiods, to assess the diversification benefits of foreign real estate, particularly in the latter period in which the correlations between financial markets have increased.
Lastly, in addition to mean-variance analysis, we determine efficient frontiers on the basis of mean return and Conditional Value-at-Risk (CVaR). Investors are often more interested in the potential magnitudes of losses rather than a broad measure of volatility. The use of CVaR provides the average of losses in the left-hand side of a distribution and indicates the exposure of investors to market downturns.
2. Data
We collected monthly real estate and stock return data from January 1984 through to December 2023 to form a 40-year sample for the US and 13 other countries. The countries in our sample are the United States, Australia, Canada, France, Germany, Hong Kong, Italy, Japan, Norway, Singapore, Sweden, Switzerland, the Netherlands, and the United Kingdom. Our sample thus provides exposure to the Americas, Europe, Asia, and the Pacific. We used these 13 countries because they have stock and real estate return data over the entire period of our sample, which is necessary to construct efficient frontiers.
The real estate data are from Global Property Research (GPR). GPR constructs a monthly gross total USD return for their market-capitalization weighted individual country indices. GPR requires real estate firms to have more than 50 million USD in market capitalization, a free float greater than 15%, an operational turnover on property activity greater than 75%, and more than 75% of its operational turnover must be from one country. These rules ensure investability in active and liquid firms operating in office, residential, retail, industrial, health care, hotel, and diversified property sectors.
Our stock return data are from Bloomberg for MSCI’s Gross Total Return USD Indexes for the individual countries. We also utilized broad indices to gauge the correlation of foreign stocks and foreign real estate with US stocks over time. For foreign real estate, we use GPR’s World ex-US real estate index. MSCI’s World ex-US index is used for the foreign stock index. In addition, we collected US 1-month T-bill returns from Ken French’s website to calculate Sharpe ratios.
3. Results
3.1. Sample Statistics
Table 1 shows the average, minimum, and maximum number of companies in the international real estate indices. Using the averages, the US index has the greatest number of firms (130) followed by Japan (61) and the United Kingdom (52). The average number of companies is less than 10 in only three countries: Italy, the Netherlands, and Norway. Italy and Norway have the fewest average each (2), though they have had as many as 7 and 4 in a month in the sample, respectively. When including the US, there is an average of 33 companies across all countries in the sample. Excluding the US, the average across all countries is 25. Thus, US equity investors would have the ability to diversify both across the 13 foreign countries in our sample, and within most countries in our sample.
3.2. Summary Performance Statistics
Summary performance statistics are presented in
Table 2 for broad and the 14 individual country indices used in our sample. There are 480 monthly observations in our 40-year sample. Panel A provides the US stock and real estate indices, as well as the broad World ex-US stock and real estate indices. Over the sample period, the broad US stock index exhibits a higher mean monthly return (1.00%), a lower mean monthly standard deviation (4.44%), and a higher Sharpe ratio (0.164) than the US real estate, foreign stock, and foreign real estate indices. The correlation between US stocks and the foreign stock indices is relatively high at 0.734. However, both domestic and global real estate exhibit lower correlations to US stocks at 0.650 and 0.570. It is interesting that foreign stocks are more highly correlated with US stocks than US real estate is. This suggests that real estate is more segmented relative to equity markets, particularly in the case of foreign real estate, and suggests that foreign real estate may offer diversification benefits to US equity investors.
Panel B of
Table 2 summarizes individual country stock returns. On average, Hong Kong has the highest mean returns (1.20%), followed by Sweden (1.19%) and the Netherlands (1.10%), which are higher than the US’ mean return of 1.00%. The highest Sharpe ratios are Switzerland (0.157), the Netherlands (0.148), and Sweden (0.131), though none of these Sharpe ratios exceed that of US stocks (0.164). It is perhaps unsurprising given its geographic proximity and economic interdependence that Canadian stocks have the highest correlation with US stocks (0.791), followed by the Netherlands (0.757) and the United Kingdom (0.727).
Individual country real estate returns are presented in Panel C. Notably, Hong Kong again has the highest mean return (1.43%), followed by Switzerland (1.23%) and Sweden (1.22%). The Netherlands has the highest Sharpe ratio (0.125), followed by Hong Kong and Australia (each at 0.122).
Comparing the country-specific mean stock returns (Panel B) to the mean real estate returns (Panel C), stock returns are greater than real estate returns in seven countries (Canada, France, Germany, Italy, Norway, the Netherlands, and the United Kingdom). For median and the 75th percentile returns, the stock returns are higher in eleven and nine countries, respectively. Likewise, real estate returns are more favorable than stock returns using the 26th percentile in only four of the thirteen foreign countries.
Examining risk, a similar story is shown. Stock returns have a more favorable (lower) risk than real estate returns in nine of the thirteen countries. Combining risk and return, the Sharpe ratios are higher for stock markets in ten of thirteen countries. The averages across all 13 countries for stock and real estate in the last rows of Panels B and C are largely consistent with the individual country data. On average, foreign stock markets have more favorable risk, returns, and Sharpe ratios, although the 26th percentile returns are similar. For example, the Sharpe ratio average across all 13 foreign stock markets is 0.111 versus 0.084 for the 13 real estate markets.
Despite the unfavorable performance of foreign real estate markets compared to their stock market counterparts in terms of risk and return, one must also consider the correlations for the US stock market with foreign stock and real estate markets in the last column. Comparing the correlations of the 13 foreign stock markets with the US stock market versus that of the 13 foreign real estate markets with the US stock market, foreign real estate has lower correlations in all markets. The difference between the US stocks’ correlations with with foreign stocks and their correlations with foreign real estate is never less than 0.10 and in some cases it is quite large. For example, at the extreme, the correlation of US stocks with the Netherlands stocks (0.757) and the Netherlands real estate (0.196) has a difference of 0.561. Across all countries (the last rows of Panels B and C), the correlation between US stock and the foreign stock market is 0.644 whereas it is 0.422 for foreign real estate, a difference greater than 0.2.
These lower correlations suggest that foreign real estate may provide portfolio diversification benefits. Our efficient frontier analysis later in the paper utilizes individual country data to determine the optimal portfolios. Our methodology allows the US investor to take positions in each of the 13 foreign stock markets and in each of the 13 foreign real estate markets, rather than being limited to broad foreign indices. The advantage of this is apparent when we compare the individual country correlations to US equity in Panels B and C to that for the broad indices in Panel A. The 13 individual correlations in Panel B are lower than the broad foreign stock index correlation of 0.734 in Panel A in 11 of 13 foreign stock markets. For foreign real estate, the individual correlations in Panel C are lower than the Panel A broad foreign real estate index correlation of 0.570 in 12 of the 13 foreign markets. Our subsequent analysis utilizes these unique correlations as well as their risk and return to determine the optimal portfolios for various investor preferences.
3.3. Rolling Correlations
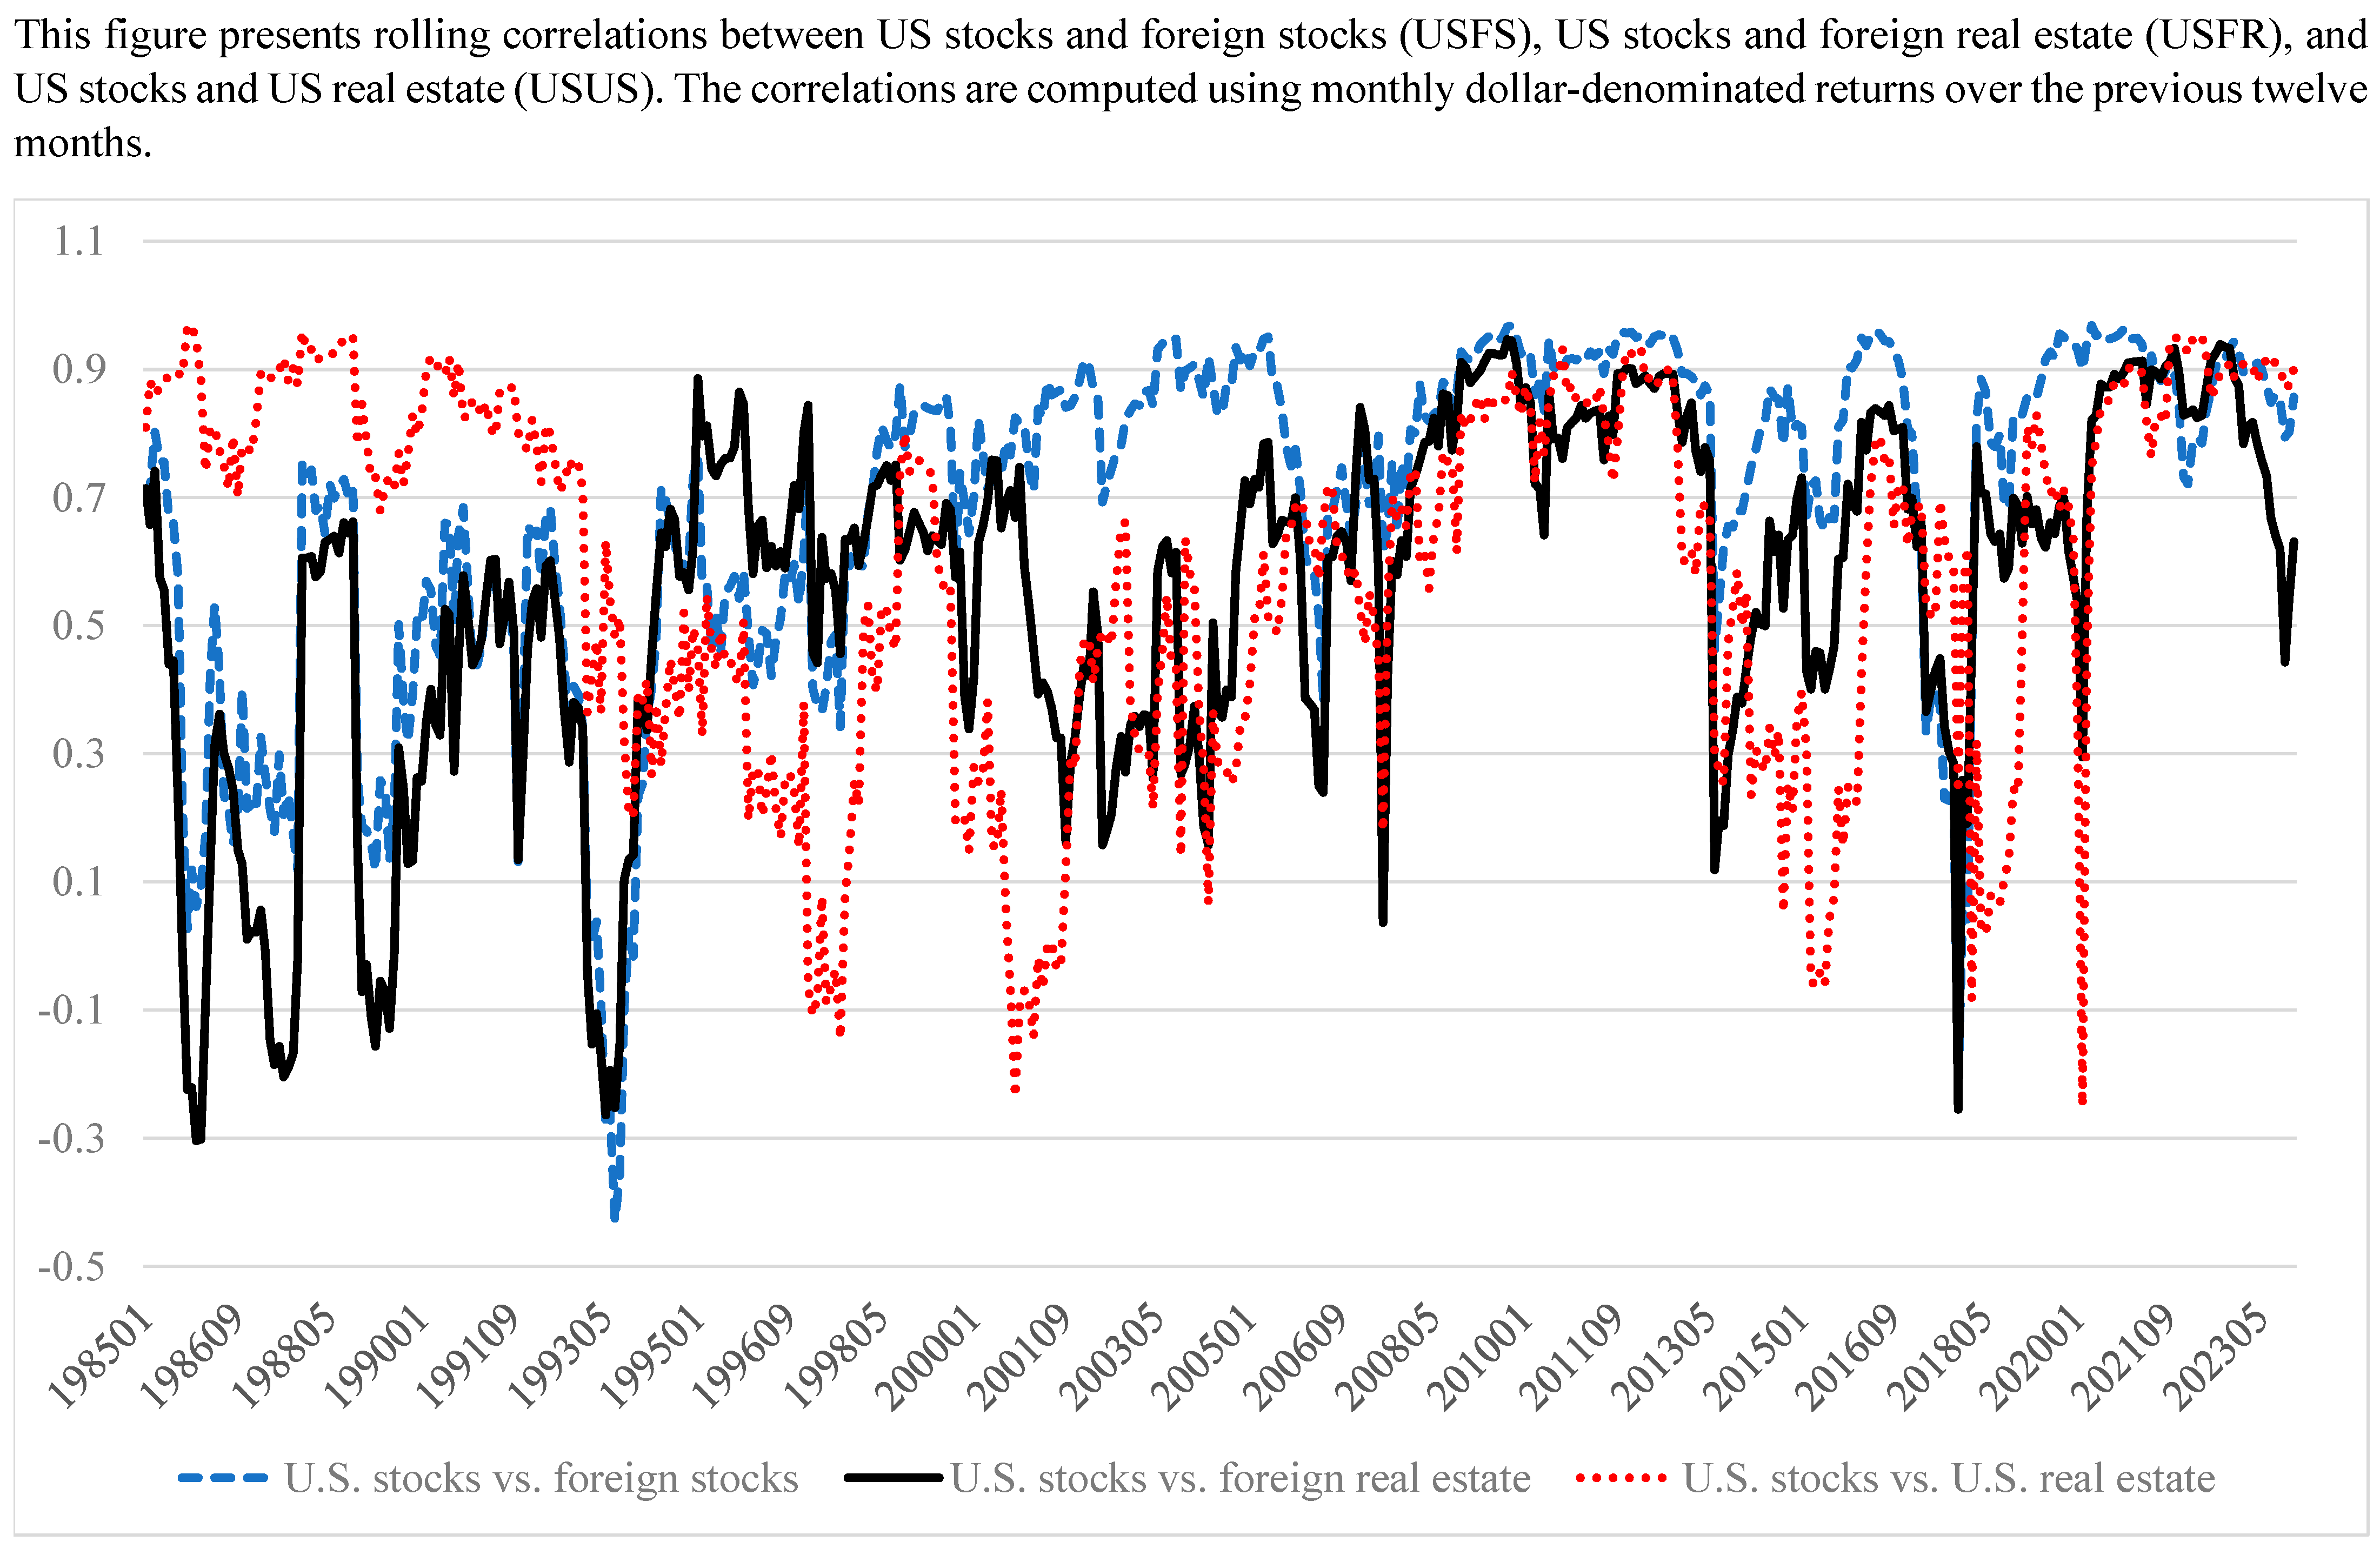
In
Figure 1, we plot rolling correlations between (1) US stocks and US real estate—hereafter USUS; (2) US stocks and foreign stocks—hereafter USFS; and (3) US stocks and foreign real estate—hereafter USFR. Our rolling Pearson correlations are updated monthly using dollar-denominated returns for the broad indices in
Table 2 Panel A. They are computed using data over the previous twelve months.
There are several distinctive characteristics apparent from this figure. First, as for the correlations estimated over the entire sample in
Table 2, the average of the rolling correlations here suggests that real estate is usually more segmented relative to equity markets. We can calculate the USUS and USFR averages as 0.586 and 0.556, respectively, versus the USFS average of 0.688. Relatively higher values for USFS are particularly present in the latter years of the sample period. The relatively lower correlations between US stocks and foreign real estate and US real estate suggests that these assets may have greater diversification benefits for US equity portfolios, particularly for foreign real estate.
Second, there are no correlations that remain consistently high or low between US stocks and the other asset classes. Over the sample period, USUS ranges from −0.250 to 0.968, USFS ranges from −0.429 to 0.968, and USFR ranges from −0.303 to 0.947. For example, for the Global Financial Crisis which began in December of 2007 and continued through to June 2009, the average correlations can be calculated as 0.883, 0.843, and 0.750 for USFS, USFR, and USUS, respectively. These crisis-period correlations exceed the average correlation of each series. However, subsequent to the crisis, the correlations dramatically fell and in some periods approached zero or negative values.
A third characteristic of the plots is that correlations have generally increased over time, as previous research has shown. The average of the three rolling correlations (USUS, USFS, and USFR) during the first half of the sample from 1984 to 2003 was 0.504. During the second half of the sample from 2004 to 2023, the average correlation was 0.710. This is consistent with financial markets and economies becoming more interdependent over time due to increased electronic securities trading, global trade, and other factors. Calculating the change in the three correlations, USUS increased from an average of 0.543 to 0.626, USFS from 0.550 to 0.819, and USFR from 0.420 to 0.686. USUS had the lowest latter-period average correlation while USFS had the highest. The high correlation in the latter period between US and foreign stocks (USFS) is consistent with previous findings that foreign stocks have provided reduced diversification benefits as markets have become more integrated.
1Comparing the correlation between US stocks and foreign assets, as noted above, USFR was lower at 0.556 over the entire period versus the 0.688 calculated for USFS. Additionally, in 374 of the 468 (79.9%) total months in the sample, USFR was lower than USFS. Furthermore, while this is true for 72.4% of the months in the earlier time period, it is more frequent in the latter period when it occurs 87.1% of the time. This implies that, despite increasing correlations in general, foreign real estate markets are still more frequently segmented than foreign stock markets and may provide greater diversification benefits to a global investor even as financial markets in general have become more integrated.
4. Optimization and Efficient Frontiers
4.1. Optimization Procedure
We determined Markowitz efficient portfolios (
Markowitz 1952) for the stock and real estate indices in this study. Such portfolios can be found by computing the max Sharpe ratio achievable, or by using
where
S is the Sharpe ratio for portfolio,
rf is the risk-free rate, proxied by the return on 1-month T-bills,
μ is the return for the portfolio calculated by
or the sum of the product of all asset
i returns (
μ) and their respective weights (
ω).
σ is the standard deviation of returns for a portfolio which can be calculated using
where
σij is the covariance between assets
i and
j. This optimization is subject to the constraints that the sum of all of the weights equals one:
and no shorting of indices is permitted:
To calculate the target returns for our efficient frontier portfolios, we determined the asset with the highest and lowest achievable returns. We then plotted 98 portfolios between the highest achievable and lowest achievable return portfolios, for a total of 100 portfolios on each frontier. After minimizing risk for each targeted return by changing the asset weights in the portfolio, we then connected these portfolios using the risk and return values for the intermediate 98 portfolios. Given the fact that we did not permit shorting or leverage, no weights above 100% or below 0% in any index were permitted in our portfolios.
4.2. Efficient Frontiers
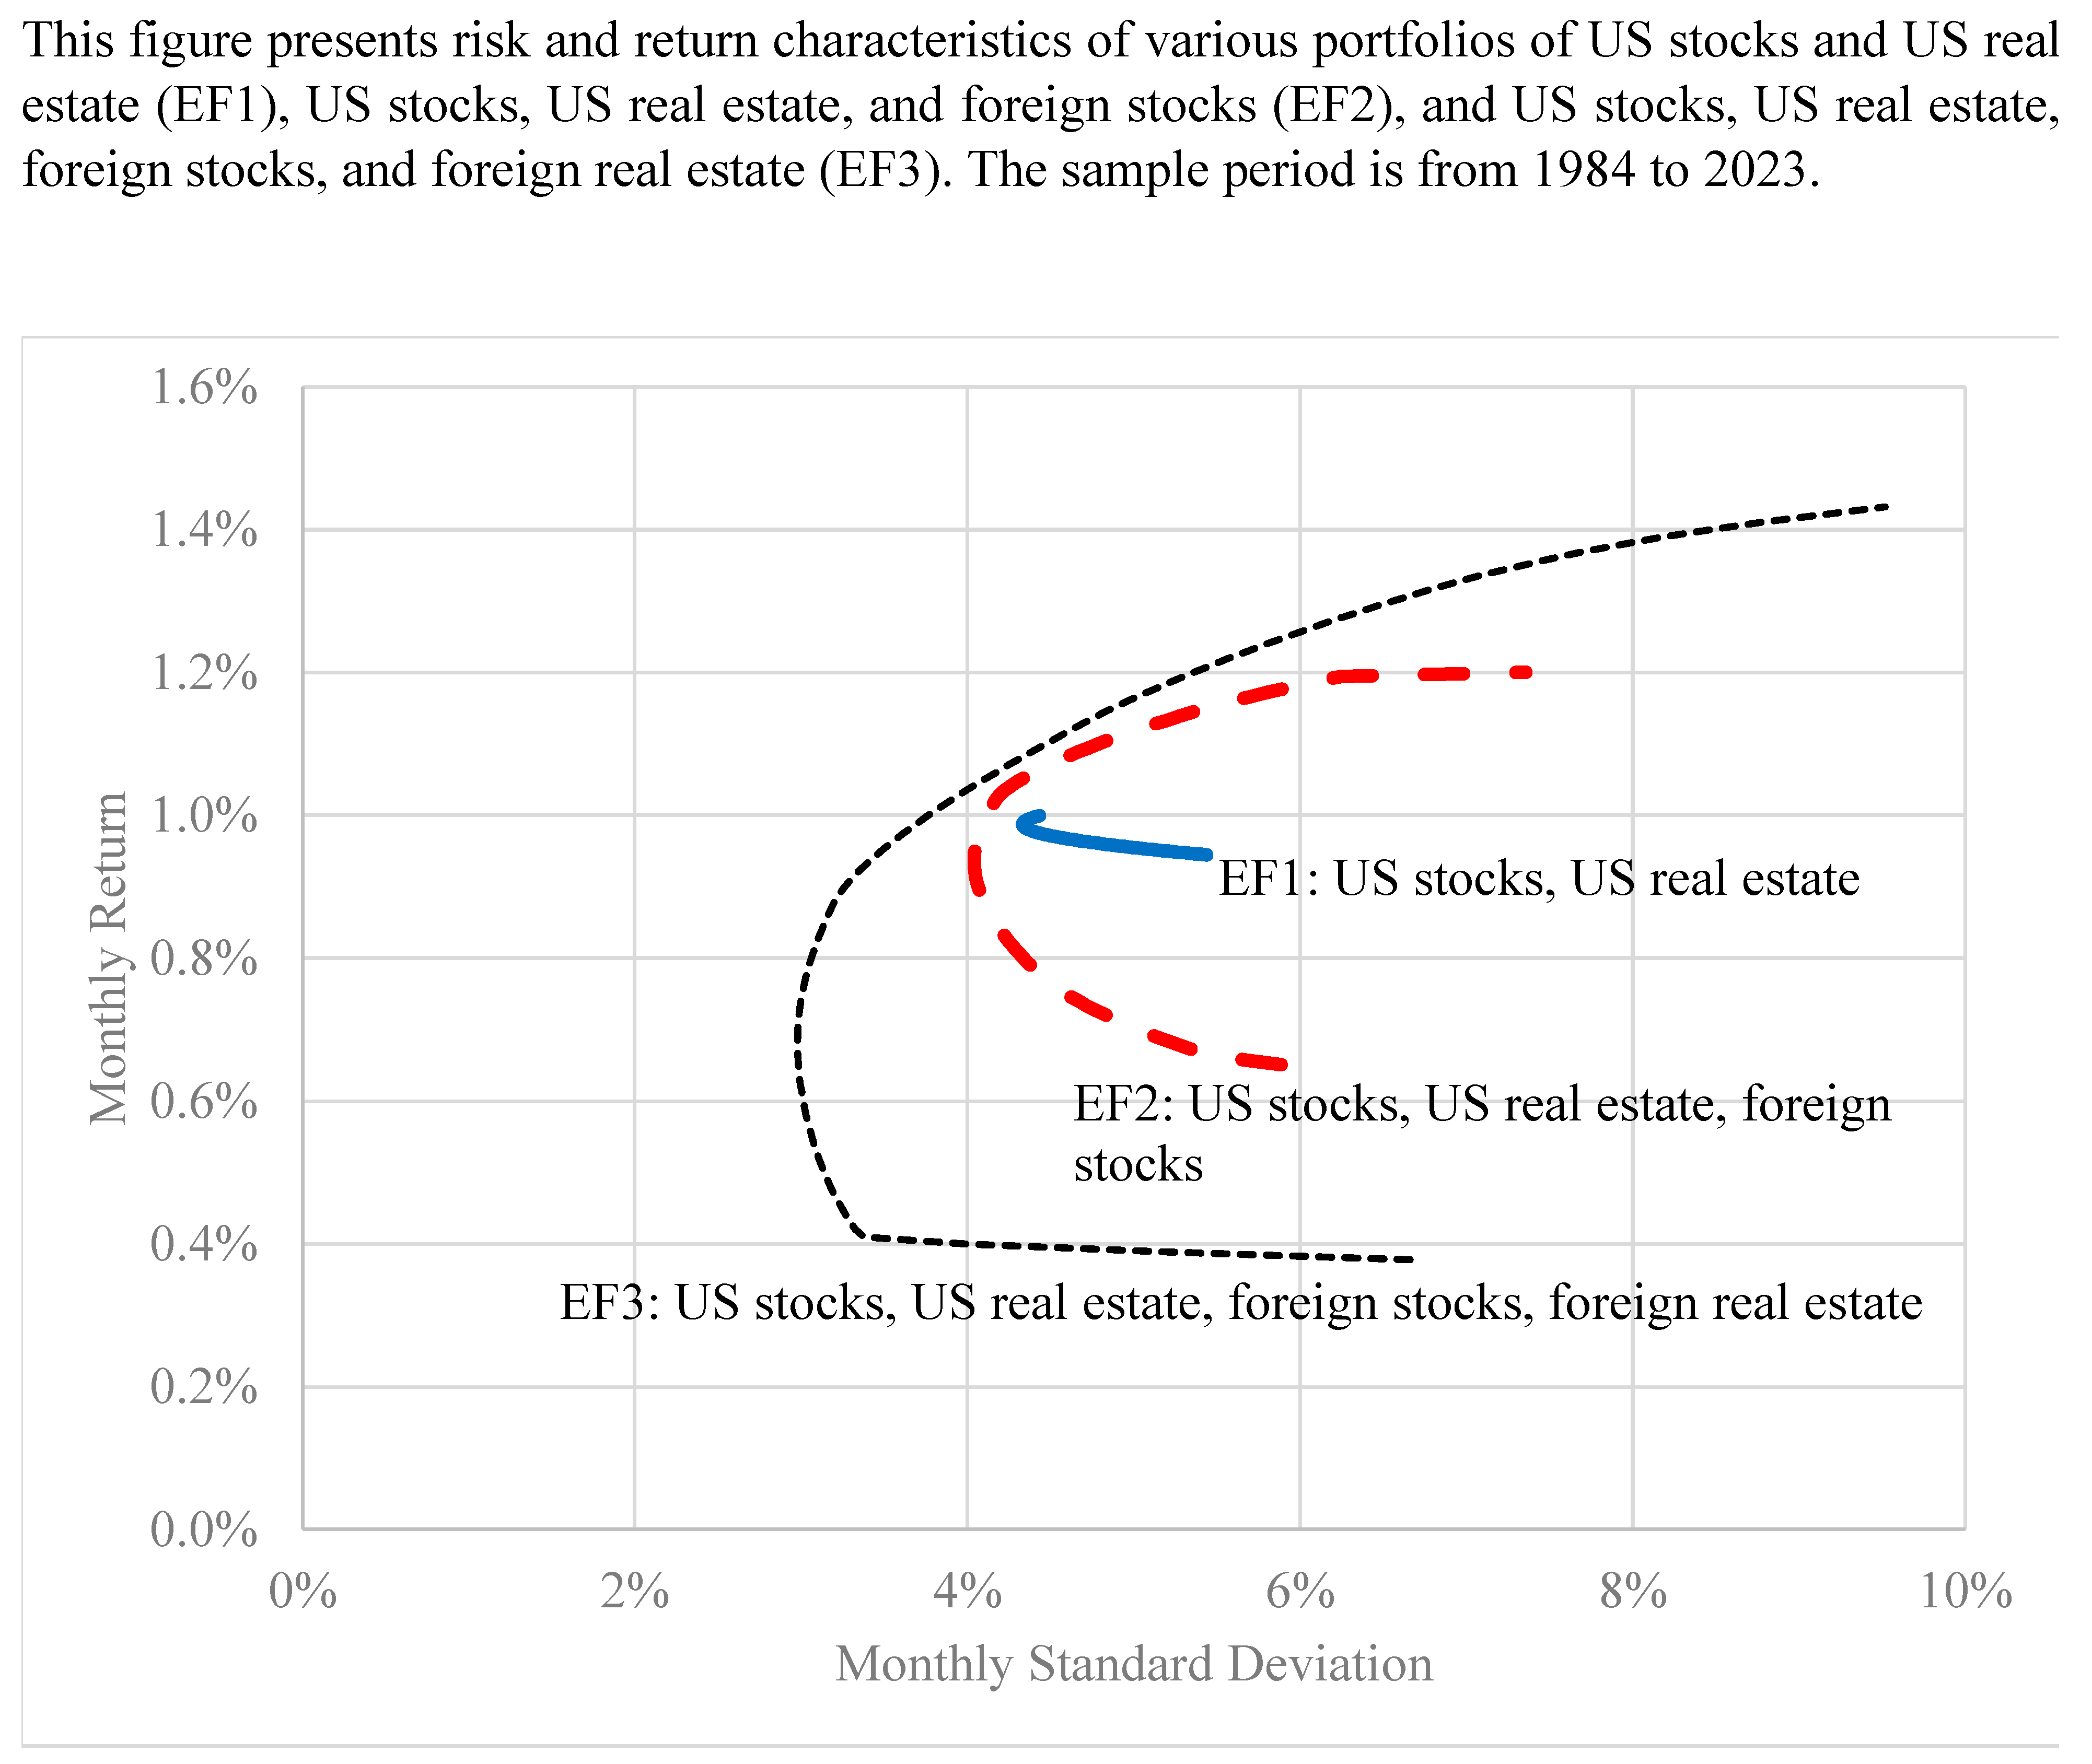
Figure 2 presents the efficient frontiers for three sets of assets: (EF1) US stocks and US real estate, (EF2) US stocks, US real estate, and foreign stocks, and (EF3) US stocks, US real estate, foreign stocks, and foreign real estate. It is readily apparent that an investor who limits themselves to only US stocks and real estate (EF1) has relatively limited opportunities to increase returns or decrease risk compared to the global portfolios (EF2 and EF3). The standard deviation of the minimum variance portfolio of EF1 is 4.33%, whereas it is 4.04% and 2.98% for EF2 and EF3, respectively. On an annualized basis, the standard deviation of the minimum variance portfolio of EF1 is 15.0% (4.33 × 12
0.5) and 10.3% (2.98 × 12
0.5) for EF3, a difference of almost 5%. Limiting oneself to US stocks and real estate also limits an investor’s maximum return. For EF1, the maximum annualized return is 12.0% (1.00% × 12), whereas it is 14.4% (1.20% × 12) and 17.2% (1.43% × 12) for EF2 and EF3, respectively.
The figure also shows that EF3 clearly dominates EF2. Excluding foreign real estate from a global portfolio would limit an investor’s ability to minimize risk and maximize return. For EF2, the annualized standard deviation of the minimum variance portfolio is 14.0% (4.04 × 120.5) whereas it is 10.3% for EF3 (as noted above). Interestingly, the minimum variance portfolio of EF3 has no US real estate as it consists of approximately 31.7% US stocks, 1.2% Japanese stocks, 44.9% German real estate, and 22.2% Swiss real estate. Though the results reflect the time period of the data, it is interesting that foreign real estate constitutes over two-thirds of the lowest risk portfolio, suggesting that the less integrated nature of foreign real estate is beneficial to an internationally diversified US investor.
As noted above, the annualized maximum return difference for EF3 versus EF2 is almost 300 basis points (17.2–14.4%). Additionally, at the maximum return of EF2, EF3 would have had substantially less risk. At this monthly return of 1.20%, the standard deviation of EF3 is 5.38% whereas it is 7.36% for EF2, which are 18.64% and 25.50% on an annual basis. In addition to equity allocations, this EF3 portfolio has approximately 30% in Hong Kong real estate, 7% in Norwegian real estate, and 14% in Swedish real estate. Most investors would probably be surprised that a high return portfolio would be more than half invested in real estate. The fact that all of the real estate allocation is outside the US suggests that global property allocations should be considered by investors seeking to increase their returns.
Next, we examine both risk and return for the three efficient frontiers using the Sharpe ratio of the tangency portfolio, which is the optimal portfolio on a capital market line. Once again, adding foreign real estate to the potential investments provides superior performance, as the optimal portfolio on EF3 has a greater Sharpe ratio than the optimal portfolios on EF1 or EF2 (0.195 versus 0.166 and 0.181). The optimal portfolio on EF3 includes allocations to US stock (45.8%) and Switzerland stock (4.5%), as well as allocations to real estate in Hong Kong (8.7%), Japan (1.1%), Norway (0.3%), Sweden (1.9%), and Switzerland (37.8%). Of note, US real estate is absent from the EF3 optimal portfolio, and the combined allocation to foreign real estate is about half the portfolio.
In sum, the diversification benefit of supplementing a US stock, US real estate, and foreign stock portfolio with foreign real estate is clear: the efficient frontier EF3 lies to the northwest of the more limited efficient frontiers EF1 and EF2, indicating that it offers more opportunities to reduce risk, increase return, and improve the risk–return tradeoff. Furthermore, for minimum variance, high return, and maximum Sharpe ratio portfolios on EF3, foreign real estate always constitutes at least half of each asset allocation. In total, six foreign real estate markets (Germany, Hong Kong, Japan, Norway, Sweden, and Switzerland) are used in these allocations. Thus, it is unlikely that our results are an artifact of a particular country’s strong market during our sample period. It may be unexpected that foreign real estate is so commonplace in the various EF3 portfolios given its relatively modest risk and return in
Table 2. However, foreign real estate also has lower correlations with US equity than foreign stock in all 13 markets, with the differences sometimes being quite substantial.
4.3. Subperiod Analysis
Next, we consider the first half (1984 to 2003) and second half (2004 to 2023) of the sample period separately to examine the benefits of diversification over time. Revisiting the patterns apparent in
Figure 1, we observed dynamic correlations between the asset classes through time. Notably, the average correlations between US stocks and US real estate (USUS), US stocks and foreign stocks (USFS), and US stocks and foreign real estate (USFR) all increase in the second half of the sample relative to their average correlations in the first half of the sample. Furthermore,
Attig and Sy (
2023) have identified the following four crisis periods that occurred during our latter subsample: the Global Financial crisis, the Euro crisis, the BREXIT crisis, and the COVID-19 crisis. Such crises have been associated with increases in global market correlations. These increases in correlations can have a meaningful, detrimental impact on diversification.
Higher correlations between two risky assets implies an increase in the standard deviation of a portfolio constructed of the two assets. The covariance
σij between risky assets
i and
j is the product of the correlation between the two assets and their respective standard deviations:
Substituting the covariance
σij between risky assets
i and
j of Equation (6) into Equation (3) for a two-asset portfolio produces
which shows that the standard deviation
σ of a portfolio increases as the correlation between the component assets increases. Thus, as the correlations between these assets increase in the latter half of the sample, we expect the benefits of diversification to fall. As such, the importance of diversifying a US stock and US real estate portfolio becomes increasingly crucial in higher correlation environments.
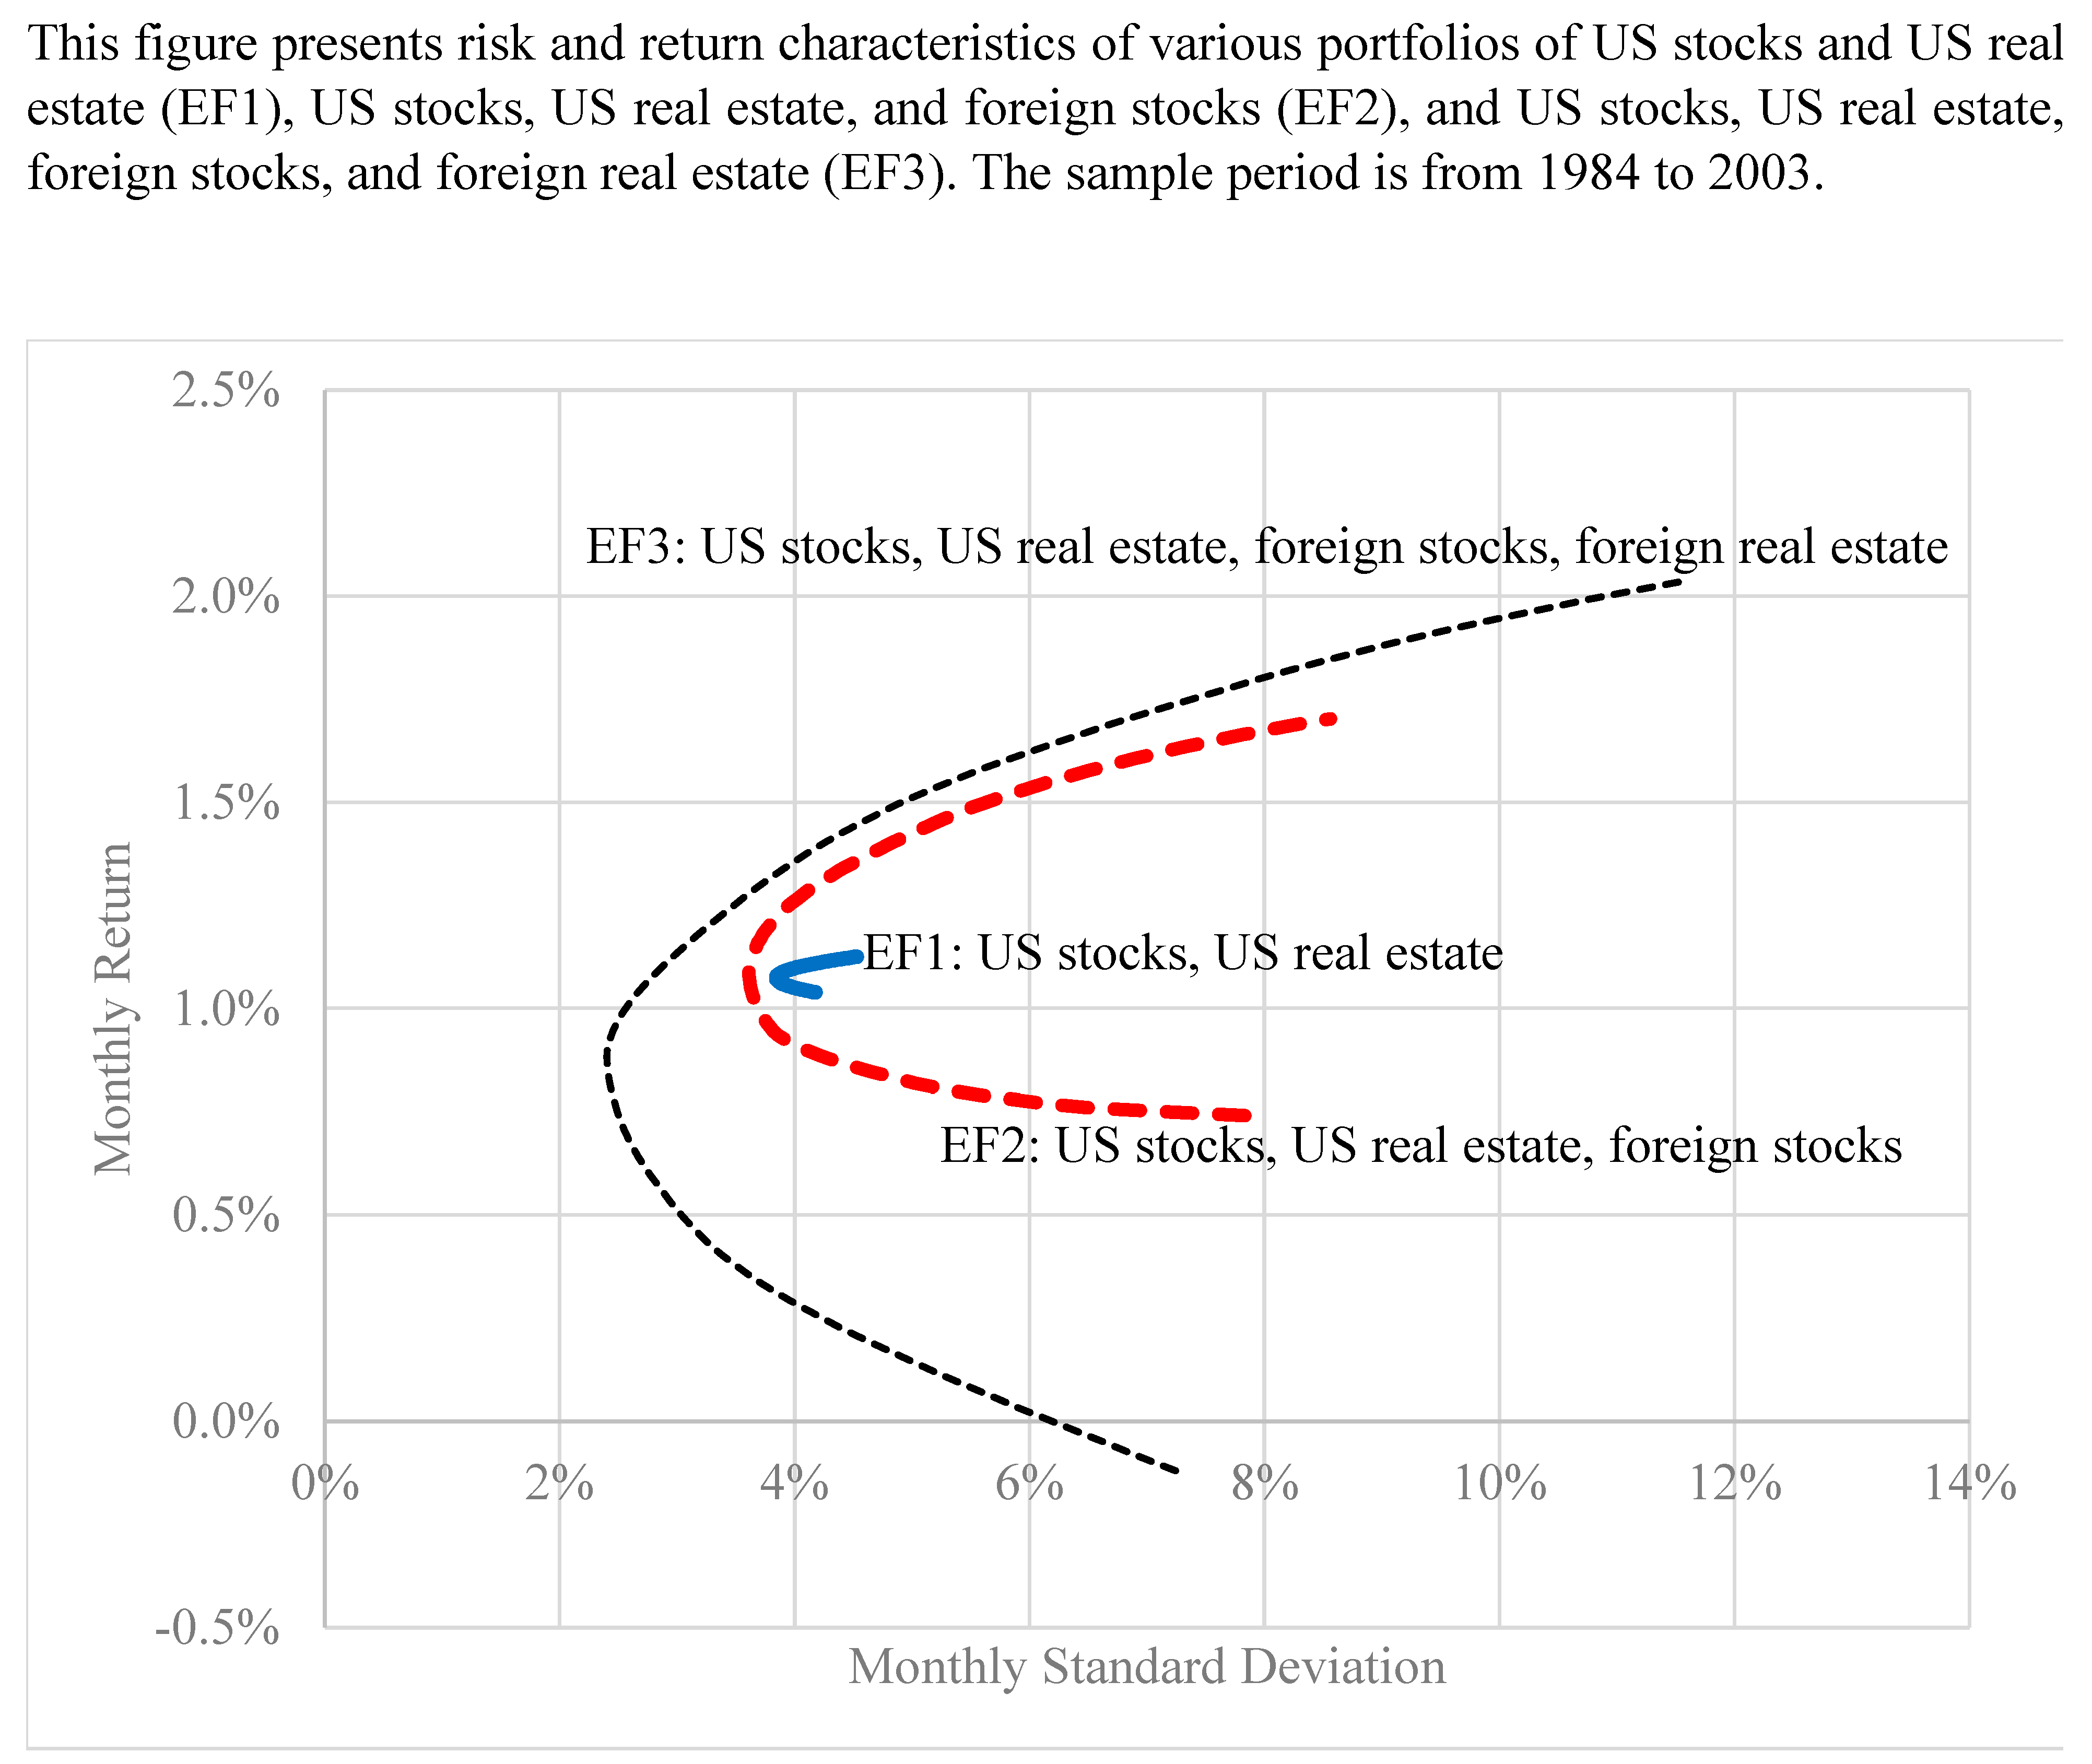
Figure 3 presents the efficient frontiers for (EF1) US stocks and US real estate, (EF2) US stocks, US real estate, and foreign stocks, and (EF3) US stocks, US real estate, foreign stocks, and foreign real estate for the first half of the sample, from 1984 through 2003. Consistent with the findings of
Figure 2, EF3 clearly dominates EF1 and EF2: the efficient frontier consisting of US stocks, US real estate, foreign stocks, and foreign real estate can achieve greater returns per unit of risk than the portfolio of US stocks and US real estate (EF1) or a portfolio of US stocks, US real estate, and foreign stocks (EF2). The minimum variance portfolio of EF3 has a return of 0.884%, a standard deviation of 2.402%, and a Sharpe ratio of 0.190. It achieves a lower standard deviation than the minimum variance portfolios on either EF1 or EF2 (3.842% and 3.614%, respectively). The optimal portfolio on EF3 has a return of 1.199%, a standard deviation of 3.263%, and a Sharpe ratio of 0.236, which again betters that available from EF1 or EF2.
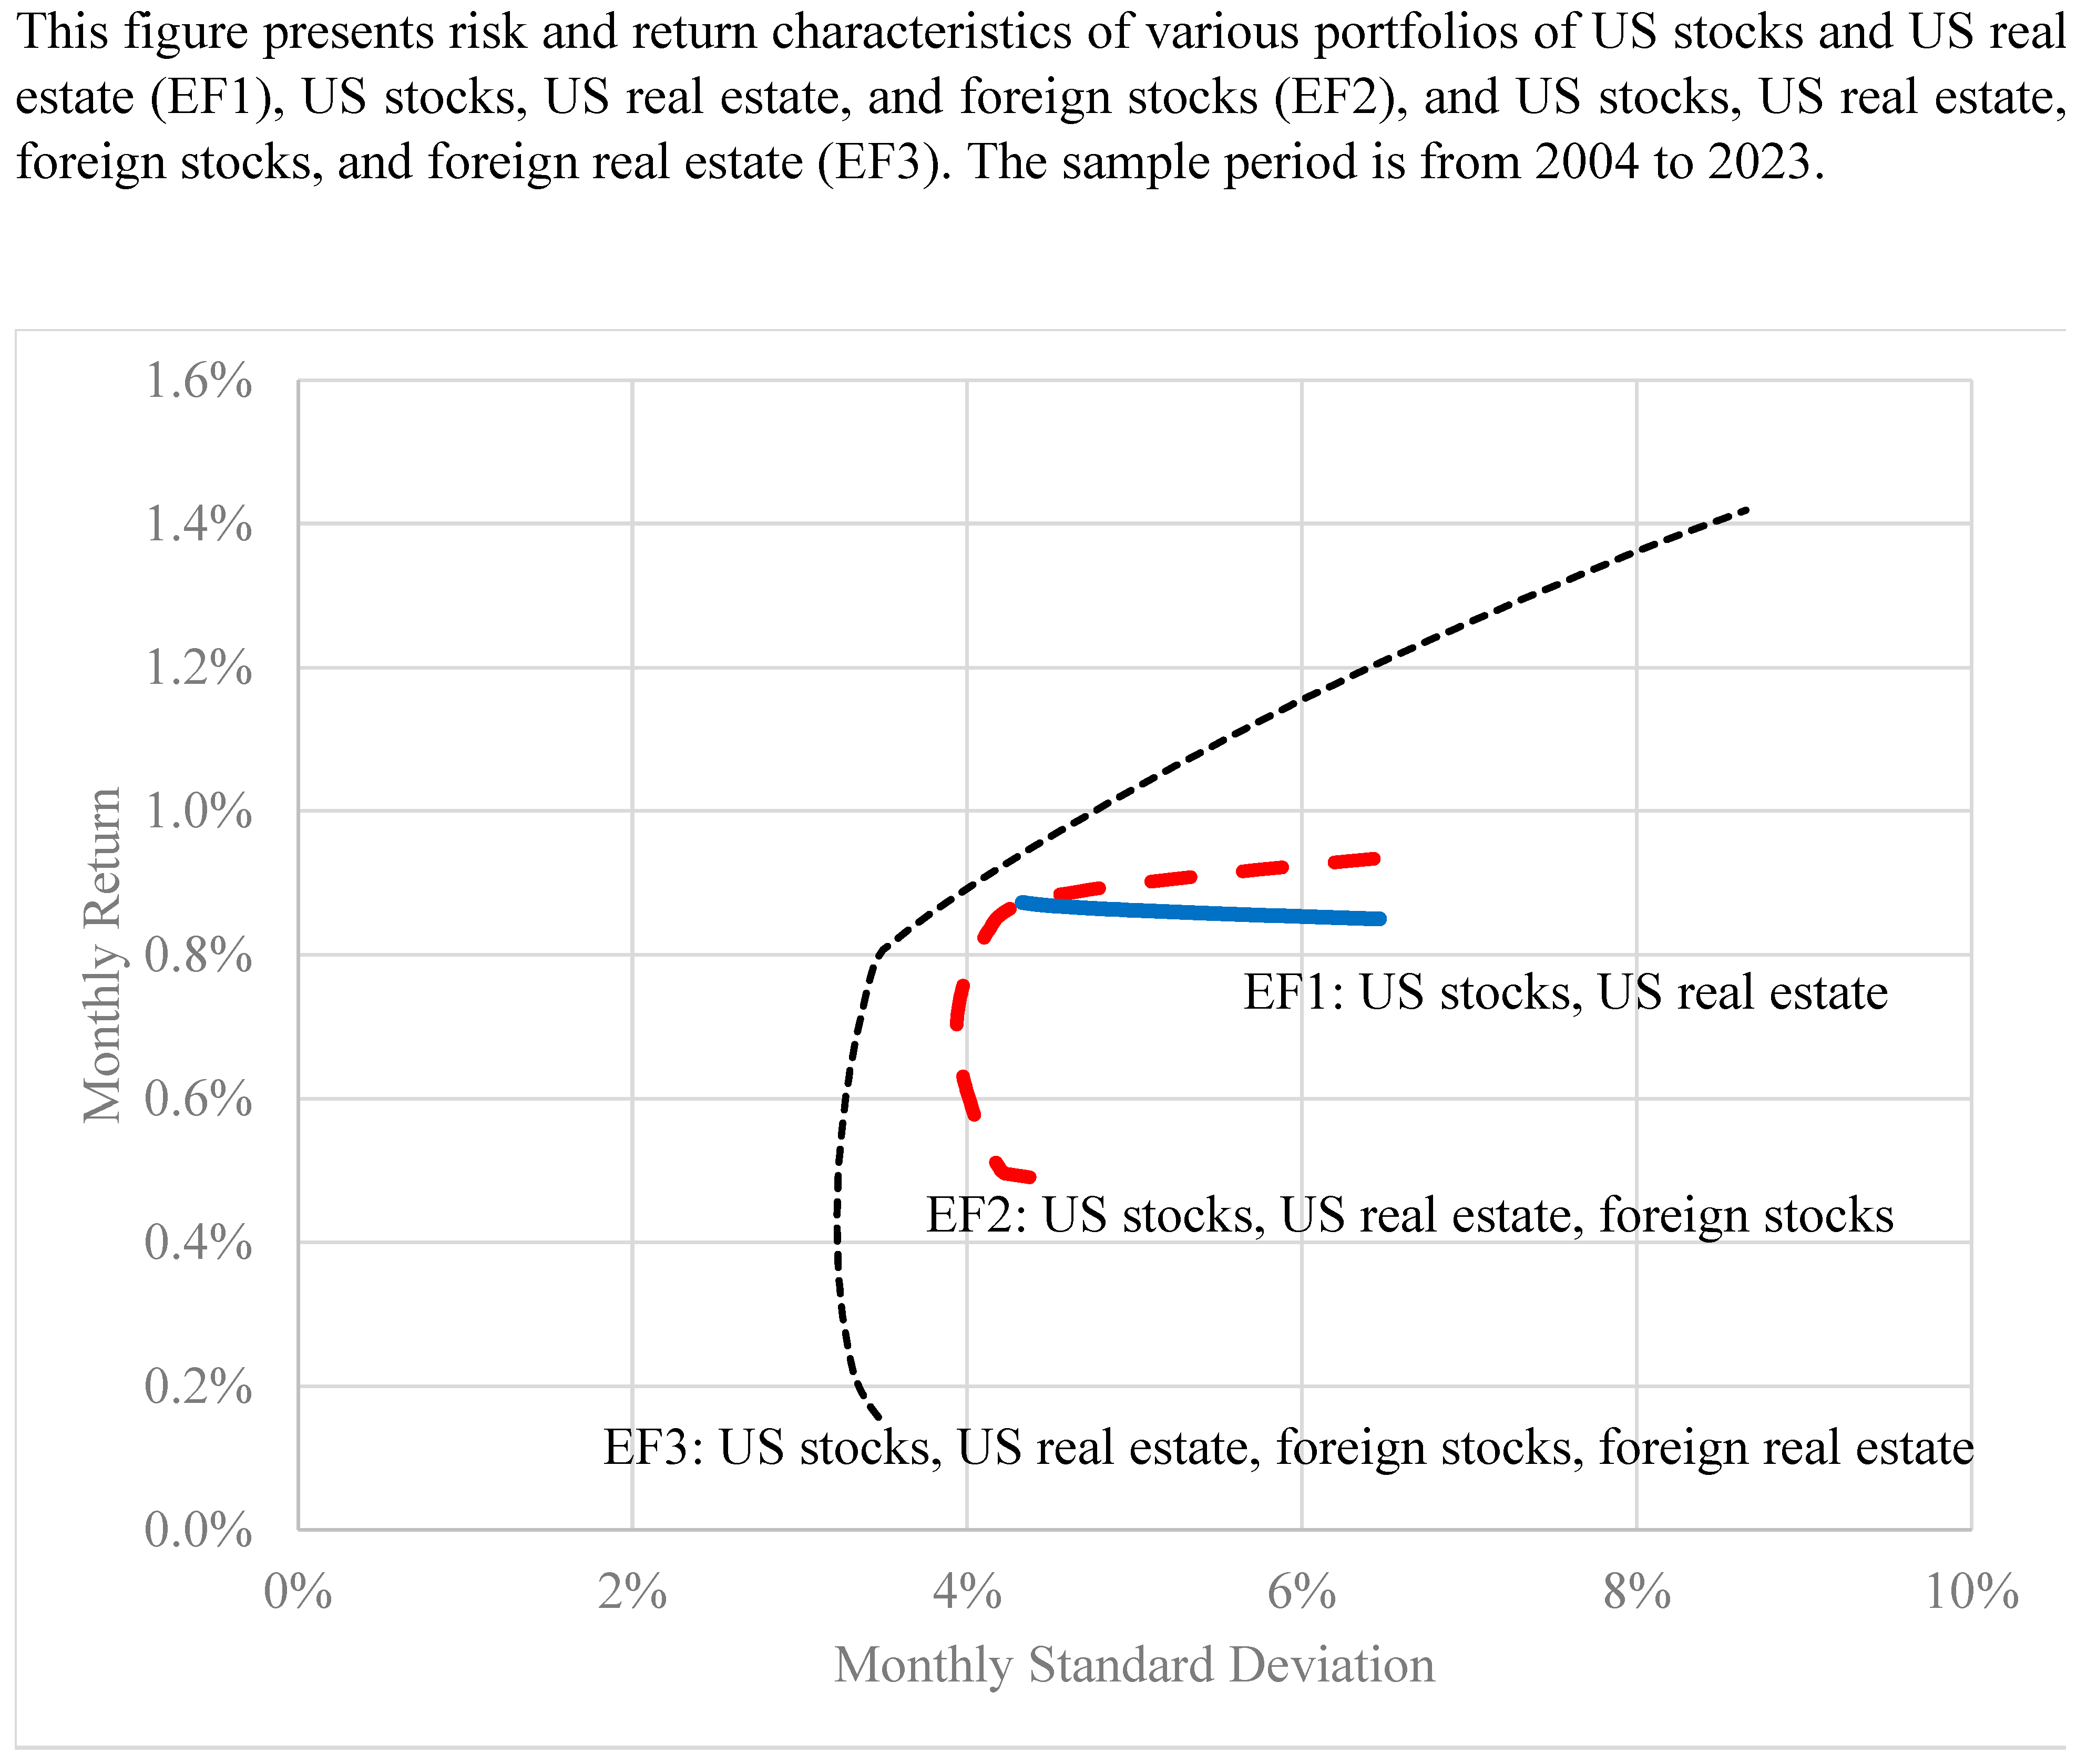
Figure 4 presents the efficient frontiers EF1, EF2, and EF3 for the latter half of the sample, from 2004 through to 2023. The differences between this period and the first half’s results presented in
Figure 3 are apparent. Indeed, EF3 again dominates both EF1 and EF2 by a sizable margin. Yet, the lowest achievable portfolio standard deviation on EF3 is 3.22%. This minimum variance portfolio has a lower average monthly return than that of the minimum variance portfolio on EF3 of
Figure 3 from the first half of the sample (0.432% vs. 0.884%), and a lower Sharpe ratio (0.099 vs. 0.190). The optimal portfolio on EF3 for the second half sample achieves a Sharpe ratio of 0.198. Notably, EF1 and EF2 overlap in this subsample period, implying that there are portfolios of US stocks and US real estate that have the same risk and return as portfolios of US stocks, US real estate, and foreign stocks. This is unsurprising given the substantially higher correlations between US and foreign stocks in the latter half of the sample (rising from 0.550 to 0.819).
In sum, the results in
Figure 4 indicate that the inclusion of foreign real estate allows for more risk and return possibilities and more efficient portfolios, even as financial market correlations have increased. There are only minor improvements in portfolio performance when adding foreign stocks to US stock and US real estate portfolios because foreign stocks mimic (are highly correlated with) US assets in this latter period. It is only by adding foreign real estate that a US investor experiences substantial improvements in portfolio efficiency.
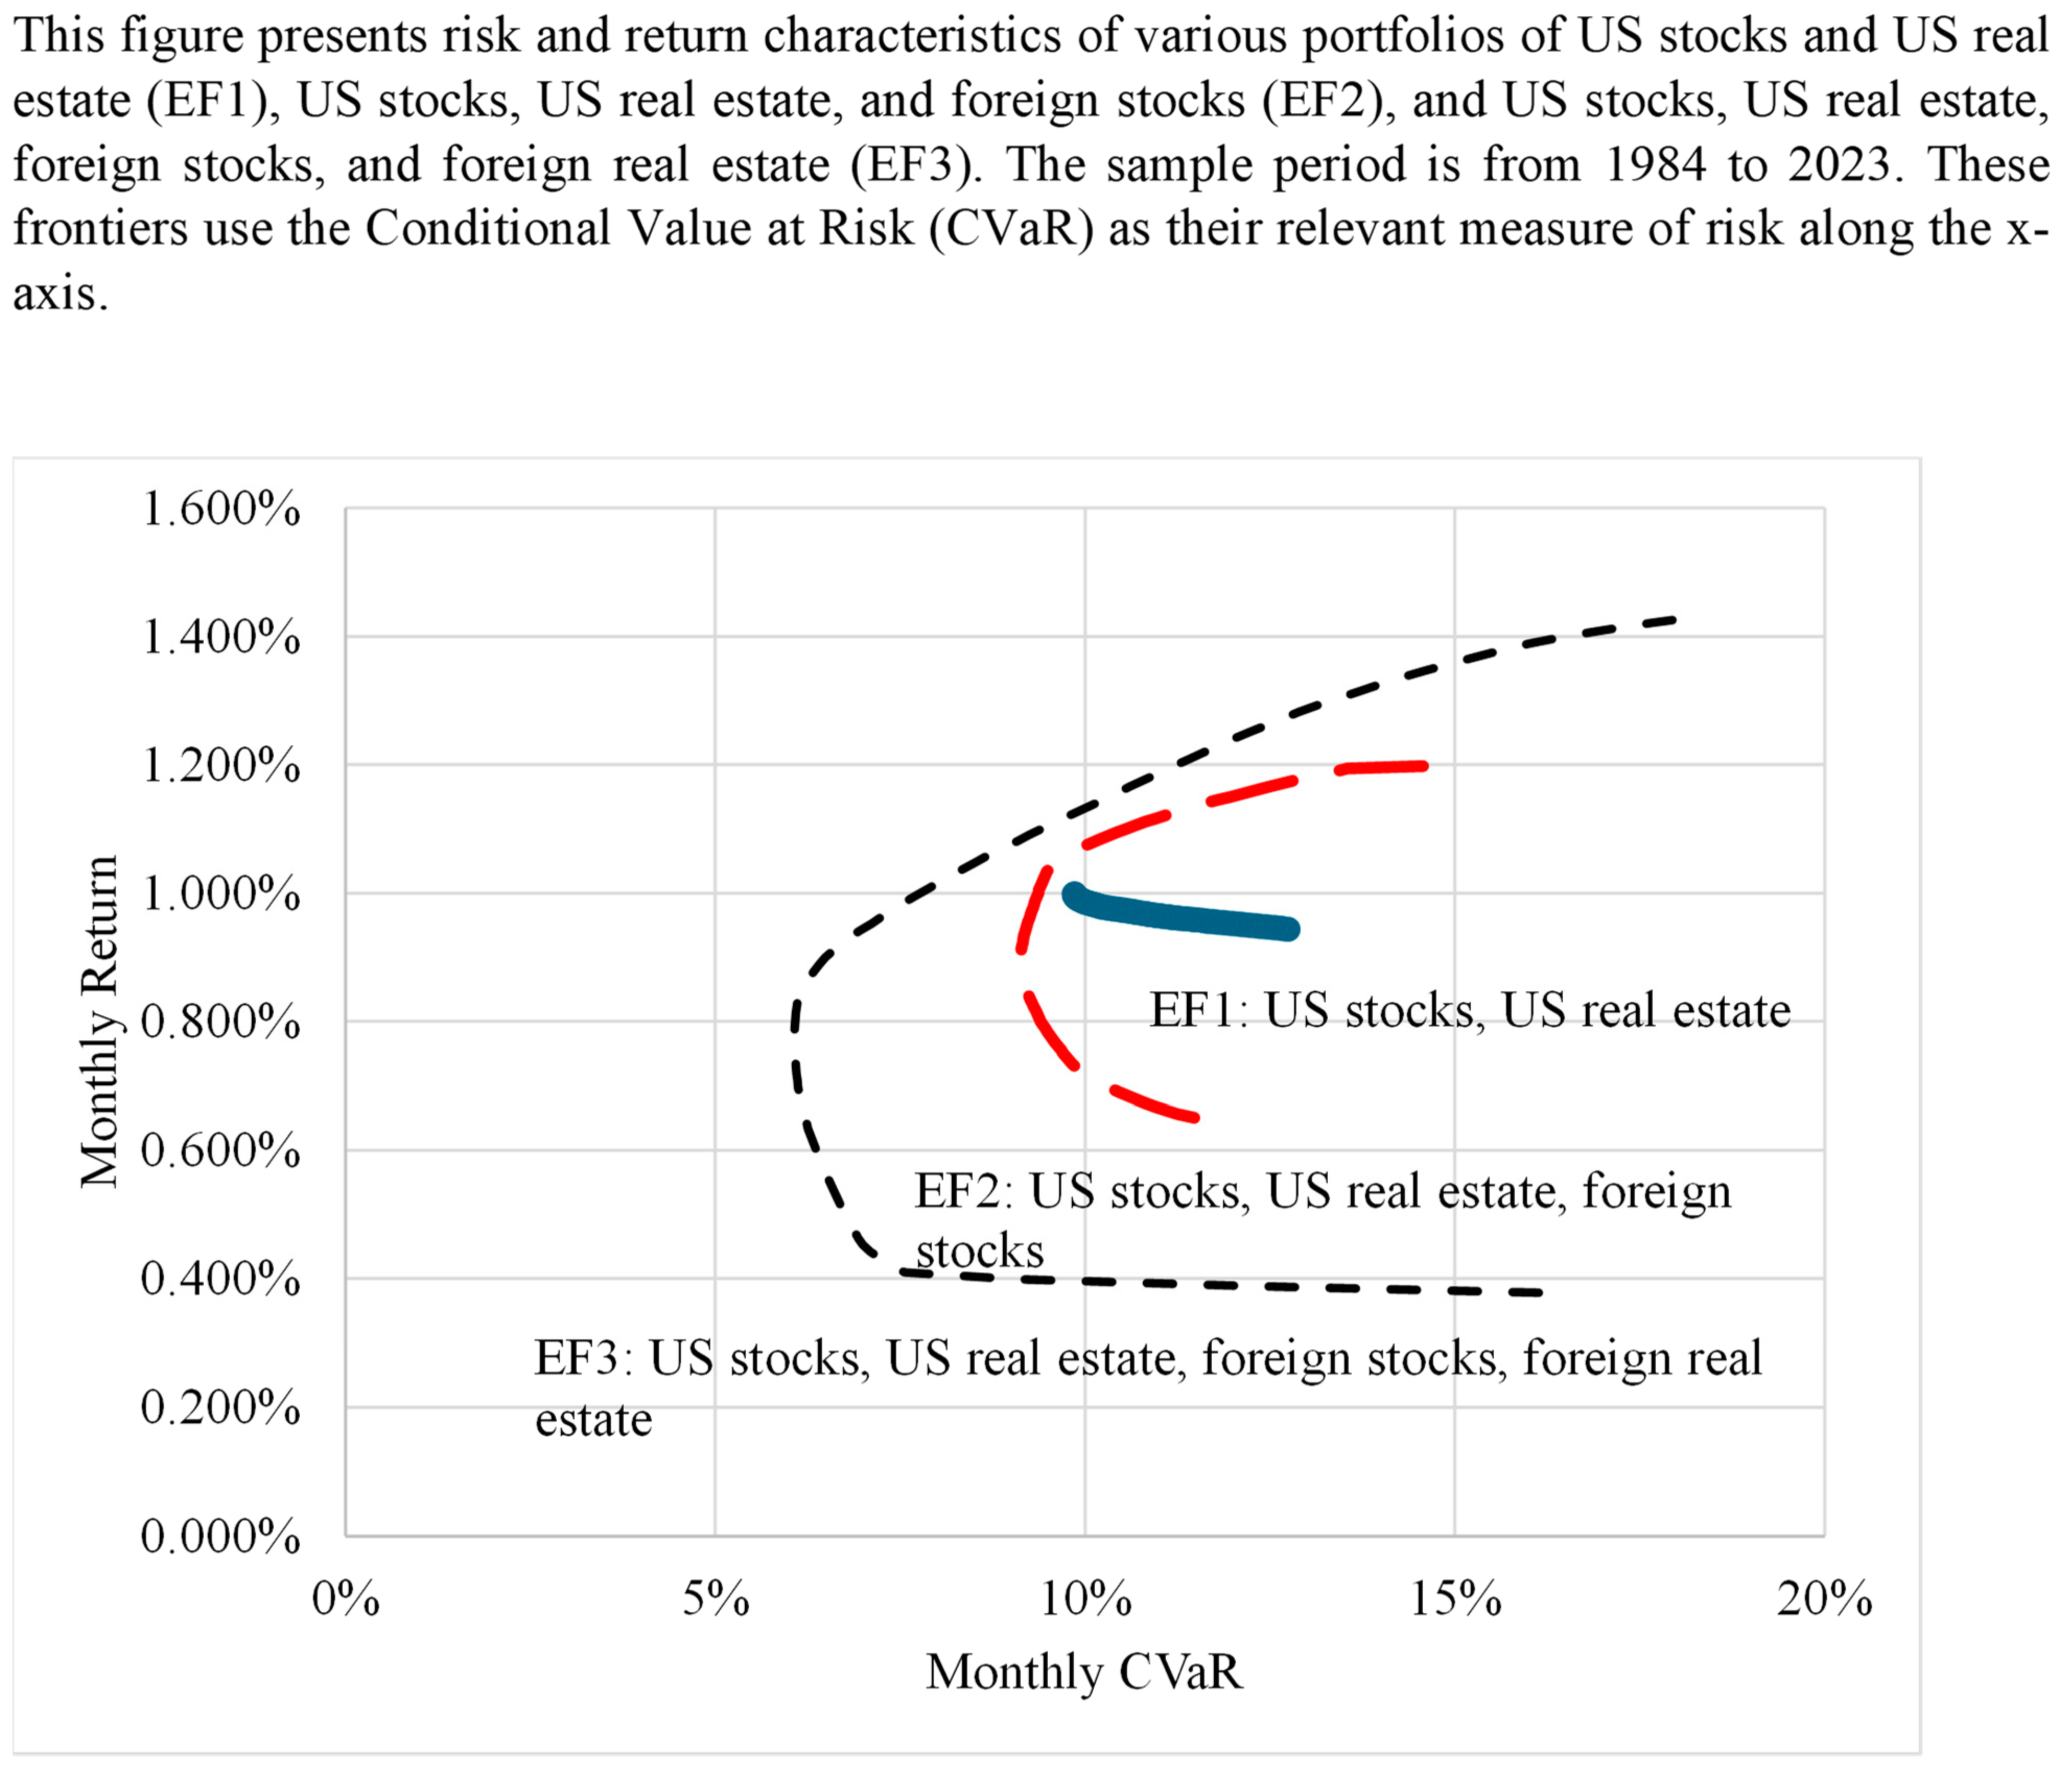
4.4. Robustness Analysis Using CVaR as a Measure of Risk
Rockafellar and Uryasev (
2000) used a portfolio optimization procedure that minimizes Conditional Value at Risk (CVaR) rather than portfolio standard deviation. As a robustness check, we employed this method of portfolio optimization to determine whether foreign real estate continues to offer the previously observed diversification benefit found in our mean-variance portfolio optimization. The CVaR is the average loss for a prespecified percentile of the left-hand side of a distribution, i.e., it is the average loss of the worst returns in a distribution. Common percentile choices range from 1% to 10%.
2 Several methods may be employed to compute CVaR, including Monte Carlo simulations and bootstrapping. We use the historical method by determining the average return for the lowest 5% of returns for our entire 40-year sample.
To construct our frontiers, we solved 100 equidistant returns as we did for the traditional mean-variance optimized frontier. However, rather than minimizing variance, we minimize the CVaR through changing portfolio weights. Each point on the frontier represents the minimum CVaR for a given return, determined by changing the asset weights in a portfolio. Our
Figure 5 presents these results. The
y-axis is the average of all returns for a portfolio and the
x-axis the average loss for the lowest 5% of returns.
Qualitatively, the results are similar to our previous findings using mean-variance optimization. Notably, EF3, which consists of US stocks, US real estate, foreign stocks, and foreign real estate is wider and to the northwest of either EF1 (consisting of US stocks and US real estate) and EF2 (consisting of US stocks, US real estate, and foreign stocks). The minimum CVaR portfolio of EF3 has a CVaR of 6.067%. In contrast, the EF1 and EF2 portfolios have minimum CVaRs of 9.855% and 9.136%, respectively. Thus, the addition of foreign real estate provides the opportunity to reduce the average loss in the tail of a distribution. This EF3 portfolio has multi-asset class exposure to the Americas, the Pacific, and Europe, consisting of 28.04% invested in US stocks, 1.69% in Hong Kong stocks, 1.41% in Japanese stocks, 15.39% in German real estate, and 53.47% in Swiss real estate. As a point of reference, we recall that the minimum variance portfolio on EF3 using the traditional mean-variance optimization in
Figure 2 had a similar asset allocation, with 31.72% in US stocks, 1.22% in Japanese stocks, 44.87% in German real estate, and 22.19% in Swiss real estate.
EF3 also exhibits higher returns. Assuming an investor specifies a CVaR of 15%, the inclusion of foreign real estate results in a monthly return of approximately 1.36%, as shown for EF3. For EF2, the return is 1.20% for that CVaR level. This monthly 16-basis-point difference is 1.92% annually (0.16% × 12). Note that the US-asset-only frontier of EF1 does not allow for this return when minimizing CVaR.
In sum, by using CVaR analysis we found that the addition of foreign real estate again provides diversification benefits to a portfolio. This is consistent with our previous analysis.
5. Conclusions
Early evidence indicated that international stock markets were characterized by low correlations, resulting in benefits from international diversification. However, over time these benefits have declined due to greater correlations between markets. Previous research differs on the efficacy of adding global real estate to investment portfolios. While previous research documented that, by itself, real estate underperformed the other assets, other research found that foreign real estate may provide greater diversification benefits due to its segmented nature, whereby returns are driven more by regional than global economic factors.
We used a recent 40-year dataset for US stocks, US real estate, 13 foreign stock markets, and 13 foreign real estate markets providing exposure to the Americas, European, Asian, and Pacific regions. Using this data, we assessed the long-term performance and diversification potential of foreign real estate. The average number of real estate companies across all foreign countries was 25, indicating that investors would have the ability to diversify both across and within most sample countries.
Our analysis reveals several key findings. First, by itself foreign real estate generally has modest risk and return but has lower correlations with US stocks. Comparing the correlations of the 13 foreign stock markets versus that of the 13 foreign real estate markets, foreign real estate has lower correlations with US stocks in all markets, with the difference in correlations often being quite substantial. Our subsequent efficient frontier analysis allows the US investor to take positions in the 13 foreign stock markets and 13 foreign real estate markets, rather than being limited to broad foreign indices, thereby utilizing the unique performance characteristics of each market.
Second, rolling correlations analysis reveals that foreign real estate is usually more segmented relative to foreign equity markets. Correlations have increased over time, especially for foreign stocks as global equity markets have become more integrated. Despite increasing correlations, foreign real estate markets are more frequently segmented than foreign stock markets in the most recent period, resulting in consistent diversification benefits from its inclusion.
Third, we use mean-variance efficient frontier analysis with three sets of assets: US stocks and real estate (EF1), US stocks, US real estate, and foreign stocks (EF2), and US stocks, US real estate, foreign stocks, and foreign real estate (EF3). The frontier that includes foreign real estate, EF3, consistently outperforms EF1 and EF2 in terms of risk reduction and return enhancement. EF3 portfolios have significant allocations to foreign real estate. Subperiod analysis further confirms the superiority of EF3, even in the latter half of the sample when there was increased integration of global financial markets.
We also utilized mean-CVaR efficient frontier analysis to determine if the addition of foreign real estate reduces the investor’s average loss during market downturns, for a given level of average portfolio return. We found that foreign real estate again improves the risk-return tradeoff for an investor, relative to a portfolio of US stocks, US real estate, and foreign stocks.
Overall, our results demonstrate the importance of including foreign real estate in US portfolios to optimize risk, return, and risk-adjusted returns. For individual investors, broad foreign real estate exposure is readily accessible through ETFs offered by Vanguard, Ishares, and other established fund companies. The results suggest that the sponsors of endowments, foundations, pension funds, and other institutional investors should consider foreign real estate, especially given these investors’ typically long horizon and the favorable long-term performance of foreign real estate.


