Abstract
How does stock overvaluation in secondary financial markets affect long-term firm performance when significant corporate “insiders” seek to realize self-benefit? Using a sample of Chinese listed companies from 2007 to 2018, we find that overvaluation of stock price has a negative impact on long-term firm performance. Moreover, our results show that management myopia mediates the relationship between stock overevaluation and long-term performance. Our study enriches the discussion of stock overvaluation and extends the management myopia literature by considering unique aspects of the irrational behavior of firm decision makers, providing implications for governments to improve their capital market reform and development.
1. Introduction
Promoting the reform of China’s registration-based IPO system and guiding the capital market to reasonable pricing are together a social-concern issue for guaranteeing the sustainable growth of capital market entities. Since the establishment of the China Securities Regulatory Commission (CSRC) in 1992, China has long practiced the approval-based system. IPO-waiting companies take considerable time to list because of the complex recommendation, selection, and approval processes by local authorities and the CSRC. The scarcity of IPOs has made China’s retail investors focus on chasing price trends in secondary markets, providing scholars with an ideal background for studying the economic consequences of stock overvaluation.
Existing research focuses primarily on how prices in primary markets affect firm performance. Owing to the phenomenon known as the “three highs” (high issue price, high P/E ratio, and high excess funds raised) in China’s IPO firms, overvalued equity directly increases the funds that firms raise and facilitates operating and investing activities (Cai et al. 2008; Chan et al. 2004; Li et al. 2018), yet few studies show concern about the real effect of secondary market prices. Some scholars have explored financing roles: stock overvaluation facilitates corporate equity mergers and acquisitions, expands firm size (Shleifer and Vishny 2003), and eases financing constraints (Campello and Graham 2013; Titman 2013); but Bond et al. (2012) have argued that there are three new mechanisms based on information roles—learning, incentive, and irrational behavior. Managers may learn from stock prices and use price information as an anchor for their actions. Surging prices may induce self-confidence and encourage irrational managers to take on more risky investments, which may result in unfavorable outcomes (Chen et al. 2007; Goldstein and Guembel 2008).
The purpose of our study is to draw on and extend Bond et al.’s (2012) research and analyze whether managerial myopia may explain long-term firm performance as a result of stock overvaluation. In the literature, managerial myopia refers to managers’ tendency to invest for short-term gains rather than long-term payoffs (Laverty 1996). As China has a more concentrated ownership structure, price changes tend to trigger myopia among core decision makers, which may have a profound effect on a firm’s sustainability when not properly addressed. To the best of our knowledge, few empirical studies have explored the role of managerial myopia within the context of stock overvaluation.
We select Chinese A-share listed companies from 2007 to 2018 to test our hypotheses. Empirical results show that stock overvaluation increases short-term performance but, overall, harms long-term performance. In addition, we test the mediating effect of managerial myopia, where stock overvaluation induces myopia behavior, resulting in a significant performance slump in the long run.
The contribution of this study is as follows. First, we investigate the long-term real effects of stock overvaluation in secondary markets. It is imperative that firms focus on the long run, which shows better capability in resisting environmental threats and achieving sustainable development (Cao et al. 2022; Rostami et al. 2022), and this supplements existing literature on firm performance. Second, based on the information role raised by Bond et al. (2012), this study considers equity sold by corporate insiders and slower R&D growth as new mediators, which is distinguished from previous research that mainly focuses on overinvestment. Third, our findings have implications for practice. Stock market bubbles occasionally occur across countries, destroying a firm’s intrinsic value and leading to economic chaos, such as the IT bubble in the United States in the early 2000s and the Chinese stock market crash in 2015. Policy makers should thus accelerate their reform of the registration system in the financial market, increase transparency of information disclosure, and strengthen internal firm governance to alleviate the phenomenon of stock overvaluation that may disrupt the capital market.
2. Literature Review and Hypothesis Development
2.1. Stock Overvaluation and Firm Performance
Stock overvaluation refers to the situation where the market price of a firm’s stock is higher than its intrinsic value (Fu et al. 2013). In other words, the stock is trading at a price not justified by the firm’s financial performance or future prospects. Several factors may contribute to stock overvaluation: investors are overly optimistic about the stock market, since they are influenced by market sentiment or have non-public information (Seybert and Yang 2012); market bubbles lead to the general overvaluation of stock prices (Dong et al. 2021); or market participants may push up the stock price by market manipulation (Fu et al. 2013).
To resolve the inconsistent findings on the dual effects of stock overvaluation in the literature (Campello and Graham 2013; Jensen 2005; Shleifer and Vishny 2003), we discuss the short- and long-term impacts of stock overvaluations on firm performance. In the short term, firms may perform better when the stock prices are overvalued. An overvalued stock price attracts more investors, increasing a firm’s market value and strengthening market position (Goldstein et al. 2013). The focal firms may also benefit from better financing opportunities, trading conditions, and greater market recognition as a result of stock overvaluation (Baker et al. 2003; Shleifer and Vishny 2003). In the long term, however, stock overvaluation overall indicates a negative performance impact. Investors may pursue overvalued stocks for short-term profits, pushing up stock prices, and this delivers favorable signals to the market. However, once large shareholders sell their stocks in quantities and show less concern about a firm’s future value (Brown and Cliff 2004), the stock price crashes. Moreover, managers face higher market expectations and assessment pressures when stock prices reach a peak (Goldstein et al. 2013). To maintain overvalued prices, managers may take risks to meet investors’ expectations, including overinvestment (Jensen 2005), earning management (Stein 1996), and excessive financial leverage (Bushee 1998). However, the waste and dispersion of resources can result in a decline in return on investment and damage to the firm’s competitiveness, thereby reducing its profitability in the long run (Moeller et al. 2005). Therefore, we propose the following hypothesis:
Hypothesis 1.
Stock overvaluation facilitates a firm’s short-term performance while hindering future performance in the long term.
2.2. The Mediating Role of Managerial Myopia
The concept of managerial myopia is argued by Laverty (1996) as “decision-making behavior that maximizes short-term profits, but not long-term profits” in discussing economic short-termism. Two mutually exclusive choices must be decided by managers under intertemporal circumstances: one leads to immediate private benefit in the short term with spending less effort, and the other may bring about more profit in the long run but requires more effort and patience in operating activities. Intuitively, managers are assumed to be entirely rational; they may also take speculative actions for short-term benefit to avoid future uncertainties.
When it comes to stock overvaluation, excessive rising prices allow for more rent-seeking opportunities for management. Bolton et al. (2006) demonstrated that, in a speculative market, managers try to sell overvalued stocks to realize private benefit when their compensation package includes large amounts of stocks. Even where managers are restricted from selling shares, they nonetheless care about the market price because their contracts are in some respects contingent on stock performance. Importantly, in developing economies, stock prices are pushed up by investors’ sentiment instead of a firm’s intrinsic value. Therefore, managers may lack incentives to invest in a firm’s long-run value, since stock prices are less correlated with future growth (Bond et al. 2012). Managers may even make efforts to push up stock price in the short term and create market liquidity by selling their own shares, at the cost of small and medium shareholders (Bolton et al. 2006; Edmans et al. 2017).
For example, LeEco, a Chinese conglomerate listed on the Shenzhen Stock Exchange in 2010, maintains businesses in video streaming, cloud services, and software development. China’s investors placed great expectations on LeEco, which set multiple records for being among the most valuable companies on the second-board market. However, Jia Yueting, the chairman of LeEco, insisted on selling his shares for more than CNY 14 billion (USD 2100 million), and showed no interest in the firm’s businesses. As a result, LeEco encountered severe financial difficulties due to poor management, and the market value dropped from USD 160 billion to USD 0.7 billion before finally going bankrupt in 2020 (Li and Li 2022).
Secondly, managers may intend to forgo long-term investment programs to maintain short-term stock prices. Managers may use the resources they have at their disposal and their personal authority to influence the size and manner of activities in which the firm invests (Stein 1989). Overvalued stocks tend to be subject to higher market expectations and shareholder pressure (Bolton et al. 2006). As a result, managers are more inclined to choose projects with short maturities and high returns when making investment decisions (Holmström 1999; Narayanan 1985). For long-term investments, approaches such as R&D are not the primary investment objectives of managers (Maritan 2001). Since R&D investment requires a large amount of capital on an ongoing basis, it puts pressure on managers’ performance appraisals and cash flow operations (Edmans et al. 2017). There is a high degree of risk and uncertainty as to whether R&D breakthroughs will be realized and translated into products and benefits (Bloom 2007). In addition, R&D benefits take a long time to materialize, and they are primarily intertemporal (Belderbos et al. 2015). As the Chinese proverb says, “A bird in the hand is worth two in the bush”, so that managers are more inclined to seize immediate benefits than rely on nebulous future gains. Therefore, we propose Hypothesis 2:
Hypothesis 2.
Stock overvaluation will lead to managerial myopia.
Managerial myopia is not exclusively determined by innate and stable personal characteristics; it is also influenced by the environment (Stein 1989). When the stock price is overvalued, myopia is an important feature of management in reducing their future efforts. Managers place short-term interests above long-term value by ignoring R&D growth, innovation capabilities, talent, market share, and long-term investment returns, and these responses are detrimental to the firm’s long-term performance (Bolton et al. 2006; Bond et al. 2012). Therefore, we propose Hypothesis 3:
Hypothesis 3.
Managerial myopia will mediate the relationship between stock overvaluation and long-term performance.
Our analytical framework is shown in Figure 1, which presents all the hypotheses.
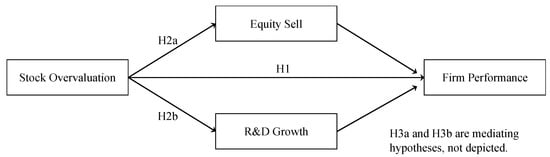
Figure 1.
Stock Overvaluation, Managerial Myopia, and Firm Performance.
3. Research Methodology
3.1. Data and Sample
To construct our sample, we started with A-share listed firms on China’s Shanghai and Shenzhen Stock Exchanges from 2007 to 2018. Data on stock price and firm fundamentals were derived from the CSMAR database. The following procedures were applied to ensure a representative sample: (1) excluding ST and ST* stocks, which indicate firms are under warnings of delisting; (2) removing firms belonging to the finance and insurance industries; and (3) excluding firms listed for less than one year. Continuous variables were winsorized at the 1st and 99th percentiles to mitigate the influence of extreme value. In total, we obtained a sample of 2444 firms and 16,458 firm-year observations.
3.2. Measures
Dependent variable. The dependent variable is the firm’s performance. Following Fairfield et al. (2003), Richardson et al. (2005), and Dechow et al. (2010), we measured the performance effect of overvalued equity on return-on-assets (ROA), which is calculated by a firm’s operating income deflated by contemporaneous average total assets. To emphasize our concerns for various time horizons, we regress explanatory variables on ROA in the next 1 to 3 years to study our hypotheses between the short term and the long run.
The independent variable is Stock Overvaluation. Rhodes-Kropf et al. (2005) argue that Tobin’s Q and market-to-book (M/B) ratio, which are commonly used in firm evaluation, fail to distinguish stock overvaluation from a firm’s future growth opportunities. Rhodes-Kropf et al. suggest decomposing the M/B ratio into two parts: (1) Stock Overvaluation, defined as the difference between the firm’s market value m and the estimated intrinsic value , where is calculated using a set of ordinary least squares (OLS) functions that incorporate firm size, leverage, net profit (ni), and an indicator (I) for negative net profit, and (2) Growth, measured as a firm’s estimated intrinsic value minus book value b, reflecting the firm’s future cashflow and growth potential. A large positive value of indicates that a firm i’s stock price is overall above its reasonable level in year t. The calculation process is shown in Equation (1):
where
In Equation (1), the subscripts i, t, and j denote the firm, year, and industry, respectively, with j representing the industry in which firm i operates. The market-to-book (M/B) ratio is directly retrieved from the CSMAR database, where M, B denote the firm’s market capitalization and firm’s book value, and the lowercase m, b stand for the logarithm value of M and B.
According to Rhodes-Kropf et al. (2005), the critical issue involves estimating the appropriate for each firm-year observation to break down M/B into Stock Overvaluation and Growth components. For each industry j, an OLS function with unique parameters should be estimated over the entire research period (i.e., 2007–2018 in this study). This function is designed to capture the specific relationship between a firm’s estimated intrinsic value , its size, leverage, and profitability within the focal industry. After calculating the numeric value of , Stock Overvaluation can be directly derived from Equation (1) as the difference between m and .
Mediators. We adopted Equity Sell and R&D Growth as mediators to proxy managerial myopia. First, in China’s context, stock holdings are highly concentrated among directors, supervisors, and senior executives (Lakonishok and Lee 2001), where large shareholders own more discourse rights in strategic areas, which is very different from western dispersed ownership structures. We therefore restricted equity selling behavior to significant corporate “insiders”, and this is calculated as shares sold by directors, supervisors, and senior management (who own more than 5% of the total shares of the firm) divided by the total shares in the focal year, denoted as Equity Sell. Second, followed Edmans et al. (2017), we also used annual growth rate of R&D expenditure (R&D Growth) to capture a firm’s capability and motivations to invest in long-term strategies.
Control variables. Consistent with existing studies, we controlled several firm-level characteristics, including Firm Size (the natural logarithm of a firm’s total assets), Leverage (a firm’s total debt divided by total assets), Age (number of years since the firm was listed), Institution Hold (the proportion of shares held by institutional investors), Top 1 (the proportion of shares held by the largest shareholder), State Hold (the proportion of shares held by state-owned entities), and Analyst Coverage (the number of analysts covering the focal stock divided by 100).
3.3. Statistical Model
We employ firm-level panel regressions to study the relationship between stock overvaluation and firm performance. Industry fixed effect () and year fixed effect () are both controlled in our analysis to mitigate unobserved heterogeneity within industries and years which may independently influence firm performance.
As depicted in Equation (2), the independent variable (Stock Overvaluation) is regressed on ROA over the next 1 to 3 years to explore the potential real effect of mispricing across different time horizons. The term represents the regression error. In line with Hypothesis 1, we focus on and expect in the short term (regressed on next-1-year ROA) and in the long term (regressed on next-3-year ROA):
To investigate the mediating role of Equity Sell and R&D Growth in the relationship between Stock Overvaluation and long-term ROA, we adopt the mediation analysis framework proposed by Baron and Kenny (1986), which involves testing a series of equations as shown in Equations (3)–(5).
First, we examine the effect of Stock Overvaluation on the proposed mediators, myopia levels, as indicated by equity sales and R&D investment through Equation (3). Consistent with Hypothesis 2, we posit , indicating that Stock Overvaluation is associated with higher levels of myopia.
Second, we assess the impact of the mediators (Myopia) on the dependent variable (ROA) by testing Equation (4). We anticipate , suggesting that higher levels of myopia, which are driven by increased Equity Sell and reduced R&D, are detrimental to firm performance.
Third, both the mediators (Myopia) and the independent variable (Stock Overvaluation) are included in Equation (5) to test the full model. According to Hypothesis 3, we expect , the coefficient for stock overvaluation in the presence of mediators, to be still significant but smaller than , indicating the impact of stock overvaluation on long-term ROA is partially mediated by the level of myopia.
4. Results
Table 1 reports the summary statistics of the variables and their correlations. Variance inflation factors (VIFs) of independent variables ranged from 1.49 to 2.33 and are well below the cutoff of 10, indicating that multicollinearity is not a major concern. The main regressions are presented in Table 2 and Table 3.

Table 1.
Descriptive Statistics and Correlations.
Table 2.
Stock Overvaluation and Firm Performance (N = 16,458).
Table 3.
The Mediating Effect of Managerial Myopia (N = 16,458).
Hypothesis 1 predicts that overvalued equity will have a positive performance effect in the short term and a negative effect in the long term. Models 1 and 3 in Table 2 show that the coefficient of stock overvaluation on immediate performance (ROAt+1) is positive (β = 0.0040, p < 0.01), while that on long-run performance (ROAt+3) is significantly negative (β = −0.0047, p < 0.01). This signifies that, as stock overvaluation increases by one standard deviation, the firm’s next-period and next-three-period ROA change by +0.179% and −0.211%, respectively. Hypothesis 1 is thus supported.
Hypothesis 2 predicts that overvalued equity leads to managerial myopia, where we should observe more equity sold by significant corporate insiders and lower growth rates in long-term R&D when stock overvaluation is high. As our results in Models 1 and 4 in Table 3 show, the coefficient of stock overvaluation on equity sell is significantly positive (β = 0.0008, p < 0.01), and that on R&D growth is significantly negative (β = −0.0747, p < 0.05). This reveals that a one standard deviation increase in stock overvaluation will increase equity sell by 0.036% of a firm’s total shares and decrease R&D growth by 3.35%. Hypothesis 2 is thus supported.
Hypothesis 3 states that managerial myopia mediates the relationship between stock overvaluation and long-run firm performance. Models 2 and 5 in Table 3 support that equity sell overall frustrates long-term performance (β = −0.1579, p < 0.01), and greater investment in R&D accelerates long-term performance (β = 0.0021, p < 0.01). Models 3 and 6 test the mediating effect. Both mediators pass the Sobel test at the 5% significance level, and the proportions of total effect mediated by equity sell and R&D growth are 8.5% and 14.26%, respectively. Hypothesis 3 is thus supported.
Robustness Test
We conducted several additional analyses to ensure the robustness of our findings. First, we used Return-on-Equity (ROE) to proxy firm performance and found that the results remain robust (Appendix A.1). Second, we employed two additional measures to proxy for managerial myopia. Following Zhao et al. (2012), we calculated the level of Earnings Management by applying the modified Jones model (Appendix A.2).
is the total accrued profit; is the total assets at the end of period t − 1; is the change in main business income from period t to period t − 1; is the change in accounts receivable from period t to period t − 1; is the original value of fixed assets at the end of period t. The absolute value of the residuals from the equation was taken as an indicator of managerial myopia. The higher the level of earnings management, the more management tends to embellish financial statements through operational manipulations, indicating an increase in managerial myopia. The results indicated that stock overvaluation significantly increased the level of earnings management, and the increase in earnings management reduced long-term performance, and the mediating effect was also verified. In addition, we applied Capital Expenditure (CAPEX) as a proxy for managerial myopia (Appendix A.3), calculated as the net cash outflow from the acquisition of fixed assets, intangible assets, and long-term assets minus the cash inflow from the disposal of these assets, divided by total assets. According to Laverty (1996), managerial myopia might have positive correlations with capital expenditure. However, the results show that the relationship between stock overvaluation and capital expenditure is not significant.
Third, we ran regressions without adding any fixed effect (Appendix A.4). The results that remain unchanged are presented in Appendix A.5. In addition, we controlled the firm fixed effect instead of the industry fixed effect in the regression (Appendix A.5). Similar results were obtained as those obtained in the main analyses. Fourth, we added additional control variables (Appendix A.6). Cash Flow represents the firm’s cash holdings, calculated as cash reserves divided by total assets. Duality indicates the combined role of CEO and chairman. These two variables were selected because they respectively represented the firm’s financial robustness and corporate governance structure, both of which had significant impacts on the long-term performance of the company. After incorporating these control variables, both the base regression results and the tests for mediating effects remained significant.
Fifth, we conducted heterogeneity tests using sales growth as a grouping criterion (Appendix A.7). Based on the sales growth median, listed firms were divided into high-growth and low-growth groups. The results indicated that for low-growth listed firms, if the stock price was overvalued by the market, managerial myopia became more pronounced (higher equity sales, lower R&D investment). Correspondingly, stock overvaluation had a more severe impact on these firms’ long-term performance. It may be necessary for regulatory authorities to pay closer attention to the issue of stock overvaluation in low-growth firms.
Sixth, we examined the interaction terms between Institutional Holding, Block Holding, and SOE Holding with stock overvaluation (Appendix A.8). Only SOE holding was found to inhibit equity sell in the context of stock overvaluation. Similarly, we used SOE as a moderator and found that SOE weakens the relationship between stock overvaluation and firm long-term performance (Appendix A.9). We also find that, when stocks are overvalued, equity selling behavior within SOEs is significantly lower than in non-SOEs. This may be due to the fact that the internal control process of SOEs is more stringent and standardized in the Chinese context, and this has a dampening effect on managerial myopia.
Finally, to further check the robustness of our results, we constructed an instrument variable (IV) to verify our hypotheses (Appendix A.10). We calculate the average level of stock overvaluation within the same industry for a given fiscal year, and we apply this average value as the instrument variable of stock overvaluation. The results remain robust.
5. Discussion
In this paper, we investigate the negative impact of stock overvaluation on firm long-term performance from the perspective of managerial myopia. When the stock price is overvalued, managers may reduce their holdings excessively to obtain a large cash gain directly, and, after the reduction, they care less about the firm’s operations and are unwilling to put in more effort to push up the firm’s future long-term value. In addition, they may neglect projects that are beneficial to the firm’s long-term development, such as R&D growth, while choosing to achieve short-term profits by maintaining an overvalued stock price.
Our results provide evidence that erroneous price signals in the secondary market can affect the motives and decisions of managers, which in turn affects the firm’s real operations. This paper considers the characteristics of China’s capital market and extends the research related to how the capital market affects the real economy, based on the construction of theoretical models and empirical tests. Unlike those studies based on financing channels in the existing literature, this paper investigates how stock overvaluation may distort the motivation and willingness of managers, which in turn affects corporate decision making, which is more in line with the background of the more stringent equity financing system of China’s capital market. The theoretical model and empirical evidence in this paper enrich the literature on managerial myopia and the research on the irrational decision-making effect of stock overvaluation.
This paper also has important practical significance. China’s President Xi has emphasized the importance of capital market development and reform in serving the real economy. This paper provides strong evidence supporting the conclusion that the capital market reforms implemented under President Xi’s leadership and the Party Central Committee are extremely important for the development of the real economy. These reforms include adhering to capital market reforms, strengthening information disclosure, improving pricing efficiency, and further improving the rules for reducing holdings.
Author Contributions
Conceptualization, J.S., L.W. and Y.S.; methodology, L.W.; software, L.W.; validation, S.W. and Y.S.; formal analysis, L.W.; writing—original draft preparation, J.S. and L.W.; writing—review and editing, Y.S.; supervision, S.W. All authors have read and agreed to the published version of the manuscript.
Funding
We are grateful for the financial support from National Natural Science Foundation of China (NSFC) (72372119).
Data Availability Statement
The database utilized for this research was sourced from the China Stock Market & Accounting Research (CSMAR) platform, accessible at https://data.csmar.com/, accessed on 30 March 2024.
Conflicts of Interest
Luyu Wang is employed by the company China UnionPay. The remaining authors declare that the research was conducted in the absence of any commercial or financial relationships that could be construed as a potential conflict of interest. The views expressed in this article are solely those of the author and do not represent the views of the institution/organization to which Luyu Wang is affiliated.
Appendix A. Robustness Check
Appendix A.1. Using ROE Instead of ROA
| Model 1 | Model 2 | Model 3 | |
|---|---|---|---|
| ROEt+1 | ROEt+2 | ROEt+3 | |
| Stock Overvaluation | −0.0029 | −0.0022 | −0.0155 *** |
| (0.0034) | (0.0032) | (0.0037) | |
| Firm Size | 0.0029 ** | 0.0011 | −0.0007 |
| (0.0013) | (0.0013) | (0.0013) | |
| Leverage | −0.0676 *** | −0.0464 *** | −0.0479 *** |
| (0.0078) | (0.0072) | (0.0075) | |
| List Age | 0.0001 | 0.0002 | 0.0007 *** |
| (0.0002) | (0.0002) | (0.0002) | |
| Institution Hold | 0.2272 *** | 0.1937 *** | 0.1389 *** |
| (0.0132) | (0.0131) | (0.0144) | |
| Top 1 Hold | 0.0884 *** | 0.0812 *** | 0.0905 *** |
| (0.0070) | (0.0068) | (0.0077) | |
| State Hold | −0.0211 *** | −0.0183 *** | −0.0095 * |
| (0.0052) | (0.0051) | (0.0055) | |
| Analyst Coverage | 0.2752 *** | 0.2151 *** | 0.2158 *** |
| (0.0129) | (0.0131) | (0.0152) | |
| Constant | −0.0775 ** | −0.0219 | 0.0398 |
| (0.0303) | (0.0287) | (0.0308) | |
| R2 | 0.151 | 0.112 | 0.087 |
Notes: Robust standard errors in parentheses; *** p < 0.01, ** p < 0.05, * p < 0.1. Industry and year dummy added. N = 16,458.
Appendix A.2. Using Earning Management as a Proxy for Myopia
| Model 1 | Model 2 | Model 3 | |
|---|---|---|---|
| Earning Management | ROAt+3 | ROAt+3 | |
| Stock Overvaluation | 0.0070 *** | −0.0060 *** | |
| (0.0015) | (0.0016) | ||
| Earning Management | −0.0163 * | −0.0149 * | |
| (0.0087) | (0.0087) | ||
| Firm Size | −0.0057 *** | −0.0017 *** | −0.0018 *** |
| (0.0006) | (0.0006) | (0.0006) | |
| Leverage | 0.0388 *** | −0.0538 *** | −0.0539 *** |
| (0.0031) | (0.0033) | (0.0032) | |
| List Age | 0.0002 ** | 0.0005 *** | 0.0005 *** |
| (0.0001) | (0.0001) | (0.0001) | |
| Institution Hold | 0.0058 | 0.0590 *** | 0.0647 *** |
| (0.0071) | (0.0065) | (0.0067) | |
| Top 1 Hold | 0.0101 *** | 0.0412 *** | 0.0426 *** |
| (0.0037) | (0.0035) | (0.0035) | |
| State Hold | −0.0129 *** | −0.0018 | −0.0019 |
| (0.0027) | (0.0024) | (0.0024) | |
| Analyst Coverage | 0.0108 | 0.1117 *** | 0.1172 *** |
| (0.0071) | (0.0068) | (0.0069) | |
| Constant | 0.1700 *** | 0.0702 *** | 0.0741 *** |
| (0.0129) | (0.0131) | (0.0131) | |
| R2 | 0.089 | 0.139 | 0.140 |
Notes: Robust standard errors in parentheses; *** p < 0.01, ** p < 0.05, * p < 0.1. Industry and year dummy added. N = 16,458.
Appendix A.3. Using Capital Expenditure as a Proxy for Myopia
| Model 1 | Model 2 | Model 3 | |
|---|---|---|---|
| CAPEXt+3 | ROAt+3 | ROAt+3 | |
| Stock Overvaluation | −0.0001 | −0.0047 *** | |
| (0.0010) | (0.0016) | ||
| CAPEX | 0.0829 *** | 0.0829 *** | |
| (0.0108) | (0.0108) | ||
| Firm Size | −0.0006 | −0.0017 *** | −0.0020 *** |
| (0.0004) | (0.0005) | (0.0005) | |
| Leverage | −0.0004 | −0.0533 *** | −0.0532 *** |
| (0.0020) | (0.0030) | (0.0031) | |
| List Age | −0.0007 *** | 0.0005 *** | 0.0005 *** |
| (0.0001) | (0.0001) | (0.0001) | |
| Institution Hold | 0.0384 *** | 0.0572 *** | 0.0614 *** |
| (0.0050) | (0.0064) | (0.0066) | |
| Top 1 Hold | 0.0017 | 0.0426 *** | 0.0436 *** |
| (0.0026) | (0.0034) | (0.0034) | |
| State Hold | −0.0067 *** | −0.0019 | −0.0019 |
| (0.0017) | (0.0023) | (0.0023) | |
| Analyst Coverage | 0.0402 *** | 0.1103 *** | 0.1152 *** |
| (0.0051) | (0.0067) | (0.0068) | |
| Constant | 0.0581 *** | 0.0662 *** | 0.0715 *** |
| (0.0084) | (0.0123) | (0.0123) | |
| R2 | 0.164 | 0.139 | 0.140 |
Notes: Robust standard errors in parentheses; *** p < 0.01. Industry and year dummy added. N = 16,458.
Appendix A.4. Regressions with No Fixed Effect
| Model 1 | Model 2 | Model 3 | |
|---|---|---|---|
| Equity Sell | ROAt+3 | ROAt+3 | |
| Stock Overvaluation | 0.0013 *** | −0.0055 *** | |
| (0.0002) | (0.0013) | ||
| Equity Sell | −0.2016 *** | −0.1841 *** | |
| (0.0539) | (0.0537) | ||
| Firm Size | 0.0001 ** | −0.0029 *** | −0.0029 *** |
| (0.0000) | (0.0005) | (0.0005) | |
| Leverage | −0.0019 *** | −0.0513 *** | −0.0519 *** |
| (0.0003) | (0.0028) | (0.0028) | |
| List Age | −0.0002 *** | 0.0004 *** | 0.0005 *** |
| (0.0000) | (0.0001) | (0.0001) | |
| Institution Hold | −0.0008 | 0.0762 *** | 0.0836 *** |
| (0.0009) | (0.0065) | (0.0067) | |
| Top 1 Hold | −0.0028 *** | 0.0421 *** | 0.0434 *** |
| (0.0005) | (0.0034) | (0.0035) | |
| State Hold | −0.0030 *** | 0.0022 | 0.0017 |
| (0.0002) | (0.0022) | (0.0022) | |
| Analyst Coverage | −0.0037 *** | 0.1035 *** | 0.1052 *** |
| (0.0009) | (0.0065) | (0.0065) | |
| Constant | 0.0043 *** | 0.0856 *** | 0.0845 *** |
| (0.0010) | (0.0094) | (0.0095) | |
| R2 | 0.046 | 0.089 | 0.091 |
Notes: Robust standard errors in parentheses; *** p < 0.01, ** p < 0.05. Industry and year dummy added. N = 16,458.
Appendix A.5. Using Firm Fixed Effect Instead of Industry Fixed Effect
| Model 1 | Model 2 | Model 3 | Model 4 | Model 5 | |
|---|---|---|---|---|---|
| ROAt+1 | ROAt+2 | ROAt+3 | Equity Sell | R&D Growtht+3 | |
| Stock Overvaluation | 0.0119 *** | 0.0050 *** | −0.0071 *** | 0.0011 *** | −0.0849 |
| (0.0021) | (0.0019) | (0.0023) | (0.0003) | (0.0555) | |
| Firm Size | −0.0087 *** | −0.0160 *** | −0.0230 *** | 0.0001 | −0.1437 *** |
| (0.0018) | (0.0017) | (0.0017) | (0.0001) | (0.0380) | |
| Leverage | −0.0177 ** | 0.0114 * | 0.0288 *** | 0.0034 *** | 0.3605 *** |
| (0.0069) | (0.0062) | (0.0065) | (0.0006) | (0.1359) | |
| List Age | −0.0120 | 0.0757 ** | 0.0671 | 0.0004 | 0.1382 |
| (0.0117) | (0.0355) | (0.0574) | (0.0003) | (0.0919) | |
| Institution Hold | 0.0755 *** | 0.0628 *** | 0.0260 *** | 0.0015 | 0.8191 *** |
| (0.0079) | (0.0075) | (0.0086) | (0.0012) | (0.2348) | |
| Top 1 Hold | 0.0582 *** | 0.0518 *** | 0.0661 *** | −0.0106 *** | 0.2233 |
| (0.0107) | (0.0099) | (0.0116) | (0.0016) | (0.2637) | |
| State Hold | 0.0035 | 0.0053 | 0.0062 | 0.0015 *** | −0.0602 |
| (0.0052) | (0.0045) | (0.0046) | (0.0003) | (0.1619) | |
| Analyst Coverage | 0.0582 *** | −0.0016 | −0.0263 *** | −0.0020 | 0.0696 |
| (0.0084) | (0.0077) | (0.0093) | (0.0014) | (0.2578) | |
| Constant | 0.2499 *** | −0.0268 | 0.1663 | 0.0002 | 2.8558 *** |
| (0.0684) | (0.1777) | (0.2830) | (0.0029) | (0.8703) | |
| R2 | 0.061 | 0.046 | 0.061 | 0.024 | 0.019 |
Notes: Robust standard errors in parentheses; *** p < 0.01, ** p < 0.05, * p < 0.1. Firm and year dummy added. N = 16,458.
Appendix A.6
Appendix A.6.1. Adding Cash Flow and Duality as Control Variables for the Main Regression
| Model 1 | Model 2 | Model 3 | |
|---|---|---|---|
| ROAt+1 | ROAt+2 | ROAt+3 | |
| Stock Overvaluation | 0.0040 *** | 0.0010 | −0.0046 *** |
| (0.0014) | (0.0014) | (0.0016) | |
| Firm Size | −0.0003 | −0.0010 ** | −0.0018 *** |
| (0.0005) | (0.0005) | (0.0005) | |
| Leverage | −0.0595 *** | −0.0481 *** | −0.0411 *** |
| (0.0031) | (0.0031) | (0.0033) | |
| List Age | 0.0001 | 0.0002 *** | 0.0005 *** |
| (0.0001) | (0.0001) | (0.0001) | |
| Institution Hold | 0.0962 *** | 0.0840 *** | 0.0596 *** |
| (0.0057) | (0.0058) | (0.0066) | |
| Top 1 Hold | 0.0390 *** | 0.0374 *** | 0.0425 *** |
| (0.0030) | (0.0031) | (0.0035) | |
| State Hold | −0.0098 *** | −0.0077 *** | −0.0041 * |
| (0.0022) | (0.0022) | (0.0024) | |
| Analyst Coverage | 0.1460 *** | 0.1183 *** | 0.1133 *** |
| (0.0059) | (0.0060) | (0.0068) | |
| Cash Flow | 0.0515 *** | 0.0485 *** | 0.0466 *** |
| (0.0037) | (0.0037) | (0.0042) | |
| Duality | −0.0026 ** | −0.0012 | −0.0021 * |
| (0.0010) | (0.0010) | (0.0012) | |
| Constant | 0.0120 | 0.0316 *** | 0.0591 *** |
| (0.0122) | (0.0117) | (0.0123) | |
| R2 | 0.265 | 0.200 | 0.143 |
Notes: Robust standard errors in parentheses; *** p < 0.01, ** p < 0.05, * p < 0.1. Firm and year dummy added. N = 16,458.
Appendix A.6.2. Adding Cash Flow and Duality as Control Variables for the Mediation Test
| Model 1 | Model 2 | Model 3 | Model 4 | Model 5 | Model 6 | |
|---|---|---|---|---|---|---|
| Equity Sell | ROAt+3 | ROAt+3 | R&D Growth | ROAt+3 | ROAt+3 | |
| Stock Overvaluation | 0.0009 *** | −0.0045 *** | −0.0680 ** | −0.0045 *** | ||
| (0.0002) | (0.0016) | (0.0314) | (0.0016) | |||
| Equity Sell | −0.1303 ** | −0.1243 ** | ||||
| (0.0538) | (0.0538) | |||||
| R&D Growth | 0.0021 *** | 0.0021 *** | ||||
| (0.0003) | (0.0003) | |||||
| Firm Size | −0.0002 *** | −0.0017 *** | −0.0019 *** | 0.0087 | −0.0016 *** | −0.0019 *** |
| (0.0001) | (0.0005) | (0.0005) | (0.0135) | (0.0005) | (0.0005) | |
| Leverage | −0.0016 *** | −0.0415 *** | −0.0413 *** | 0.1938 *** | −0.0417 *** | −0.0415 *** |
| (0.0004) | (0.0033) | (0.0033) | (0.0736) | (0.0033) | (0.0033) | |
| List Age | −0.0002 *** | 0.0004 *** | 0.0004 *** | −0.0085 *** | 0.0005 *** | 0.0005 *** |
| (0.0000) | (0.0001) | (0.0001) | (0.0022) | (0.0001) | (0.0001) | |
| Institution Hold | 0.0007 | 0.0556 *** | 0.0597 *** | 0.7343 *** | 0.0540 *** | 0.0580 *** |
| (0.0009) | (0.0064) | (0.0066) | (0.1715) | (0.0064) | (0.0066) | |
| Top 1 Hold | −0.0028 *** | 0.0412 *** | 0.0422 *** | 0.1143 | 0.0413 *** | 0.0423 *** |
| (0.0005) | (0.0034) | (0.0035) | (0.0896) | (0.0034) | (0.0035) | |
| State Hold | −0.0017 *** | −0.0042 * | −0.0043 * | 0.0198 | −0.0040 * | −0.0041 * |
| (0.0002) | (0.0024) | (0.0024) | (0.0668) | (0.0024) | (0.0024) | |
| Analyst Coverage | −0.0013 | 0.1085 *** | 0.1132 *** | −0.1448 | 0.1090 *** | 0.1136 *** |
| (0.0010) | (0.0067) | (0.0068) | (0.1639) | (0.0067) | (0.0068) | |
| Cash Flow | −0.0040 *** | 0.0456 *** | 0.0461 *** | −0.0896 | 0.0463 *** | 0.0468 *** |
| (0.0007) | (0.0042) | (0.0042) | (0.0945) | (0.0042) | (0.0042) | |
| Duality | 0.0000 | −0.0022 * | −0.0021 * | −0.0267 | −0.0022 * | −0.0021 * |
| (0.0002) | (0.0012) | (0.0012) | (0.0262) | (0.0012) | (0.0012) | |
| Constant | 0.0089 *** | 0.0555 *** | 0.0602 *** | 0.4811 | 0.0533 *** | 0.0581 *** |
| (0.0013) | (0.0124) | (0.0123) | (0.2933) | (0.0123) | (0.0123) | |
| R2 | 0.074 | 0.143 | 0.143 | 0.091 | 0.145 | 0.145 |
Notes: Robust standard errors in parentheses; *** p < 0.01, ** p < 0.05, * p < 0.1. Firm and year dummy added. N = 16,188.
Appendix A.7. Heterogeneity Test: The Real Effect of Stock Overvaluation with Different Growth Level
| Model 1 | Model 2 | Model 3 | Model 4 | Model 5 | Model 6 | Model 7 | Model 8 | |
|---|---|---|---|---|---|---|---|---|
| ROAt+1 | ROAt+3 | Equity Sell | R&D Growth | |||||
| HighGrowth | LowGrowth | High Growth | Low Growth | High Growth | Low Growth | High Growth | Low Growth | |
| Stock Overvaluation | 0.0126 *** | −0.0057 *** | 0.0014 | −0.0106 *** | 0.0007 ** | 0.0012 *** | −0.0595 | −0.0904 ** |
| (0.0019) | (0.0020) | (0.0022) | (0.0022) | (0.0003) | (0.0003) | (0.0439) | (0.0449) | |
| Firm Size | −0.0014 ** | 0.0006 | −0.0020 *** | −0.0019 ** | −0.0003 *** | −0.0001 * | 0.0118 | 0.0081 |
| (0.0007) | (0.0007) | (0.0008) | (0.0008) | (0.0001) | (0.0001) | (0.0182) | (0.0193) | |
| Leverage | −0.0802 *** | −0.0691 *** | −0.0622 *** | −0.0456 *** | −0.0004 | −0.0007 | 0.0343 | 0.3582 *** |
| (0.0039) | (0.0040) | (0.0044) | (0.0042) | (0.0007) | (0.0005) | (0.0936) | (0.0973) | |
| List Age | 0.0002 ** | 0.0003 ** | 0.0006 *** | 0.0003 ** | −0.0002 *** | −0.0003 *** | −0.0088 *** | −0.0074 ** |
| (0.0001) | (0.0001) | (0.0001) | (0.0001) | (0.0000) | (0.0000) | (0.0031) | (0.0031) | |
| Institution Hold | 0.0841 *** | 0.0997 *** | 0.0583 *** | 0.0566 *** | 0.0004 | −0.0000 | 0.6463 *** | 1.0318 *** |
| (0.0072) | (0.0095) | (0.0082) | (0.0115) | (0.0012) | (0.0015) | (0.2044) | (0.3104) | |
| Top 1 Hold | 0.0441 *** | 0.0345 *** | 0.0483 *** | 0.0362 *** | −0.0025 *** | −0.0032 *** | 0.1529 | 0.0329 |
| (0.0039) | (0.0045) | (0.0045) | (0.0052) | (0.0007) | (0.0007) | (0.1140) | (0.1353) | |
| State Hold | −0.0043 | −0.0107 *** | −0.0051 * | −0.0004 | −0.0016 *** | −0.0021 *** | 0.1021 | −0.0397 |
| (0.0028) | (0.0032) | (0.0030) | (0.0036) | (0.0003) | (0.0003) | (0.0837) | (0.0990) | |
| Analyst Coverage | 0.1244 *** | 0.1604 *** | 0.1096 *** | 0.1191 *** | −0.0014 | −0.0017 | −0.1802 | −0.0789 |
| (0.0072) | (0.0095) | (0.0087) | (0.0112) | (0.0013) | (0.0016) | (0.2059) | (0.2804) | |
| Constant | 0.0542 *** | 0.0034 | 0.0810 *** | 0.0691 *** | 0.0086 *** | 0.0059 *** | 0.2805 | 0.4976 |
| (0.0175) | (0.0169) | (0.0176) | (0.0173) | (0.0019) | (0.0017) | (0.3799) | (0.4166) | |
| N | 8230 | 8228 | 8230 | 8228 | 8230 | 8228 | 8230 | 8228 |
| R2 | 0.317 | 0.204 | 0.186 | 0.106 | 0.070 | 0.081 | 0.099 | 0.094 |
Notes: Robust standard errors in parentheses; *** p < 0.01, ** p < 0.05, * p < 0.1. Firm and year dummy added.
Appendix A.8. The Interaction Effect of Shareholder Structure and Stock Overvaluation
| Model 1 | Model 2 | Model 3 | Model 4 | Model 5 | Model 6 | Model 7 | |
|---|---|---|---|---|---|---|---|
| ROAt+3 | ROAt+3 | ROAt+3 | Equity Sell | Equity Sell | Equity Sell | ROAt+3 | |
| Stock Overvaluation | −0.0078 *** | −0.0202 *** | −0.0088 *** | 0.0008 *** | 0.0007 | 0.0011 *** | −0.0086 *** |
| (0.0019) | (0.0033) | (0.0019) | (0.0002) | (0.0004) | (0.0003) | (0.0019) | |
| Stock Overvaluation * Institutional Holding | 0.0453 *** | 0.0009 | |||||
| (0.0140) | (0.0016) | ||||||
| Stock Overvaluation * Block Holding | 0.0452 *** | 0.0005 | |||||
| (0.0080) | (0.0010) | ||||||
| Stock Overvaluation * SOE Holding | 0.0268 *** | −0.0019 *** | 0.0266 *** | ||||
| (0.0048) | (0.0005) | (0.0048) | |||||
| Equity Sell | −0.1463 *** | ||||||
| (0.0539) | |||||||
| Firm Size | −0.0020 *** | −0.0024 *** | −0.0024 *** | −0.0002 *** | −0.0002 *** | −0.0002 *** | −0.0024 *** |
| (0.0005) | (0.0005) | (0.0005) | (0.0001) | (0.0001) | (0.0001) | (0.0005) | |
| Leverage | −0.0530 *** | −0.0527 *** | −0.0524 *** | −0.0006 | −0.0006 | −0.0006 | −0.0525 *** |
| (0.0031) | (0.0031) | (0.0031) | (0.0004) | (0.0004) | (0.0004) | (0.0031) | |
| List Age | 0.0005 *** | 0.0005 *** | 0.0005 *** | −0.0002 *** | −0.0002 *** | −0.0002 *** | 0.0004 *** |
| (0.0001) | (0.0001) | (0.0001) | (0.0000) | (0.0000) | (0.0000) | (0.0001) | |
| Institution Hold | 0.0574 *** | 0.0662 *** | 0.0647 *** | 0.0003 | 0.0004 | 0.0004 | 0.0647 *** |
| (0.0064) | (0.0066) | (0.0066) | (0.0009) | (0.0009) | (0.0009) | (0.0066) | |
| Top 1 Hold | 0.0437 *** | 0.0427 *** | 0.0436 *** | −0.0028 *** | −0.0028 *** | −0.0028 *** | 0.0432 *** |
| (0.0034) | (0.0034) | (0.0034) | (0.0005) | (0.0005) | (0.0005) | (0.0034) | |
| State Hold | −0.0025 | −0.0026 | −0.0031 | −0.0018 *** | −0.0018 *** | −0.0018 *** | −0.0033 |
| (0.0023) | (0.0023) | (0.0023) | (0.0002) | (0.0002) | (0.0002) | (0.0023) | |
| Analyst Coverage | 0.1194 *** | 0.1184 *** | 0.1193 *** | −0.0017 * | −0.0018 * | −0.0018 * | 0.1190 *** |
| (0.0068) | (0.0068) | (0.0068) | (0.0010) | (0.0010) | (0.0010) | (0.0068) | |
| Constant | 0.0767 *** | 0.0836 *** | 0.0819 *** | 0.0072 *** | 0.0073 *** | 0.0068 *** | 0.0829 *** |
| (0.0123) | (0.0123) | (0.0123) | (0.0013) | (0.0013) | (0.0013) | (0.0123) | |
| R2 | 0.138 | 0.139 | 0.139 | 0.071 | 0.071 | 0.071 | 0.139 |
Notes: Robust standard errors in parentheses; *** p < 0.01, * p < 0.1. Firm and year dummy added. N = 16,458.
Appendix A.9. Using SOE as a Moderator
| Model 1 | Model 2 | Model 3 | Model 4 | |
|---|---|---|---|---|
| ROAt+1 | ROAt+3 | Equity Sell | ROAt+3 | |
| Stock Overvaluation | 0.0050 *** | −0.0095 *** | 0.0012 *** | −0.0094 *** |
| (0.0017) | (0.0020) | (0.0003) | (0.0020) | |
| Stock Overvaluation X SOE | −0.0034 | 0.0117 *** | −0.0011 *** | 0.0115 *** |
| (0.0021) | (0.0023) | (0.0003) | (0.0023) | |
| SOE | −0.0088 *** | −0.0055 *** | −0.0012 *** | −0.0057 *** |
| (0.0013) | (0.0014) | (0.0001) | (0.0014) | |
| Equity Sell | −0.1527 *** | |||
| (0.0540) | ||||
| Firm Size | 0.0001 | −0.0021 *** | −0.0001 ** | −0.0021 *** |
| (0.0005) | (0.0005) | (0.0001) | (0.0005) | |
| Leverage | −0.0731 *** | −0.0519 *** | −0.0006 | −0.0520 *** |
| (0.0029) | (0.0031) | (0.0004) | (0.0031) | |
| List Age | 0.0002 ** | 0.0005 *** | −0.0002 *** | 0.0005 *** |
| (0.0001) | (0.0001) | (0.0000) | (0.0001) | |
| Institution Hold | 0.1033 *** | 0.0653 *** | 0.0006 | 0.0654 *** |
| (0.0057) | (0.0066) | (0.0009) | (0.0066) | |
| Top 1 Hold | 0.0372 *** | 0.0414 *** | −0.0033 *** | 0.0409 *** |
| (0.0030) | (0.0035) | (0.0005) | (0.0035) | |
| State Hold | 0.0050 * | 0.0056 * | −0.0001 | 0.0056 * |
| (0.0029) | (0.0031) | (0.0002) | (0.0031) | |
| Analyst Coverage | 0.1473 *** | 0.1187 *** | −0.0020 ** | 0.1184 *** |
| (0.0059) | (0.0068) | (0.0010) | (0.0068) | |
| Constant | 0.0227 * | 0.0793 *** | 0.0064 *** | 0.0803 *** |
| (0.0120) | (0.0122) | (0.0013) | (0.0122) | |
| R2 | 0.257 | 0.139 | 0.073 | 0.140 |
Notes: Robust standard errors in parentheses; *** p < 0.01, ** p < 0.05, * p < 0.1. Industry and year dummy added. N = 16,458.
Appendix A.10
Appendix A.10.1. Using Industry Overvaluation as an Instrumental Variable
| Model 1 | Model 2 | Model 3 | Model 4 | Model 5 | |
|---|---|---|---|---|---|
| ROAt+1 | ROAt+2 | ROAt+3 | Equity Sell | ROAt+3 | |
| Industry Overvaluation | 0.0108 *** | −0.0015 | −0.0293 *** | 0.0020 *** | −0.0290 *** |
| (0.0037) | (0.0037) | (0.0046) | (0.0005) | (0.0046) | |
| Equity Sell | −0.1475 *** | ||||
| (0.0542) | |||||
| Firm Size | −0.0004 | −0.0012 ** | −0.0019 *** | −0.0002 *** | −0.0019 *** |
| (0.0005) | (0.0005) | (0.0005) | (0.0001) | (0.0005) | |
| Leverage | −0.0734 *** | −0.0608 *** | −0.0532 *** | −0.0006 | −0.0533 *** |
| (0.0029) | (0.0028) | (0.0031) | (0.0004) | (0.0031) | |
| List Age | 0.0001 | 0.0002 ** | 0.0004 *** | −0.0002 *** | 0.0004 *** |
| (0.0001) | (0.0001) | (0.0001) | (0.0000) | (0.0001) | |
| Institution Hold | 0.1044 *** | 0.0904 *** | 0.0639 *** | 0.0009 | 0.0640 *** |
| (0.0056) | (0.0057) | (0.0063) | (0.0009) | (0.0064) | |
| Top 1 Hold | 0.0417 *** | 0.0391 *** | 0.0422 *** | −0.0026 *** | 0.0418 *** |
| (0.0030) | (0.0030) | (0.0034) | (0.0005) | (0.0034) | |
| State Hold | −0.0085 *** | −0.0067 *** | −0.0022 | −0.0019 *** | −0.0025 |
| (0.0021) | (0.0022) | (0.0023) | (0.0002) | (0.0023) | |
| Analyst Coverage | 0.1527 *** | 0.1239 *** | 0.1145 *** | −0.0009 | 0.1143 *** |
| (0.0058) | (0.0059) | (0.0067) | (0.0009) | (0.0067) | |
| Constant | 0.0274 ** | 0.0503 *** | 0.0809 *** | 0.0075 *** | 0.0820 *** |
| (0.0122) | (0.0117) | (0.0124) | (0.0013) | (0.0124) | |
| R2 | 0.255 | 0.191 | 0.139 | 0.071 | 0.140 |
Notes: Robust standard errors in parentheses; *** p < 0.01, ** p < 0.05. Industry and year dummy added. N = 16,458.
Appendix A.10.2. Robustness Check—Using Industry Overvaluation as an Instrumental Variable
| Model 1 | Model 2 | Model 3 | Model 4 | Model 5 | Model 6 | |
|---|---|---|---|---|---|---|
| ROAt+1 | ROAt+2 | ROAt+3 | Equity Sell | R&D Growth | ROAt+3 | |
| Stock Overvaluation | 0.0108 *** | −0.0015 | −0.0293 *** | 0.0020 *** | −0.0919 | −0.0289 *** |
| (0.0037) | (0.0037) | (0.0046) | (0.0005) | (0.0972) | (0.0046) | |
| Equity Sell | −0.1469 *** | |||||
| (0.0542) | ||||||
| R&D Growth | −0.0002 | |||||
| (0.0004) | ||||||
| Firm Size | −0.0004 | −0.0012 ** | −0.0019 *** | −0.0002 *** | 0.0124 | −0.0019 *** |
| (0.0005) | (0.0005) | (0.0005) | (0.0001) | (0.0132) | (0.0005) | |
| Leverage | −0.0734 *** | −0.0608 *** | −0.0532 *** | −0.0006 | 0.2114 *** | −0.0533 *** |
| (0.0029) | (0.0028) | (0.0031) | (0.0004) | (0.0679) | (0.0031) | |
| List Age | 0.0001 | 0.0002 ** | 0.0004 *** | −0.0002 *** | −0.0086 *** | 0.0004 *** |
| (0.0001) | (0.0001) | (0.0001) | (0.0000) | (0.0022) | (0.0001) | |
| Institution Hold | 0.1044 *** | 0.0904 *** | 0.0639 *** | 0.0009 | 0.7155 *** | 0.0642 *** |
| (0.0056) | (0.0057) | (0.0063) | (0.0009) | (0.1665) | (0.0064) | |
| Top 1 Hold | 0.0417 *** | 0.0391 *** | 0.0422 *** | −0.0026 *** | 0.0684 | 0.0418 *** |
| (0.0030) | (0.0030) | (0.0034) | (0.0005) | (0.0874) | (0.0034) | |
| State Hold | −0.0085 *** | −0.0067 *** | −0.0022 | −0.0019 *** | 0.0403 | −0.0024 |
| (0.0021) | (0.0022) | (0.0023) | (0.0002) | (0.0647) | (0.0023) | |
| Analyst Coverage | 0.1527 *** | 0.1239 *** | 0.1145 *** | −0.0009 | −0.2235 | 0.1144 *** |
| (0.0058) | (0.0059) | (0.0067) | (0.0009) | (0.1598) | (0.0067) | |
| Constant | 0.0274 ** | 0.0503 *** | 0.0809 *** | 0.0075 *** | 0.3960 | 0.0817 *** |
| (0.0122) | (0.0117) | (0.0124) | (0.0013) | (0.2850) | (0.0124) | |
| R2 | 0.255 | 0.191 | 0.139 | 0.071 | 0.090 | 0.140 |
Notes: Robust standard errors in parentheses; *** p < 0.01, ** p < 0.05. Industry and year dummy added. N = 16,458.
References
- Baker, Malcolm, Jeremy C. Stein, and Jeffrey Wurgler. 2003. When does the market matter? Stock prices and the investment of equity-dependent firms. The Quarterly Journal of Economics 118: 969–1005. [Google Scholar] [CrossRef]
- Baron, Reuben M., and David A. Kenny. 1986. The moderator–mediator variable distinction in social psychological research: Conceptual, strategic, and statistical considerations. Journal of Personality and Social Psychology 51: 1173. [Google Scholar] [CrossRef] [PubMed]
- Belderbos, René, Carree Martin, Lokshin Boris, and Fernández S. Juan. 2015. Inter-temporal patterns of R&D collaboration and innovative performance. The Journal of Technology Transfer 40: 123–37. [Google Scholar]
- Bloom, Nick. 2007. Uncertainty and the dynamics of R&D. American Economic Review 97: 250–55. [Google Scholar]
- Bolton, Patrick, Jose Scheinkman, and Wei Xiong. 2006. Executive compensation and short-termist behaviour in speculative markets. The Review of Economic Studies 73: 577–610. [Google Scholar] [CrossRef]
- Bond, Philip, Alex Edmans, and Itay Goldstein. 2012. The real effects of financial markets. Annual Review of Financial Economics 4: 339–60. [Google Scholar] [CrossRef]
- Brown, Gregory W., and Michael T. Cliff. 2004. Investor sentiment and the near-term stock market. Journal of Empirical Finance 11: 1–27. [Google Scholar] [CrossRef]
- Bushee, Brian J. 1998. The influence of institutional investors on myopic R&D investment behavior. Accounting Review 73: 305–33. [Google Scholar]
- Cai, Xiaoqiong, Guy S. Liu, and Bryan Mase. 2008. The long-run performance of initial public offerings and its determinants: The case of China. Review of Quantitative Finance and Accounting 30: 419–32. [Google Scholar] [CrossRef]
- Campello, Murillo, and John R. Graham. 2013. Do stock prices influence corporate decisions? Evidence from the technology bubble. Journal of Financial Economics 107: 89–110. [Google Scholar] [CrossRef]
- Cao, Qilong, Ju Meng, Li Jinglei, and Zhong Changbao. 2022. Managerial myopia and long-term investment: Evidence from China. Sustainability 15: 708. [Google Scholar] [CrossRef]
- Chan, Kalok, Junbo Wang, and K. C. John Wei. 2004. Underpricing and long-term performance of IPOs in China. Journal of Corporate Finance 10: 409–30. [Google Scholar] [CrossRef]
- Chen, Qi, Itay Goldstein, and Wei Jiang. 2007. Price informativeness and investment sensitivity to stock price. The Review of Financial Studies 20: 619–50. [Google Scholar] [CrossRef]
- Dechow, Patricia, Weili Ge, and Catherine Schrand. 2010. Understanding earnings quality: A review of the proxies, their determinants and their consequences. Journal of Accounting and Economics 50: 344–401. [Google Scholar] [CrossRef]
- Dong, Ming, David Hirshleifer, and Siew Hong Teoh. 2021. Misvaluation and corporate inventiveness. Journal of Financial and Quantitative Analysis 56: 2605–33. [Google Scholar] [CrossRef]
- Edmans, Alex, Vivian W. Fang, and Katharina A. Lewellen. 2017. Equity vesting and investment. The Review of Financial Studies 30: 2229–71. [Google Scholar] [CrossRef]
- Fairfield, Patricia M., J. Scott Whisenant, and Teri Lombardi Yohn. 2003. Accrued earnings and growth: Implications for future profitability and market mispricing. The Accounting Review 78: 353–71. [Google Scholar] [CrossRef]
- Fu, Fangjian, Leming Lin, and Micah S. Officer. 2013. Acquisitions driven by stock overvaluation: Are they good deals? Journal of Financial Economics 109: 24–39. [Google Scholar] [CrossRef]
- Goldstein, Itay, and Alexander Guembel. 2008. Manipulation and the allocational role of prices. The Review of Economic Studies 75: 133–64. [Google Scholar] [CrossRef]
- Goldstein, Itay, Emre Ozdenoren, and Kathy Yuan. 2013. Trading frenzies and their impact on real investment. Journal of Financial Economics 109: 566–82. [Google Scholar] [CrossRef]
- Holmström, Bengt. 1999. Managerial incentive problems: A dynamic perspective. The Review of Economic Studies 66: 169–82. [Google Scholar] [CrossRef]
- Jensen, Michael C. 2005. Agency costs of overvalued equity. Financial Management 34: 5–19. [Google Scholar] [CrossRef]
- Lakonishok, Josef, and Inmoo Lee. 2001. Are insider trades informative? The Review of Financial Studies 14: 79–111. [Google Scholar] [CrossRef]
- Laverty, Kevin J. 1996. Economic “short-termism”: The debate, the unresolved issues, and the implications for management practice and research. Academy of Management Review 21: 825–60. [Google Scholar]
- Li, Xintao, and Qian Li. 2022. Does margin call pressure affect the M&A decision of controlling shareholders with equity pledges: Evidence from Chinese listed company. Frontiers in Psychology 13: 898118. [Google Scholar] [PubMed]
- Li, Yuanpeng, Qian Sun, and Shu Tian. 2018. The impact of IPO approval on the price of existing stocks: Evidence from China. Journal of Corporate Finance 50: 109–27. [Google Scholar] [CrossRef]
- Maritan, Catherine A. 2001. Capital investment as investing in organizational capabilities: An empirically grounded process model. Academy of Management Journal 44: 513–31. [Google Scholar] [CrossRef]
- Moeller, Sara B., Frederik P. Schlingemann, and René M. Stulz. 2005. Wealth destruction on a massive scale? A study of acquiring-firm returns in the recent merger wave. The Journal of Finance 60: 757–82. [Google Scholar] [CrossRef]
- Narayanan, M. P. 1985. Managerial incentives for short-term results. The Journal of Finance 40: 1469–84. [Google Scholar]
- Rhodes-Kropf, Matthew, David T. Robinson, and Sean Viswanathan. 2005. Valuation waves and merger activity: The empirical evidence. Journal of Financial Economics 77: 561–603. [Google Scholar] [CrossRef]
- Richardson, Scott A., Richard G. Sloan, Mark T. Soliman, and Irem Tuna. 2005. Accrual reliability, earnings persistence and stock prices. Journal of Accounting and Economics 39: 437–85. [Google Scholar] [CrossRef]
- Rostami, Vahab, Hamed Kargar, and Mahdis Samimifard. 2022. The Effect of Managerial Myopia on the Adjustment Speed of the Company’s Financial Leverage towards the Optimal Leverage. Journal of Risk and Financial Management 15: 581. [Google Scholar] [CrossRef]
- Seybert, Nicholas, and Holly I. Yang. 2012. The party’s over: The role of earnings guidance in resolving sentiment-driven overvaluation. Management Science 58: 308–19. [Google Scholar] [CrossRef]
- Shleifer, Andrei, and Robert W. Vishny. 2003. Stock market driven acquisitions. Journal of Financial Economics 70: 295–311. [Google Scholar] [CrossRef]
- Stein, Jeremy C. 1989. Efficient capital markets, inefficient firms: A model of myopic corporate behavior. The Quarterly Journal of Economics 104: 655–69. [Google Scholar] [CrossRef]
- Stein, Jeremy C. 1996. Rational capital budgeting in an irrational world. The Journal of Business 69: 429–55. [Google Scholar] [CrossRef]
- Titman, Sheridan. 2013. Financial markets and investment externalities. The Journal of Finance 68: 1307–29. [Google Scholar] [CrossRef]
- Zhao, Yijiang, Kung H. Chen, Yinqi Zhang, and Michael Davis. 2012. Takeover Protection and Managerial Myopia: Evidence from Real Earnings Management. Journal of Accounting and Public Policy 31: 109–35. [Google Scholar] [CrossRef]

Disclaimer/Publisher’s Note: The statements, opinions and data contained in all publications are solely those of the individual author(s) and contributor(s) and not of MDPI and/or the editor(s). MDPI and/or the editor(s) disclaim responsibility for any injury to people or property resulting from any ideas, methods, instructions or products referred to in the content. |
© 2024 by the authors. Licensee MDPI, Basel, Switzerland. This article is an open access article distributed under the terms and conditions of the Creative Commons Attribution (CC BY) license (https://creativecommons.org/licenses/by/4.0/).