1. Introduction
The focus of this research paper is to describe, analyze, and evaluate a modeling method for strategic environments through ANNs and therefore evaluate the prediction of enterprise sales and operating results.
Strategic decisions and the performance of companies are topics of enormous importance in all studies of organizations due to the interest that exists in the analysis of the factors that affect organizational performance (
Hoopes et al. 2003;
Mucharreira et al. 2019).
Every business activity is affected by a variety of essential decisions. Having a reliable decision support system where its models can deal with uncertainty is becoming an essential issue for companies in the current environment. Looking at previous studies on the use of neural networks in business, we found a huge increase in decision support applications (
Tkáč and Verner 2016).
One of the major difficulties in managing a commercial organization is predicting, with some precision, the impact some strategic decisions have on the financial results. Business intelligence (BI) is widely used to help managers make strategic decisions (
Alcázar-Blanco et al. 2021;
Han and Zhang 2021).
A vast set of applications in the business world where ANNs are used has been identified. These include areas of finance, financial markets, and business, among others. There is also a focus on characteristics inherent to ANNs, such as tolerance to noise in data and the ability to deal with nonlinear environments (
Abiodun et al. 2018).
Although there are many studies that provide some evidence that ANNs are used to assist decision-making, most of the training of such ANNs is conducted using historical data and is based on the recognition of patterns in the financial performance and behavior of organizations over time. However, this approach may be too dependent on past economic and strategic models. This study consists of modeling an environment based on the strategic behavior of several organizations that operate in a stable economic environment without being influenced by their historical behavior.
The advantage of using mathematical models is that they permit the forecasting of results (
Hoel 1966). Therefore, deterministic mathematical models can be used to predict an action applied in an environment. The model will be considered a success if its results are similar to what might happen in the real environment.
Managers and management advisors use data and information combined with analytical algorithms and forecasting as an analysis tool to help decision-making. This method can bring added value to corporate organizations (
Curuksu 2018, p. 19). Managers try to reduce uncertainty and make more accurate estimates of what could happen in a future time frame. This is the main objective of predictions (
Render et al. 2018, p. 165).
Change is one of the biggest challenges managers can face. The changing factors of the external environment lead to the need for managers to recognize and understand how the change affects the organization internally. Change is usually accompanied by some level of uncertainty (
Saloner et al. 2001, p. 271).
Problems should be identified in advance using forecasting techniques, thus preparing the organization for future eventualities. Controlling, influencing, or acting on the sources of uncertainty can allow mitigation of the impacts caused. The increased flexibility and structural competitiveness reduce exposure to uncertainty.
The main goal of this study is to create, analyze, and evaluate a modeling method that should allow one to predict the impact of strategies on sales and operating results. The platform chosen for modeling is based on artificial neural networks.
This innovative method consists of using artificial neural networks to model the behavior of sales and operating results according to the strategies applied in an organization.
The main contribution of the study is to evaluate the possibility of modeling strategic environments with a certain precision. A favorable evaluation of the modeling method allows a dynamic environment, such as the strategic environment to which organizations are exposed, to be studied without expending resources or putting the organization at risk.
2. Framework of the Approach
The authors propose an approach with seven steps: hypothesis dealing with the possibility of constructing a model; questionnaire; strategies considered; financial data and artificial neural networks; methodology; data processing and filtering; and applying data to ANNs. These steps aim to develop a tool that allows the prediction and adaptation of strategies before they are implemented, which can lead to an outstanding advantage over competitors.
2.1. Hypothesis Dealing with the Possibility of Constructing a Model
This study has one inherent hypothesis: it is possible to model the strategic environment.
Therefore, one must conclude that it is possible to construct a model that allows revenue prediction through strategies. This model should have as input the ratio between revenue from the two previous years and the strategies to be used in the current year. The outputs are the expected ratio of revenue using the strategies defined in the input.
Two performance indicators are used to measure the modeling success:
Training set performance, which will show if it is possible to model the environment with the given data.
Test set performance, which will measure the precision of the calculated model. A precision greater than 30% for more than 70% of the sample set will be considered a reasonable model.
The expected value of the indicators of the level of success will differ from environment to environment. It is expected that the quality of the data provided to ANNs will have significant importance.
Therefore, the expected success should be adapted to the market environment and the data quality. One should not expect a good model if dynamism makes the environment unpredictable or if the quality of the provided data is poor.
2.2. Questionnaire
The questionnaires (
Appendix A) were responded to by the managers of organizations in order to establish the level of application of the strategies used.
The importance that an organization gives to a certain strategy, that is, how the organization perceives the impact of the application of the strategies on the results, was measured.
The survey consisted of 11 (eleven) questions about strategies used by managers in the target organizations. The questions were formulated with a high level of abstraction, making it possible to increase the number of adherent organizations that respond to the survey. High-level abstraction questions about strategies allow organizations to identify similarities between the strategies subject to the study and those actually used.
The managers classified the application level of these strategies between 0 (zero) and 9 (nine), with 0 (zero) meaning that the organization did not apply that particular strategy and 9 (nine) if it was considered an important strategy for the company.
2.3. Strategies Considered
For the empirical study inherent to this article, some generic strategies were considered that can exist in almost all sectors of activity and in any organization, whether small or significant in size.
The description of the strategies was simplified to facilitate the questionnaire response process and the analysis of the results.
The applicational level of strategies in an organization tends to be directly related to the importance that the top management of that organization gives to that strategy.
Based on this assumption, this importance was considered to be directly related to the impact the strategy has on financial results. Therefore, the importance given to this strategy was considered an input variable in the model.
The strategies used for the survey were as follows:
Product price strategy;
Product quality strategy;
Cost-reduction strategy;
Investment strategy;
Financing strategy;
Strategies of product specialization or diversification;
Strategy to increase or reduce markets;
Business synergy strategy;
Product disclosure strategy;
Structural reorganization strategy;
Supplier renegotiation strategy.
2.4. Financial Data and Artificial Neural Networks
The financial data were obtained through a specialized financial database service. After the survey, the financial results were obtained by a query where the organization identifier was the tax identification number.
The sampling was achieved taking into account the managers’ availability to respond to the questionnaire, and it was mandatory to have access to financial data. Companies with only 11 to 50 employees and an upper turnover limit of EUR 10 million were chosen.
Organizational financial data were collected from the SABI database. The information considered relevant to the study was as follows:
The experiments carried out to understand the behavior of such a model made the authors believe that when more information is needed to calculate the indicator, there is more dependence on variables that are not included in the model. For this reason, the degree of entropy in the model can be high, which generates performance indicators of the model below expectations. Therefore, companies were chosen according to the environment with more economic stability in order to reduce the entropy of the model.
Neural networks aim to emulate human brain behavior. The human brain contains about 1011 neurons, each of which is interconnected with several, or about 104, other neurons. Information transitions from neuron to neuron through chemical and electromagnetic processes, enabling both the propagation of information and the alteration of neuron states.
According to
Marques (
1999), neural networks are made up of simple, interconnected processing elements capable of learning from data. Despite the simplicity of each processing unit, the use of a large number of interconnected units allows the execution of complex, often surprising tasks.
Artificial neural networks are a robust solution for emulating real, discrete, and even vector-based functions. Neural networks are among the most effective learning methods for interpreting data of a complex nature (
Mitchell 1997).
Neural networks are known for learning from experimental data, and in general, they have good performance in processing and dealing with numerical data. One interesting fact about neural networks is that they are able to approximate any nonlinear function defined on a compact set of data (
Siddique and Adeli 2013;
Alcázar-Blanco et al. 2021;
Han and Zhang 2021).
Neural networks can be used to process very noisy but redundant information collected from the real world (
Siddique and Adeli 2013).
With the technological advancement in data processing by microprocessors, which is currently much faster, and with the possibility of performing multiprocessing in real time, neural networks have become a viable option for data analysis, providing results in a timely manner.
Artificial neural networks are often used in many modeling and prediction problems, mainly due to the opportunities for intensive computational processing. Recently, they have been increasingly applied to the analysis of financial time series. One main advantage is their ability to model almost any arbitrary nonlinear function. ANNs can provide better adjustment, especially in financial temporalities with complex nonlinear relationships. However, it is often difficult to interpret the meaning of parameters, and neural networks are viewed as “black box” models constructed for pattern recognition and prediction (
Sharma and Chopra 2013).
The quality demonstrated by ANNs in nonlinear mapping is difficult to achieve with conventional methods. ANNs have the ability to deal with complex structural instability problems. This feature is due to the ability to discover nonlinear relationships without making assumptions about the structure of the environment (
Nayak et al. 2017).
Badea (
2014) refers to the fact that, although the training set is somewhat limited, neural networks show good results in modeling. Therefore, he concludes that it is a good choice to improve marketing strategies and decision-making processes.
Because the application of ANNs in the business world is becoming easier, their use is also increasing. There will be a propensity to invest in new methodologies and algorithms using large and small databases (
Bihl et al. 2014).
Kraus et al. (
2020) published an article that analyzes the use of neural networks in business analysis and operational research as well as their implications for management. They encourage the idea that neural networks are, compared to other learning methodologies, the best methodology for using datasets with a large number of samples. They conclude that because organizations must deal with increasingly larger datasets, technological advances in predictive analysis can improve decision-making processes.
2.5. Methodology
The methodology consisted of the collection of data through a questionnaire developed for this purpose and placed on a web platform that was available to the managers of the companies targeted for the study. To prevent answers from people other than the manager responsible for the organization, the questionnaire was validated only when a unique code available to the manager was introduced. Without this code, it was not possible to submit the questionnaire. After completing the questionnaire, the data on the strategies used were associated with data from the financial results. The data were analyzed, and an objective path to follow was outlined. This path was determined by the quantity and quality of the questionnaire responses.
After this first analysis, the data were collected, and several eliminations were made using statistical methods. This enabled the selection of data with good quality.
After defining adequate data for the study, several multi-layered neural networks with different characteristics were created, allowing verification of the best structure for each of the models inherent to the hypothesis. Here, the attempt and error were fundamental to analyzing the behavior of the neural network with the data used.
2.6. Data Processing and Filtering
Data filtering is the process by which unsuitable data are eliminated from the study. Data processing is the process where data are transformed so that they are suitable to apply to ANNs.
The data processing and filtering followed the following steps:
Filter organizations by the survey answers;
Filter organizations by financial results;
Input and output data normalization.
After data processing and filtering, the data were ready and optimized to be used to model the strategic environment.
2.7. Applying Data to ANNs
The inputs from the ANNs were as follows:
Because there are 11 answers in the survey, the ANNs will have 12 perceptrons in the first layer: 1 for the financial result and 11 for the strategic variables.
There is only one output, and it will give the expected ratio Δ between the two years, i.e., the previous year and the current year, after strategies are applied. The output simply shows the relationship between the financial results of the two years. Therefore, several ANNs will be trained and analyzed, one for each financial result studied.
The number of hidden layers and the number of perceptrons in each layer were chosen from several ANNs. Each ANN was analyzed, and the one that showed the most promising results was chosen. To simplify the study, the chosen ANN topology was equal for all modeling analyses described further on and the subject of this study.
The chosen ANN topology was 12-64-64-64-1. This means that there were 4 hidden layers, each with 64 perceptrons.
3. Analysis of the Results
The first set of results presented demonstrates modeling based on a set of random samples for both the training set and the test set. In this way, it is possible to independently evaluate the actual process of modeling the environment, that is, it allows us to evaluate the process without choosing the best NN for the modeling of the environment. If the best evaluation is chosen, it can present untrustworthy results. The second set of results presented is the average of the 100 experiences. In each of these experiments, there is a random choice, as in the first set of results, of the set of samples for the training set and test set. From these results, the modeling can be better evaluated.
3.1. Single Full Experiment
The results are expressed in three different ways: graphs, errors (RMAE and RMSRE), and a table with the number of samples categorized by relative error interval. The RMAE is described as the relative mean absolute error and is calculated as follows:
RMSRE is described (
Despotovic et al. 2016) as the root mean square relative error and is calculated as follows:
The RMSRE gives more importance to the errors where the forecast is farther from reality. Because this relative distance is counted squared, together with the RMAE, it is possible to get an idea if the errors are many and small or if they are few but significant.
Graphs are easy for a first analysis. Each graphic represents the real output (y-axis) and the model prediction output (x-axis). Each graph has a diagonal line where the ratio is 1 (one) or x = y; the nearer the point is to this line, the more accurate the prediction. The other two lines from the graphs of the test set represent an error of 20%, meaning that every dot between these two lines has a prediction between 0.80 and 1.20 times the real value.
The categorization table should give an idea of where the errors will distance themselves from the real. The four categories (in absolute percentage errors) are |ε| < 5%; 5% ≤ |ε| < 10%; 10% ≤ |ε| < 20%; 20% ≤ |ε| < 25%; |ε| ≥ 25%. The relative error is calculated as follows:
These values were defined by evaluating market dynamism, so forecasting financial results based on the strategies with a margin of 30% error is considered positive.
Three NN training algorithms were used to verify the behavior of the model. All results are presented so that this behavior can be evaluated by the reader.
3.2. Sales
Graphs and performance indicators on the behavior of ANNs with different algorithms in relation to forecasting sales using the applied strategies are presented.
In this way, it is possible to predict, in an easy and intuitive way, the performance of the target ANNs of the study. In the graphs, the central diagonal line indicates an identity relationship between what was calculated by the ANN and reality, which means that the closer the sample point (red dot) is to this line, the better the forecast. For the two extra lines in the test set model, if the sample point belongs to the interval between the two lines, it indicates that the calculation of the sales forecast, in relation to reality, had an error of less than 30%.
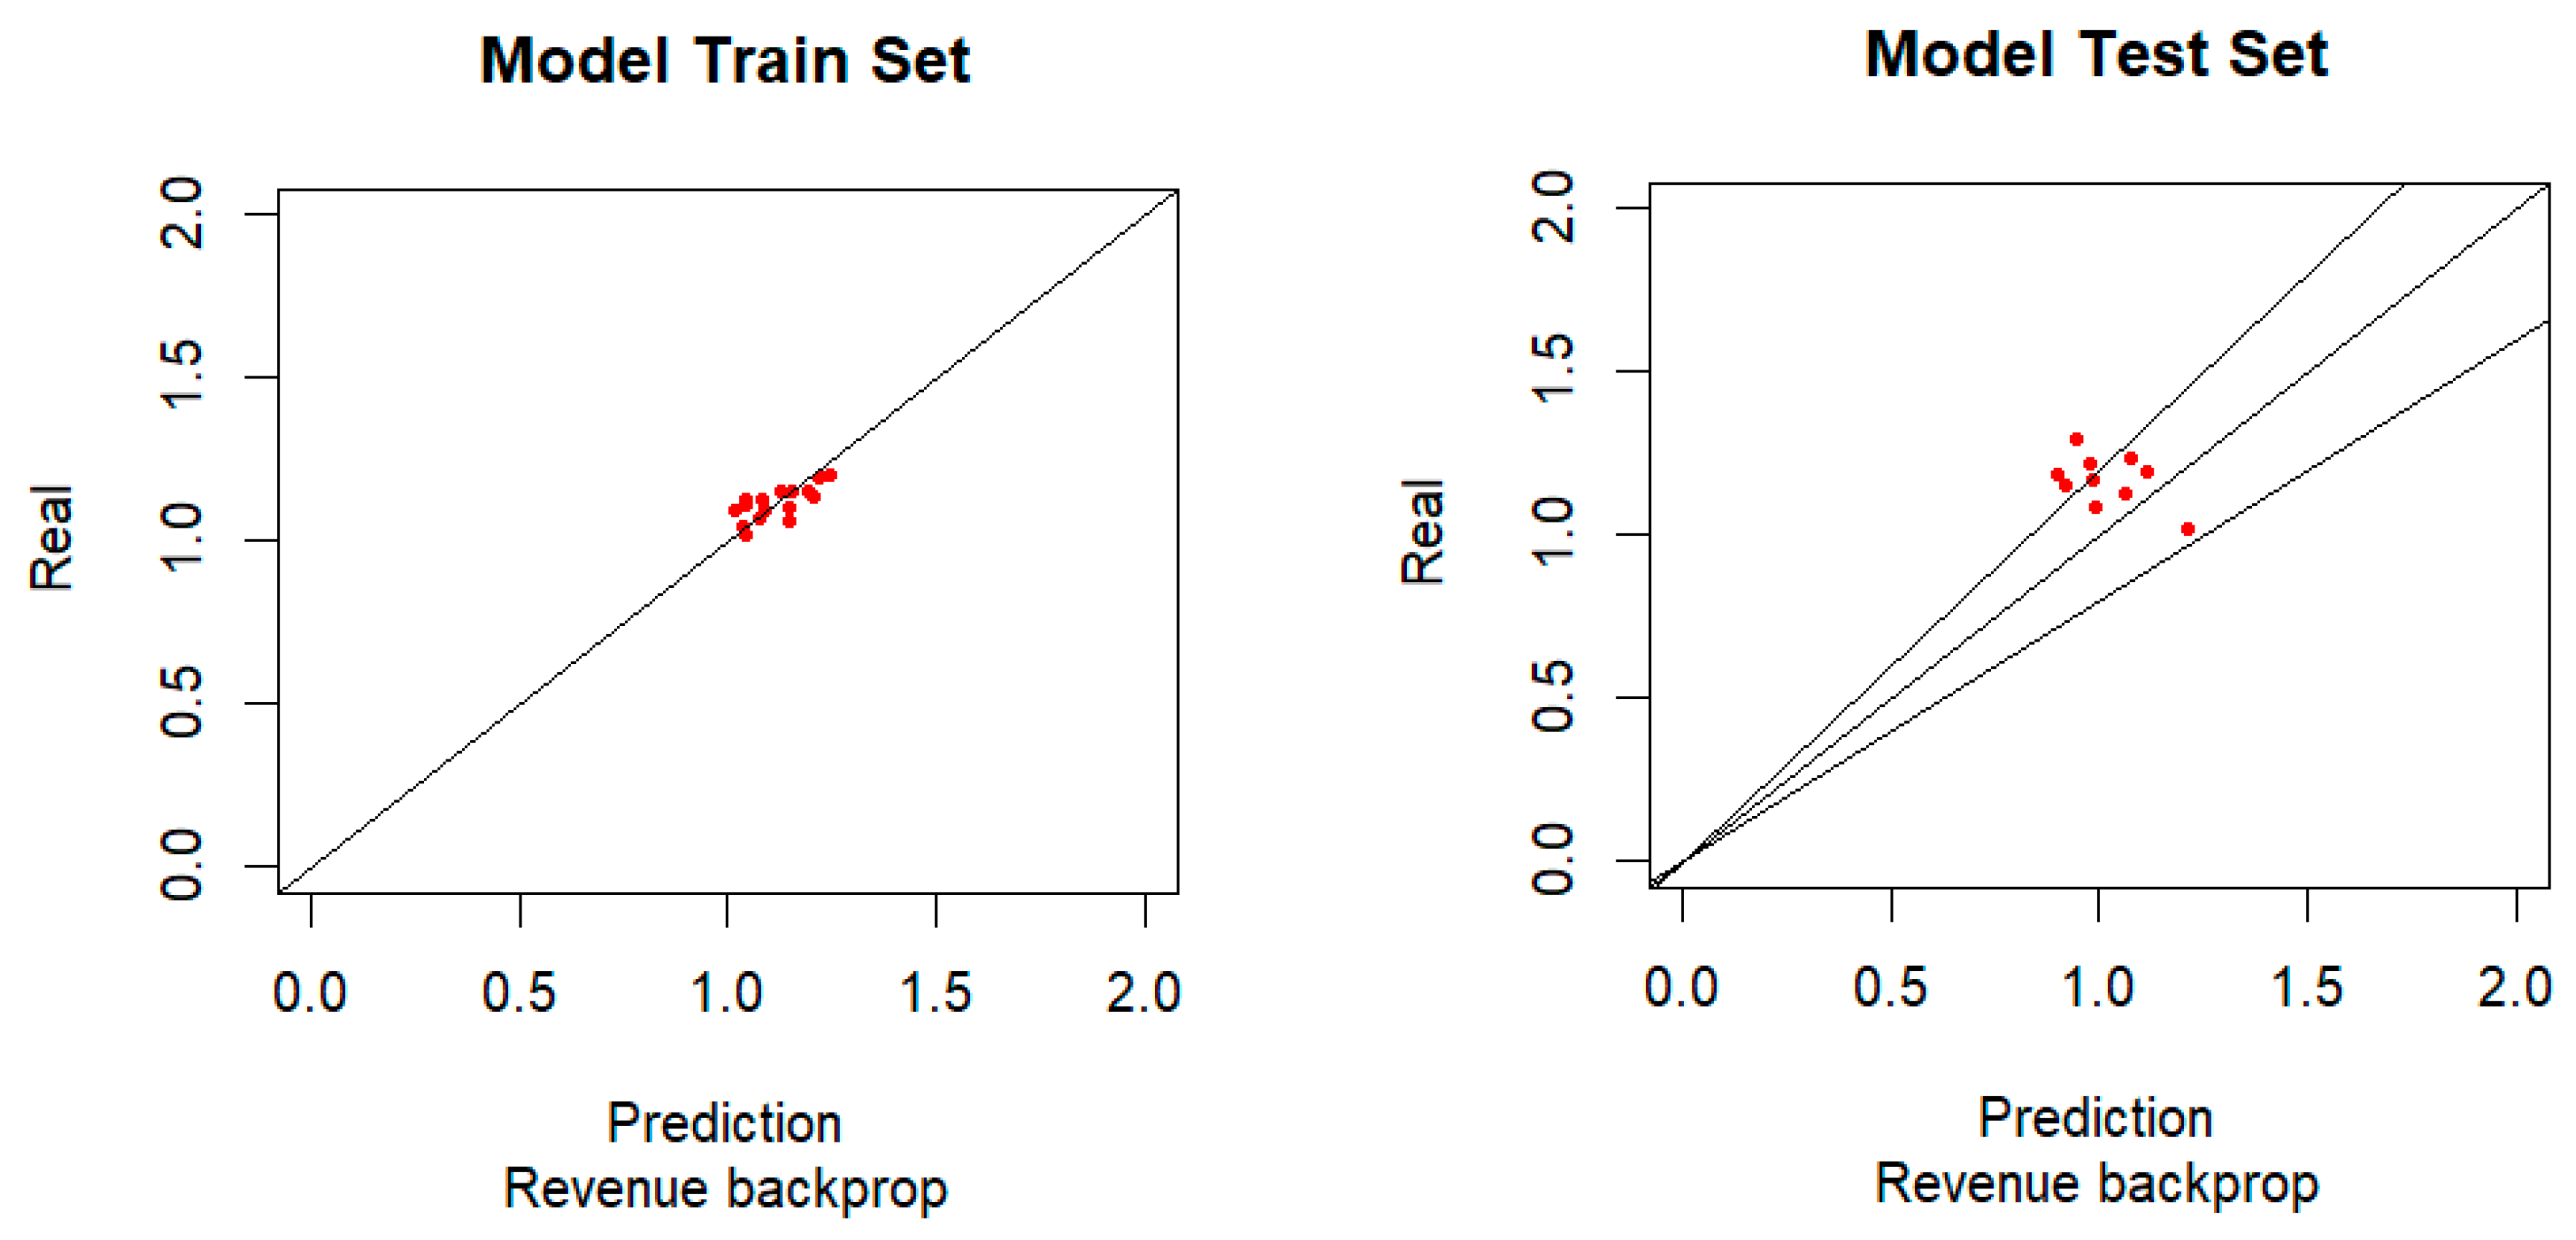
3.3. Backpropagation Algorithm
The backpropagation algorithm is widely used for training ANNs. The simplicity of its concept makes it easy to understand how it works. It consists of adjusting the weights of each perceptron according to the gradient of the cost/error function. As usual in neural networks, ANN training is carried out by applying a set of data (the training set) to the neural network and by checking the output values with the expected values in order to adapt the perceptron weights, which are designated by supervised learning. The test set is applied to the resulting ANN, and the outputs are compared with the real data without adapting the weights of the ANN. With this method, it is possible to verify how well the ANN models the forecasting environment. It should be noted that if the training set is used to train the ANN, the application of this training set to the resulting ANN itself will give a good degree of performance for the data. However, it is not useful for evaluating ANN’s performance. By applying the test set, one can check if there is any relationship between the input data and the output data, as shown in
Figure 1.
Table 1 shows information regarding what can be seen in the previous graphs. As can be seen, the test model has four points outside the two lines that limit the error to 20% (although it is very close to this line).
With 60% of the samples having less than a 20% error and 80% of the samples considering an error below 25%, with an RMSRE of 20.9% and an RMAE of 18.9%, it can be inferred that the existing errors are not very distant from the “20%” line. One can consider a reasonable model for the sales with a backpropagation algorithm. With 31.2% of the model samples having an error greater than 5%, one can consider that the model of the training set is reasonable but not excellent.
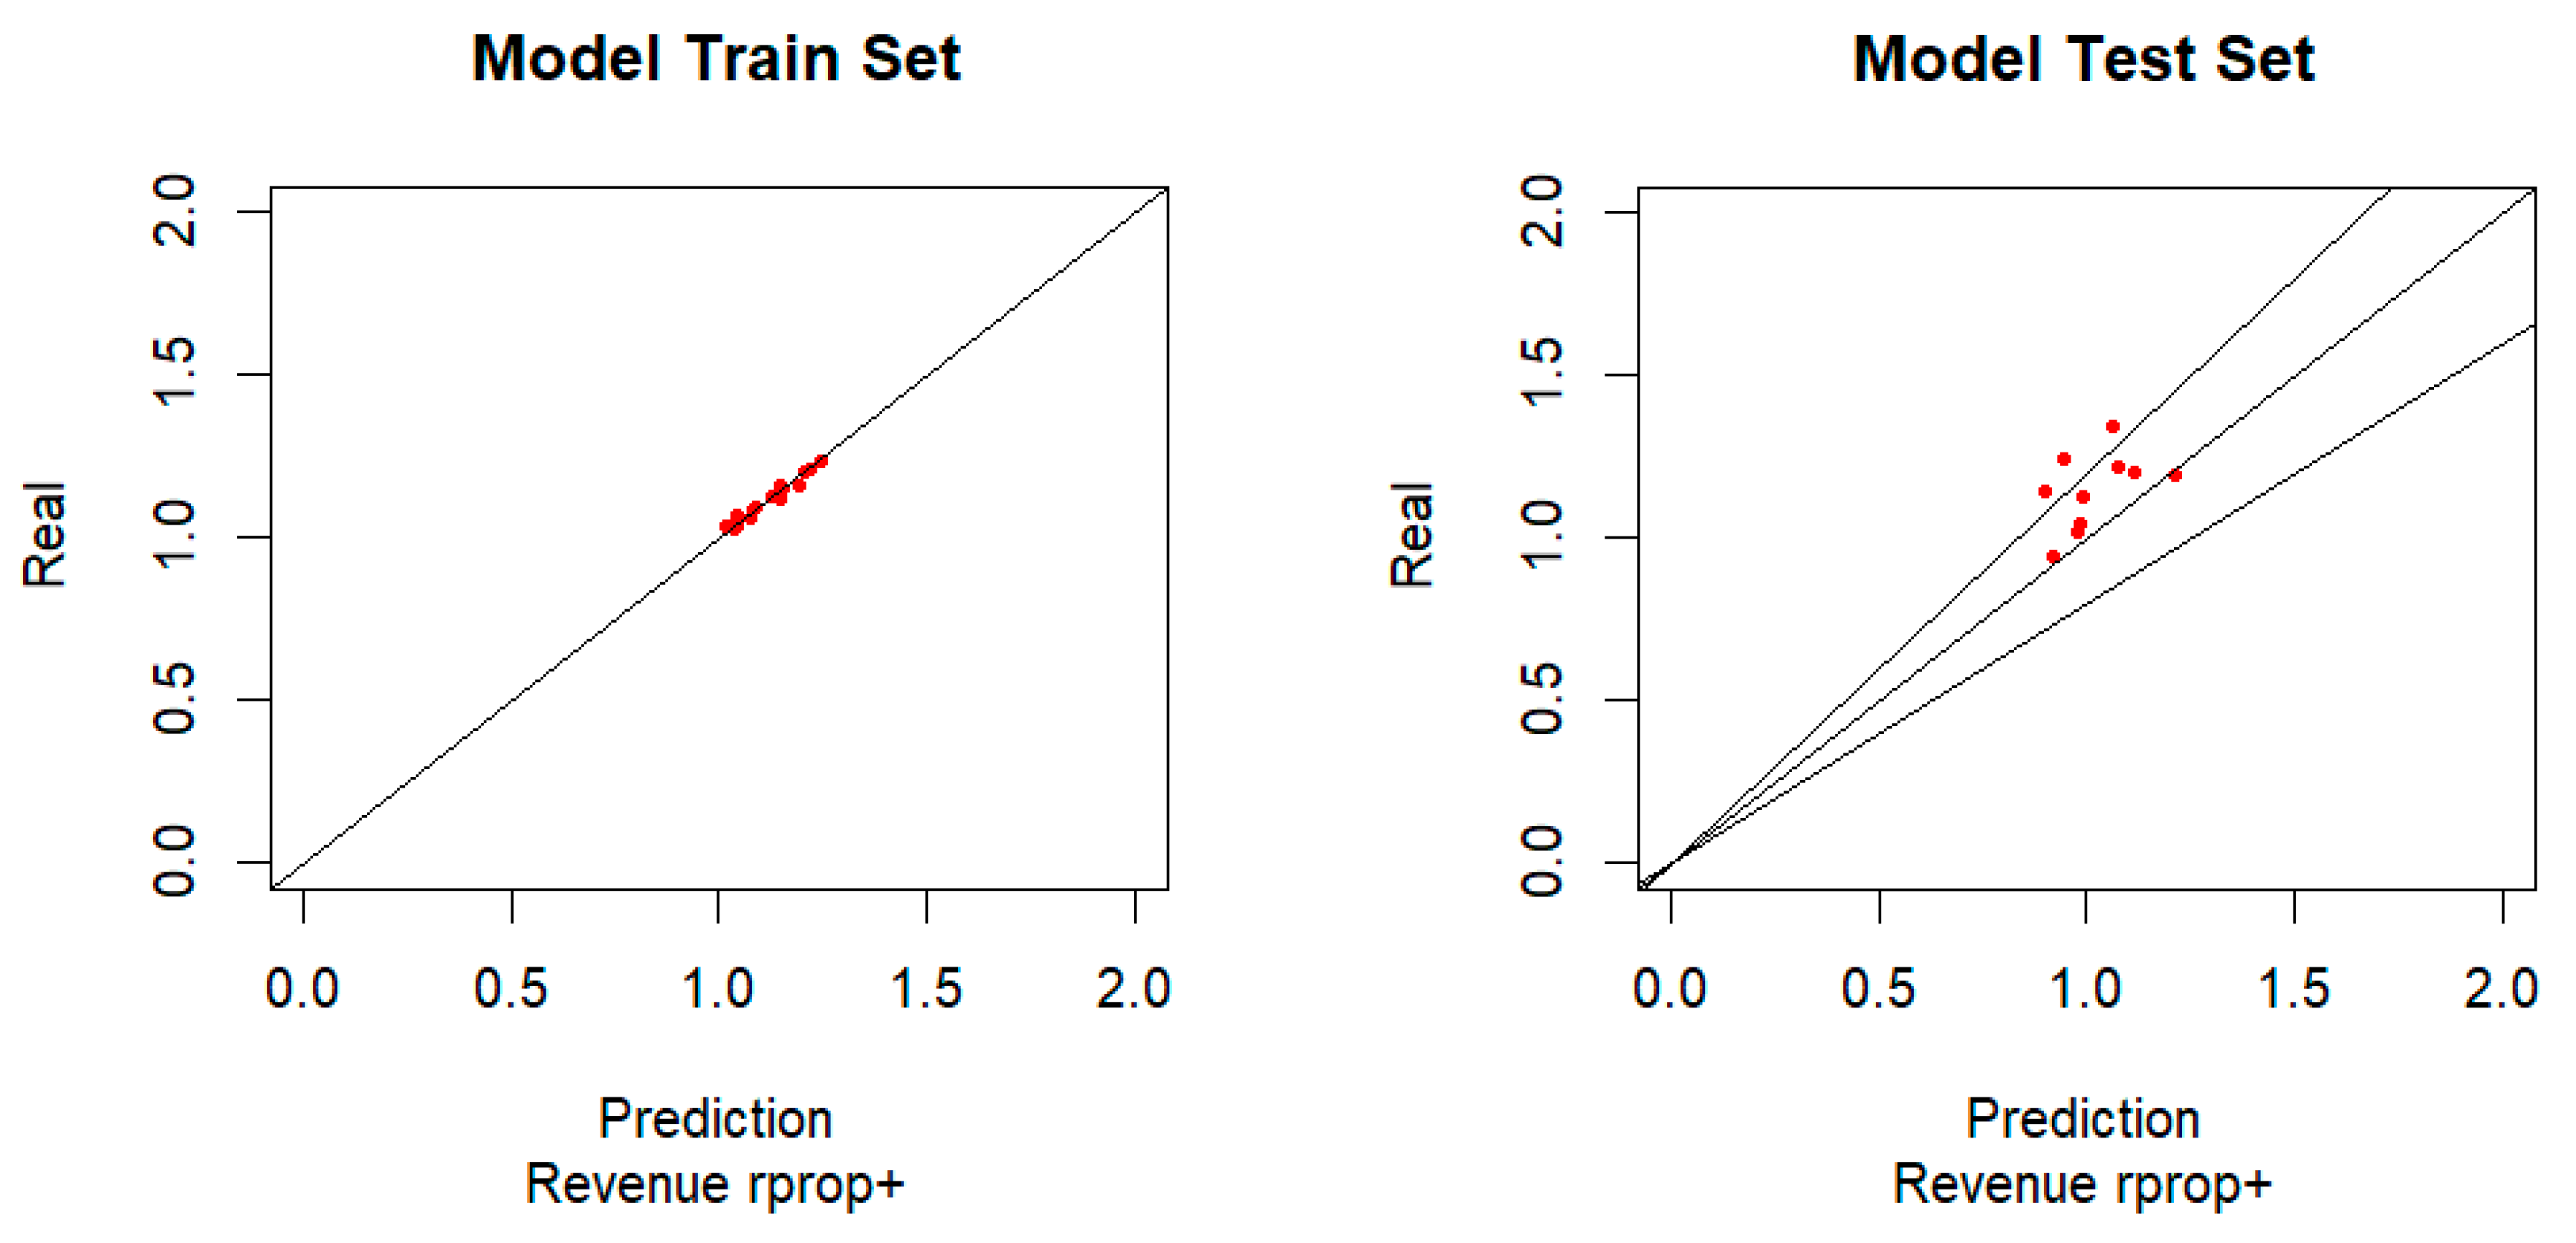
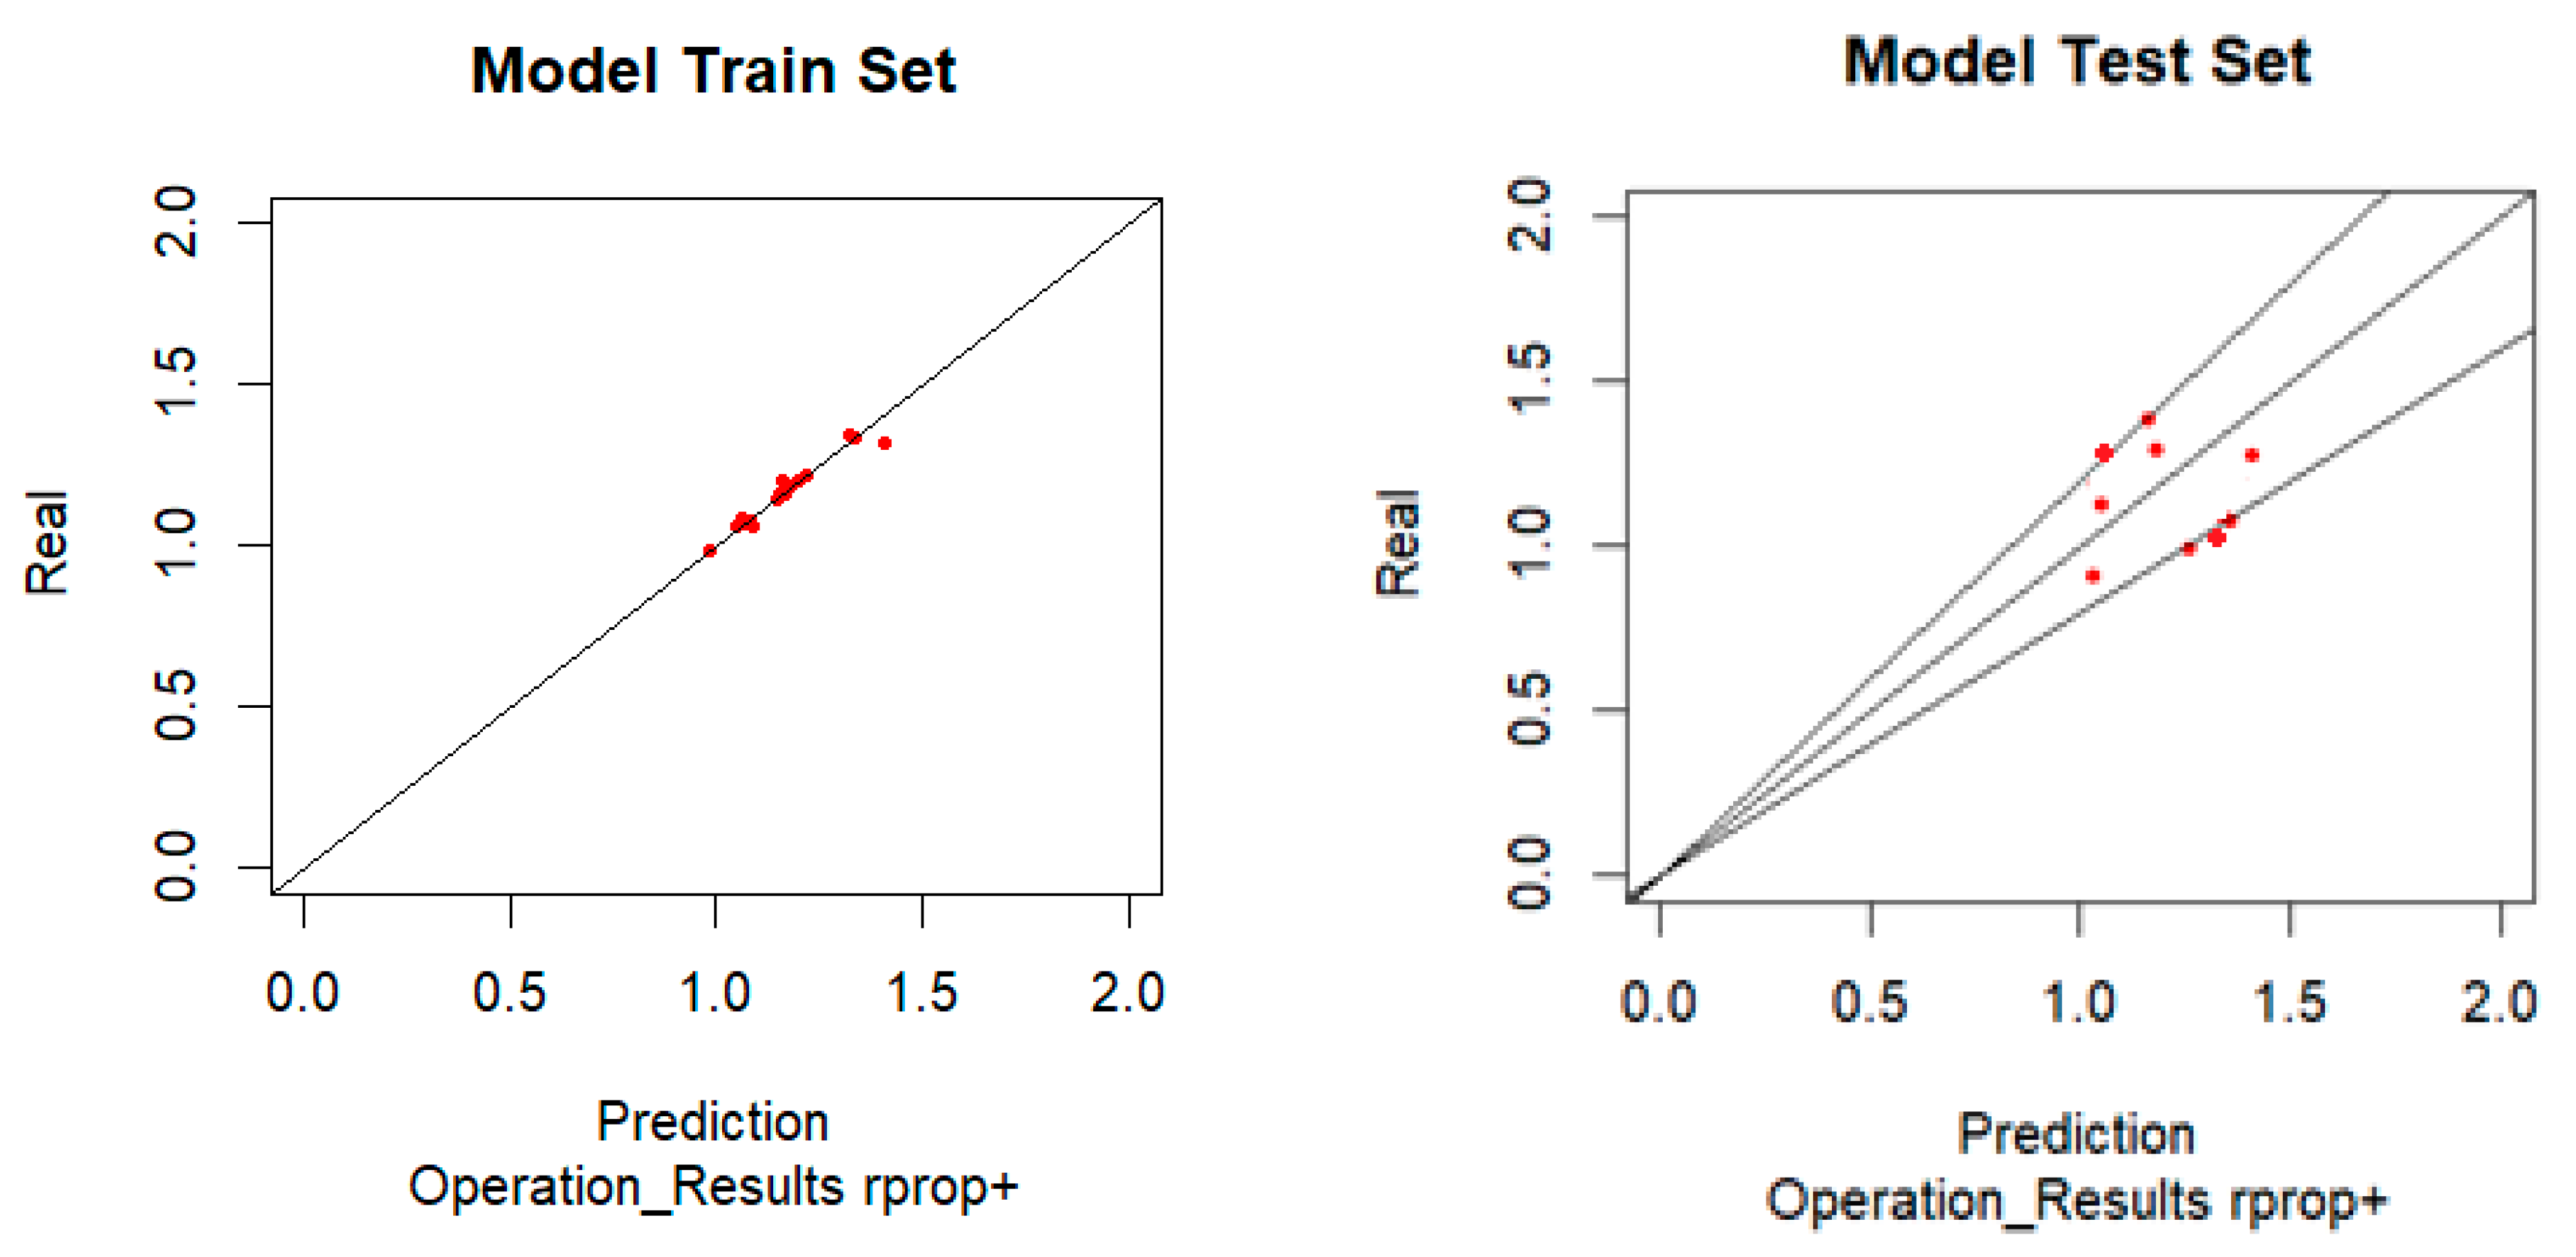
3.4. Positive Resilient Algorithm
The positive resilient algorithm is a variant of the backpropagation algorithm. This algorithm uses the gradient sign to choose the direction of weight adjustment. Therefore, one tends to eliminate the negative effects of the magnitude of the partial derivatives. In the case of the positive resilient algorithm, the weights are only adapted if the sign of the partial derivatives is positive. The graphical evaluation and performance indicators are presented in the same way as described for the backpropagation algorithm (
Figure 2).
Table 2 shows information regarding what can be seen in the previous graphs. The test model has three points outside the two lines that limit the error to 20%, although they are very close to this line. This means that 70% of the samples have an error of less than 20% in the revenue forecast.
With the positive resilient algorithm, the results are somewhat better than those with the backpropagation algorithm. With an RMSRE of 17%, an RMAE of 13.5%, 30% of the sample model with an error less than 5%, and 70% of the samples with an error less than 20%, one can consider a reasonable modeling performance.
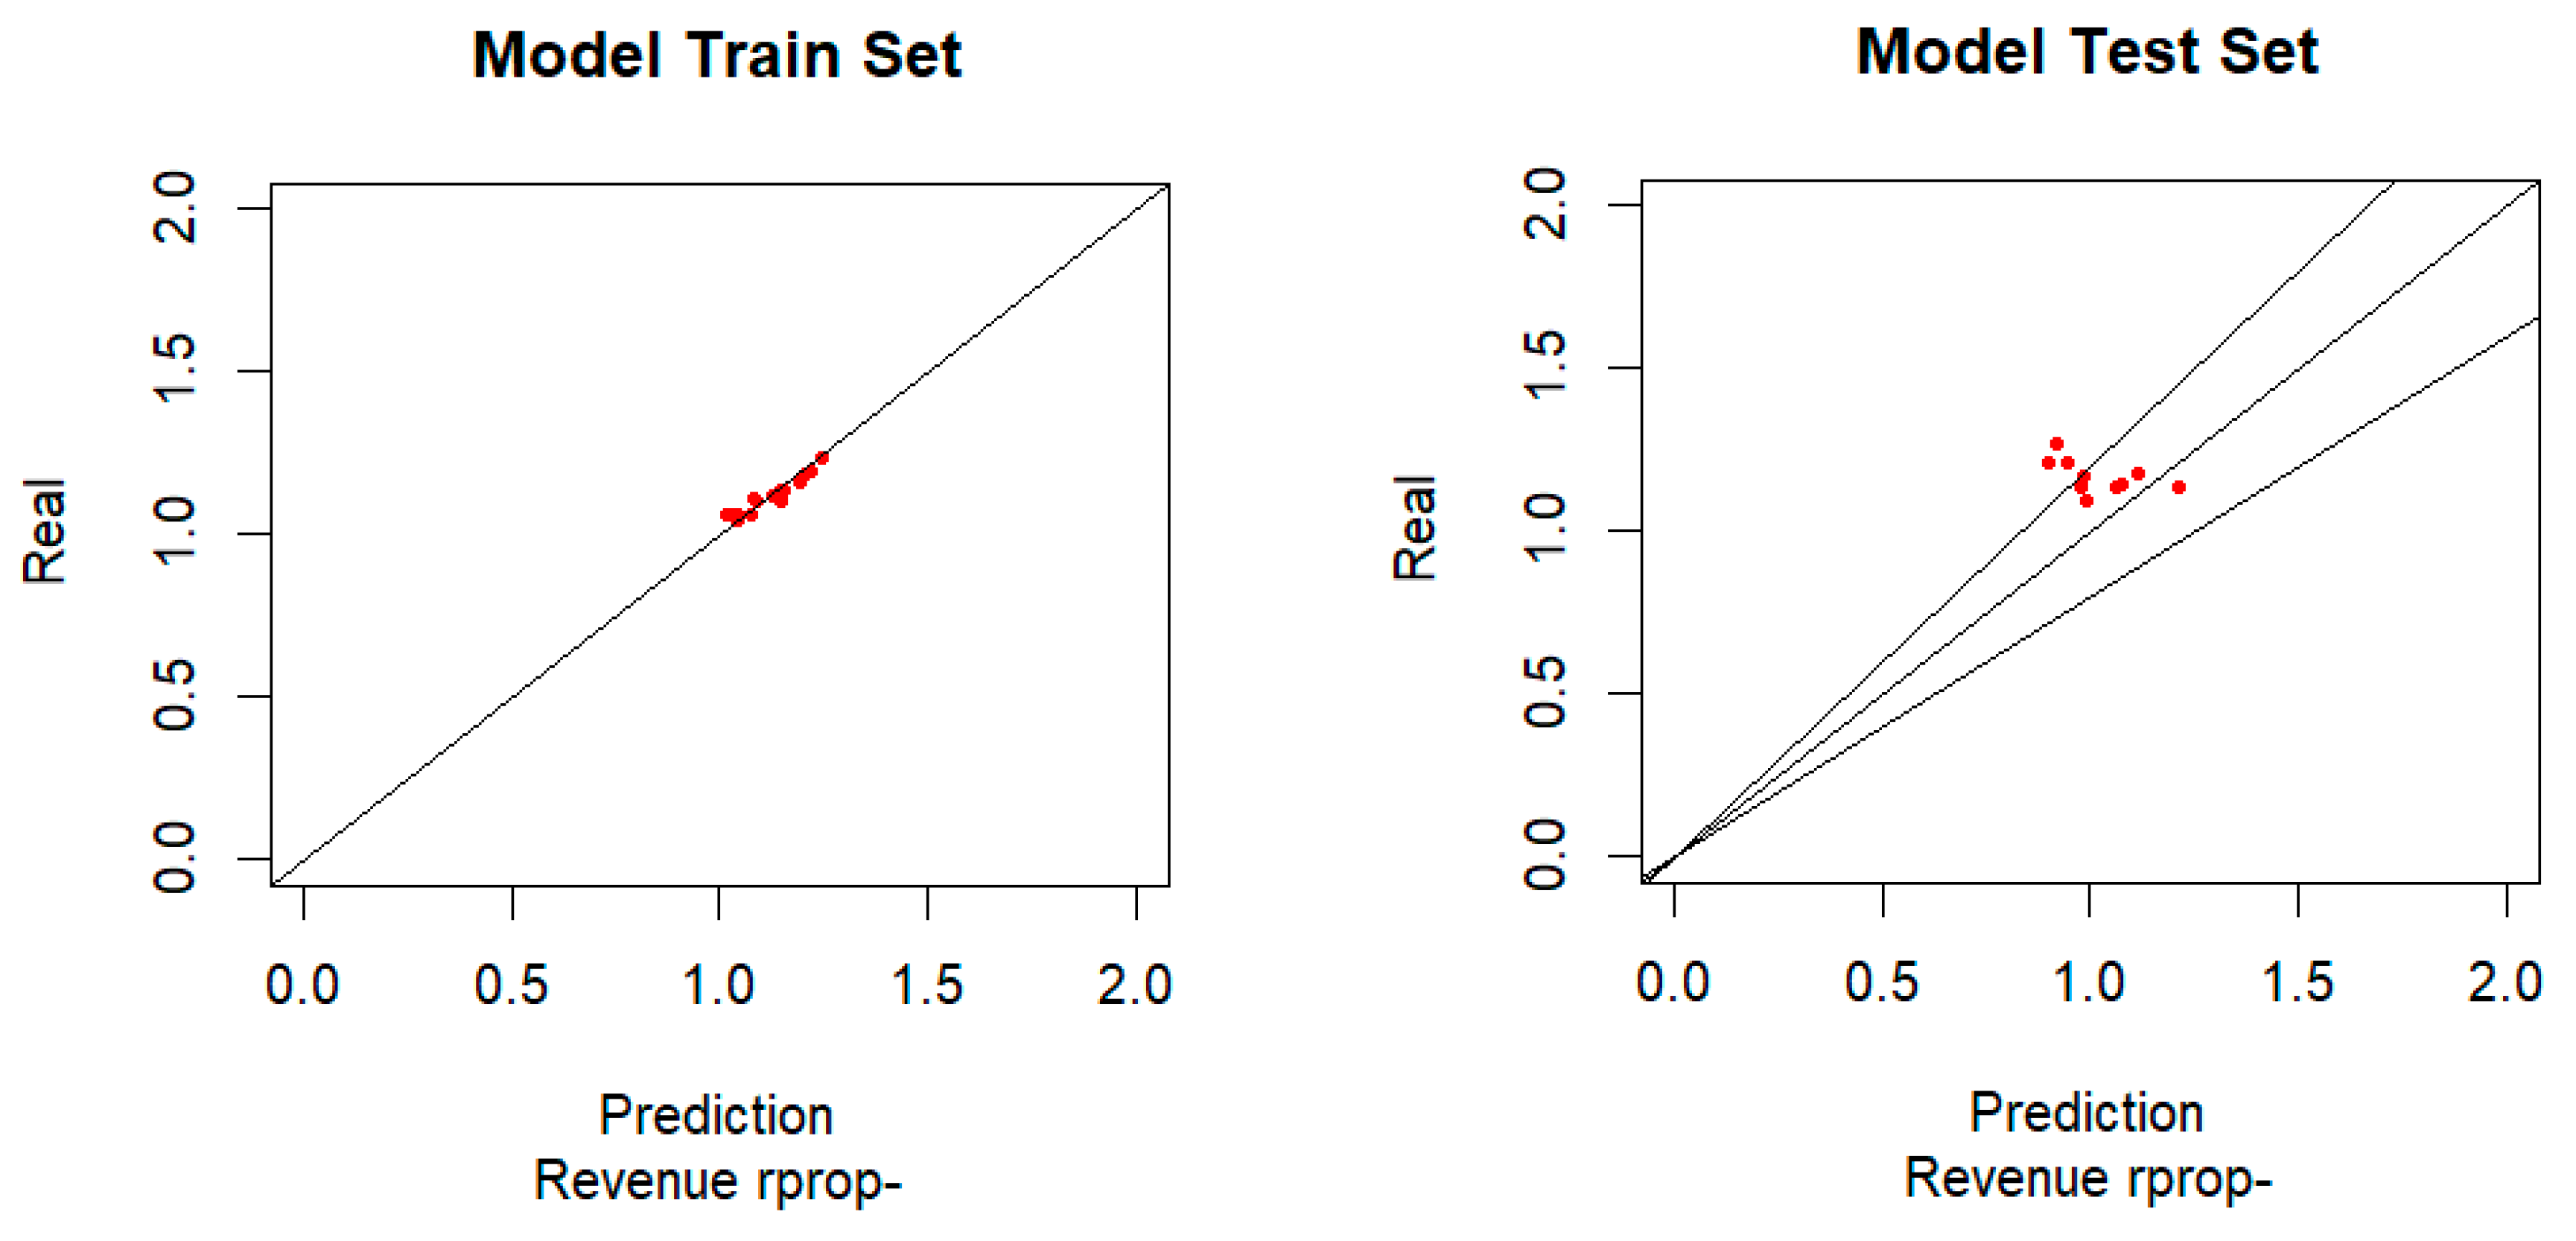
3.5. Negative Resilient Backpropagation Algorithm
Analogously to the positive resilient algorithm, the negative resilient algorithm is also a variant of the backpropagation algorithm. However, in relation to the positive resilient algorithm, the weights are only adjusted if the partial derivatives are negative, as shown in
Figure 3.
As can be seen, the test model has three points outside the two lines that limit the error to 20%, although they are very close to this line. This means that 70% of the samples have an error of less than 20% in the revenue forecast (
Table 3).
With 70% of the model samples with an error less than 20% and 30% of the model sample with an error greater than 25%, the RProp− algorithm is a little less accurate than the RProp+ algorithm, although one can consider a reasonable modeling performance.
3.6. Operating Results
When data relating to the strategies used are applied to forecast sales (in this case, the forecast focuses on operating results), it is expected that the forecast error will be greater in this case than in sales. This expectation is related to the fact that operating results depend directly on sales but not solely on them. Therefore, the addition of some entropy to the system to be modeled is expected. The graphical evaluation can be carried out in the same way as for sales, that is, by checking the position of the test set samples in relation to the diagonal lines, which allows the visualization of the admissible prediction zone in relation to reality.
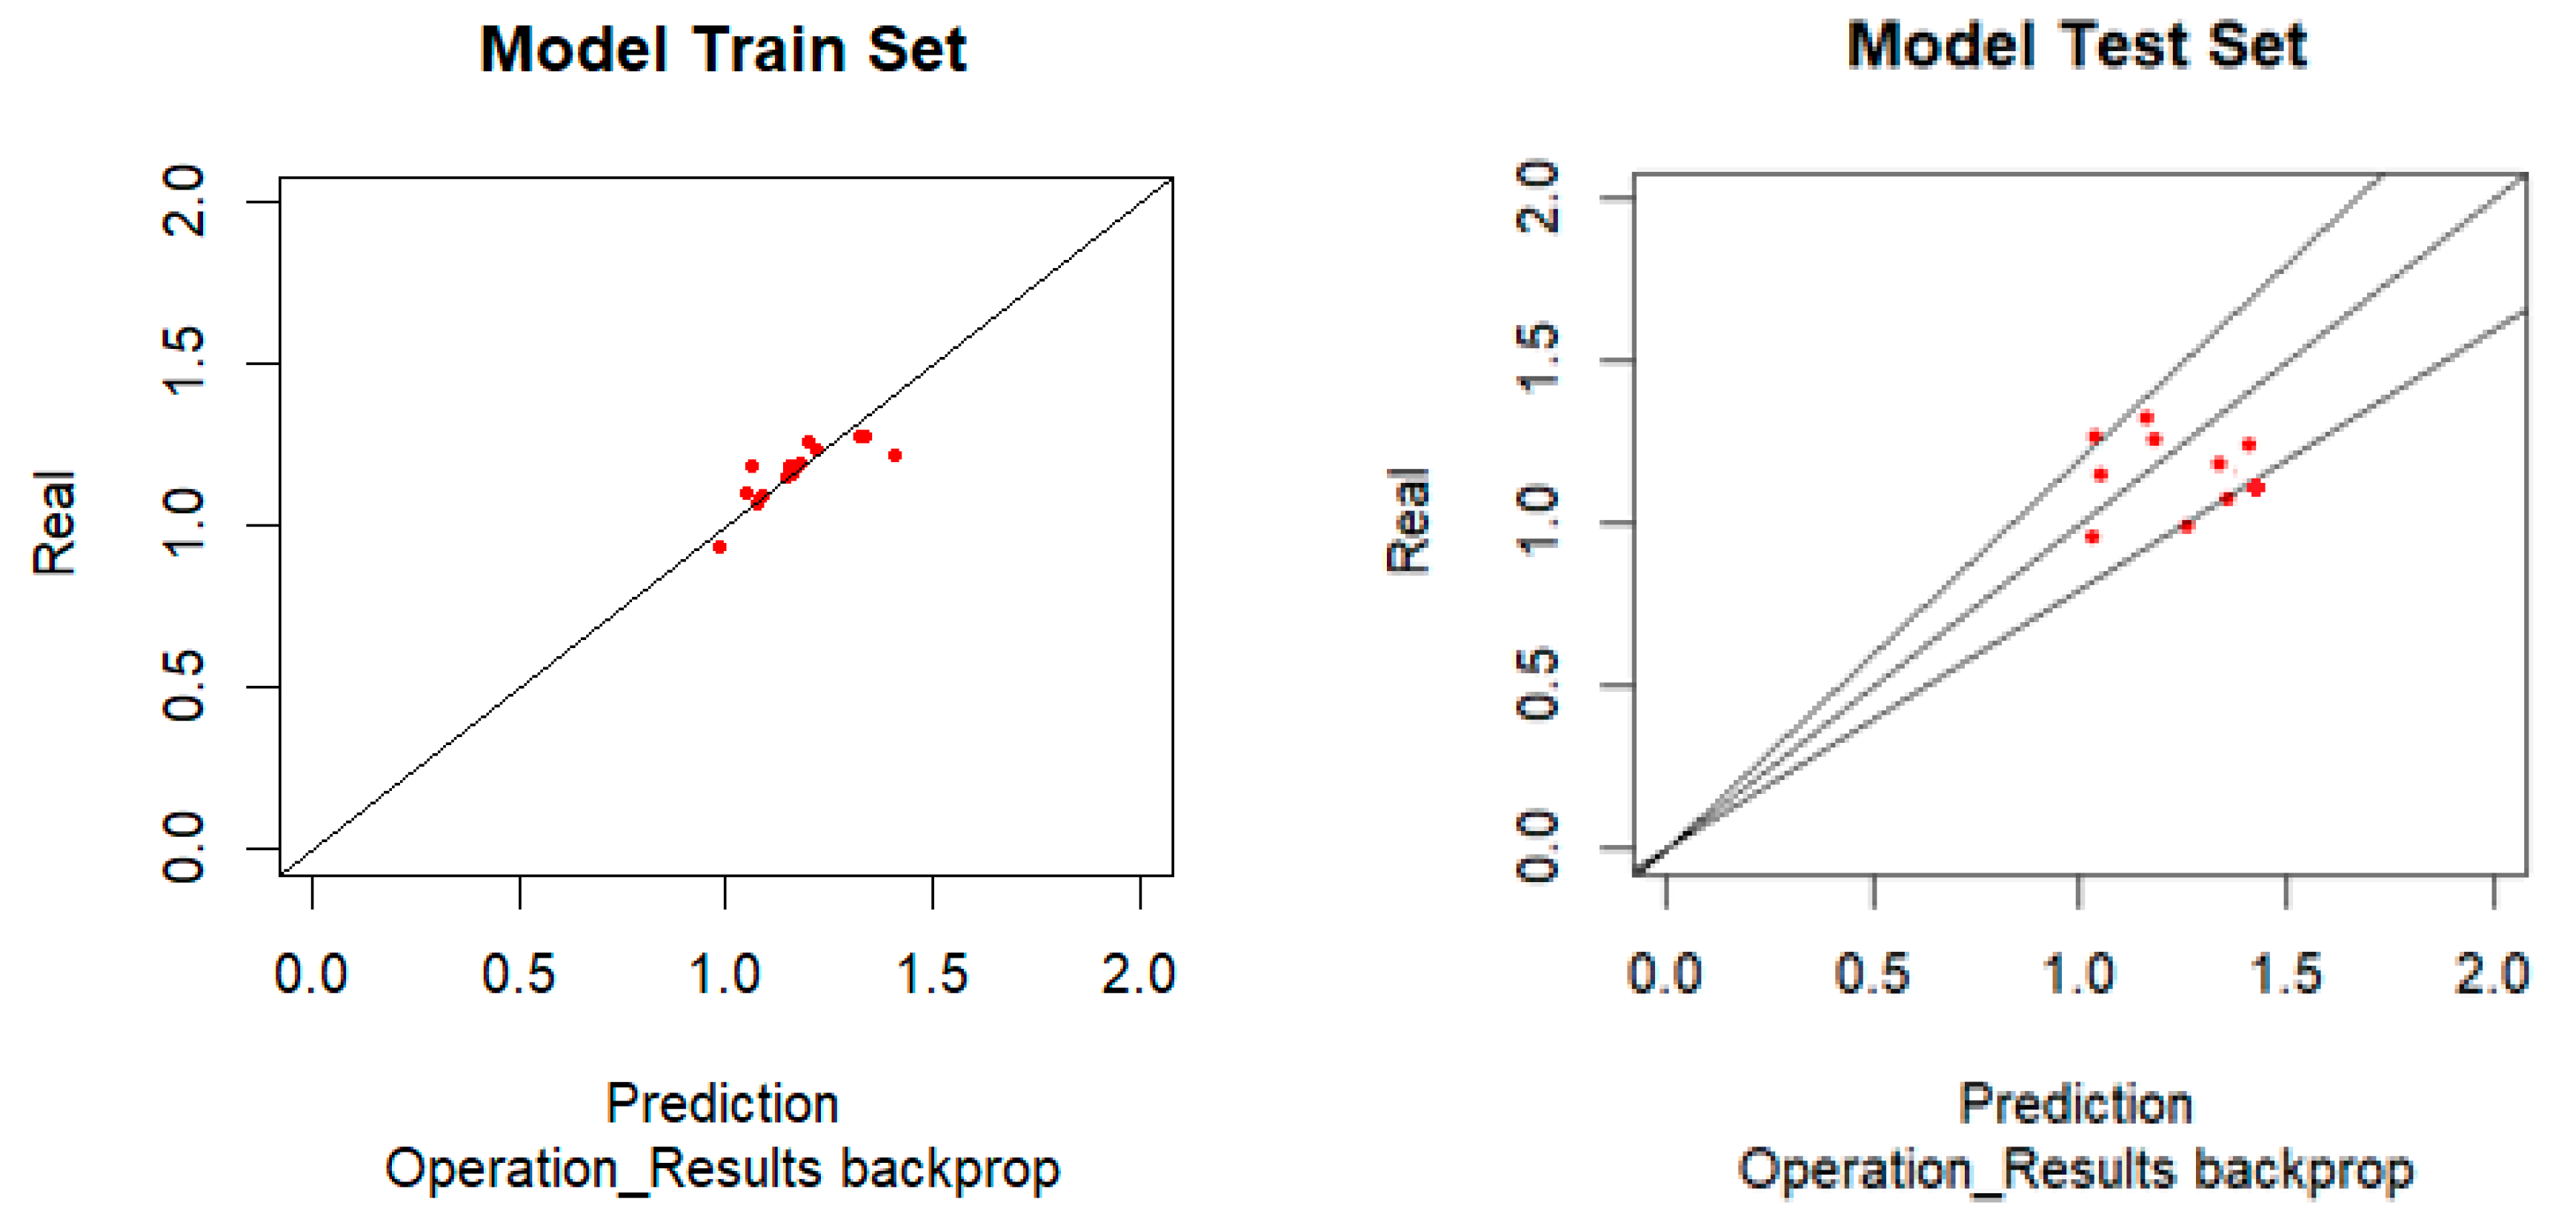
3.7. Backpropagation Algorithm
Using the same sales data processing methodology, the backpropagation algorithm is applied to the training set to train the ANN. Then, the resulting ANN is applied to the test set without adapting the weights by just correlating the outputs with the real results and thus quantifying the prediction error from the application of strategies to obtain the operating results (
Figure 4).
In
Table 4, the test model has four points outside the two lines that limit the error to 20%, although they are very close to this line. This means that 60% of the samples have an error of less than 20% in the revenue forecast.
With 60% of the samples having less than 20% error and 80% of the samples having an error below 25%, with an RMSRE of 18.9% and an RMAE of 17.5%, one can infer that the existing errors are not very distant from the “20%” line. One can consider reasonable modeling for the operating results with a backpropagation algorithm. With 31.2% of the model samples having an error greater than 5%, one can consider that the model of the training set is reasonable but not excellent.
3.8. Positive Resilient Algorithm
Also, with the data of the operational results, the performance of the ANN processed with the positive resilient algorithm is verified, linking the values of the outputs with the expected values of the samples (
Figure 5).
As can be seen in
Table 5, the test model has five points outside the two lines that limit the error to 20%, although they are very close to this line. This means that 50% of the samples have an error of less than 20% in the revenue forecast.
Inversely to what happened in the modeling of the operating results, the RProp+ algorithm is worse than the backpropagation algorithm for modeling operational results. Only 50% of the model samples have an error less than 20%, although 80% of the model samples have an error less than 25%. Both RMSRE and RMAE have a value less than 20%.
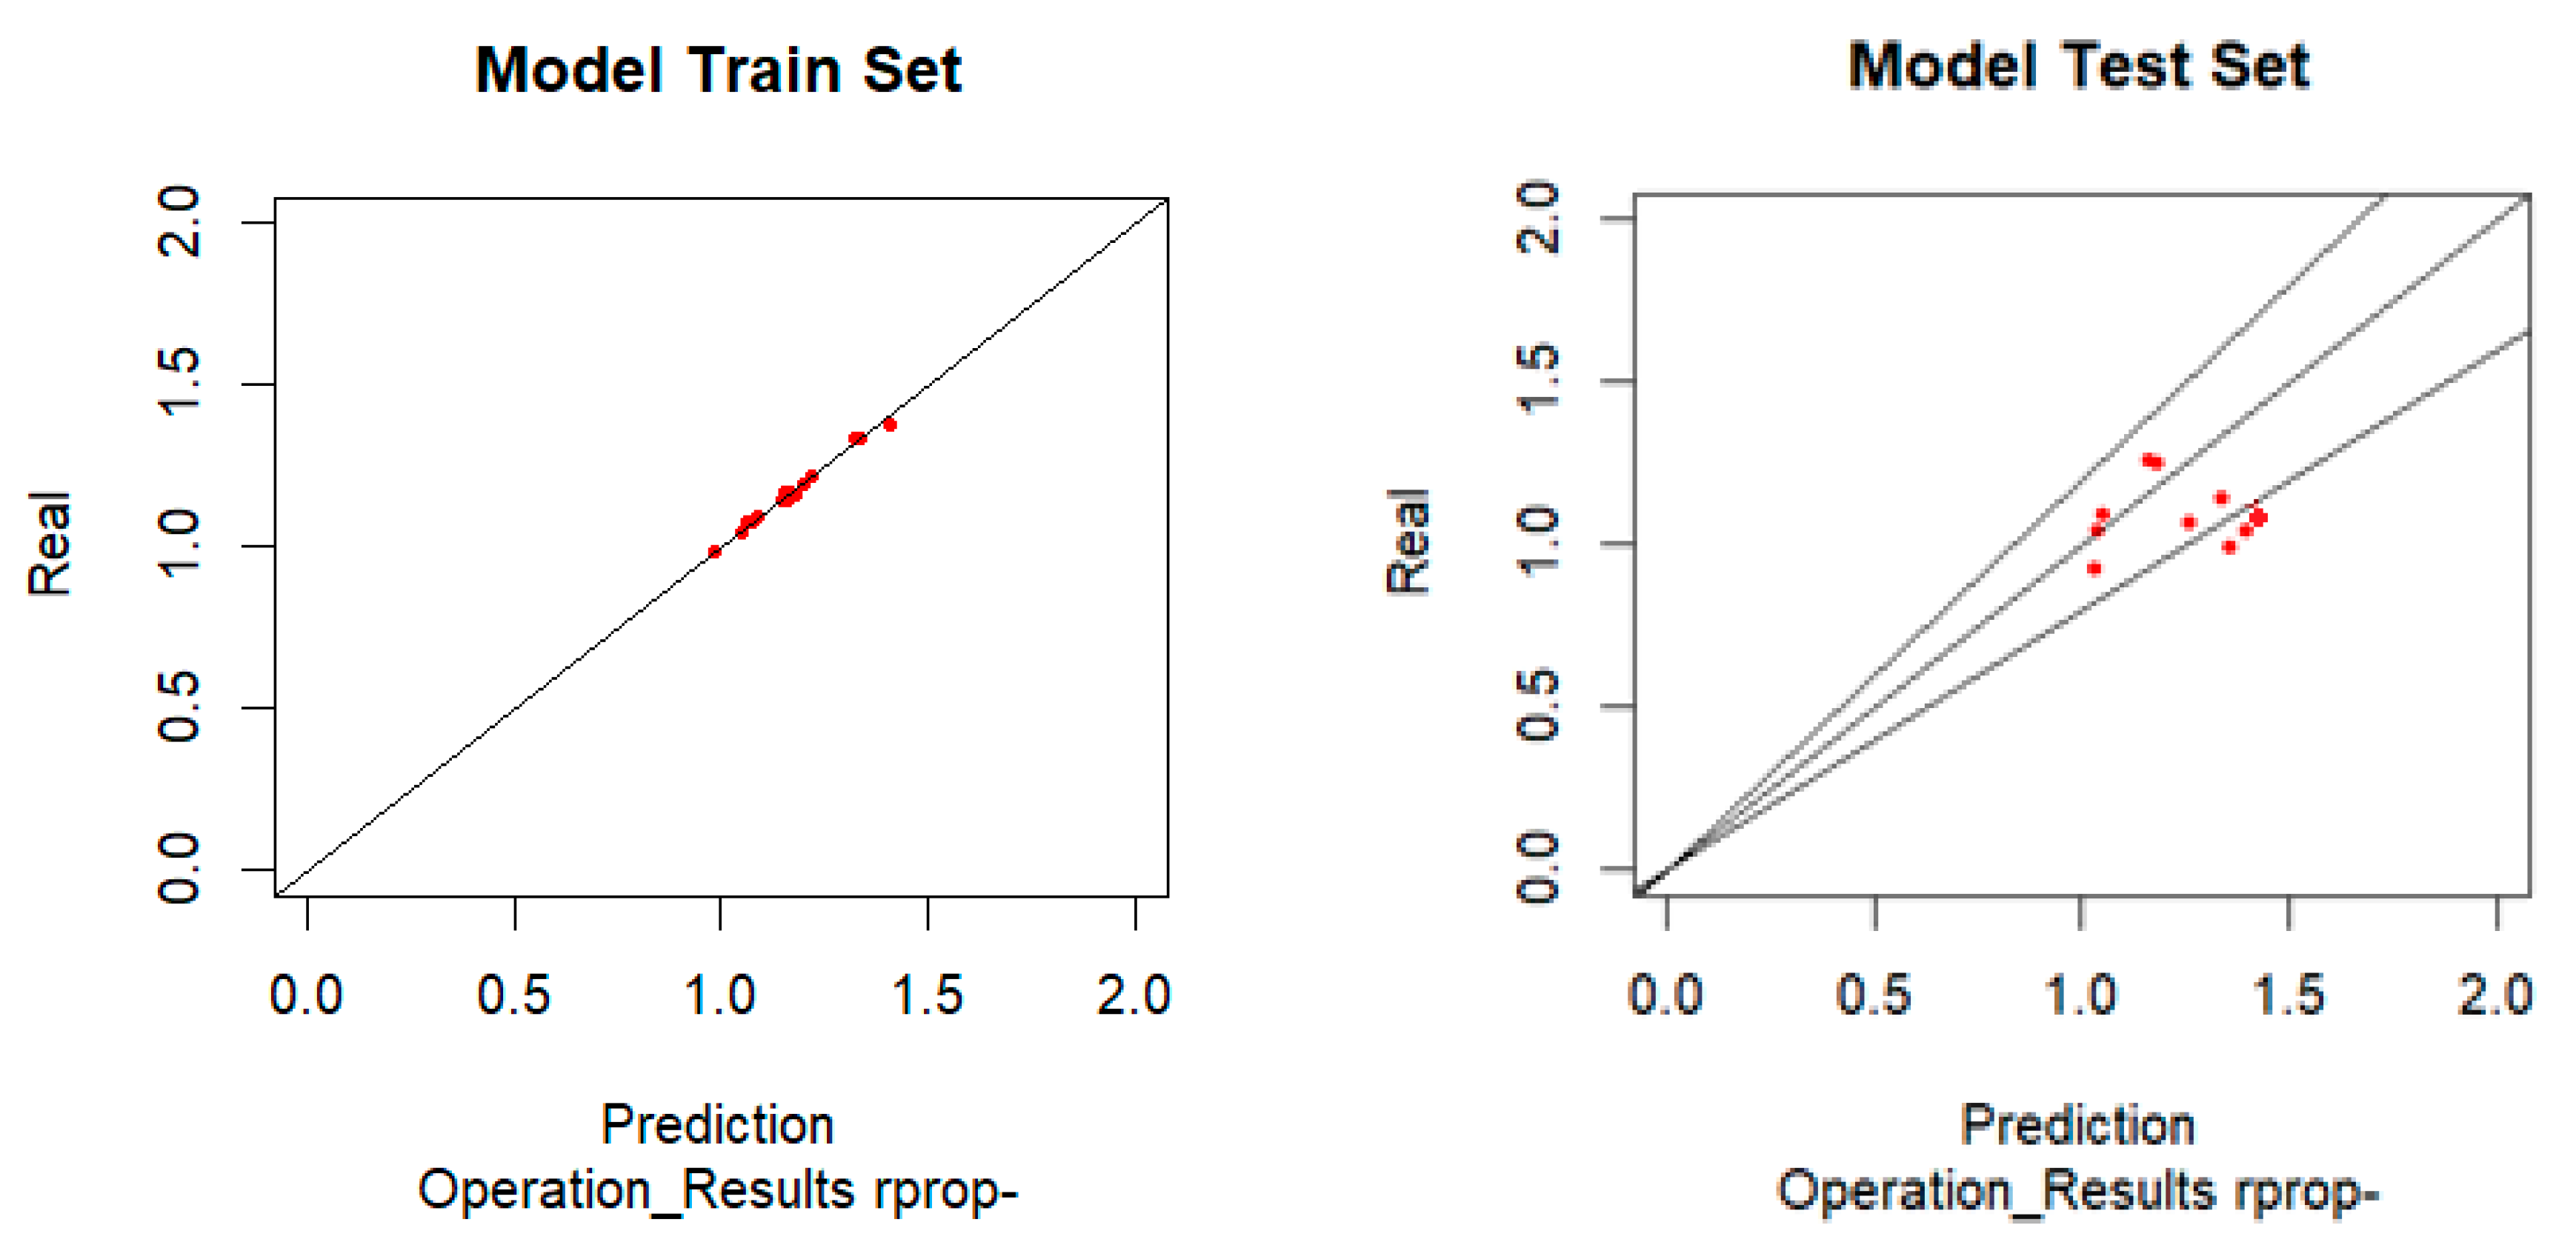
3.9. Negative Resilient Algorithm
Using the negative resilient algorithm, it is possible to evaluate the system’s performance in predicting operational results by applying the strategies to the ANN inputs (
Figure 6).
For the forecast of operating results with a negative resilient algorithm, the test model has three points outside the two lines that limit the error to 20%, although they are very close to this line (
Table 6). This means that 70% of the samples have an error of less than 20% in the revenue forecast.
One can consider that the RProp− algorithm has reasonable performance once 70% of the sample model has an error less than 20%. The RMSRE is 20.5%, and the RMAE is 16.9%.
3.10. Set of 100 Experiments
The following results were obtained by evaluating 600 modeling experiments: 100 experiments for each par (financial result; algorithm). The average result for the samples is within a certain error margin (5%, 10%, 20%, and 25%) (
Table 7). This should demonstrate the stability of the method when considering the performance evaluation.
The evaluation of the performance is demonstrated in
Table 7. The model achieves an average performance of about 90% for sales and more than 80% for operating results, if considering an error lower than 25%. Even if one considers an error within 20%, for these financial results, the performance is more than reasonable.
4. Discussion
Further development of the proposed modeling method demands an understanding of the possible problems associated with the data used. It is accepted that data with better quality will have better results in the final model.
The first issue that should be taken into consideration is that, though the financial results were obtained through a specialized database, they use the official results presented to the governmental institutions. It should be remembered that the survey targeted small and medium enterprises and that the real results could differ from the presented ones, although it is believed that differences, if any, should be small.
The second issue is that the survey was responded to by different people from different organizations, and although the data were processed to minimize the different values adjacent to the behavior and beliefs of management, there is always the possibility that some answers have induced some noise in the model.
Sales model results show more than 90% of the samples with an error within 20% and about 96% of the samples if one considers an error less than 25% for both the RProp algorithms. It is believed that this is a good indicator for a possible model of the environment with a good level of precision.
The operating results model accounts for 62.4% to 77.1% of the samples with an error margin less than 20%. Moreover, 74.1% to 87.1% of the samples had less than 25% error. These results indicate an acceptable level of success.
Although the results are promising, managers should not forget that the dynamism of the market presents numerous challenges to strategic managers. It is important to understand this dynamism and how it is influenced before strategic plans are developed (
Parnell 2014).
There are limitations, such as variables extrinsic to the application of strategies, that can have a significant impact. For example, a strategic action in an environment of economic growth will have a different impact than the same strategic action applied in an environment of economic recession. Therefore, modeling must be in accordance with the economic environment in which organizations operate.
Another limitation is associated with neural networks. Modeling through neural networks only allows the results to be modeled in the interval to which the data of the training set belongs. Therefore, the further the interval of the training dataset from the data that is intended to be predicted, the higher the error rate is expected to be.
The fact that the strategies used in the study are generic does not imply specific knowledge about the implementation process, that is, of the resources spent to implement them. Therefore, it is not possible to know exactly the return of the implementation of such a strategy. If strategic implementation is inefficient, extra costs may be produced, though not induced by the model used.
5. Conclusions
According to the results presented, it is possible to use ANNs to model strategic environments, allowing precision in the prediction of sales and operating results using particular strategies.
Sales model results show more than 90% of the samples with an error within 20% and about 96% of the samples if one considers an error less than 25% for both the RProp algorithms. It is believed that this is a good indicator for a possible model of the environment with a good level of precision.
The operating results model accounts for 62.4% to 77.1% of the samples, with an error margin less than 20%. Moreover, 74.1% to 87.1% of the samples have less than 25% error. These results indicate an acceptable level of success.
Although the results are promising, managers should not forget that the dynamism of the market presents numerous challenges to strategic managers. The results of this research are in line with those of other authors, such as
Parnell (
2014).
Therefore, the conclusion about the possibility of modeling the strategic environment to predict the impact of particular strategies applied by organizations on financial performance is favorable.


 ,
, 


